Article

Sub-Pilot-Scale and Bench-Scale Reactor Tests and Thermodynamic Integrated Process Analysis of Production of H2 from Woody Biomass via Chemical Looping

1
U.S. Department of Energy, National Energy Technology Laboratory, 3610 Collins Ferry Road, P.O. Box 880, Morgantown, WV 26507-0880, USA
2
Leidos Research and Support Team, 3610 Collins Ferry Road, Morgantown, WV 26507-0880, USA
*
Author to whom correspondence should be addressed.
Biomass 2025, 5(2), 30; https://doi.org/10.3390/biomass5020030
Submission received: 17 March 2025 / Revised: 7 May 2025 / Accepted: 15 May 2025 / Published: 20 May 2025

Abstract

:

Highlights

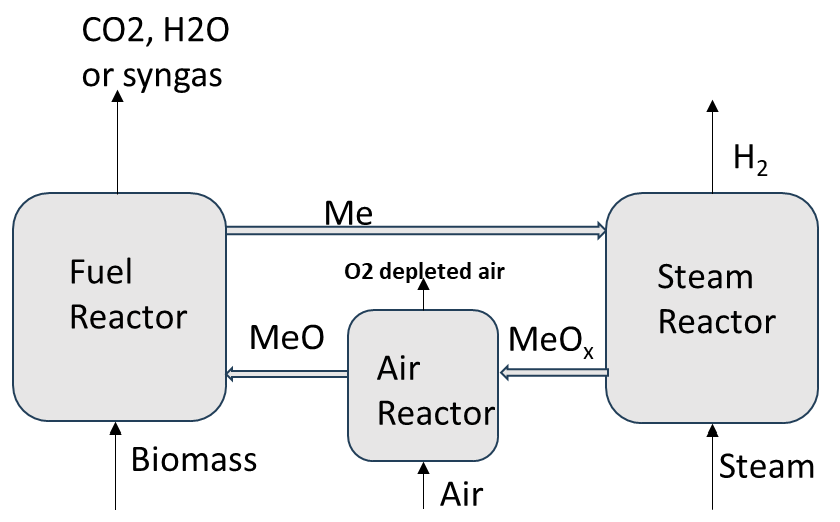
  • The conversion of biomass to H2 via both three-reactor and two-reactor approaches with CaFe2O4.
  • Thermodynamic integrated process assessments showed H2 yield advantages over baseline.
  • High conversion (>75%) rates of steam to hydrogen were demonstrated in the three-reactor approach.
  • A 25-cycle test of H2 production with steam/reduced CaFe2O4 showed a stable performance both at ambient pressure and high pressure (6.5 atm).
  • Sub-pilot-scale tests showed promising H2 production data.

Simple Summary

H2 is used as a fuel and has many applications in industry, so it is necessary to develop low-cost H2 production technologies with minimal environmental impact. Fuel gasification with air/steam, which requires an expensive air separation unit with multiple processing steps, is currently used for H2 production. Chemical looping technology that uses oxygen from an oxygen carrier such as metal oxide for a reaction with fuel is reported in this work for H2 production from woody biomass, which has the potential to lower the cost of H2 production with minimal environmental impact. Multi-cycle tests showed very promising reactivity results. Experimentation at the sub-pilot scale demonstrated potential for scaling the technology and longevity potential of the carrier material. Case studies in a thermodynamic integrated process assessment showed that chemical looping concepts had more favorable outcomes for H2 production from biomass than a baseline steam gasification technology chosen for comparison.

Abstract

A thermodynamic integrated process assessment and experimental evaluation of the conversion of woody biomass to H2 using chemical looping approaches were explored in this work. Both a two- and three-reactor approach were evaluated for effectiveness with a CaFe2O4 oxygen carrier (OC). Experimental test campaigns consisted of semi-batch operations where a single reactor was loaded with a batch charge of the OC and fuel. Multi-reactor approaches were experimentally simulated by switching the gas atmosphere around the batch charge of the OC. The experiments showed that woody biomass was capable of reducing CaFe2O4, enabling the production of H2 from steam oxidation. High steam conversion rates to H2 of >75% were demonstrated. Reduced CaFe2O4 catalyzed tar cracking, multi-cycle tests showed stable reactivity, and sub-pilot-scale tests showed improved reactivity and H2 yield, accompanied by improved attrition resistance after over 30 cycles. The three-reactor configuration showed the highest potential for H2 yield between the case studies, while the two-reactor configuration had the lowest auxiliary feed requirement. Both approaches showed increased yields and lower utilities than the baseline steam gasification technology.

1. Introduction

H2 is used for many applications, such as in oil refineries, for ammonia and methanol production, and in fuel cells. Steam methane reforming and coal gasification are the main commercial methods for producing hydrogen, but these methods are energy-intensive and generate significant carbon emissions. We previously reported the production of H2 from coal via a cyclic chemical looping oxygen carrier process [1,2], which involved the initial reduction of an oxygen carrier (metal oxide) with coal, partial oxidation of the reduced oxygen carrier with steam to produce H2, and full oxidation for the next reaction cycle while generating heat.
Hydrogen from biomass (waste wood products) is a promising avenue for the production of this commodity, with lower CO2 emissions than from current processes using natural gas or coal. The use of biomass coupled with carbon capture can lead to H2 generation with negative CO2 emissions. Osman et al. discussed the carbon biomass cycle in their review article on biomass use strategies for biofuel, bio-hydrogen, and biomass fueled electricity generation, noting that accounting for carbon emissions should include sourcing, reforestation practices, and direct use [3]. Gasification is the primary process for the production of H2 from biomass. A review of the classification and conversion of biomass was reported by Tursi et al. [4]. Osman et al. noted some of the inherent challenges faced with biomass gasification [3], ranging from scalability, complexity, and product purity to yield challenges due to the formation of tars and their management. Gao et al. reported H2-rich syngas production from biomass gasification and reforming [5]. Dai et al. reported a review of the gasification of biomass [6]. McKendry reported an overview of energy production from biomass [7]. Gasification requires purified oxygen feed and converts biomass to synthesis gas via multiple steps, which include oxidation, pyrolysis, and reduction. The oxidation stage involves the combustion of biomass to generate heat. Woody biomass, which mainly consists of carbohydrates and lignin with higher molecular weights, breaks down into lighter-molecular-weight fractions, which include tar, H2, CO, CO2, CH4, and char, during the pyrolysis stage. Char is converted to CO and H2 in the subsequent reduction stage via reactions with CO2, O2, and H2O. Syngas production reactions are endothermic and require heat from the oxidation of biomass, which uses pure oxygen prepared by an expensive air separation process. The syngas is then converted to H2 and CO2 via a water–gas shift reaction followed by CO2 separation to produce pure H2. Some large-scale, direct fired, oxy-fueled, biomass gasification units have been reported by Thanapal et al. [8], Clarke-Energy [9], ReNet [10], IEA bio energy [11], Gussing renewable Energy [12], DRAX [13], and Worley et al. [14]. Other routes include indirect fired steam gasification, and some large-scale demonstration units have been reported by Spath et al. [15], Tremel et al. [16], and Thunman et al. [17].
Chemical looping gasification (CLG) has been reported for biomass gasification to produce syngas, where oxygen from an oxygen carrier (OC) is used for gasification and the reduced OC also works as a catalyst for enhanced gasification. Then, the reduced OC is oxidized with air. Ge et al. [18] used a hematite OC for the CLG of biomass char in a 25 KWth reactor. Xue et al. [19], Xu et al. [20], and Hua et al. [21] reported the CLG of biomass char with Fe/Ca-based oxygen carriers. Niu et al. [22] used Cu-Fe-based oxygen carriers for the CLG of biomass. Liu et al. [23] reported Ca2Fe2O5 oxygen carriers for CLG. CaO-based OCs were used by Udomsirichakorn et al. [24]. Thermodynamic analyses of CLG with biomass were reported by Wang et al. [25] and Huang et al. [26]. An ilmenite OC was tested for biomass CLG by Condori et al. [27]. Lui et al. reported CaO/Fe2O3 as an OC for the co-gasification of biomass and polyethylene [28]. CLG with an Fe-Ni bimetallic oxygen carrier in a 10 kWth fluid bed reactor was reported by Wei et al. [29]. Sozen et al. [30] reported an Fe2O3/Al2O3 oxygen carrier in 10 kWth fluid bed tests [31]. Park and Joshi et al. [32] explored biomass gasification in a sub-pilot dual-stage moving bed reducer unit using an iron oxide–titania OC. They demonstrated 600 h of operation converting different types of biomasses to syngas and noted tar conversion increases with the carrier material and partial char conversion in the reducing reactor. This demonstration shows the value of the reactor configuration and steam cofeeding for syngas quality. One of the limiting factors on syngas generation, tar conversion, and biomass char conversion can be linked to the OC used. OCs with increased syngas selectivity and elevated tar conversion rates would be of value for advancing these types of chemical looping concepts further.
A chemical looping (CL)-based three-reactor concept using oxygen carriers, similar to the concept we are reporting in this work, was reported with fuels such as coal and syngas for the production of H2. In this cyclic process, the oxygen carrier was reduced using the fuel, then the reduced oxygen carrier was partially oxidized with steam while generating H2. To close the cycle, air was used for the full oxidation of the oxygen carrier. Our previous works have reported H2 production with coal and a CaFe2O4-based oxygen carrier [1,2]. A review of CL-based H2 production processes was reported by Luo et al. [33]. An iron-based oxygen carrier for CL H2 production was reported by Hurst [34]. Tong et al. [35] reported CL H2 production from syngas in a 25 kWth reactor unit [36]. Aziz et al. [37] reported the process integration of CL H2 production with brown coal [38]. Riley et al. [39] reported an experimental and thermodynamic assessment of an integrated process for CL H2 production with natural gas. There are no studies reported on directly using woody biomass in a three-reactor process for H2 production, as depicted in a simplified diagram in Figure 1.
This process has many potential advantages over the biomass gasification route in generating H2, as it generates pure H2 without requiring many of the steps used in regular gasification, such as a fossil fuel-based heat source, air separation unit, full-scale water gas shift reactor train, and CO2/H2 separation unit.
In this process, woody biomass is used in the fuel reactor for the reduction of CaFe2O4. In the fuel reactor, biomass undergoes a pyrolysis reaction to form volatiles, as shown in reaction R1, a pathway reported by the works of Debiagi et al. [40] and Di Blasi [41].
Biomass → H2 + CO + CO2 + CH4 + H2O (g) + C2H6 + Tar + Char
Char is gasified with CO2 and H2O to form CO and H2, as shown in reactions R2 and R3.
C + CO2 ↔ 2CO ΔH = 172 kJ/mole
C + H2O ↔ CO + H2 ΔH = 131 kJ/mole
CaFe2O4 in the reduced form (Fe, FeO) also catalyzes the cracking of tar formed by the pyrolysis reaction R1 to lower-molecular-weight hydrocarbons and char as in R4, and these low-molecular-weight hydrocarbons may further react with CO2 and H2O to form CO + H2, as shown in reaction R5 and R6.
Tars → C + CnHm
CnHm + nH2O → n CO + (n + m/2) H2
CnHm + nCO2 → m/2H2O + 2nCO
In the fuel reactor, biomass volatiles, primary tar, decomposed tar hydrocarbons, and other gas-phase species can participate in the reduction of CaFe2O4. For example, if CnHm, where n = 1 and m = 4, the reaction would be represented as shown in R7.
CaFe2O4 + 3/4Cn=1Hm=4 → CaO + 2Fe + 1.5H2O + 0.75CO2
CnHm could be replaced with any gas-phase component that induces reduction. R7 is not exhaustive, but rather a single example of CnHm that could be expanded to number of permutations to cover the gas-phase reduction reactions. Our work on the reduction kinetics of CaFe2O4 with various primary gases discusses the reduction reactions in more depth, therefore, this topic can be referenced in work [42] and is not discussed in depth here.
Reduced CaFe2O4 is oxidized in the steam reactor to produce a partially oxidized form of CaFe2O4, as shown in reaction R8.
CaO + 2Fe + + 2.83H2O → 0.5Ca2Fe2O5 + 0.33Fe3O4 + 2.83H2
R8 is a lumped reaction that can be decoupled into its contributions for Ca2Fe2O5 and Fe3O4 [42].
Then, it is fully oxidized with air in the air reactor to form the original CaFe2O4 oxygen carrier. Both reactions R8 and R9 are exothermic.
0.5Ca2Fe2O5 + 0.33Fe3O4 + 0.08O2 → CaFe2O4
Reactions in the fuel reactor are endothermic, while the steam oxidation reaction is mildly exothermic. Air oxidation, which is exothermic, is necessary to maintain the heat required for the process. Using a three-reactor process combined with CO2 sequestration will make it possible to potentially achieve negative CO2 emissions when using renewable biomass fuels. If negative CO2 emissions are not required, the process can be operated without using the air oxidation reactor. It is also possible to combine the fuel and steam reactors, limiting the process to two reactors to obtain syngas that can be processed to obtain H2.
In this work, we report experimental data on H2 production by steam oxidation after the reduction of CaFe2O4 with biomass volatiles and char from three different types of woody biomasses. The effects of various reaction conditions, such as temperature, residence time, amount of biomass, and pressure, on H2 production rates were evaluated in a bench-scale flow reactor. Separate contributions from biomass volatiles and char to the reduction reaction were also evaluated. Sub-pilot-scale tests (2.5 kg) were conducted to demonstrate the feasibility of scaling the process. In addition, experiments were also conducted to demonstrate syngas production by combining the fuel reactor and steam reactor steps, which could be used for a two-reactor H2 or syngas production process. Thermodynamic integrated process simulations were conducted to understand the novelty, advantages, and limitations of the current process over the biomass steam gasification process for H2 production. We previously reported a similar chemical looping H2 production process using steam oxidation after the reduction of the oxygen carrier with coal [1,2] and methane [21] in the fuel reactor. The target of the current work was to experimentally demonstrate the application of CaFe2O4 in three- and two-reactor approaches for H2 production using biomass as the fuel source. The secondary target was to simulate the process concepts to better understand the H2 yield potential and other pertinent performance metrics as a means for comparison with current steam gasification approaches.

2. Materials and Methods

2.1. Materials

CaO (99%, Sigma-Aldrich, St. Louis, MO, USA) and Fe2O3 (99%) were used for the preparation of CaFe2O4. The powders were mixed, and enough water was added for granulation during mixing. The granules were calcined at 1000 °C for 6 h. The following three types of biomasses were used in this study: biomass D wood chips and biomass D wood pellets (biomass DP), biomass R wood chips, and biomass AWP wood pellets. The composition of these biomasses is listed in Table 1.

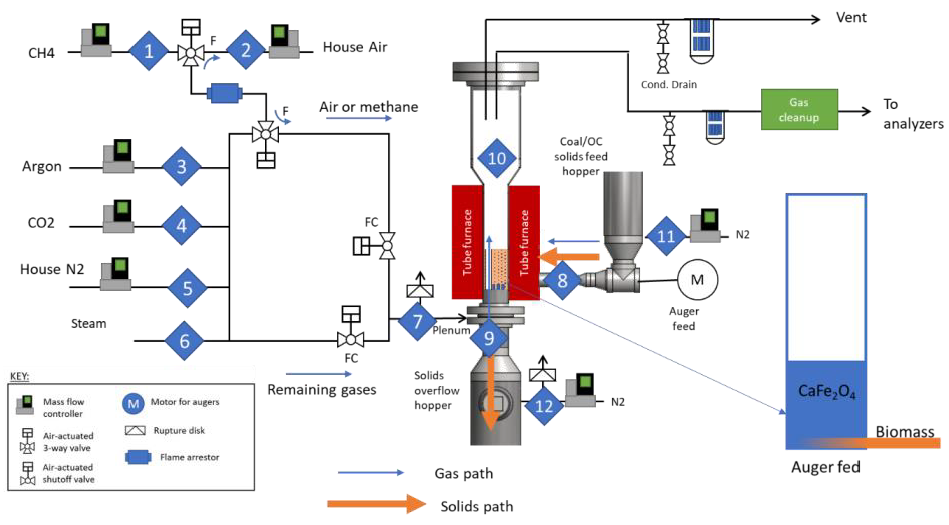
2.2. Bench-Scale Fixed-Bed Flow Reactor Studies

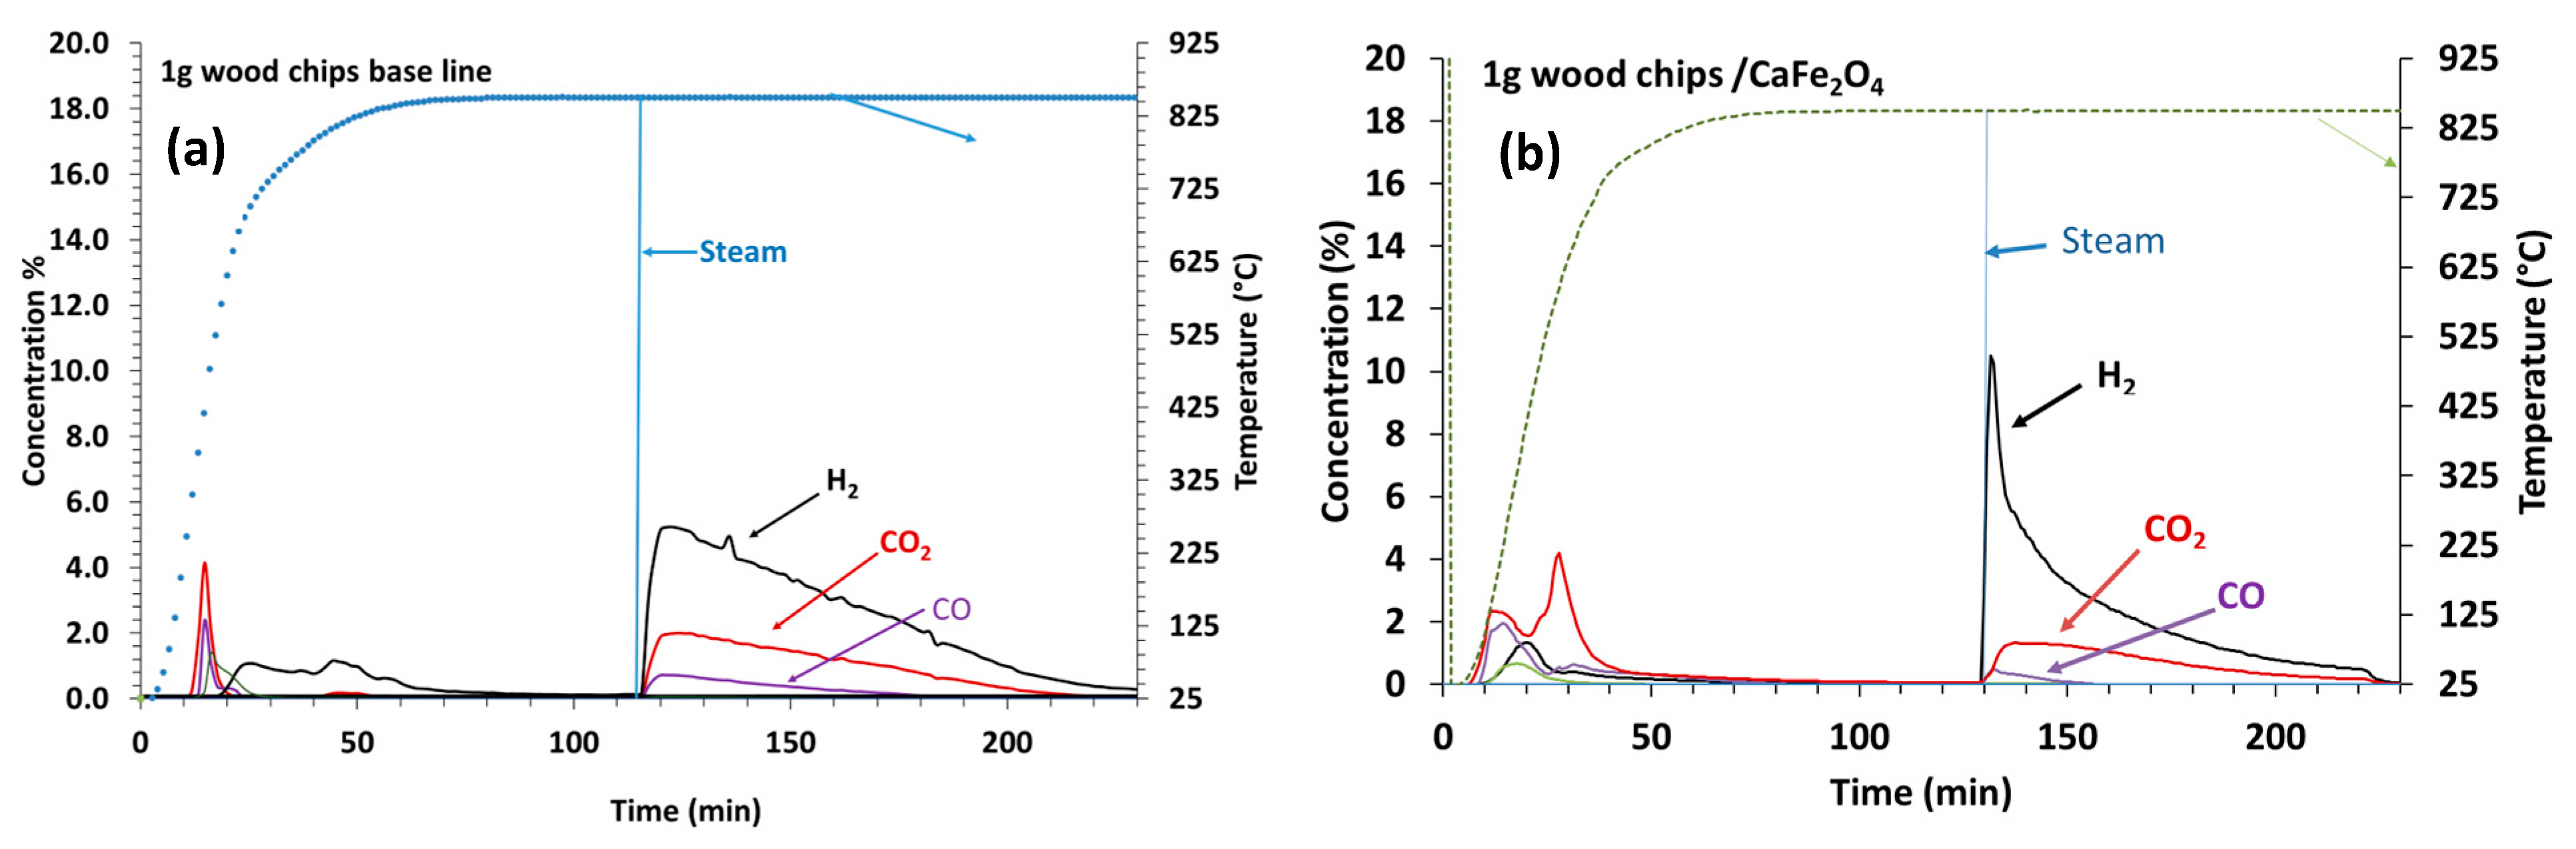
2.2.1. Tests with Woody Biomass with Gas Flow During Heating

The bench-scale reactor did not have a solid injection capability at reaction temperatures, so the solids had to be introduced at ambient temperature. Experiments with gas flow during heating were conducted to understand the reaction profile during the initial heating step, which simulated the fuel reactor, followed by steam oxidation at 850 °C and air oxidation. In this test series, not all volatiles generated at low temperatures would remain in the reactor for the reaction with CaFe2O4 at 850 °C, because gas flow was used during heating, but biomass char would primarily contribute to CaFe2O4 reduction. The particle size of the wood chips and wood pellets used for the reactor tests was typically in the range of 100–300 µm, and the oxygen carrier had a particle size range of 180–600 µm. Bench-scale fixed-bed flow reactor (Figure S1) tests were conducted with 9 g of CaFe2O4 and 1–3 g of biomass. The outlet gas compositions from the reactor were measured using a Prima BT mass spectrometer (MS). CaFe2O4 and biomass were mixed well and placed in the reactor. A cycle consisted of the following: heating the mixture in Ar at a flow rate of 0–200 cm3/min (0.2 L/min) from ambient to the reaction temperature (800–925 °C), maintaining isothermal conditions at 800–925 °C for 60 min, and introducing 17–25% steam/Ar until the H2 concentration was below 5000 ppm after reaching the maximum, followed by the introduction of 50% air/Ar.
During the cycle tests, the reactor was cooled to ambient temperature after each cycle and new biomass was added to the CaFe2O4 remaining in the reactor for the next cycle. For the high-pressure experiments, the reactor was pressurized to 6.5 atm before the temperature ramp and all three steps were continued at 6.5 atm.

2.2.2. Test with Both Biomass Volatiles and Char and CaFe2O4 Without Gas Flow During Temperature Ramp 850–925 °C with Steam Introduction at 850–925 °C

This test series without gas flow during heating was conducted to include all the biomass volatiles and char in the reaction with CaFe2O4. The biomass (3 g) and CaFe2O4 (9 g) were placed in the reactor and the reactor was filled with Ar. The Ar flow was then stopped. A reaction cycle consisted of following steps: heating the mixture of biomass and CaFe2O4 to the reaction temperature without any gas flow and maintaining isothermal conditions at the reaction temperature for 40 min, introducing Ar flow at 850 °C until all the gases from the reaction with CaFe2O4 were removed from the reactor, and exposing the sample to 17–25% steam/Ar for about 50 min at 850 °C, followed by 50% air. After each cycle, the reactor was cooled to ambient temperature, new biomass was added to the CaFe2O4 remaining in the reactor, and the cycles were continued.

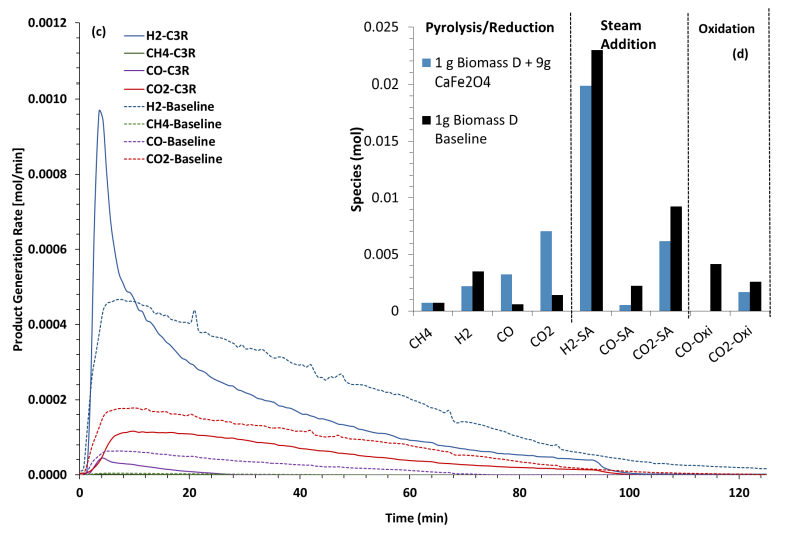
2.2.3. Tests with Biomass Volatiles and 9 g CaFe2O4

The reaction of only biomass volatiles (not char) with CaFe2O4 was investigated by separating the biomass and CaFe2O4 using quartz wool. The reactor set-up is shown in Figure S1b–d. In total, 9 g of CaFe2O4 was placed on the bottom of the reactor, quartz wool was placed on top of the CaFe2O4, and 3 g of biomass was placed at the top of the quartz wool. Argon was introduced to the reactor to remove all residual gases and blanket the sample in inert gas. After blanketing in inert gas, the reactor was switched to the bypass mode to halt gas flow into the chamber. The reactor was heated rapidly to the reaction temperature, 850 °C, in the bypass mode with no gas flow though the reactor bed, allowing the biomass volatiles to accumulate at the open gas volume above the quartz wool. Then, Ar was introduced to the reactor bed at 850 °C in the down flow mode, allowing the biomass vapor products to flow through the CaFe2O4 bed placed below the quartz wool. This enabled the ability to determine the reduction of CaFe2O4 with only biomass volatiles without involving char.

2.2.4. Bench-Scale Experimental Data on Syngas Production Simulating the Two-Reactor Process

In this test series, biomass (1 g) and CaFe2O4 (2 g) were placed in the reactor (Figure S1a) and the temperature ramp was conducted in Ar. The ratio of biomass to CaFe2O4 was selected based on experimental data to minimize the combustion reaction and maximize the gasification reaction. A reaction cycle consisted of following steps: heating the mixture of biomass and CaFe2O4 to the reaction temperature in Ar to 850 °C while introducing 20% steam/Ar at 300 °C during the temperature ramp and introducing 50% air at 850 °C after the gasification reaction was complete.

2.3. Tests in Sub-Pilot-Scale Reactor

The test campaign was conducted using NETL’s Solid Fuel Fluidized Bed Reactor (SFFBR) shown in Figure 2 The riser was 10.2 cm diameter steel with a bed height of 20.3 cm and a total height of 122 cm. Thermocouples were located throughout the height of the reactor, as shown in Figure 2, as well as at the gas entrance and exit streams. The gas inlet was controlled via Alicat mass flow controllers. Steam was generated by a Brooks steam generator with a capacity of 0–550 g/h. A stainless-steel bubble cap distributor was used during the test campaign. A combination of Setra and Rosemount pressure sensors were used to record the inlet pressure of the gas, the pressure drop across the distributor, the pressure drop across the bed, and the pressure drop across the filters. Ballston filters were used to capture fines from attrition and ash from the reacted biomass. The exit gas stream was sampled by a Thermo PrimaBT Mass spec. Two test configurations were explored in the unit. In configuration 1, batch loading similar to other experiments previously mentioned was used to introduce the fuel. A batch charge of 200 g of AWP biomass was loaded into the bed prior to heating. This was conducted with a bed of CaFe2O4 and with an inert bed of coarse sand to enable a baseline comparison. In configuration 2, an auger feeder was used to inject a charge that was preloaded into the hopper. The auger feed hopper was loaded with 250 g of AWP biomass. In total, 2.5 kg of CaFe2O4 bed material (or inert sand) was loaded into the system and heated to 850 °C under a flow of 18 SLPM (Standard Liters Per Minute, Tref = 25 °C, and Pref = 1 atm) nitrogen and 2 SLPM argon. An inert baseline was only conducted in configuration 1.
In configuration 2, once the bed reached the 850 °C setpoint, the auger feed mechanism was engaged, and fuel was fed into the bottom of the bed. The auger feed was engaged until no additional carbon products appeared in the effluent. Then, a 15 min buffer period was added prior to the steam addition step to let the gas signals settle and limit the steam interaction with residual carbon products. After the buffer period, the nitrogen flow was reduced to 12 SLPM and the steam feed was set to 30% of the inlet flow (~6 SLPM) and operated for 2 h. After the steam step was complete, nitrogen was introduced at 18 SLPM for a 15 min buffer period prior to the air oxidation step. Once the buffer step was complete, the nitrogen flow was set to 9 SLPM and the air feed was set to 9 SLPM (50% inlet flow). The oxidation step was run until the oxygen signal showed full breakthrough.

2.4. X-Ray Diffraction (XRD)

XRD was performed in a Panalytical X’pert Pro Powder X-ray diffraction system with an Anton Par Hot Stage (Model# HTK-1200N, Anton Paar ConsumerTec GmbH, Graz, Austria) connected to a Eurotherm (Model# 2604, Watlow Eurotherm, Worthing, UK) temperature controller. The XRD system had a Cu anode X-ray source (Cu kα = 1.5544 Ǻ) and a PiXcel1D strip detector (Malvern Panalytical Ltd., Malvern, UK). The X-ray generator voltage and current were set at 45 kV and 40 mA, respectively, for sample analysis.

2.5. Proximate and Ultimate Analysis

Proximate analysis of the fuels was conducted with a thermogravimetric analyzer (TA Q500, American TA Instruments, New Castle, DE, USA). In total, ~30 mg of fuel was ramped in Ar to 950 °C to capture weight loss transitions associated with drying and pyrolysis. At 950 °C, the sample was exposed to ~15vol%O2 to burn off residual char. Various mass loss transitions were used to characterize the moisture content, volatile content, char content, and ash content. Ultimate analysis was conducted by an external analytical facility at which C, H, N, S, and balance oxygen content were measured.

2.6. Particle Size Analysis and Surface Area

Particle size analysis was performed with a SympaTec QicPic. The tests were conducted with 5–10 g of the sample and repeated at least 3 times per material. The sample was vibrationally fed into the measurement chamber. The QicPic was run in Gradis mode (gravity fed), with a drop height of 50 cm and a 4 mm slit size. Images were recorded and analyzed using the SempaTec PaqxOS 3.0 software. The measuring range used for analysis was the “M7” 4.2–8665 μm. Surface area was measured with a Micrometrics ASAP 2020 Plus.

2.7. Attrition Test

Attrition tests were performed using an MATEC ATTRI-AS jet cup attrition unit. This system complies with the ASTM standard method D5757 [43] for the testing of the attrition resistance of catalytic powder materials. The system was loaded with 50 g of material and run for 5 h. Elutriated fines were collected in a Millipore filter assembly and measured at the 1, 3, and 5 h marks. Each material was tested 3 times. The attrition index is defined in Equation (1).
Attrition index = ((Cumulative mass of fines)/(Initial mass of the sample)) × 100

2.8. Thermodynamic Process Simulations

The thermodynamic limits and heat balances of the process were evaluated using Aspen Plus Software V14. The Peng–Robinson property method was used to calculate the thermodynamic properties of most streams. The Steam-TA property method was used specifically for streams and units within the steam cycle, as this would more accurately represent the properties of pure water streams. Stream classes of CISOLID and MIXCIPSD were set up to allow for proper modeling of the solid oxide stream. The reactors in the process were modeled using the R-Gibbs platform in the Aspen package. The unit operation performs a Gibbs free energy minimization of reactants and products to come up with feasible thermodynamic predictions for complex multispecies systems. The reactors were modeled adiabatically, with some compensation for fuel drying and pyrolysis enthalpies (discussed further in Section 3.10), to represent an insulated vessel. Heat management was conducted through feed preheating and carrier circulation to maintain an adequate thermal mass balance.

3. Results and Discussion

3.1. Composition of Biomass

Different types of biomasses, including wood chips of biomass D and R and wood pellets of biomass D and AWP, were used in this study. The proximate and ultimate analysis data are shown in Table 1. The moisture content of biomass D wood pellets was lower and the volatile content was higher than that in the wood chips, while the total carbon content was similar in both. Biomass R had a lower moisture content and higher fixed carbon content than biomass D. The fixed char content decreased in the biomass pellets due to the increase in volatile matter. Protasio et al. noted this change with woody and agricultural biomass in their study on the mechanical and chemical properties of raw and densified biomass feedstocks for energy applications [44]. It can be inferred that this is due to lignin and hemicellulose reorientation during the densification process, in which friction causes the network to unglue and then resolidify into an entanglement network between neighboring particles [45], which has been documented in wood welding and bracketing practices. The ungluing mechanism may make the structure more susceptible to decomposition via pyrolysis during heating, hence the increased volatile content.

3.2. Optimization of Biomass D (100–300 µm) Wood Chips/Ca2Fe2O4 (180–600 µm) Weight Ratios—Single-Cycle Tests

In the bench-scale reactor experiments, the reaction steps included biomass pyrolysis and a reaction with CaFe2O4 during a temperature ramp in Ar flow, followed by steam oxidation and air oxidation. CaFe2O4 (9 g) was mixed with 1–3 g of biomass D wood chips (100–300 micron) to study the impact of biomass loading on the H2 generation potential in the semi-batch three-reactor orientation. The bench-scale reactor used for these tests did not have a solid injection unit at the reaction temperature, and biomass had to be introduced at room temperature. For comparison, baseline tests were conducted by replacing CaFe2O4 with quartz powder. The effluent gas concentration profiles during the tests with 1 g of wood chips are shown in Figure 3a,b, accompanied by the molar production rates of H2, CH4, CO, and CO2 during the steam exposure segment (Figure 3c).
During the temperature ramp in the baseline tests with quartz and biomass (1 g), products of CO2, H2, and CH4 maxima appeared around 200 °C and a CO maximum appeared around 550 °C due to biomass pyrolysis, as shown in Figure 3a. When steam was introduced after the temperature ramp at 850 °C, steam gasification produced H2, CO2, and CO corresponding to the gasification reactions R10 and R11. When separate tests were conducted by increasing the biomass amount to 3 g, more gasification products during the steam step were produced (Figure S2A—Supplementary Material).
C + H2O → CO + H2
C + 2H2O → CO2 + H2
As shown in Figure 3b, when CaFe2O4 was present with 1 g of biomass, an additional CO2 peak was observed during the temperature ramp, with a maximum at 650 °C, due to the reaction of CaFe2O4 with biomass tar and char contributing to the reduction of CaFe2O4. The products during the temperature ramp increased with an increasing weight (3 g) of biomass (Figure S2B, Supplementary Material). When steam was introduced to the reduced CaFe2O4, the initial H2 peak maximum was significantly higher than that with the baseline conditions. The CO2 and CO concentration maxima were also lower during the initial time period, indicating that H2 was mainly formed from the steam oxidation of reduced CaFe2O4. The peak rate of H2 generation doubled in the experiment with CaFe2O4, accompanied by a decrease in the rates of CO2 and CO generation, as noted in Figure 3c. A secondary broad H2 peak with additional CO2 and CO peaks appeared after the initial H2 peak due to residual biomass gasification. The data indicated that H2 produced from the steam oxidation of reduced CaFe2O4 was the preferential reaction over biomass gasification with steam. The duration for the H2 production peak increased with increasing loadings of biomass, indicating there was a greater reduction of CaFe2O4 with an increasing weight of biomass. The secondary broad H2 production peak with associated CO2 and CO peaks from gasification also increased with an increasing weight (3 g), indicating that there was more residual biomass with a higher weight of biomass (Figure S2B). It was important to optimize the ratio of biomass to CaFe2O4 to maximize H2 production while minimizing the CO2 and CO products from residual biomass gasification during the steam oxidization step. It was found that 1 g of biomass was optimal for the tests in this bench-scale orientation. Cumulative H2 generation between the baseline and experimentally simulated three-reactor approach (C3R) showed similar total outputs. The advantages of the three-reactor approach with CaFe2O4 are as follows: (1) elevated rates of H2 generation and (2) much lower levels of char gasification byproducts. Ideally, this would make the purification of H2 easier in the novel approach.
In commercial operation, it may be possible to remove residual biomass char, which has a lower density than the oxygen carrier, based on density separation after the fuel reactor prior to transferring the solid to the steam reactor. In the event that these separations are not implemented and fuel char slip occurs, the small amount of bio char contributes to CO2 and CO during steam gasification, and a low-intensity water–gas shift reactor/pressure swing adsorption units may be used to purify H2. This is included in the thermodynamic process analysis that will be discussed in Section 3.13.

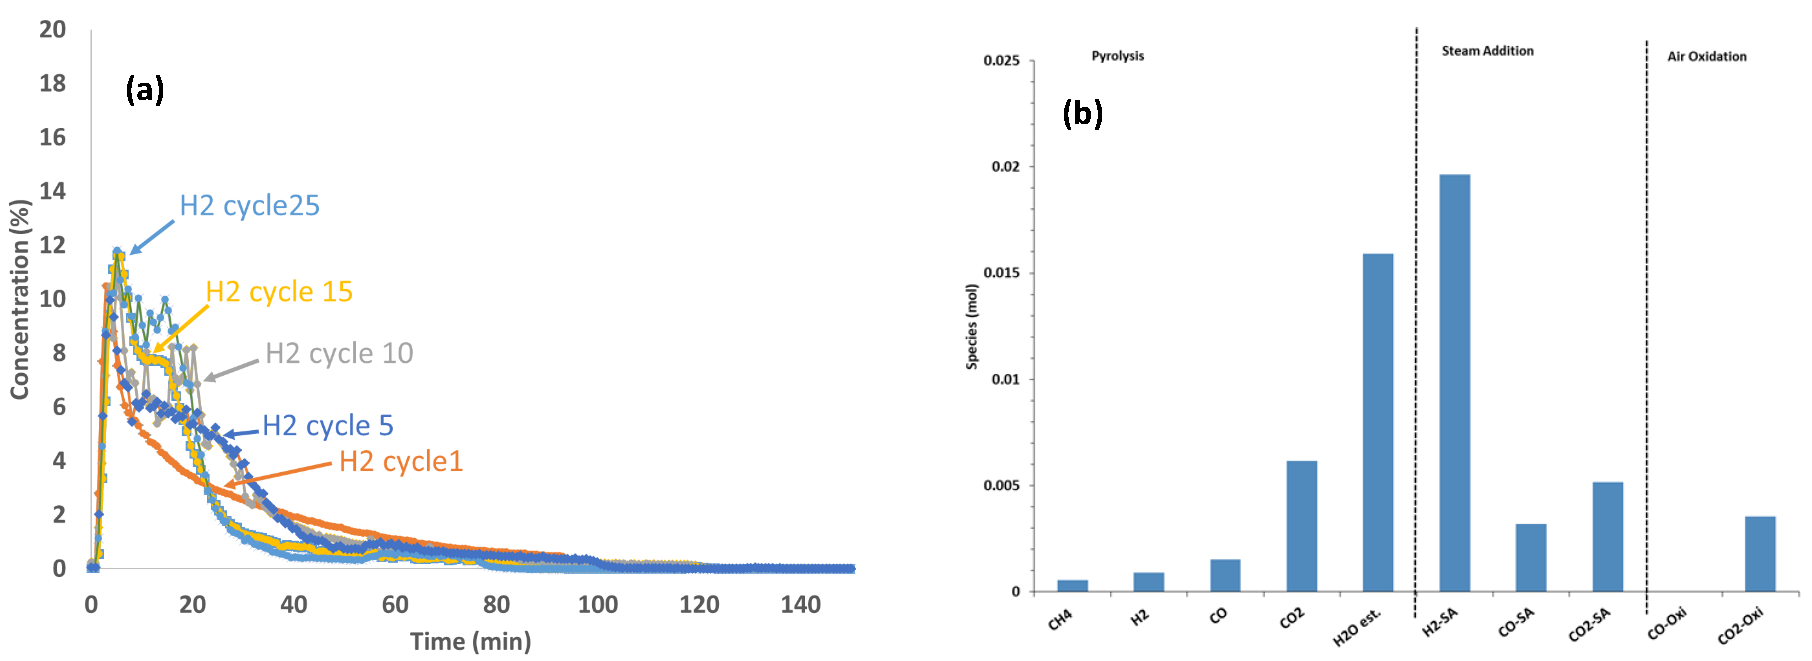
3.3. 25 Cycle Reactivity Endurance Testing at 850 °C with Biomass D Wood Chips and CaFe2O4

For the 25-cycle tests, 1 g of wood chips was selected to minimize the amount of residual biomass that did not participate in the reduction of CaFe2O4 and avoid subsequent steam gasification (as noted in the previous section). The reactor was cooled after air oxidation in each cycle and new biomass was added at room temperature due to the lack of a solid injection port at high temperatures. The H2 concentration data recorded during the steam oxidation step of the 25-cycle tests with biomass D at 1 atm are shown in Figure 4a. The H2 concentration profile at cycle 1 indicated an initial primary high-intensity H2 peak, which corresponded to the steam oxidation of reduced CaFe2O4, followed by a lower-intensity secondary broader tail that corresponded to the steam gasification of residual biomass that did not participate in the reduction reaction. The primary H2 peak intensity increased with an increasing number of cycles up to cycle 10, indicating a better reduction of CaFe2O4 as the cycles progressed, and this remained constant after the 10th cycle. The secondary H2 peak from residual biomass steam gasification also increased with an increasing number of cycles. It appears that the conditioning of the oxygen carrier during cycles may have generated more reduced forms that catalyzed the steam gasification reaction with the residual biomass. The moles of effluent gases during the reduction (temperature ramp) and steam oxidation steps at the 25th cycle are shown in Figure 4b. CO2 was the main species formed during the fuel reaction and H2 was the main species formed during the steam oxidation, but small amounts of CO2 and CO were also observed from residual biomass gasification.
The surface area of un-reacted CaFe2O4 was 279.5 m2/g, and after the 25-cycle test, it decreased to 165.7 m2/g. This reduction in surface area did not seem to negatively affect the reactivity of the material. Based on the XRD data, the fresh CaFe2O4 used for the cyclic tests consisted of mainly CaFe2O4 phases. After the 25-cycle test, which ended in an oxidation step, it consisted of ~97.3% of CaFe2O4, balanced by some minor baseline peaks for Fe2O3 that competed with background noise. This indicates a good chemical stability of the ferrite phase after reactive cycling.

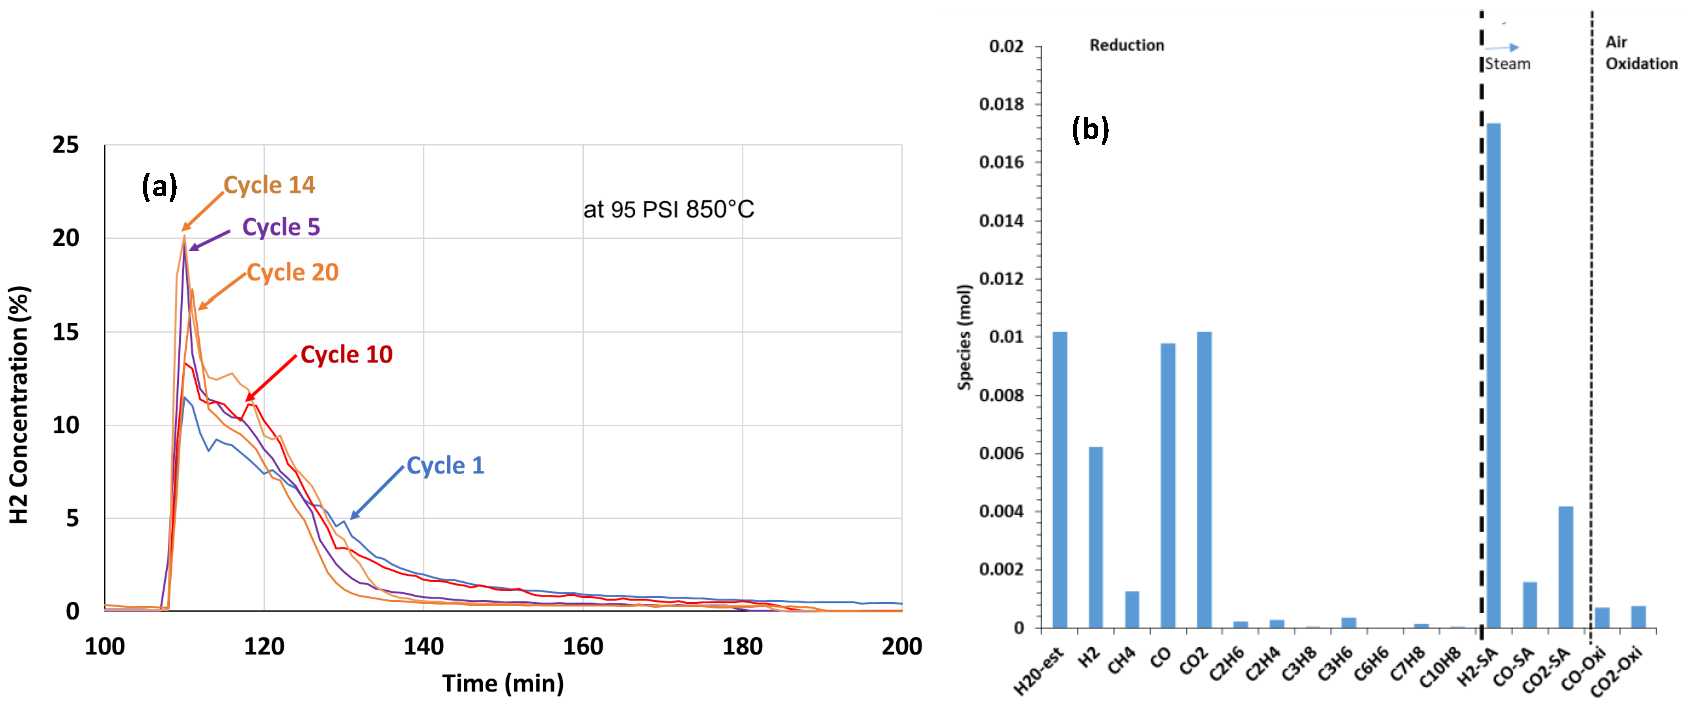
3.4. High-Pressure 20-Cycle Reactivity Endurance Testing at 850 °C 6.5 atm (95 psi) with Biomass D Wood Chips and CaFe2O4

In this test series, cycle tests were conducted at 6.5 atm (95 psi) to understand the effect of pressure on the process. Each cycle at 6.5 atm consisted of a temperature ramp of a 1 g biomass and CaFe2O4 mixture to 850 °C in Ar flow, with the introduction of 20% steam and air (50%) oxidation. The H2 concentration data recorded during the 20-cycle test when 20% steam was introduced at 850 °C and 6.5 atm to the reduced CaFe2O4 are shown in Figure 5a. There were primary and secondary H2 peaks at 6.5 atm, similar to that at 1 atm. The H2 production rate increased with an increasing number of cycles. The H2 production rates at 6.5 atm, as indicated by the concentration peak maximum, were higher than those at 1 atm, which is consistent with the increase in the partial pressure of the reactant. The total H2 production time lasted for about 35 min at the 20th cycle at 6.5 atm, while at 1 atm, it lasted for about 50 min. An elevated pressure promoted the H2 production reaction rate. The gas concentration profile at the final cycle at 6.5 atm is shown in Figure 5b, with similarity to that at 1 atm (Figure 4b).
The surface area of un-reacted CaFe2O4 was 279.5 m2/g, and after the 20-cycle test, it decreased to 178.8 m2/g. This change is consistent with the previous tests.

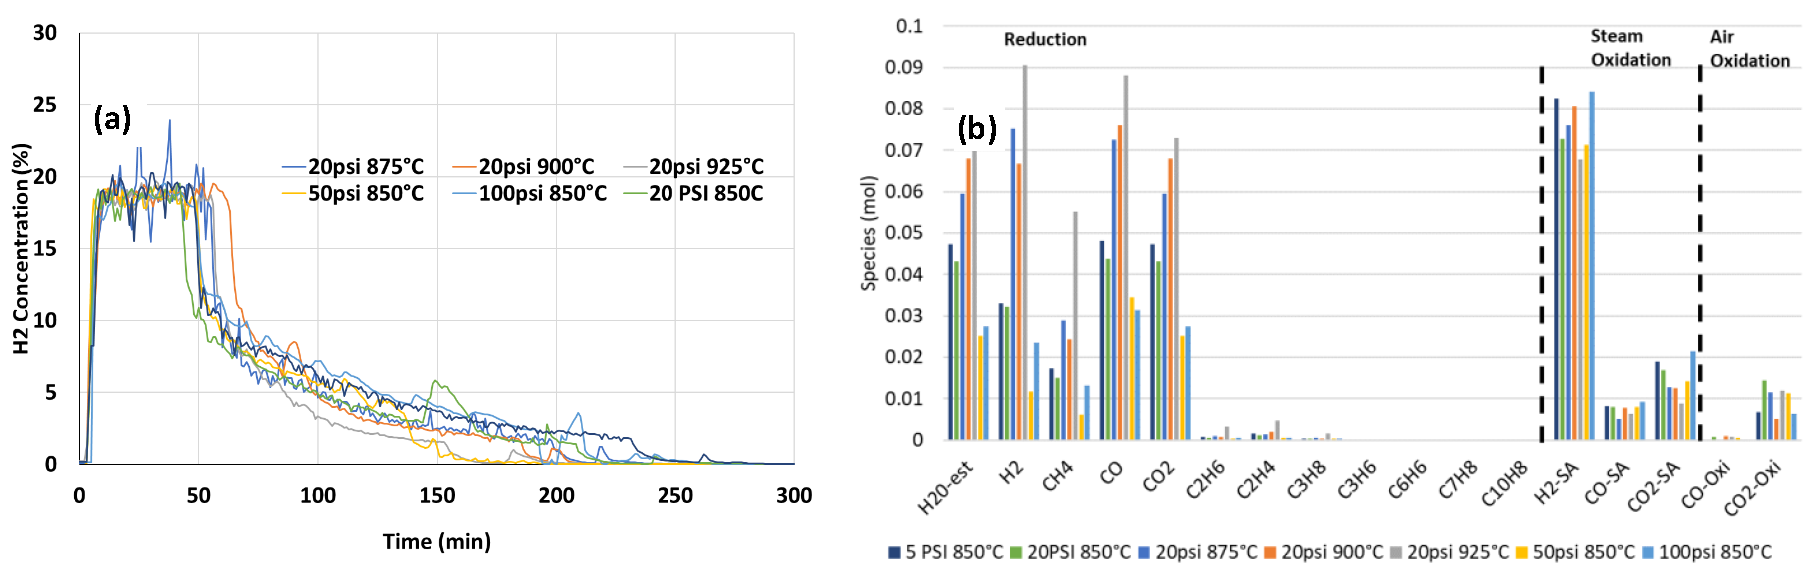
3.5. Reduction of CaFe2O4 with No Gas Flow During the Temperature Ramp to Include All Volatiles, Tar, and Char in the Reduction Reaction

During the temperature ramp with gas flow (Section 3.2, Figure 3), the volatiles generated at lower temperatures were removed from the reactor before it reached 850 °C. This likely prevented a complete reaction with the OC due to the release at a lower temperature, inhibiting sufficient time for the volatiles to react. In order to provide sufficient time for the volatiles and tar generated during the temperature ramp to react with the CaFe2O4 at 850 °C, the temperature ramps in this series of experiments were conducted with no gas flow, as described in Section 2.2.2. The reaction chamber was isolated during the ramp up, enabling the volatile species to accumulate in the reactor head space. Once the target temperature was reached, the reactor was brought back online with a flow of inert carrier gas, pushing the bolus of volatile species through the bed of CaFe2O4. The gas concentration profile during a single-cycle test without gas flow during the temperature ramp with 3 g of biomass D (100–300 μm) and 9 g of CaFe2O4 (180–600 μm) is shown in Figure S3. The H2 concentration profiles during steam oxidation after the temperature ramp without gas flow at different pressures and temperatures are shown in Figure 6a. When steam was introduced to CaFe2O4 reduced with biomass with no gas flow, the H2 production rate was higher (~86%), and the highest H2 concentration remained for a longer period, as shown in Figure 6a and Figure S3, as compared to the data in Figure 3 and Figure S2 with gas flow. The data indicated that there was a greater reduction of CaFe2O4 when there was no gas flow during the pyrolysis step, resulting in better H2 production during steam oxidation. The H2 concentration and corresponding CO2 and CO at the tail end were less prominent (Figure S3) than with gas flow (Figure S2), indicating a minimal contribution from residual biomass gasification. The moles of gas species at the three reaction segments are shown in Figure 6b. As compared to the data with gas flow during the temperature ramp (Figure 6), the moles of H2 during steam oxidation were significantly higher, and relative CO and CO2 moles compared to H2 moles were significantly lower, as shown in Figure 6b, indicating that H2 was mainly produced from the steam oxidation of reduced CaFe2O4 and residual biomass steam gasification was minimal. The data indicated that most of the biomass tar and char were consumed for the reaction with CaFe2O4 during the fuel reaction, contributing to minimal residual biomass during steam oxidation. CaFe2O4 reduction with biomass when there was no gas flow during the temperature ramp would be more reflective of the isothermal reaction conditions in commercial reactors, where biomass is added to CaFe2O4 at the reaction temperature and tars and volatiles would interact with the carrier, enhancing reduction.
The maximum H2 production rate was not affected by increasing the pressure or temperature, but the H2 production at the maximum rate lasted for a longer period at a higher temperature and higher pressure. As shown in Figure 6b, the amount of gas species produced during the fuel reaction portion was higher at higher temperatures.
In order to evaluate whether all the carbon from biomass D was utilized during the three-reactor step tests, the moles of carbon measured were also compared with those from combustion experiments. In the combustion experiments, 3 g of wood chips was heated to 850 °C without any gas flow at 15 psi, and 50% air was introduced at 850 °C. The amount of carbon based on the effluent gases produced from combustion, CO2 and CO, was 0.107 moles, which was comparable to the carbon moles of 0.107 produced during the three-step tests, indicating that all the carbons were utilized for the three-step reaction.

3.6. Reaction of CaFe2O4 with Pyrolysis Volatiles from Biomass D

The reactions of biomass volatiles (pyrolysis products including tars) without direct char interactions in the experimental orientation, as described in Section 2.2.3, were studied. In total, 9 g of CaFe2O4 (180–600 μm) was separated from 3 g of biomass D (600–1700 μm) using quartz wool. During the initial temperature ramp, without gas flow, biomass volatiles accumulated above the quartz wool in the upper headspace of the reactor. Then, 100–200 SCCM of Ar was introduced at 850 °C to inject the biomass volatiles to CaFe2O4 through the quartz wool. For comparison, a baseline reaction with inert quartz powder replacing CaFe2O4 was also performed. The moles of gases produced from the reaction of volatiles with quartz powder and CaFe2O4 at two different space velocities are shown in Figure 7.
As shown in Figure 7, when quartz powder was used in place of the CaFe2O4 OC for the reaction with biomass volatiles, the amount of gas species produced and carbon balance were very low. The carbon balance was calculated based on the moles of carbon from the biomass analysis data (Table 1) and the measured moles of carbon from the carbon-containing effluent gas stream. The low carbon balance indicated that a substantial amount of tar formed during pyrolysis, and injection was not analyzed when quartz powder was used for the reaction. In that portion of the experiment, a small fraction of light pyrolysis gases was detected (H2O, H2, CO, CO2, and a very small fraction of CH4). An oily tar residue condensed out after the reaction, but was not directly analyzed for speciation and composition. The absence of complete carbon balance closure indicates that the majority of carbon unaccounted for should reside in the tar oil. When biomass volatiles were exposed to CaFe2O4, the products H2, H2O, CH4, CO, and CO2 were substantially higher than with quartz, indicating a better reaction of condensable tar species. The molar outputs from the SV2 (100 SCCM, ~τ = 1.8 s) run were higher than that at SV1 (200 SCCM, ~τ = 0.9 s), indicating that the minor increase in mean residence time (τ) enabled a more complete conversion of the volatiles/tars into H2, H2O, and CO2. An increased residence time allowed for a greater consumption of volatile species to produce more H2O and CO2 while reducing CaFe2O4. The carbon balances were also very high (~90%) during the reaction of CaFe2O4 with biomass volatiles, indicating a more complete conversion of the available carbon species. Examining the SV1 condition, the tar base composition was cracked and converted from larger condensable oily compounds (inferred from the baseline test) into CH4, H2, CO, CO2, C2’s, C3’s, and some residual toluene-type compounds. This condition showed the partial conversion of the tars into hydrocarbons and COx. Methane was by far the largest product, providing a good indication that the tar oils were cracked and converted via the OC material. Residence time plays a large role in the extent of cracking and subsequent conversion. The data indicated that CaFe2O4 promoted the decomposition of tar, and the resulting hydrocarbons reacted with CaFe2O4, aiding the reduction process. A direct extrapolation of the mechanism is not possible with the available data, but evidence of the OC’s role in tar decomposition is clearly apparent. Tar decomposition by iron-based catalysts has been reported in the literature [46,47,48,49,50], consistent with what is reported here.
A direct study of acidic tar vapors’ effect on the reactive stability of CaFe2O4 was not carried out. If tar interactions caused acute deactivation, these would have been observed in previously presented multicycle test results, as shown in Section 3.3 and Section 3.4. Oxides are not as susceptible to gas-phase pH as compared to conventional catalysts, since their primary mode of reaction involves direct oxygen transfer to the fuel. The oxide is deconstructed and reconstructed in each cycle with the movement of lattice oxygen. The only mode for substantial deactivation would be caused by introducing a compound that inhibits the reconstruction process. It is not clear if the impurities or composition of the tars cause this aspect.

3.7. X-Ray Diffraction Data

XRD data of the biomass D samples at various stages of the reaction are shown in Table 2. CaFe2O4, before the reaction, primarily consisted of CaFe2O4 phases with minor amounts of Ca2Fe2O5. In some preparations, fresh Ca ferrite samples had only CaFe2O4 phases. As shown in Table 2, the highest reduction of CaFe2O4 was observed when biomass D was reduced without gas flow, allowing both biomass volatiles and char to participate in the reduction (Section 3.5), forming Fe and FeO phases from greater reduction in addition to Ca2Fe2O5. As described in Section 3.5, the longest time at the highest H2 production rate (Figure 6b) was observed when CaFe2O4 was reduced without gas flow, which is consistent with the greatest reduction of CaFe2O4 observed with XRD. When steam oxidation was performed after reduction, the formation of both Ca2Fe2O5 and CaFe3O5 phases was observed, indicating partial oxidation. The formation of CaFe2O4 was observed during air oxidation, indicating full oxidation forming the original oxidized form of CaFe2O4.
When CaFe2O4 was reduced with biomass D with gas flow (Section 3.2) during the temperature ramp, most of the volatiles did not have sufficient time for participation in the reduction reaction, and the primary reaction may have been with biomass char. Therefore, the reduced forms mainly consisted of Ca2Fe2O5, CaFe3O5, and CaFe5O7, and negligible amount of Fe was observed. After the steam oxidation step, CaFe5O7 was not observed, but the amount of CaFe3O5 increased. After air oxidation, the main crystalline form observed was CaFe2O4, indicating the re-formation of the original crystalline structure. The complete re-formation of the CaFe2O4 phase was observed after 25 cycles. Structural changes in the oxygen carrier may have contributed to better gas–solid contacts, contributing to a better reactivity and better reoxidation of the oxygen carrier during cyclic tests.
XRD data of fresh CaFe2O4 and after reduction with only biomass volatiles (Section 3.6) at two different space velocities are shown in Table 2. The absence of the CaFe2O4 phase post reduction in the XRD data demonstrates the capacity of biomass volatiles to reduce the carrier material. At the higher space velocity, the main phases observed were CaFe3O5 and Ca2Fe2O5, but at the lower space velocity, FeO was also observed, indicating better reduction. Biomass volatiles appear to have a good reducing ability.

3.8. Fixed-Bed Flow Reactor Tests with Biomass D Pellets (1 g) and CaFe2O4 (9 g) with Gas Flow at 200 SCCM

Biomass pellets are generally used for combustion applications, and they offer a better compactness, transmission and stability, high density, and low water content, making them easier to transport and store. Pellets have lower water content than chips (Table 1) and are known to combust more efficiently due to this lower water content. Pellets from biomass D were tested in the fixed-bed flow reactor. The gas concentration profiles during the temperature ramp with both wood chips (Figure 3) and wood pellets (Figure S4) were similar during the baseline tests, and when H2O was introduced after the temperature ramp, there was a minor increase in the H2 production rate with the wood pellets compared to wood chips. When CaFe2O4 was present with the biomass during the temperature ramp, the concentration profiles were similar with both wood chips (Figure 3) and wood pellets (Figure S5), but the CO2 concentration appeared to be higher with the pellets. When steam was introduced after the temperature ramp, the H2 concentration was higher for CaFe2O4 reduction with pellets than chips, indicating that the pellets contributed to a greater reduction of CaFe2O4. The lower water content in the pellets may have contributed to this improved reduction.

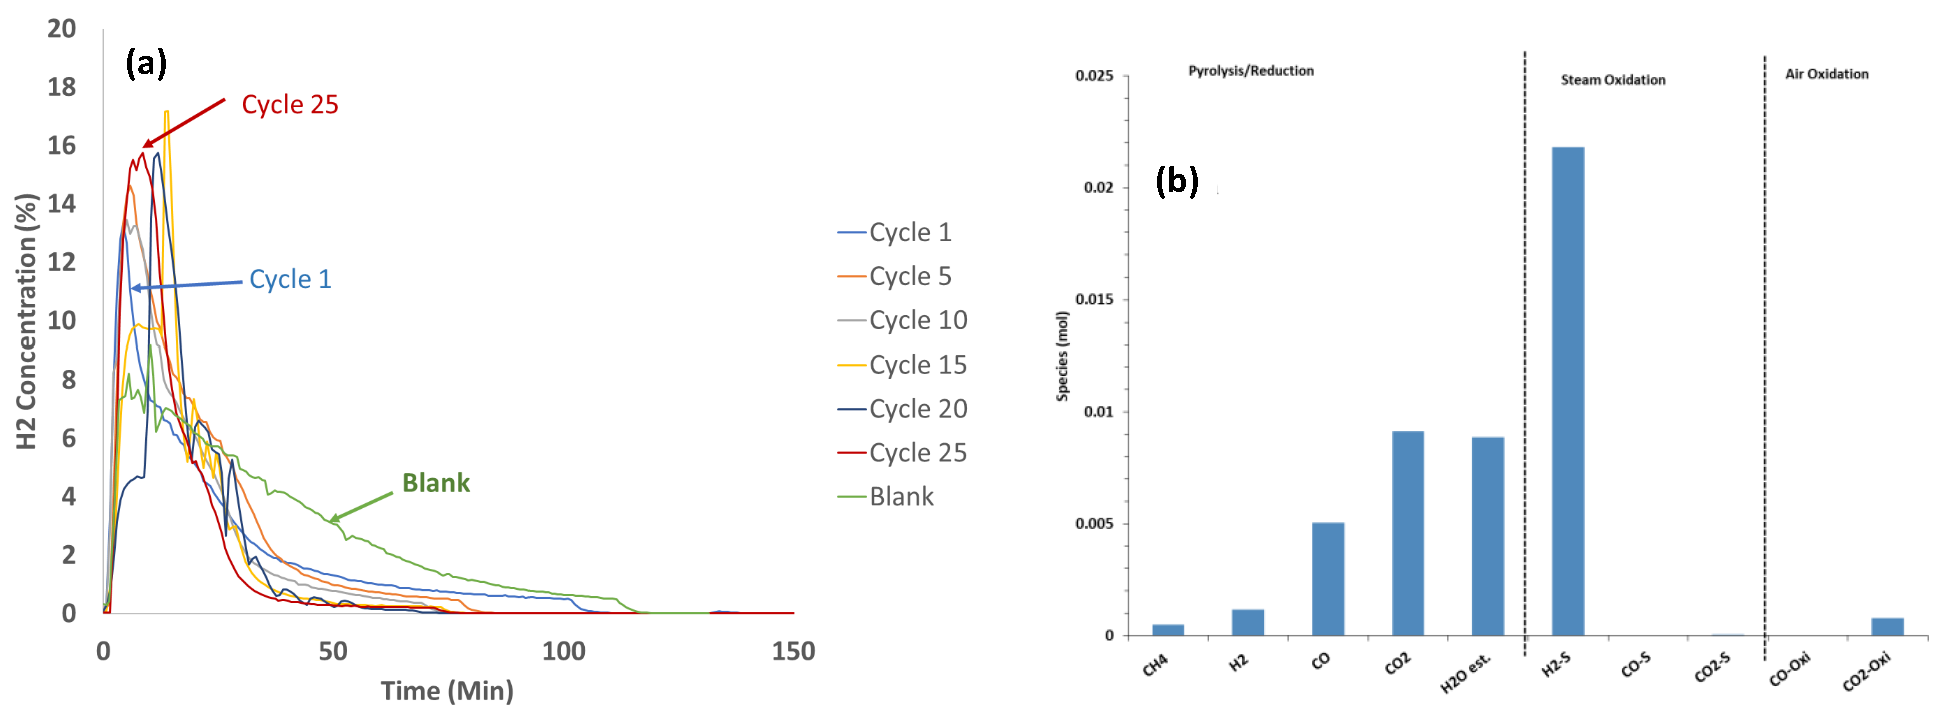
3.9. Twenty-Five-Cycle Fixed-Bed Flow Reactor Data with 1 g of Biomass R Wood Chips (Temperature Ramp with Gas Flow) and 9 g of CaFe2O4, Steam Oxidation at 850 °C and Air (50%) at 750 °C

Biomass R wood chips have a different chemical composition from biomass D, as shown in Table 1. Biomass R wood chips have a lower moisture content and higher fixed carbon content than biomass D wood chips. The baseline gas concentration profiles with biomass R (Figure S6—Supplementary Material) during the temperature ramp were similar to those with biomass D wood chips (Figure 3). When steam was introduced after the temperature ramp, the steam gasification of wood char produced H2, CO2, and CO, and the maximum rate of H2 production with biomass R was slightly higher than that with biomass D. When CaFe2O4 was present with the biomass R wood chips during the temperature ramp, additional CO2 peaks (Figure S7) were observed due to the reaction of the wood chips with CaFe2O4. When steam was introduced after the temperature ramp, H2 was produced at a high rate with steam to a H2 rate of about 80% and the CO2 and CO concentrations were very low, indicating that the products from the gasification of residual biomass were low and most of the biomass was consumed for CaFe2O4 reduction.
XRD analysis data for CaFe2O4 after reduction with 1 g of biomass R with gas flow (200 SCCM), steam oxidation, and air oxidation are shown in Table 3. After the reduction, the main crystalline forms observed were Ca2Fe2O5 and CaFe3O5, and the re-formation of CaFe2O4 was observed after air oxidation, similar to the observations with biomass D.
The H2 concentrations during the 25-cycle steam oxidation are shown in Figure 8a, where the maximum H2 concentration increased initially with increasing cycles and then remained constant. At the 25th cycle, the maximum rate of H2 production was about 90%. By cycle 15, the only product observed was H2 during steam introduction, and there were no gasification products such as CO and CO2. As shown in Figure 8b (gas mole distribution data at cycle 25), it is interesting to note that H2 was the only product observed during steam oxidation, and there were no residual biomass gasification products, such as CO2 and CO. All the volatiles, tar, and char from biomass wood chips R were consumed during the CaFe2O4 reduction step, even with gas flow, contributing to pure H2 during the steam oxidation step, which was different from that observed with biomass D wood chips.
The surface area of CaFe2O4 after the 20-cycle test decreased from 279.5 m2/g (fresh) to 173.5 m2/g. This change is consistent with previous tests. Based on the XRD data, the CaFe2O4 used for the cycle test mainly consisted of CaFe2O4 phases, but after the 20-cycle test, CaFe2O4 (61.9%), FeO (10.4%), and Fe2O3 (10.4%) phases were observed. It is possible that changes in the chemical structure may have contributed to the changes in performance during cyclic tests.

3.10. TGA Analysis of Biomass D and Biomass R to Understand the Differences in Reactivity

This TGA test series was conducted to understand the differences in the reactivities of the biomass R and biomass D wood chips with CaFe2O4. TGA weight changes were monitored with both biomasses during the following reaction steps. The first temperature ramp was conducted with biomass (~20–30 mg) in UHP Ar at 10 °C/min to 950 °C to understand the pyrolysis reaction profile of the biomass, and it was then cooled to 50 °C. After maintaining isothermal conditions for 10 min at 50 °C in Ar, a second temperature ramp was conducted with 50% air in Ar from 50 °C to 950 °C to understand the char oxidation profile. The weight change profiles with biomass D and R are shown in Figure 9. The majority of weight loss (~80%) occurred during the pyrolysis temperature ramp, and the weight loss during char oxidation was about 20%. Biomass D had a slightly higher char oxidation onset temperature.
The derivative weight changes with respect to temperature during the pyrolysis temperature ramp in Ar and char oxidation temperature ramp in air for biomass D and R are shown in Table 4. The first two weight rate changes corresponded to the pyrolysis step, and with biomass R, they occurred at temperatures slightly lower than those with biomass D. The char oxidation temperature, which corresponds to the third weight rate change, occurred at a significantly lower temperature with biomass R than with biomass D. The lower moisture content (Table 1) and better char oxidation reactivity at a lower temperature may have contributed to the full consumption of biomass R during CaFe2O4 reduction, leading to pure H2 without CO2 and CO during steam oxidation, as described in Section 3.8.

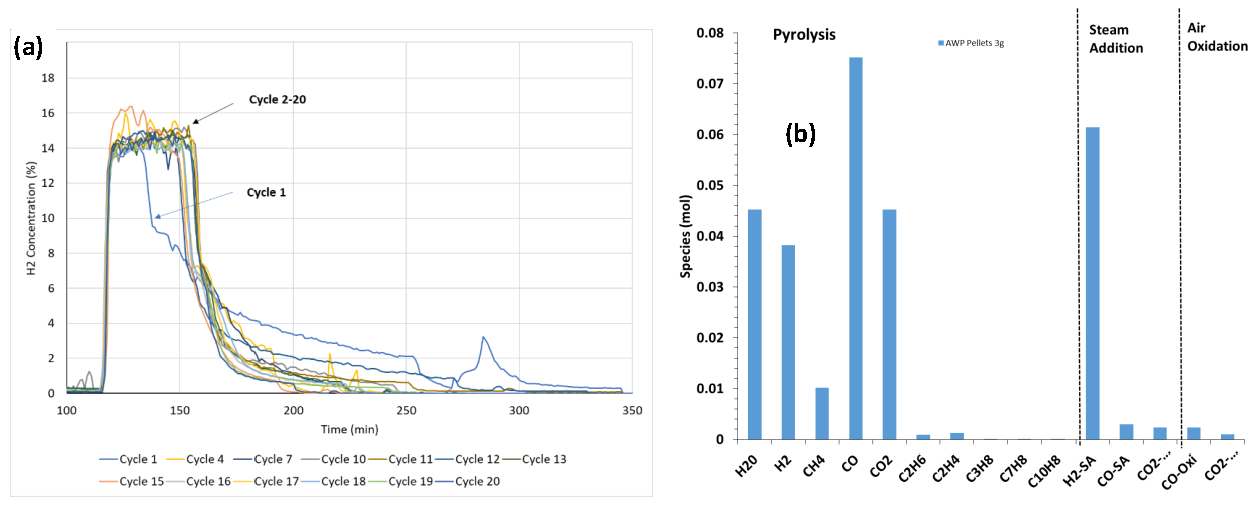
3.11. Bench-Scale Test Data with Biomass AWP Wood Pellets

Biomass AWP wood pellets (3 g) were tested without gas flow during the temperature ramp to provide sufficient time for the volatiles and tar to react with the CaFe2O4 (9 g), as described in experimental Section 2.2.3. When steam was introduced to CaFe2O4 reduced with biomass, the H2 production rate was high (~70%) and the highest H2 concentration remained for a longer period, as shown in Figure 10a. A stable H2 production performance was observed during the 20-cycle test. The mole gas composition during the 25th cycle is shown in Figure 10b. During the fuel pyrolysis reaction step, the CO molar output exceeded others, similar to that with biomass D. The relative CO and CO2 concentrations compared to H2 were significantly lower during the steam introduction step, indicating that the H2 was mainly produced from the steam oxidation of reduced CaFe2O4. Most of the biomass was consumed, as indicated by the very low CO2 and CO produced during the air oxidation step.

3.12. Sub-Pilot-Scale Tests with Biomass AWP Pellets and Material Analysis

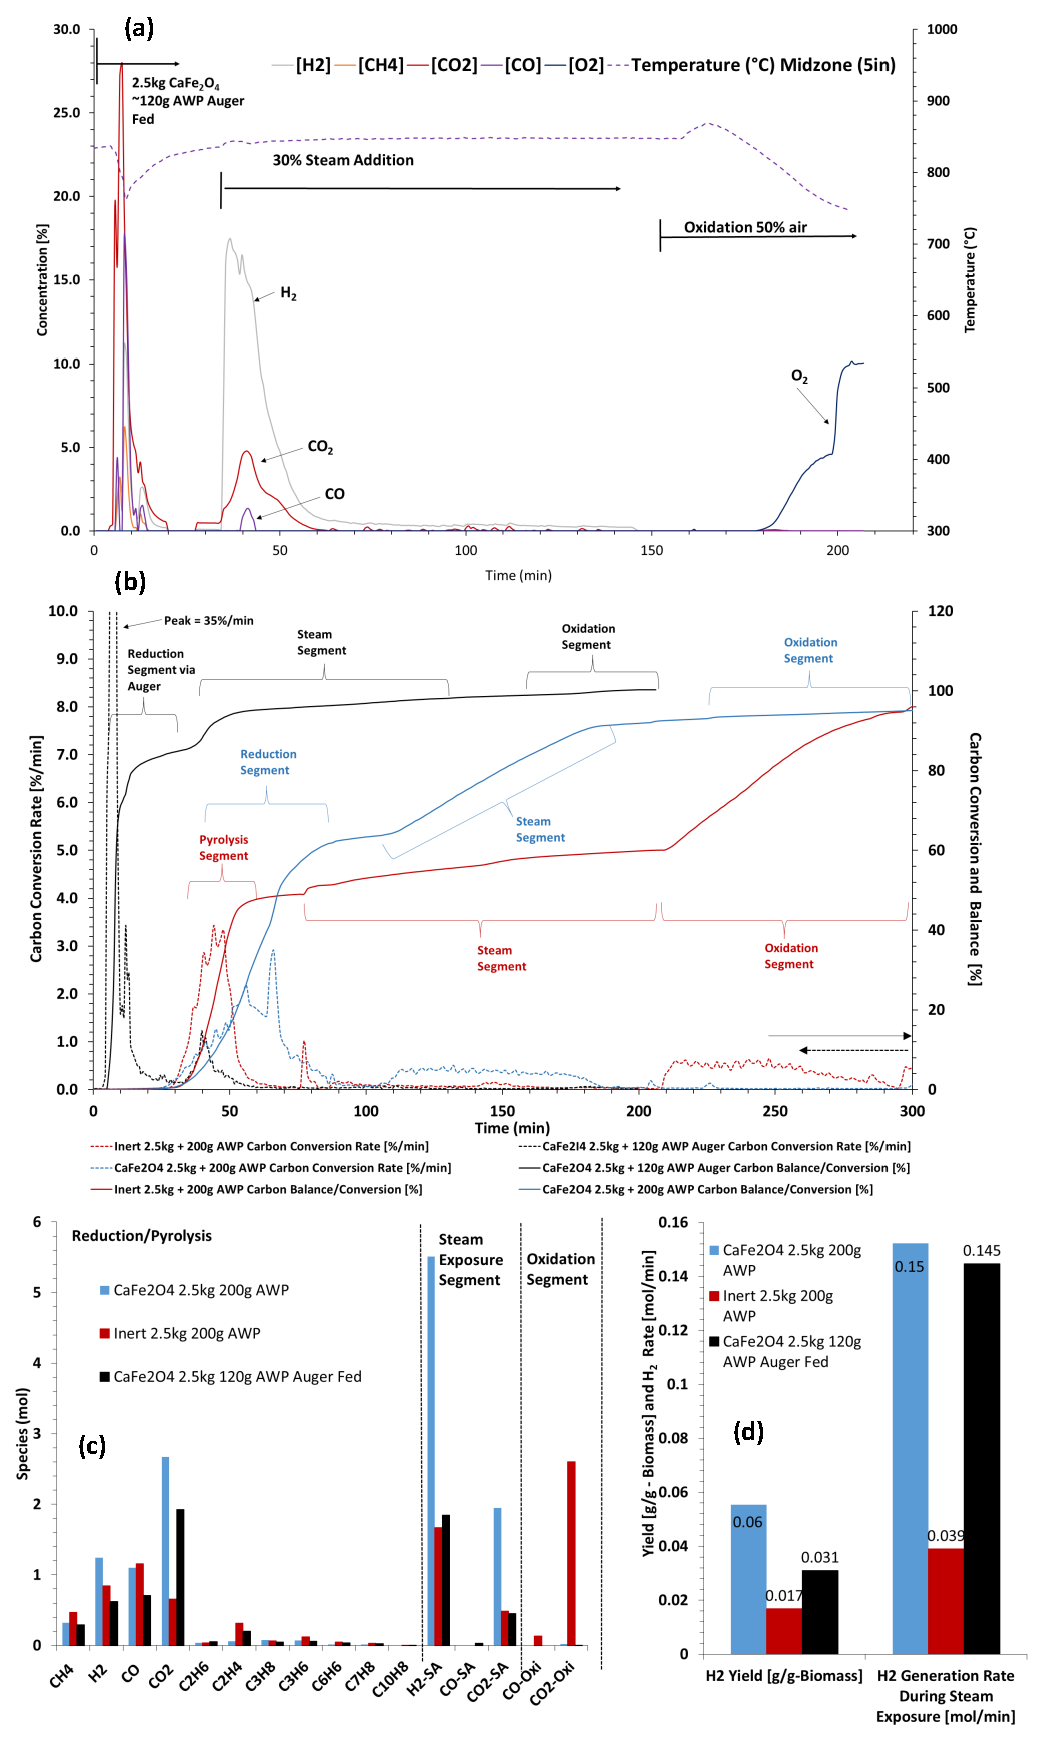
3.12.1. Sub-Pilot-Scale Reactor Test Data

Increased scale testing was conducted with a four-inch fluid bed, as described in Section 2.5. The increased scale rector had two configurations that enabled different solid fuel introduction modes. Batch fuel loading was used to compare to the bench-scale experiments with the three-reactor approach. Auger feeding was used as a measure to attain a set-up that would more closely resemble the solid feeding of a steady-state operating system. Batch fuel loadings of 200 g were compared with a baseline and the active OC material. In total, 120 g of AWP pellets (2–4 mm) was added via auger feeding to the bottom of the reactor at 850 °C, containing 2.5 kg of CaFe2O4 (180–600 µm). The auger feeding option and the amount of biomass were selected after investigating various mixing options with different biomass amounts, using the same CaFe2O4 material for 10 different cycles. As shown in Figure 11a, CO2 was the main product observed at the highest rate and highest amount during the fuel reaction step. When steam was introduced after the fuel reaction, H2 was produced at an elevated rate, with ~65% steam conversion. A minimal amount of CO2 was generated, indicating that most of the biomass was consumed during the fuel reaction step. There was no CO2 or CO during air oxidation, indicating all the biomass was consumed in the previous steps. The batch load method and baseline are compared in Figure 11b–d. Carbon conversion rates and carbon balances are displayed in Figure 11b. The cumulative measured effluent gas species are shown in Figure 11c, and the H2 yield and generation rate maxima from the steam introduction segment are shown in Figure 11d. All experiments approach above 90% carbon balances, with the baseline test hovering at the lower end due to unaccounted for tar species that did not crack during the test and condensed prior to measurement. In the larger-scale system, the steam gasification potential of the biomass was greatly reduced in the baseline test. The rates were much slower than those in the bench-scale tests, and a large fraction of residual char remained that was burned during the oxidation segment. The batch loaded test with CaFe2O4 showed improvement in H2 generation over the baseline, with ~2.2 times the amount of H2 for the same loading of biomass.
The auger feeding tests used ~60% of the fuel loading with the same amount of CaFe2O4. This inherently limited the net amount of H2 that could be generated, however, it can be observed that the H2 yield was greater than the baseline with the smaller fraction of fuel. Positive results in the sub-pilot-scale tests demonstrate the potential scalability of the process. Sub-pilot-scale tests were conducted in a batch fluidized bed mode, which limits the operational demonstration. Ideally, multiple reactors would be present in which the carrier is circulated. This is clearly a limitation of the work, but it serves as a stepping stone towards the next phase in scaling.

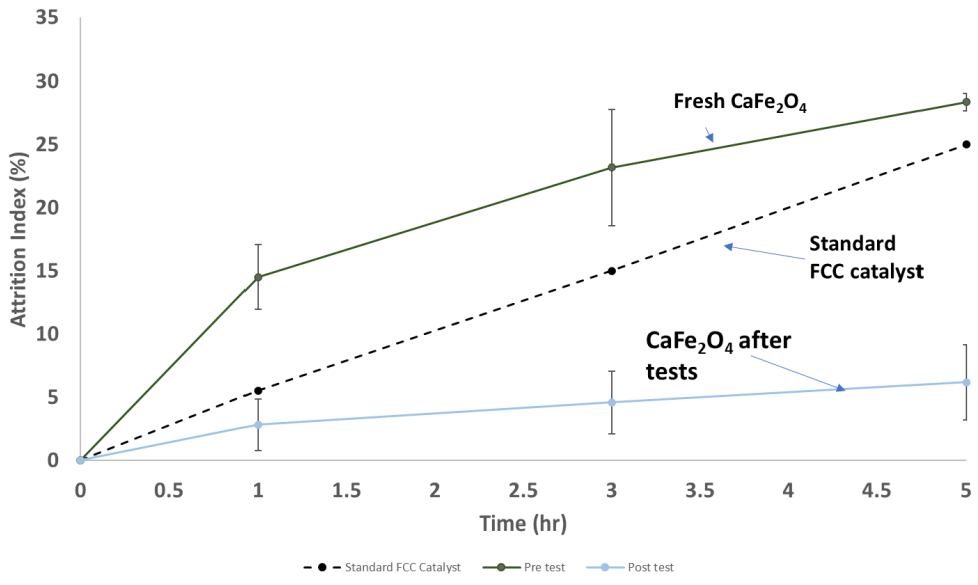
3.12.2. Attrition and Particle Size Data of CaFe2O4 Before and After Sub-Pilot-Scale Tests

Particle size data for CaFe2O4 before and after the sub-pilot-scale tests are shown in Figure 12. Fresh CaFe2O4 had a wider particle size distribution, and after the tests (10 cycle scoping tests), the particle size distribution decreased by 52 µm and the distribution narrowed significantly. Sphericity also improved from 0.65 to 0.79 after the tests. The data indicate that the abrasion mechanism, which involves the removal of the weaker outer layers and edges of larger particles to produce a more uniform particle size distribution, took place during the tests.
Attrition index data for CaFe2O4 before and after the sub-pilot-scale tests are shown in Figure 13. The fresh CaFe2O4 had an attrition index slightly higher than that of the fresh FCC standard, but after the tests, it had a better attrition index than the standard FCC catalyst. This is a promising result, suggesting that the CaFe2O4 oxygen carrier formed particles with a very high attrition resistance during the tests, in addition to its promising reactivity. The bulk density of the material increased from 640 kg/m3 in the fresh state to 1350 kg/m3, indicating a densification of the material that could also lead to increased toughness.

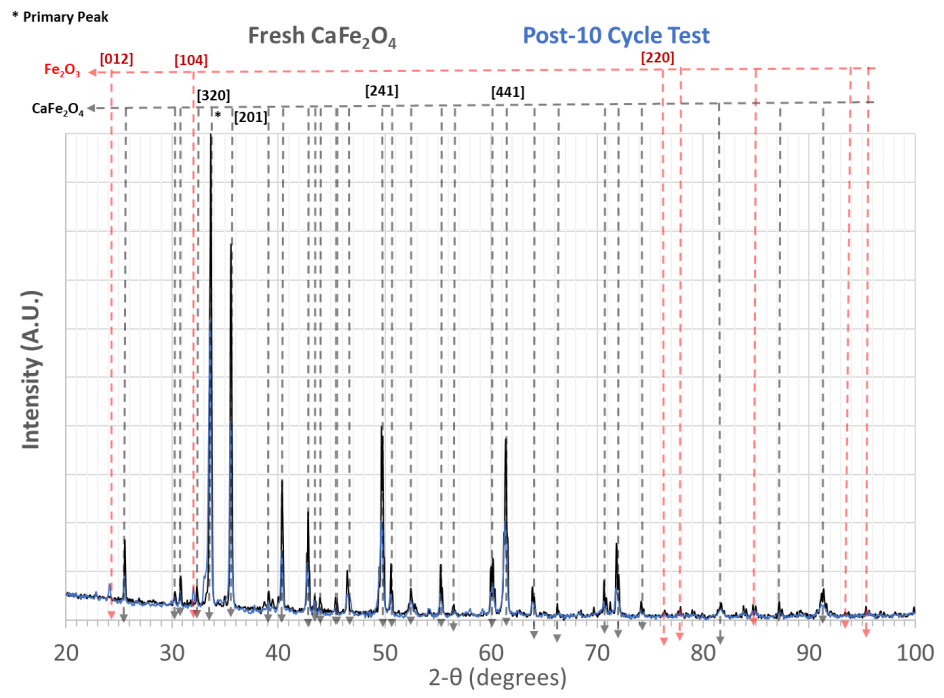
3.12.3. X-Ray Diffraction Data of CaFe2O4 Before and After Sub-Pilot-Scale Tests

X-ray diffraction data before and after (cycle ending air oxidation) the sub-pilot-scale tests are shown in Figure 14.
The X-ray diffraction data indicate that the CaFe2O4 phase remained after 10 cycles of reduction oxidations, indicating chemical stability as an oxygen carrier.

3.13. Bench-Scale Experimental Data on Syngas Production Simulating the Two-Reactor Process with AWP Wood Pellets

A series of experiments, as described in Section 2.2.4, were conducted to represent the two-reactor chemical looping process, which combined the fuel reactor and the steam reactor steps into one step, with the intention of generating a syngas stream directly from the fuel and leveraging the chemistry of the OC. These experiments were performed, in part, to support the thermodynamic analysis conducted with the two-reactor process described in Section 3.13.
The product generation rates after steam was introduced at 300 °C with quartz/AWP (baseline) and CaFe2O4/AWP (C2R) are shown in Figure 15a. In the baseline (quartz/AWP/steam), the H2, CO2, and CO production rates after reaching the peak maxima continued to decrease over a longer duration when compared to the experiments with the CaFe2O4 OC. The H2 production rates were ~45% greater with the OC, accompanied by a ~30% increase in the CO2 and CO rates. The moles of effluent gases formed during the two reaction segments are shown in Figure 15b. The OC promoted better use of the fuel, as noted by the marginal COx species during the oxidation segment. The data also indicate that the moles of H2 were comparable to those formed during the simulated three-reactor tests (Figure 3d). The purity of H2 was better in the simulated three-reactor tests. If pure H2 is the desirable product in the two-reactor approach, an additional full-scale water–gas shift reactor and pressure swing adsorption unit will be necessary. CaFe2O4 is an effective oxygen carrier in promoting the gasification of woody biomass.
The data from the experiments indicate that a syngas product can be formed in the batch orientation and an improved conversion of biomass fuel will occur, as noted by the increased rates of H2, CO, and CO2 formation. This information is used, in part, to inform the two-reactor simulations conducted in Section 3.14, noting that a syngas product is possible and that tar conversion is enhanced. Syngas composition is not limited by the results presented in this section, as it could be altered further when the system is in a steady state and the fuel to oxygen carrier ratio is altered. With that noted, the simulations presented in the subsequent sections explore the thermodynamic limits of the steady-state processes and exhibit syngas compositions reflective of these limits.

3.14. Thermodynamic Integrated Process Simulations

3.14.1. General Simulation Procedure and Assumptions

In this section, experience gained from experimentation and ideology for integrated process concepts was combined to understand the operating potential of the novel CL biomass H2 production concept. The goal of this portion of the study was to understand the maximum H2 yield potential that selected autothermal configurations exhibited in comparison to the current competing biomass steam gasification concept. This portion of the study leverages knowledge gained from the biomass reactivity studies outlined in previous sections, coupled with the extensive knowledge already published on the CaFe2O4 oxide system in our previous works [1,39,51]. Previous studies have examined the use of CH4 as a fuel source for H2 [39,51]. The same fundamental assumptions and concepts applied in those system studies are also used in this study. Full reduction of the CaFe2O4 carrier material leads to CaO + Fe. Based on our previous work [52], it is possible to achieve near-complete reduction by increasing the residence time and optimizing the fuel to oxygen carrier ratio in the fuel reactor. Steam oxidation forms Ca2Fe2O5 and Fe3O4. Air oxidation returns the material back to the original CaFe2O4 state.
To explore the feasibility of an autothermal process, steady-state simulations examining the thermodynamic limits of the process were explored with respect to the block flow diagrams displayed in Figure 16. In the simulations, a realistic biomass source representative of a densified biomass pellet was fed to the FR in stream 1 at a rate of 13.5 ton/h. The biomass feed was chosen based on the average regional feedstock availability based on biomass-based pellet fuel production mills situated in the US in 2023 (shown in Figure S8 in the Supplementary Data) [53,54]. H2 production facilities could be regionally sized to accommodate the biomass available within the region, rather than requiring centralized shipments of the feedstock. The biomass feedstock was modeled using a single-stream component in Aspen Plus. The single stream featured the gas-phase components that arise from drying and pyrolysis, accompanied by the residual char, ash, and inorganic sulfur species. The pyrolysis components were split into the following two categories: light gases (H2, C1-C4, CO, and CO2) and tar. Tars can be a complex mixture of aromatics and oily residues. For this study, the tar species were lumped into a single component (CxHyOz) consisting of carbon, hydrogen, and oxygen. The resultant stoichiometry was calculated based on the difference between the raw fuel elemental mass balances, subtracted by the contributions of the char and gas-phase light pyrolysis products at a specific pyrolysis temperature relevant to the operating conditions of the fuel reactor. The pyrolysis contributions were informed by the works by Di Blasi et al., who detailed the light gas pyrolysis products for specific wood and agricultural residues [41]. It is assumed that these translate to the densified fuel used in this study. The char elemental composition was measured at different pyrolysis temperatures using a combination of TGA and CHNSO analysis, as shown in Table S1. From these data, it can be deduced that at temperatures around 320 °C, around 29% of the char bound oxygen was abstracted in the tar. At 800 °C, over 95% of the oxygen in the char was abstracted, and this increased to over 99% at pyrolysis temperatures of 900 °C. Simultaneously with oxygen abstraction, hydrogen was also abstracted. Chars are concentrated with mainly carbon and residual nitrogen.
The enthalpy associated with the dehydration and pyrolysis of the fuel was added to the reactor operations as a net heat loss as a means to capture the impacts of these thermal-chemical phenomena when using the fuel in the simulations. A detailed breakdown of the fuel composition can be found in Table S2. Around 47wt% of the fuel was light gases from drying and pyrolysis, ~35wt% of the biomass fuel was tar, and ~16.8wt% was residual C in the char, with the balance being ash. This composition was integrated into a mixed sub stream that was fed into the reactors in the process.

3.14.2. Two- and Three-Reactor Process Configuration Comparisons

The looping-based process can have two primary configurations, consisting of either a three- or two-reactor looping train, as shown in Figure 16a and b, respectively. The different configurations leverage different reaction regimes to produce hydrogen. These are discussed in detail and compared for system productivity. The configurations have similar design criteria for comparability. The base biomass feed is 13,500 kg/h. With a plant operating capacity of 90%, the H2 production rate is variable and dependent on scale and technology. Downstream operations are not rigorously modeled, but have performance assumptions reflective of those used in a previous work [39] and discussed below.
The water–gas shift unit operations have a CO conversion rate assumed to be 98% at 20% excess steam.
The PSA has a H2 recovery assumed to be 80% at a 99.9% purity. The product stream specifications are as follows: H2 at a 99.9% purity with a minimum delivery pressure of about 52 atm (purity limits: 5 ppm CO, 5 ppb H2S, 1 ppb H2O). When evaluating the CPU, the total CO2 capture rate is 90% at 2200 psig. The CPU technology is MDEA for HP applications and MEA for LP applications, which both use 4 mol LPS/mol CO2 separately. CPU technologies are optional for integration with biomass-based systems to enable negative CO2 emissions.
The three-reactor process is shown in Figure 16a. This process consists of a main looping reactor train consisting of a fuel reactor (FR), steam water splitting reactor (SR), and air reactor (AR) coupled with peripheral equipment to facilitate clean H2 production. The densified biomass primary feed is to the FR. The biomass feed can be pressurized and preheated in this configuration due to the use of a fraction of H2O(l) being used as a transfer media. The biomass interacts with the oxygen carrier material in the FR to generate a mixture of CO2 and H2O and a reduced carrier material (~2.5% converted to CaO and Fe in the appropriate stoichiometric ratios). The reduced carrier generated in the FR is routed to the SR, where H2O is converted to H2 via oxygen uptake by the reduced carrier material, also called steam water splitting. The SR is very mildly exothermic, with very little alteration in temperature due to reaction enthalpy (<1 °C). The AR acts as the primary heat generation source for the system due to the exothermicity created from the oxidation of the partially saturated oxygen carrier materials fed from the SR. Additionally, if excess heat is needed for the process, a fuel source can be ideally injected into the air reactor to elevate the reactor temperature and ultimately the solids return temperature to the FR. All feeds that can be preheated are equipped with feed preheaters. Effluent and product streams are also integrated with the waste heat recovery cycle, where the residual energy is extracted from the hot streams to raise steam for the system and create electricity in the event of excess. Both systems use a similar steam heat recovery cycle, as shown in Figure 16b, adjacent to the two-reactor CL system. The carrier circulation is in excess (90,000 kmol/h CaFe2O4), in which 98.5% acts as a heat carrier and thermal mass for the circulating system. Reactors are modeled adiabatically with RGIBBS unit operation [51,55], and in the case of the FR/AR, additional heat losses resultant from biomass drying and pyrolysis are added, as described in the Supplementary Information. Carrier circulation and oxygen carrier excess differentiate the simulations from the experiments that were conducted in the previous sections of the work. In the simulations, the carrier circulation rate and reactor orientation can be used as control measures to achieve a desired product stream in the FR. Experimental set-ups are limited in their capacity and will tend to favor partial oxidation products during reduction because of limited CaFe2O4 excess and the absence of circulation. These experiments serve as a means to demonstrate the potential of the carrier materials in controlled but limited batch scenarios. The simulations extend upon this and the known reaction chemistry to explore the possibilities when shifting towards a steady-state process with different potential reaction orientations.
In the case of the three-reactor system, there is potential for unconverted char to pass with the solids into the SR via solids entrainment. This would be considered solid fuel slip into the SR, and some indication of this is reflected in the previous experimental results, denoted by the CO and CO2 byproducts that arise during the steam oxidation step, as shown in Figure 11 with the sub-pilot rig. Therefore, in the simulations presented in this work, the solid fuel slip is estimated as 20% of the total carbon char content with respect to the fuel feed rate. This is enacted to capture the char slip effects bordering on some degree of system reality. In order to minimize these effects, a detailed reactor design is required, but this is outside of the scope of this study.
With the small fraction of fuel slip transferring to the SR, some CO/CO2 is generated from the char gasification in that reactor. This small fraction is converted to H2 using a small-scale WGS system on the tail end of the SR prior to the PSA unit, which is used to purify the H2 product.
The two-reactor system uses a different reactor concept to achieve a syngas stream. This type of system leverages a co-current moving bed approach to generate a syngas stream from interaction with the biomass. In this system, the FR and SR are combined into a single unit called the SG (syngas generator). LP steam is added alongside the biomass feed stream at the top of the reactor with the fully oxidized carrier. The down flow of gas and solids enables the interaction of partially reduced species of Ca2Fe2O5 and FeO with the fuel and its pyrolysis products, resulting in a syngas product rather than a combustion product. This differs from the FR in the three-reactor system, both conceptually in orientation and in how the carrier material interacts with the fuel. In the FR of the three-reactor system, the reactor is a well-mixed circulating fluidized bed which does not have a preferential flow direction. A preferential flow direction, coupled with a reduction in the carrier circulation rate (lowered to 40% compared to the three-reactor approach), enables the syngas product formation that is shown to occur in the SG of the two-reactor approach.
Since a syngas product is the main H2-bearing stream of the two-reactor system, a much larger WGS system is required to shift the syngas prior to purification. This is conceptually similar to the baseline biomass gasification, with the exception that the carrier material acts in a dual manner to benefit the process. Tar and aliphatic conversion are enhanced by the carrier, as noted previously in Section 3.5, Section 3.11 and Section 3.12, and the thermodynamic limits indicated in the simulations approach complete conversion, which eliminates the need for a tar reformer (of which is found in the baseline technology). Additionally, the co-current mode results in a partially oxidized OC that exits the SG and enters the AR. The oxidation of this material results in some exothermicity that helps to raise the temperature of the solids stream. Table 5 displays the major operating conditions of the two-reactor (2R) and three-reactor (3R) approaches compared to the baseline. Tables S3–S6 contain detailed stream tables for the simulations.
The baseline steam gasification technology that is used as a point of comparison in this work is one developed by NREL and Battelle, which uses an indirect fired gasifier concept leveraging circulating olivine as a catalyst and heat transfer media. The system uses a dual circulating fluidized bed approach, where unconverted char is combusted in one reactor (analogous to the AR in our system) to raise the heat of the solids for return back to the syngas generation reactor. The AR in the baseline technology operates at a slightly higher temperature than the CL-based approaches. Details of this process can be found in their referenced works [15,56,57]. The system includes a number of post gasifier reforming operations to manage the tars and methane that are generated from the incomplete conversion of the primary and secondary pyrolysis products. CL-based technologies contain reactive OC materials, which replace the need for the tar and methane reforming operations and simplify the process to a single reactor train. Table 6 compares the two- and three-reactor approaches at two different pressures to the biomass baseline.
The different CL approaches demonstrate similar product yields, with the three-reactor approach being slightly more efficient than the two-reactor approach. Both approaches demonstrate a significant improvement, with a 30–40% increase in H2 output per kg of input fuel, over the biomass gasification baseline. This higher yield can be attributed to the following two reasons: (1) better utilization of the biomass fuel via efficient tar and light aliphatic conversion in the fuel reactors (FR or SG) and (2) lower auxiliary biomass feed requirements in the AR to offset the endothermic heat load. The baseline process represents the endothermic valley that is encountered with a system where the circulating media is just a catalyst/thermal mass. In CL-based systems, the oxygen carrier enters the AR in a partially saturated state and, when oxidized, releases exothermicity, which reduces the auxiliary fuel requirements in that section of the process. Recalling that, auxiliary fuel is needed to provide additional heat to maintain the reactor temperature and elevate the solids temperature in preparation for the FR/SR or SG stages. The auxiliary fuel requirements in the AR of the two-reactor process are lower than those in the three-reactor process because of the solid composition in stream 22 (Table S4) entering the AR. A small fraction of residual Fe creates additional heat when oxidized and integrated back into the CaFe2O4 structure, which offsets the fuel requirements further. Although the two-reactor concept has slightly lower auxiliary fuel requirements, the process is not quite as efficient as the three-reactor approach. The three-reactor approach has more waste heat and less utility steam requirements, making power production possible and in excess of the process requirements. Therefore, the three-reactor approach would not require an additional electrical utility, whereas the two-reactor approach would at ~0.4–0.6 kWh/kg H2 produced. This is still ¼–½ of the electricity requirements of the baseline technology, which demonstrates a degree of improvement even in the two-reactor approach.
The two-reactor and three-reactor systems were also modeled at 6 atm, which is considered an upper limit for circulating systems of this kind, which was noted in our previous work [39]. A higher pressure would likely result in gas entrainment in the solid circulating streams and result in gas crossover between the reactors. Here, we note that pressurization to 6 atm marginally impacts the product yields, resulting in a slightly elevated H2 yield in the three-reactor approach and a slightly reduced H2 yield in the two-reactor approach. The H2 yield is lowered slightly in the two-reactor approach at 6atm due to an increase in auxiliary fuel requirements in the AR. The reverse occurs for the three-reactor approach, with a slight reduction in the auxiliary biomass requirements for heating. A more pronounced impact is the resulting electricity usage. Although pressurization requires elevated input pressures of feed air in the AR, this is offset by the reduction in compression of the H2 product and the CO2 output stream from the CPU (further details depicted in Table S7).
CL-based processes result in lower net water usage (~40–50% less) per kg of H2 produced compared to the baseline. This is directly proportional to the conversion efficiency in the FR or the SG. Since these reactors contain a reactive oxygen carrier that can convert pyrolysis tars and light aliphatic compounds, the efficiency of the overall system is enhanced when the oxygen carrier is present. Since the carrier material is directly transferring oxygen in the FR/SG and is in excess, the pyrolysis products can be considered as the limiting reactants, and are readily converted. This is one advantage of using CL-based approaches with a high excess of circulating flow.

3.14.3. Biomass Moisture Content on Process Metric Outcomes

Woody biomass can be sourced in different forms. Using densified biomass as a point of reference, all other forms will have varying degrees of moisture and some variability in composition. In previous sections, it was determined that lower-moisture-content biomass fuels resulted in better H2 production due to the increased reducibility from the fuel when evaluated on an equivalent mass basis. For the scope of this study, it was of interest to explore the impact of feedstock moisture content on process outcomes. In this section, a chip feedstock for the densified biomass pellets is compared to the densified feedstock (which is made from the chips). The properties of the chip precursor and the densified product are shown in Table 7 for comparison. The chips have a moisture content of ~28–29wt%, whereas the densified biomass pellet has an average moisture content of 6.85%. The increase in moisture content results in a loss of heating value per kg of the fuel proportional to the enthalpy associated with drying the fuel to equivalent levels to the densified pellets. The reduction in heating value was taken into consideration for the simulation comparison.
Since the three-reactor approach showed the highest H2 yield and lowest utility usage, the three-reactor LP was used as a basis for the comparison of the impact of the feedstock alteration. For these case studies, an equivalent biomass feed basis in the FR was fixed at 13.5 ton/h, consistent with the previous section. The auxiliary biomass feed into the AR was modulated based on process needs and varies between the two case studies. Table 8 displays the process performance outcomes of the two cases. The raw chipped woody biomass resulted in lower yields in comparison to its densified variant. The reduced yield occurred for the following two reasons: (1) the higher moisture content fuel had less active species to enact the reduction of the carrier in the FR and resulted in lower solids conversion, ultimately impacting the H2 output in the SR, and (2) ~45% higher biomass injection rates in the AR are required to compensate for the lowered heating value of the fuel. The increased moisture content fuel does have some positive impacts. Since it carries a significant amount of moisture, lower levels of feed water usage are needed for the process. Due to the increased amount of auxiliary biomass for heating, a net increase in the blower air flow rate is required to achieve desirable O2 levels in the AR and effluent stream. The increased air throughput results in higher upfront electricity requirements, but also results in more extractable heat from the tail end of the AR effluent that is used for steam/power generation in the waste heat recovery cycle. Therefore, more excess electricity is generated at the expense of H2 yield. With this information, operational outcomes can be extrapolated for potential variabilities in feedstock moisture content.

4. Conclusions

Biomass in the form of wood chips and pellets was used as fuel for chemical looping H2 generation with a CaFe2O4 oxygen carrier. Two- and three-reactor concepts were explored, leveraging the favorable chemistry of the oxygen carrier. Thermodynamic process simulations indicated that both the two- and three-reactor approaches resulted in higher yielding concepts compared to the biomass steam gasification baseline. H2 yields ranged from 0.102 to 0.104 kg H2 per kg of biomass. The three-reactor approach was shown to be more favorable due to its higher H2 yield and lower utility needs due to more recoverable heat from the process.
The H2 production rates with CaFe2O4 reduced with biomass were significantly higher than those achieved with the biomass steam gasification baseline tests in the absence of the OC. Biomass pellets with lower moisture content contributed to better H2 production rates than biomass wood chips. Chemical stability in short-term durations (25 cycles) was demonstrated with the OC material. Sub-pilot-scale testing showed promising results, indicating a greater improvement over baselines when compared with smaller-scale bench testing. Physical stability was assessed in sub-pilot-scale tests, in which an improvement in attrition resistance was observed with reactive cycling. This research shows that there is promise with the use of CaFe2O4 in two- and three-reactor approaches to create H2 from biomass. The limitations with the current work reside around the semi-batch limitations of the demonstration experiments. More work should be focused on adapting reactor capabilities to enable operations that more closely resemble the concepts outlined in the simulations. Testing that more closely resembles the circulating OC environment and continuous fuel feed are of significant importance to further scale and validate the concepts. Continuous operation will enable longer-duration testing to better assess long-term chemical and physical stability.

Supplementary Materials

The following supporting information can be downloaded at: https://www.mdpi.com/article/10.3390/biomass5020030/s1, Figure S1: Schematic of the fixed bed reactor used for CaFe2O4 and biomass tests. BPR—Back pressure regulator (a) Standard Flow configuration (b) Bypass mode used for biomass volatile injection studies and (c) bed loading configuration for biomass volatile injection studies (d) Detailed view of bypass/injection strategy. Figure S2: Effluent gas concentration profiles during the temperature ramp to 850 °C and 17% steam introduction at 850 °C with Biomass D wood chips (100–300 µm) (A) 3 g of wood chips Baseline (180–600 µm) (180–600 µm) (B) 3 g of wood chips with 9 g Ca Ferrite. Figure S3: Concentration profiles with 3 g Biomass D wood 100–600 microns 9 g CaFe2O4 heated to 850 °C without gas flow followed by 23% H2O and air 50% at 15 psi. Figure S4: 1 g of Biomass D pellets heated up to 850 °C and 17% steam addition at 850 °C. Figure S5: 1 g of Biomass D pellets and 9 g of CaFe2O4 heated up to 850 °C and 17% steam addition at 850 ° C. Figure S6: Gas concentration profiles of the base line test when 1 g of Biomass R wood chips heated up to 850 °C and 17% steam addition at 850 °C. Figure S7: Gas concentration profiles during Cycle 1 of 1 g of Biomass R wood chips and 9 g of CaFe2O4 heated up to 850 °C and 17% steam addition at 850 °C. Figure S8: Woody Biomass Pellet Fuel Average Plant capacity in USA in 2020. Table S1: Biomass Fuel Ultimate Analysis as a function of pyrolysis temperature. Table S2: Feed stock properties (a) Proximate and ultimate analysis of average densified biomass fuel composition and (b) detailed mass fraction breakdown used in simulations. Table S3: Stream Table for three-reactor LP integrated process. Table S4: Stream Table for two-reactor LP integrated process. Table S5: Stream Table for three-reactor HP integrated process. Table S6: Stream Table for two-reactor HP integrated process. Table S7: Comparison of process utility requirements for 3R approach at Low (2 atm) and High (6 atm) operating pressures. Table S8: Comparison of energy inputs and outputs for process case studies.

Author Contributions

R.S.—conceptualization and writing—review and editing, J.R.—formal analysis and validation, C.A.—investigation and data curation, M.B.—investigation and data curation. All authors have read and agreed to the published version of the manuscript.

Funding

This work was executed through the NETL Research and Innovation Center’s “Advanced reactor System” FWP.

Institutional Review Board Statement

Not applicable.

Informed Consent Statement

Nort applicable.

Data Availability Statement

The original contributions presented in this study are included in the article and Supplementary Materials. Further inquiries can be directed to the corresponding author.

Conflicts of Interest

The authors declare no conflicts of interest.

Disclaimer

This report was prepared as an account of work sponsored by an agency of the United States Government. Neither the United States Government nor any agency thereof, nor any of their employees, makes any warranty, express or implied, or assumes any legal liability or responsibility for the accuracy, completeness, or usefulness of any information, apparatus, product, or process disclosed, or represents that its use would not infringe privately owned rights. Reference therein to any specific commercial product, process, or service by trade name, trademark, manufacturer, or otherwise does not necessarily constitute or imply its endorsement, recommendation, or favoring by the United States Government or any agency thereof. The views and opinions of authors expressed therein do not necessarily state or reflect those of the United States Government or any agency thereof.

References

  1. Siriwardane, R.; Poston, J.; Monazam, E.; Richards, G. Production of hydrogen by steam oxidation of calcium ferrite reduced with various coals. Int. J. Hydrogen Energy 2019, 44, 7158–7167. [Google Scholar] [CrossRef]
  2. Monazam, E.; Siriwardane, R. Hydrogen production by steam oxidation of reduced CaFe2O4 during chemical looping coal gasification: Equilibrium and kinetic analysis. Energy Fuels 2018, 32, 10398–10407. [Google Scholar] [CrossRef]
  3. Osman, A.I.; Lai, Z.Y.; Farghali, M.; Yiin, C.L.; Elgarahy, A.M.; Hammad, A.; Ihara, I.; Al-Fatesh, A.S.; Rooney, D.W.; Yap, P.-S. Optimizing biomass pathways to bioenergy and biochar application in electricity generation, biodiesel production, and biohydrogen production. Env. Chem. Lett. 2023, 21, 2639–2705. [Google Scholar] [CrossRef]
  4. Tursi, A. A review on biomass: Importance, chemistry, classification, and conversion. Biofuel Res. J. 2019, 22, 962–979. [Google Scholar] [CrossRef]
  5. Gao, N.; Li, A.; Quan, Q.; Qu, Y.; Mao, L. Characteristics of hydrogen rich production of biomass gasification with porous ceramic reforming. Int. J. Hydrogen Energy 2012, 37, 9610–9618. [Google Scholar] [CrossRef]
  6. Dai, J.; Saayman, J.; Grace, J.R.; Ellis, N. Gasification of woody biomass. Rev. Chem. Biomol. Eng. 2015, 6, 77–99. [Google Scholar] [CrossRef] [PubMed]
  7. McKendry, P. Energy production from biomass (part 1): Overview of biomass. Bioresour. Technol. 2002, 83, 37–46. [Google Scholar] [CrossRef]
  8. Thanapal, S.S.; Annamalai, K.; Sweeten, J.M.; Gordillo, G. Fixed bed gasification of dairy biomass with enriched air mixture. Appl. Energy 2012, 97, 525–531. [Google Scholar] [CrossRef]
  9. Clark Energy. Efficient Distributed Generation. Clark Energy. December 2023. Available online: https://www.clarke-energy.com/us/usa/ (accessed on 15 December 2023).
  10. ARGE Kompetenznetzwerk Energie aus Biomasse. RNET—Strem (archive.org). Renewable Energy Network Austria. 2006. Available online: https://web.archive.org/web/20070912062738/http:/www.renet.at/english/sites/strem.php (accessed on 20 January 2024).
  11. IEA Bioenergy. Bioenergy 2020+ IEA Bioenergy. 17 January 2017. Available online: https://web.archive.org/web/20180330110041/http:/www.ficfb.at/ (accessed on 15 December 2023).
  12. Gussing Renewable Energy. Technology. Gussing Renewable Energy. 13 June 2018. Available online: https://web.archive.org/web/20180613112503/http:/gussingcleanenergy.com/technology/ (accessed on 15 December 2023).
  13. DRAX. 6-Start-Ups-Ideas-Power-Plants-Shaping-Biomass DRAX. June 2018. Available online: https://www.drax.com/us/sustainable-bioenergy/6-start-ups-ideas-power-plants-shaping-biomass/ (accessed on 15 December 2023).
  14. Worley, M.; Yale, J. Biomass Gasification Technology Assessment: Consolidated Report; NREL: Golden, CO, USA, 2012. [Google Scholar]
  15. Spath, P.; Aden, A.; Eggeman, T.; Ringer, M.; Wallace, B.; Jechura, J. Biomass to Hydrogen Production Detailed Design and Economics Utilizing the Battelle Columbus Laboratory Indirectly-Heated Gasifier; NREL: Golden, CO, USA, 2005. [Google Scholar]
  16. Tremel, A.; Gaderer, M.; Spliethoff, H. Small-scale production of synthetic natural gas by allothermal biomass gasification. Int. J. Energy Res. 2013, 37, 1318–1330. [Google Scholar] [CrossRef]
  17. Thunman, H.; Gustavsson, C.; Larsson, A.; Gunnarsson, I.; Tengberg, F. Economic assessment of advanced biofuel production via gasification using cost data from the GoBiGas plant. Energy Sci. Eng. 2019, 7, 217–229. [Google Scholar] [CrossRef]
  18. Ge, H.; Guo, W.; Shen, L.; Song, T.; Xiao, J. Biomass gasification using chemical looping in a 25 kWth reactor with natural hematite as oxygen carrier. Chem. Eng. J. 2016, 286, 174–183. [Google Scholar] [CrossRef]
  19. Xue, N.; Wang, Z.; Wu, J.; He, T.; Zhang, J.; Lia, J.; Wu, J. Effect of equivalence ratio on the CO selectivity of Fe/Ca-based oxygen carriers in biomass char chemical looping gasification. Fuel 2019, 252, 220–227. [Google Scholar] [CrossRef]
  20. Xu, C.; Chen, S.; Soomro, A.; Sun, Z.; Xiang, W. Hydrogen rich syngas production from biomass gasification using synthesized Fe/CaO active catalysts. J. Energy Inst. 2018, 91, 805–816. [Google Scholar] [CrossRef]
  21. Hu, Q.; Shen, Y.; Chew, J.W.; Ge, T.; Wang, C.-H. Chemical looping gasification of biomass with Fe2O3/CaO as the oxygen carrier for hydrogen-enriched syngas production. Chem. Eng. J. 2020, 379, 122346. [Google Scholar] [CrossRef]
  22. Niu, P.; Ma, Y.; Tian, X.; Ma, J.; Zhao, H. Chemical looping gasification of biomass: Part, I. screening Cu-Fe metal oxides as oxygen carrier and optimizing experimental conditions. Biomass Bioenergy 2018, 108, 146–156. [Google Scholar] [CrossRef]
  23. Liu, G.; Liao, Y.; Wu, Y.; Ma, X. Enhancement of Ca2Fe2O5 oxygen carrier through Mg/Al/Zn oxide support for biomass chemical looping gasification. Energy Convers. Manag. 2019, 195, 262–273. [Google Scholar] [CrossRef]
  24. Udomsirichakorn, J.; Salam, P. Review of H2 enriched gas production from steam gasification of biomass: The prospect of CaO-based chemical looping gasiffication. Renew. Sustain. Energy Rev. 2014, 30, 565–579. [Google Scholar] [CrossRef]
  25. Wang, K.; Yu, Q.; Qin, Q.; Hou, L.; Duan, W. Thermodynamic analysis of syngas generation from biomass using chemical looping gasification method. Int. J. Hydrogen Energy 2016, 41, 10346–10353. [Google Scholar] [CrossRef]
  26. Huang, Z.; He, F.; Zhu, H.; Chen, D.; Zhao, K.; Wei, G.; Feng, Y.; Zheng, A.; Zhao, Z.; Li, H. Thermodynamic analysis and thermogravimetric investigation on chemical looping gasification of biomass char under different atmospheres with Fe2O3 oxygen carrier. Appl. Energy 2015, 157, 546–553. [Google Scholar] [CrossRef]
  27. Condori, O.; Garcia-Labiano, F.; de Diego, L.F.; Izquierdo, M.T.; Abad, A.; Adanez, J. Biomass chemical looping gasification for syngas production using ilmenite as oxygen carrier in a 1.5 KWth unit. Chem. Eng. J. 2021, 405, 126679. [Google Scholar] [CrossRef]
  28. Lui, Q.; Hu, C.; Liu, C.; Li, Z.; Wu, K.; Zhang, H.; Xiao, R. High H2/CO ratio syngas production from chemical looping co-gasification of biomass and polyethylene with CaO/Fe2O3 oxygen carrier. Energy Convers. Manag. 2019, 199, 111951. [Google Scholar]
  29. Wei, G.; He, F.; Zhao, Z.; Huang, Z.; Zheng, A.; Zhao, K.; Li, H. Performance of Fe-Ni bimetallic oxygen carriers for chemical looping gasification of biomass in a 10 Kwth interconnected circulating fluidized bed reactor. Int. J. Hydrogen Energy 2015, 40, 16021–16032. [Google Scholar] [CrossRef]
  30. Huseyin, S.; Wei, G.; Li, H.; He, F.; Huang, Z. Chemical looping gasification of biomass in a 10 kwth interconnected fluidized bed reactor using Fe2O3/Al2O3 oxygen carrier. J. Fuel Chem. Technol. 2014, 42, 922–931. [Google Scholar] [CrossRef]
  31. Huang, Z.; He, F.; Feng, Y.; Zhao, K.; Zheng, A.; Chang, S.; Li, H. Synthesis gas production through biomass direct chemical looping conversion with natural hematite as an oxygen carrier. Bioresour. Technol. 2013, 140, 138–145. [Google Scholar] [CrossRef]
  32. Park, C.; Joshi, R.K.; Falascino, E.; Pottimurthy, Y.; Xu, D.; Wang, D.; Sunny, A.; Hwang, S.; Joshi, A.S.; Mohapatra, P.; et al. Biomass gasification: Sub-pilot operation of >600 h with extensive tar cracking property and high purity syngas production at H2:CO ratio ~2 using moving bed redox looping technology. Fuel Process. Technol. 2023, 252, 107966. [Google Scholar] [CrossRef]
  33. Luo, M.; Yi, Y.; Wang, S.; Wang, Z.; Du, M.; Pan, J.; Wang, Q. Review of hydrogen production using chemical looping technology. Renew. Sustain. Energy Rev. 2018, 81, 3186–3214. [Google Scholar] [CrossRef]
  34. Hurst, S. Production of hydrogen by the steam-iron method. J. Am. Oil Chem. Soc. 1939, 16, 29–36. [Google Scholar] [CrossRef]
  35. Tong, A.; Sridhar, D.; Sun, Z.; Kim, H.; Zeng, L.; Wang, F.; Wang, D.; Kathe, M.; Luo, S.; Sun, Y.; et al. Continuous high purity hydrogen generation from a syngas chemical looping 25 kWth sub-pilot unit with 100% carbon capture. Fuel 2012, 103, 495–505. [Google Scholar] [CrossRef]
  36. Li, F.; Zeng, L.; Fan, L.-S. Techno-economic analysis of coal-based hydrogen and electricity cogeneration processes with CO2 capture. Ind. Eng. Chem. Res. 2010, 49, 11018–11028. [Google Scholar] [CrossRef]
  37. Aziz, M.; Zaini, I.; Oda, T.; Morihara, A.; Kashiwagi, T. Energy conservative brown coal conversion to hydrogen and power based on enhanced process integration: Integrated drying, coal direct chemical looping, combined cycle and hydrogenation. Int. J. Hydrogen Energy 2017, 42, 2904e13. [Google Scholar] [CrossRef]
  38. Liu, T.; Hu, S.; Yu, Z.; Huang, J.; Li, J.; Wang, Z.; Fang, Y. Research of coal-direct chemical looping hydrogen generation with ironbased oxygen carrier modified by potassium. Int. J. Hydrogen Energy 2017, 42, 11038–11046. [Google Scholar] [CrossRef]
  39. Riley, J.; Bobek, M.; Atallah, C.; Siriwardane, R.; Bayham, S. Syngas and H2 production from natural gas using CaFe2O4—Looping: Experimental and thermodynamic integrated process assessment. Int. J. Hydrogen Energy 2023, 48, 29898–29915. [Google Scholar] [CrossRef]
  40. Debiagi, P.; Gentile, G.; Cuoci, A.; Frassoldati, A.; Ranzi, E.; Faravelli, T. A predictive model of biochar formation and characterization. J. Anal. Appl. Pyrolysis 2018, 134, 326–335. [Google Scholar] [CrossRef]
  41. Di Blasi, C.; Signorelli, G.; Di Russo, C.; Rea, G. Product Distribution from Pyrolysis of Wood and Agricultural Residues. Ind. Eng. Chem. Res. 1999, 38, 2216–2224. [Google Scholar] [CrossRef]
  42. Riley, J.; Atallah, C.; Siriwardane, R.; Poston, J. Rate expressions and kinetic parameters for metal ferrites in relation to applications of fossil fuel conversion to hydrogen: Part 1 of 2. Chem. Eng. J. 2025, 513, 162758. [Google Scholar] [CrossRef]
  43. D5757-11; Standard Test Method for Determination of Attrition of FCC Catalyst by Air Jets. ASTM International: West Conshohocken, PA, USA, 2011; pp. 1–3.
  44. da Silva, S.B.; Arantes, M.D.C.; de Andrade, J.K.B.; Andrade, C.R.; de Cássia Oliveira Carneiro, A.; de Paula Protásio, T. Influence of physical and chemical compositions on the properties and energy use of lignocellulosic biomass pellets in Brazil. Renew. Energy 2020, 147, 1870–1879. [Google Scholar] [CrossRef]
  45. Stetle, W.; Sanadi, A.; Shang, L.; Holm, J.; Ahrenfeldt, J.; Heneriksen, U. Recent Developments in Biomass Pelletization—A Review. BioResources 2012, 7, 4451–4490. [Google Scholar]
  46. Zhang, X.; Yang, S.; Xie, X.; Chen, L.; Sun, L.; Zhao, B.; Si, H. Stoichiometric synthesis of Fe/CaxO catalysts from tailored layered double hydroxide precursors for syngas production and tar removal in biomass gasification. J. Anal. Appl. Pyrolysis 2016, 120, 371–378. [Google Scholar] [CrossRef]
  47. Shen, Y.; Yoshikawa, K. Recent progresses in catalytic tar elimination during biomass gasification or pyrolysis—A review. Renew. Sustain. Energy Rev. 2013, 21, 371–392. [Google Scholar] [CrossRef]
  48. Zeng, J.; Hua, J.; Qiu, Y.; Zhang, S.; Zenga, D.; Xiao, R. Multi-function of oxygen carrier for in-situ tar removal in chemical looping gasification: Naphthalene as a model compound. Appl. Energy 2019, 253, 113502. [Google Scholar] [CrossRef]
  49. Kostyniuk, A.; Grilc, M.; Likozar, B. Catalytic Cracking of Biomass-Derived Hydrocarbon Tars or Model Compounds To Form Biobased Benzene, Toluene, and Xylene Isomer Mixtures. Ind. Eng. Chem. Res. 2019, 58, 7609–7705. [Google Scholar] [CrossRef]
  50. Virginie, M.; Adanez, J.; Courson, C.; de Diego, L.; Garcia-labiano, F.; Niznansky, D.; Kiennemann, A.; Gayan, P.; Abad, A. Effect of fe-olivine on tar content during biomass gasification in a dual fluidized bed. Appl. Catal. B Environ. 2012, 121–122, 214–222. [Google Scholar] [CrossRef]
  51. Siriwardane, R.; Riley, J.; Atallah, C. CO2 utilization potential of a novel calcium ferrite based looping process fueled with coal: Experimental evaluation of various coal feedstocks and thermodynamic integrated process analysis. Appl. Energy 2022, 323, 119634. [Google Scholar] [CrossRef]
  52. Riley, J.; Siriwardane, R.; Tian, H.; Benincosa, W.; Poston, J. Kinetic analysis of the interactions between calcium ferrite and coal char for chemical looping gasification applications: Identifying reduction routes and modes of oxygen transfer. Appl. Energy 2017, 201, 94–110. [Google Scholar] [CrossRef]
  53. B. Magazine. Pellet Mill List. BBI International. 22 May 2024. Available online: https://biomassmagazine.com/plants/list/pellet-mill (accessed on 22 May 2024).
  54. Sjoding, D.; Kanoa, E.; Jensen, P. Developing a Wood Pellet/Densified Biomass Industry in Washington State: Opportunities and Challenges; Washington State University Extension Energy Program, Olympia: Pullman, WA, USA, 2013. [Google Scholar]
  55. Kathe, M.; Empfield, A.; Na, J.; Blair, E.; Fan, L.-S. Hydrogen production from natrual gas using an iron-based chemical looping technology: Thermodynamic simulations and process system analysis. Appl. Energy 2016, 165, 183–201. [Google Scholar] [CrossRef]
  56. Mann, M.S.P. Life Cycle Assessment of a Biomass Gasification Combined-Cycle Power System; NREL: Golden, CO, USA, 1997. [Google Scholar]
  57. Spath, P.; Mann, M.; Amos, W. Update of Hydrogen from Biomass—Determination of the Delivered Cost of Hydrogen; NREL: Golden, CO, USA, 2003. [Google Scholar]
Figure 1. H2 production process using biomass and oxygen carriers.
Biomass 05 00030 g001
Figure 2. Solid Fuel Fluid Bed Reactor (SFFBR) simplified process flow diagram.
Biomass 05 00030 g002
Figure 3. Effluent gas concentration profiles during the temperature ramp to 850 °C and 17% steam introduction at 850 °C with biomass D wood chips (100–300 µm): (a) 1 g of wood chips baseline, (b) 1 g of wood chips with 9 g of CaFe2O4 (180–600 µm), and (c) molar production rates of H2, CH4, CO, and CO2 during the steam exposure segment, where “C3R” refers to the experiment with CaFe2O4 in the three-reactor mode. (d) Cumulative molar outputs for test cases.
Biomass 05 00030 g003aBiomass 05 00030 g003b
Figure 4. 25 cycle tests data—(a) H2 concentration data at 850 °C during steam oxidation with 17% steam of CaFe2O4 reduced with biomass B wood chips. (b) Mole composition profiles during the temperature ramp, steam oxidation, and air oxidation at 850 °C of cycle 25 with biomass D chips and CaFe2O4.
Biomass 05 00030 g004
Figure 5. Twenty-cycle reactivity endurance test outcomes at 6.5 atm (95PSIG) 850 °C. (a) H2 concentration during the 20-cycle test and 20% steam oxidation with 9 g CaFe2O4 reduced with 1 g biomass D (b). Gas concentration data at cycle 20.
Biomass 05 00030 g005
Figure 6. Parametric impacts of pyrolysis volatiles injection into CaFe2O4 at 850 °C: (a) effect of pressure and temperature on the H2 production with CaFe2O4 and biomass D during steam (23%) oxidation and (b) mole composition at various reaction segments of CaFe2O4 and biomass D after temperature ramp without gas flow.
Biomass 05 00030 g006
Figure 7. Mole composition of reaction of volatiles from 3 g biomass D (600–1700 μm) with 9 g CaFe2O4 (180–600 μm), at 850 °C and 100–200 SCCM (τ = 1.8 and 0.9 sec).
Biomass 05 00030 g007
Figure 8. Multicycle performance evaluation with biomass R wood chips: (a) H2 concentration during 17% steam oxidation at 850 °C and (b) moles of gases produced during cycle 25.
Biomass 05 00030 g008
Figure 9. TGA weight data of biomass D and R during pyrolysis and char oxidation.
Biomass 05 00030 g009
Figure 10. Multicycle performance evaluation with AWP wood pellets: (a) 25-cycle H2 concentration data at 850 °C during steam oxidation with 20% steam and (b) mole composition at various reaction segments of CaFe2O4 and biomass AWP pellets during the 25th cycle.
Biomass 05 00030 g010
Figure 11. Reactivity performance evaluation of configuration 1 and 2 of sub-pilot unit: (a) gas concentrations during fuel addition, steam addition, and air addition steps to CaFe2O4, (b) H2 molar production rates and cumulative carbon balances, (c) gas mole composition during fuel addition and steam addition steps, and (d) H2 yield and generation rates for comparison.
Biomass 05 00030 g011
Figure 12. Particle size distribution of fresh CaFe2O4 and after sub-pilot-scale tests.
Biomass 05 00030 g012
Figure 13. ASTM D5757 attrition data for fresh CaFe2O4 and after sub-pilot-scale tests.
Biomass 05 00030 g013
Figure 14. X-ray diffraction data of data fresh CaFe2O4 and after sub-pilot-scale tests. CaFe2O4 ICDD Reference code: 04-007-8642, Fe2O3 ICDD Ref Code: 04-003-2900.
Biomass 05 00030 g014
Figure 15. Effluent gas production rates (a) when steam was introduced at 300 °C with quartz baseline and CaFe2O4/wood pellets in the two-reactor mode “C2R” during the temperature ramp to 850 °C. (b) Moles of gases produced in the reaction segments of the experiments.
Biomass 05 00030 g015
Figure 16. CL process configuration block flow diagrams: (a) three-reactor process integration concept for in-direct conversion of biomass to H2 through steam water splitting and (b) two-reactor integration concept for direct conversion of biomass to H2 through syngas generation.
Biomass 05 00030 g016
Table 1. Proximate and ultimate analysis of biomass feedstocks.
Proximate and Ultimate Analysis of Biomass Feedstocks
AnalysisComponent (%wt.)Biomass R—Wood ChipsBiomass D—Wood ChipsBiomass D—Wood PelletsBiomass AWP Pellets
Proximate (As Received)%Moisture15.9528.686.854.56
%Ash0.20.21.40.57
%Vol. Matter43.943.976.382.12
%Fixed Char39.9527.2215.4512.75
Ultimate (Dry Basis)%Ash0.20.21.40.57
%Carbon50.1649.0649.5948.88
%Hydrogen5.855.755.086.02
%Nitrogen0.710.5600.07
%Total Sulfur0.830.790.690.01
%Oxygen (diff)42.2543.6443.2444.45
Table 2. XRD data of CaFe2O4 reacted with biomass D at various reactions steps (reduction—temperature ramp with biomass D to 850 °C, steam oxidation—23% steam introduction at 850 °C, air oxidation—oxidation with 50% air).
Sample NameCaFe2O4Ca2Fe2O5CaFe3O5CaFe5O7FeOFeFe3O4Fe2O3
1. Fresh84.5%15.5%
2. Reduction—no gas flow Section 3.5 82.3% 9.5%8.2%
3. Steam oxid. after step 2 45.0%52.0% 3.0%
4. Air oxid. after step 377.2%22.8%
5. Reduction with gas flow (100 SCCM) 55.9%27.9%15.8% 0.4%
6. Steam oxid. After step 5 43.8%55.7% 0.5%
7. Air oxid. After step 676.3%23.7%
9. Reduction with biomass volatiles only—200 SCCM 40.25%59.6% 0.05
10. Reduction with biomass volatiles only—100 SCCM 35.5%51.5% 12%
Table 3. XRD data of CaFe2O4 reacted with biomass R at various reactions steps (Section 3.7): reduction—temperature ramp with biomass R to 850 °C with a gas flow, steam oxidation—23% steam introduction at 850 °C, air oxidation—oxidation with 50% air.
Sample NameCaFe2O4Ca2Fe2O5CaFe3O5CaFe5O7FeOFe
Reduction with gas flow 67.8%31.6% 0.2%0.5%
Steam oxidation 41.9%58.1%
Air oxidation68.8%31.2%
Table 4. TGA derivative weights and corresponding temperatures during pyrolysis and char oxidation temperature ramps.
Biomass RBiomass D
Derivative Weight (%/min)Temperature °CDerivative Weight (%/min)Temperature °C
1.7 (pyrolysis step)601.770
9.5 (pyrolysis step)3559.9358
1.9 (oxidation step)4712.0523
Table 5. Major operating parameters of two- and three-reactor CL approaches under study.
Major Operating Parameter2R-LP2R-HP3R-LP3R-HPBaseline
FR/SG Temperature, Inlet Pressure 914 °C, 2 atm914 °C, 6 atm932 °C, 2 atm932 °C, 6 atm890 °C, 1.25 atm
SR Temperature, Inlet pressureNANA931 °C, 2 atm931 °C, 6 atmN/A
AR Temperature, Inlet pressure950 °C, 2 atm950 °C, 6 atm950 °C, 2 atm950 °C, 6 atm980 °C, 1.25 atm
CaFe2O4 Circulation Rate [kmol/h]11,282.511,282.528,578.128,578.1N/A (Olivine)
Table 6. Process performance metrics of two- and three-reactor CL approaches to baseline biomass gasification.
Metric2R-Biomass-LP (2 atm)2R-Biomass-HP (6 atm)3R-Biomass-LP (2 atm)3R-Biomass-HP (6 atm)Baseline Biomass Gasification (~2 atm)
FuelBiomassBiomassBiomassBiomassBiomass
H2 yield (kg/kg fuel)0.10250.10230.10410.10440.0741
Biomass converted to H29.02 kg Biomass/kg H29.02 kg Biomass/kg H28.267 kg Biomass/kg H28.267 kg Biomass/kg H210.66 kg Biomass/kg H2
Biomass required for heating0.731 kg Biomass/kg H20.756 kg Biomass/kg H21.336 kg Biomass/kg H21.311 kg Biomass/kg H22.83 kg Biomass/kg H2
Total biomass required9.751 kg Biomass/kg H29.776 kg Biomass/kg H29.603 kg Biomass/kg H29.578 kg Biomass/kg H213.49 kg Biomass/kg H2
Industrial Electricity Usage (kWh/kg H2)4.934.696.66.1546.91
Industrial Electricity Generation (kWh/kg H2)4.2254.2736.8536.63065.14
Net Electricity Usage (kWh/kg H2)0.6950.417(0.253)(0.4766)1.76
Process Water Usage (gal/kg H2)0.9940.92571.0110.9711.92
Table 7. Densified and non-densified biomass feedstock analysis used to inform simulations in moisture impact case studies.
AnalysisComponent (%wt.)Wood ChipsWood Pellets
Proximate%Moisture28.686.85
%Ash0.21.4
%Vol. Matter43.976.3
%Fixed Char27.2215.45
Ultimate (Dry basis)%Ash0.21.4
%Carbon49.0649.59
%Hydrogen5.755.08
%Nitrogen0.560
%Total Sulfur0.790.69
%Oxygen (diff)14.9636.39
Table 8. Process performance metrics of three0reactor CL approaches with wood biomass feedstocks of different moisture content.
Metric3R-Biomass-LP
w/Low Moisture Content Feedstock
3R-Biomass-LP
w/High Moisture Content Feedstock
FuelDensified BiomassRaw Biomass
H2 yield (kg/kg fuel)0.10410.0749
Biomass converted to H28.267 kg Biomass/kg H210.827 kg Biomass/kg H2
Biomass required for heating1.336 kg Biomass/kg H22.494 kg Biomass/kg H2
Total Biomass Required9.603 kg Biomass/kg H213.321 kg Biomass/kg H2
Industrial Electricity Usage (kWh/kg H2)6.67.06
Industrial Electricity Generation (kWh/kg H2)6.8537.918
Net Electricity Usage (kWh/kg H2)(0.253)(0.8578)
Process Water Usage (gal/kg H2)1.0110.1715
Disclaimer/Publisher’s Note: The statements, opinions and data contained in all publications are solely those of the individual author(s) and contributor(s) and not of MDPI and/or the editor(s). MDPI and/or the editor(s) disclaim responsibility for any injury to people or property resulting from any ideas, methods, instructions or products referred to in the content.

