
Article

High-Field Magnetoresistance and Hall Effect of a Nanocrystalline Ni Metal at 3 K and 300 K

1
Institute for Solid State Physics and Optics, HUN-REN Wigner Research Centre for Physics, Konkoly-Thege Miklós út 29-33, H-1121 Budapest, Hungary
2
Walther-Meißner-Institute for Low Temperature Research, Bavarian Academy of Sciences and Humanities, Walther-Meißner-Straße 8, D-85748 Garching, Germany
3
Department of Physics, Faculty of Science, University of Zagreb, Bijenička cesta 32, 10000 Zagreb, Croatia
*
Author to whom correspondence should be addressed.
Current address: Bosch Hausgeräte GmbH, 81739 Munich, Germany.
Magnetism 2026, 6(2), 19; https://doi.org/10.3390/magnetism6020019
Submission received: 4 March 2026 / Revised: 24 April 2026 / Accepted: 30 April 2026 / Published: 31 May 2026

Abstract

In a previous paper, in-plane magnetoresistance results were reported on a thin strip-shaped foil sample of nanocrystalline (nc) Ni metal. These studies have now been complemented by a measurement of the temperature dependence of the resistivity as well as the field dependence of the resistivity and the Hall effect on the same sample at 3 K and 300 K in polar magnetic fields up to 140 kOe, i.e., with the magnetic field perpendicular to the strip plane. Due to the strong contribution of grain-boundary scattering in the nc state, the residual resistivity was about 11% of the room-temperature value. The polar magnetoresistance (PMR) showed similar behavior to the previously reported transverse magnetoresistance (TMR), yielding an anisotropic magnetoresistance (AMR) value in good agreement with the AMR previously deduced from the in-plane MR data. As to the Hall effect, the results for the ordinary (Ro) and the anomalous (Rs) Hall coefficient fitted rather well with the rather dispersed reported data of bulk Ni at both temperatures. However, a closer look at the Rs values for nc-Ni revealed that at 300 K it is larger and at 3 K it is smaller than the corresponding bulk Ni values obtained on samples with the same zero-field resistivity as our nc-Ni foil. These deviations may be attributed to the nanocrystalline state containing a large density of grain boundaries.

1. Introduction

In a previous paper [1], magnetoresistance (MR) results were reported on a thin strip-shaped foil sample of nanocrystalline (nc) Ni metal up to H = 140 kOe magnetic field at 3 K and 300 K. In that study, both the longitudinal MR (LMR) and transverse MR (TMR) components were measured by using an in-plane magnetic field oriented either parallel (LMR) or perpendicular (TMR) to the measuring current flow direction. From an analysis of these data, the anisotropic magnetoresistance (AMR) parameters were extracted for both temperatures.
These results will now be complemented by MR data on the same nc-Ni sample obtained with a magnetic field perpendicular to the strip plane (polar magnetoresistance, PMR). We also report on the temperature dependence of the zero-field resistivity between 3 K and 300 K.
As an extension of these studies, the Hall effect was also measured on this nc-Ni foil. This was considered to be of interest because although the Hall effect has been intensively investigated on Ni metal both experimentally and theoretically (for some references, see the reviews by Jan [2] and Nagaosa et al. [3]), these studies were mainly performed either on bulk Ni samples in a well-annealed state, i.e., with large grain sizes, or on thin films. The latter films were probably nanocrystalline, but, at the same time, due to their thinness, their transport properties were certainly also influenced by surface scattering effects. On the other hand, from the viewpoint of electronic transport, the present nc-Ni sample is of macroscopic size with a thickness of 9 μm, and thus the electron transport processes are not affected by surface scattering effects. In this manner, the influence of a significant contribution of grain-boundary scattering due to the small grain size on the Hall effect can be studied.
Because we have measured the Hall effect at two selected temperatures only, in order to put our nc-Ni Hall effect results in perspective in comparison with available findings on bulk Ni data, an extensive literature search was carried out for corresponding earlier reports on Ni metal. First, it should be noted that no previous report has been found in which the Ni sample was characterized for microstructure, especially for crystallite size (deducible from X-ray diffraction) or grain size (directly observable through transmission electron microscopy). In several reports, high-temperature annealing was carried out, which definitely resulted in a coarse-grained structure, so the results for such Ni samples can be considered as corresponding to bulk Ni, provided the purity was also sufficiently high, which was also not always documented. Similarly, in thin film studies, microstructural details, such as crystallite size, were not reported. As described in Section 2, our nc-Ni sample was properly characterized in our previous studies both for purity and microstructure.
As to the Hall effect itself in Ni metal, the basic mechanisms contributing to the observed results have already been established in previous studies and are properly summarized in reviews [2,3]. Our overview of Hall effect data on Ni metal, especially for the anomalous Hall effect (AHE), will reveal, on the other hand, that there is still significant scattering of the reported results for pure bulk Ni, which points to the necessity of new investigations for determining the true Hall coefficients of Ni metal on a well-characterized bulk sample over the whole temperature range from the liquid He range up to the Curie point. At the same time, this overview will provide a basis upon which we can compare the Hall effect data for our nc-Ni metal. From this, we can make some conclusions concerning the possible influence of grain boundaries on Hall effect parameters. Our observations seem to indicate deviations from the known bulk behavior, requiring more detailed investigations extending to smaller grain sizes and a wider range of temperatures than those reported in the present paper.
The paper is organized as follows. In Section 2, the investigated nc-Ni sample and the measurement techniques will be presented. The experimental results for the temperature dependence of the resistivity for magnetotransport and the Hall effect of the sample are described and discussed in Section 3, Section 4 and Section 5, respectively. A summary of the present results will be given in Section 6. In an Appendix, the available Hall effect data on Ni metal are tabulated.

2. Materials and Methods

The results of resistivity and magnetotransport measurements presented here were obtained on a strip-shaped thin foil sample. For this purpose, a Ni foil (sample #B2 of Refs. [1,4]) with 9 μm thickness was produced through electrodeposition according to the method described in Ref. [5]. Deposition was performed on a polished Ti sheet from which the Ni foil could be mechanically peeled off. Detailed structural characterization of this sample is described in Ref. [4], according to which the microstructure was a nanocrystalline with an average crystallite size of about 75 nm.
A strip of about 1 mm wide and about 5 mm long was cut from the Ni foil. For the transport measurements with a four-point probe, spot-welded contacts were attached to the strip-shaped sample. About a dozen contact wires at both ends of the strip provided a homogeneous current flow along the strip length. Contact wires were attached at both long edges of the strip to measure the voltage drop along the strip length. By measuring the positions of the voltage wires along the strip, the resistivity of the measured section could also be determined. In the PMR measurement, the MR ratio was defined with the formula MR(H) = ΔR(H)/Rp = [R(H) − Rp]/Rp, where R(H) is the resistance measured in a magnetic field H and Rp is the resistance peak value close to zero magnetic field.
By measuring the voltage drop across the strip, i.e., between contacts at both edges of the strip, which were positioned at the same length position, the Hall voltage was obtained.
For the resistance measurements, a d.c. current with alternating signs was applied, and the resulting d.c. voltage was recorded with a nanovoltmeter. The resistance probe could be inserted into the cryostat of a superconducting magnet with magnetic fields up to 140 kOe. In the cryostat, the sample temperature could be varied from 3 K to 300 K.

3. Temperature Dependence of the Resistivity

Recently, we reported [4] that the room-temperature resistivity of this nc-Ni foil (sample #B2) was found to be ρ = 8.78 μΩ cm. This is larger than the standard value of coarse-grained bulk Ni (ρ = 7.24 μΩ cm [6,7]).
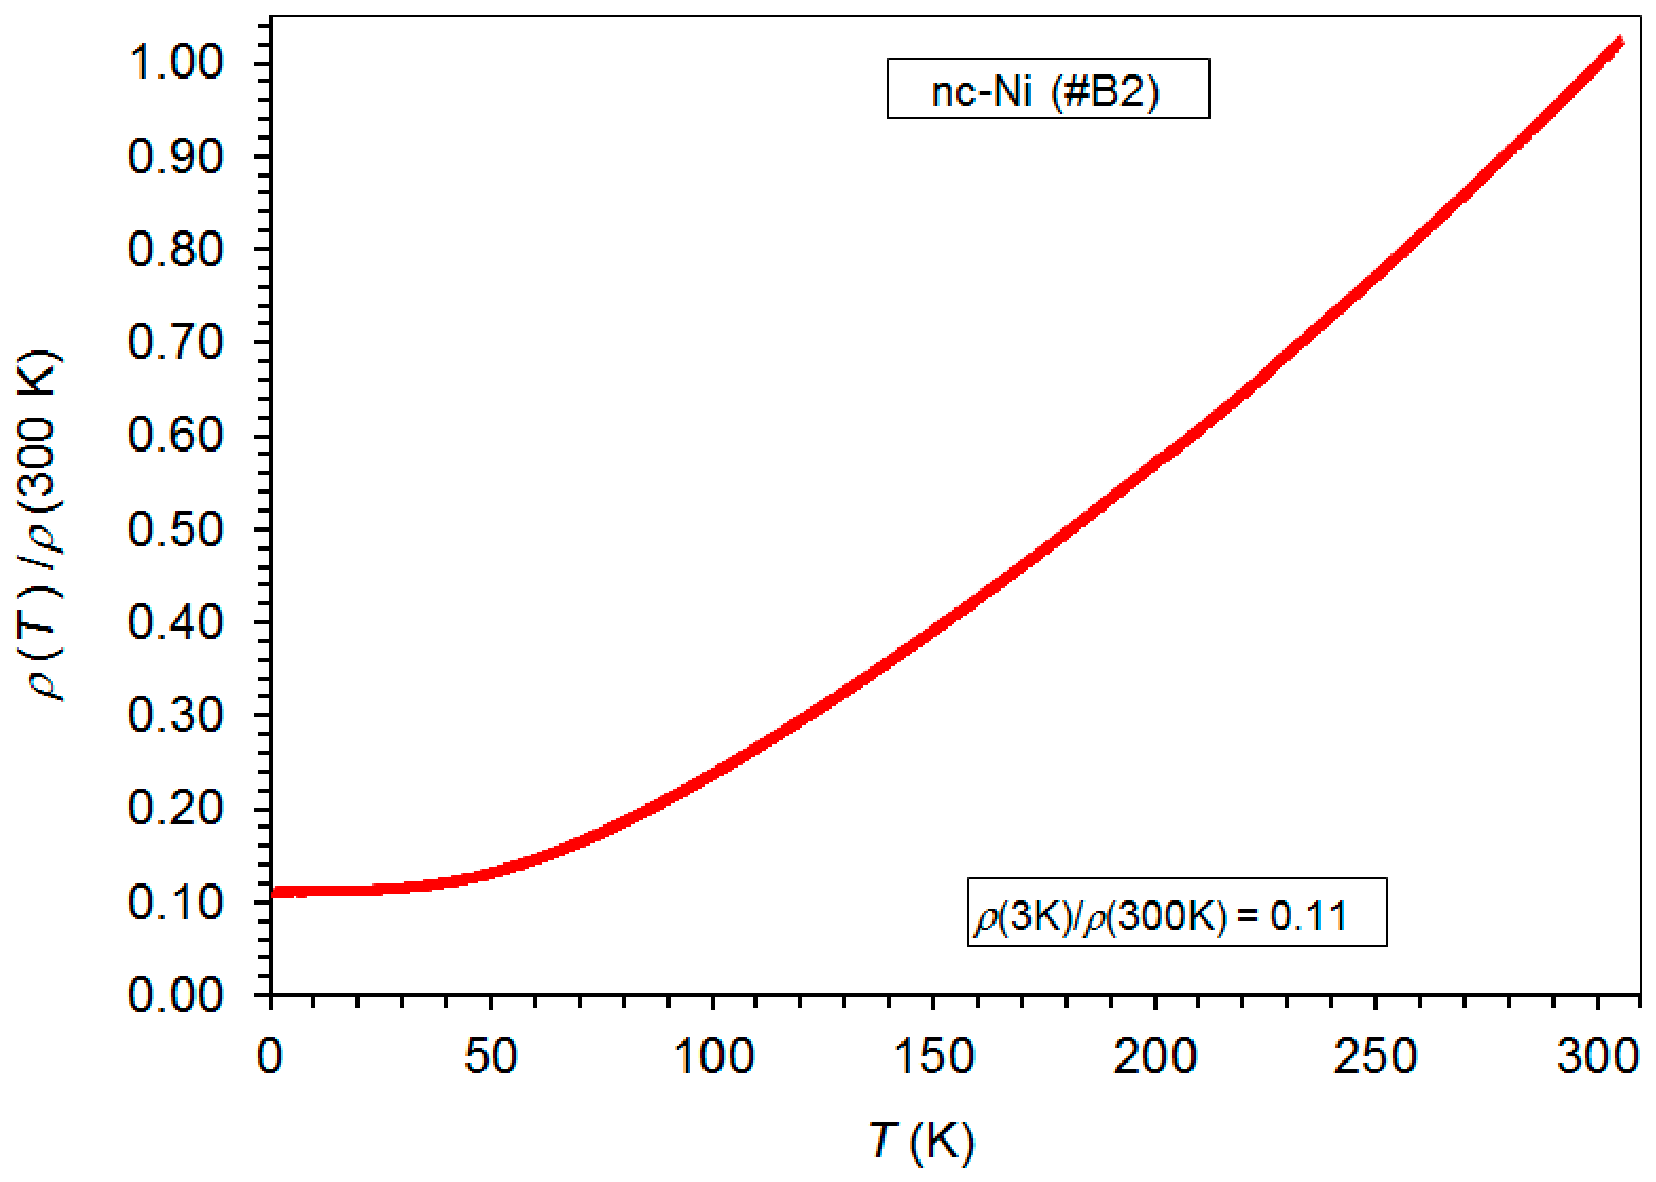
The temperature dependence of the resistivity of nc-Ni measured from 3 K to 300 K in zero magnetic field and normalized to the room-temperature value is displayed in Figure 1.
According to the data in Figure 1, the residual resistivity of the nc-Ni foil with a crystallite size of 75 nm is about 11% of the room-temperature resistivity. This is in compliance with our previous study [8] in which we reported residual resistivities of about 40% of the room-temperature values for electrodeposited Ni foils with estimated crystallite sizes of about 30 to 50 nm. The finite residual resistivity of a nanocrystalline metal is due to the fact that there is some degree of structural disorder in the grain boundaries, which represents scattering objects for the conduction electrons [4,8]. If the density of grain boundaries is large enough, as in the nanocrystalline state, scattering on grain boundaries can yield a significant contribution to the resistivity even in the absence of phonon scattering at low temperatures. This extra scattering on grain boundaries is also present at elevated temperatures, and it was demonstrated in an extended room-temperature study on nc-Ni metal [4] that the grain-boundary contribution to the resistivity increases with decreasing crystallite size. Thus, grain-boundary scattering gives a larger and larger contribution to resistivity as the crystallite size is reduced down to below a few 100 nanometers [4]. Finally, this will be the only resistivity contribution at very low temperatures, giving rise to a finite residual resistivity also in nc-Ni.

4. Magnetoresistance in Out-of-Plane Magnetic Fields at T = 3 K and 300 K

Because in both the transverse (TMR) and polar (PMR) configurations the current flow is in the plane of the foil strip and the magnetic field is in both cases perpendicular to the measuring current (TMR: in-plane (IP) magnetic field; PMR: out-of-plane (OP) magnetic field), it is reasonable to present the PMR(H) data in comparison with the TMR(H) data.
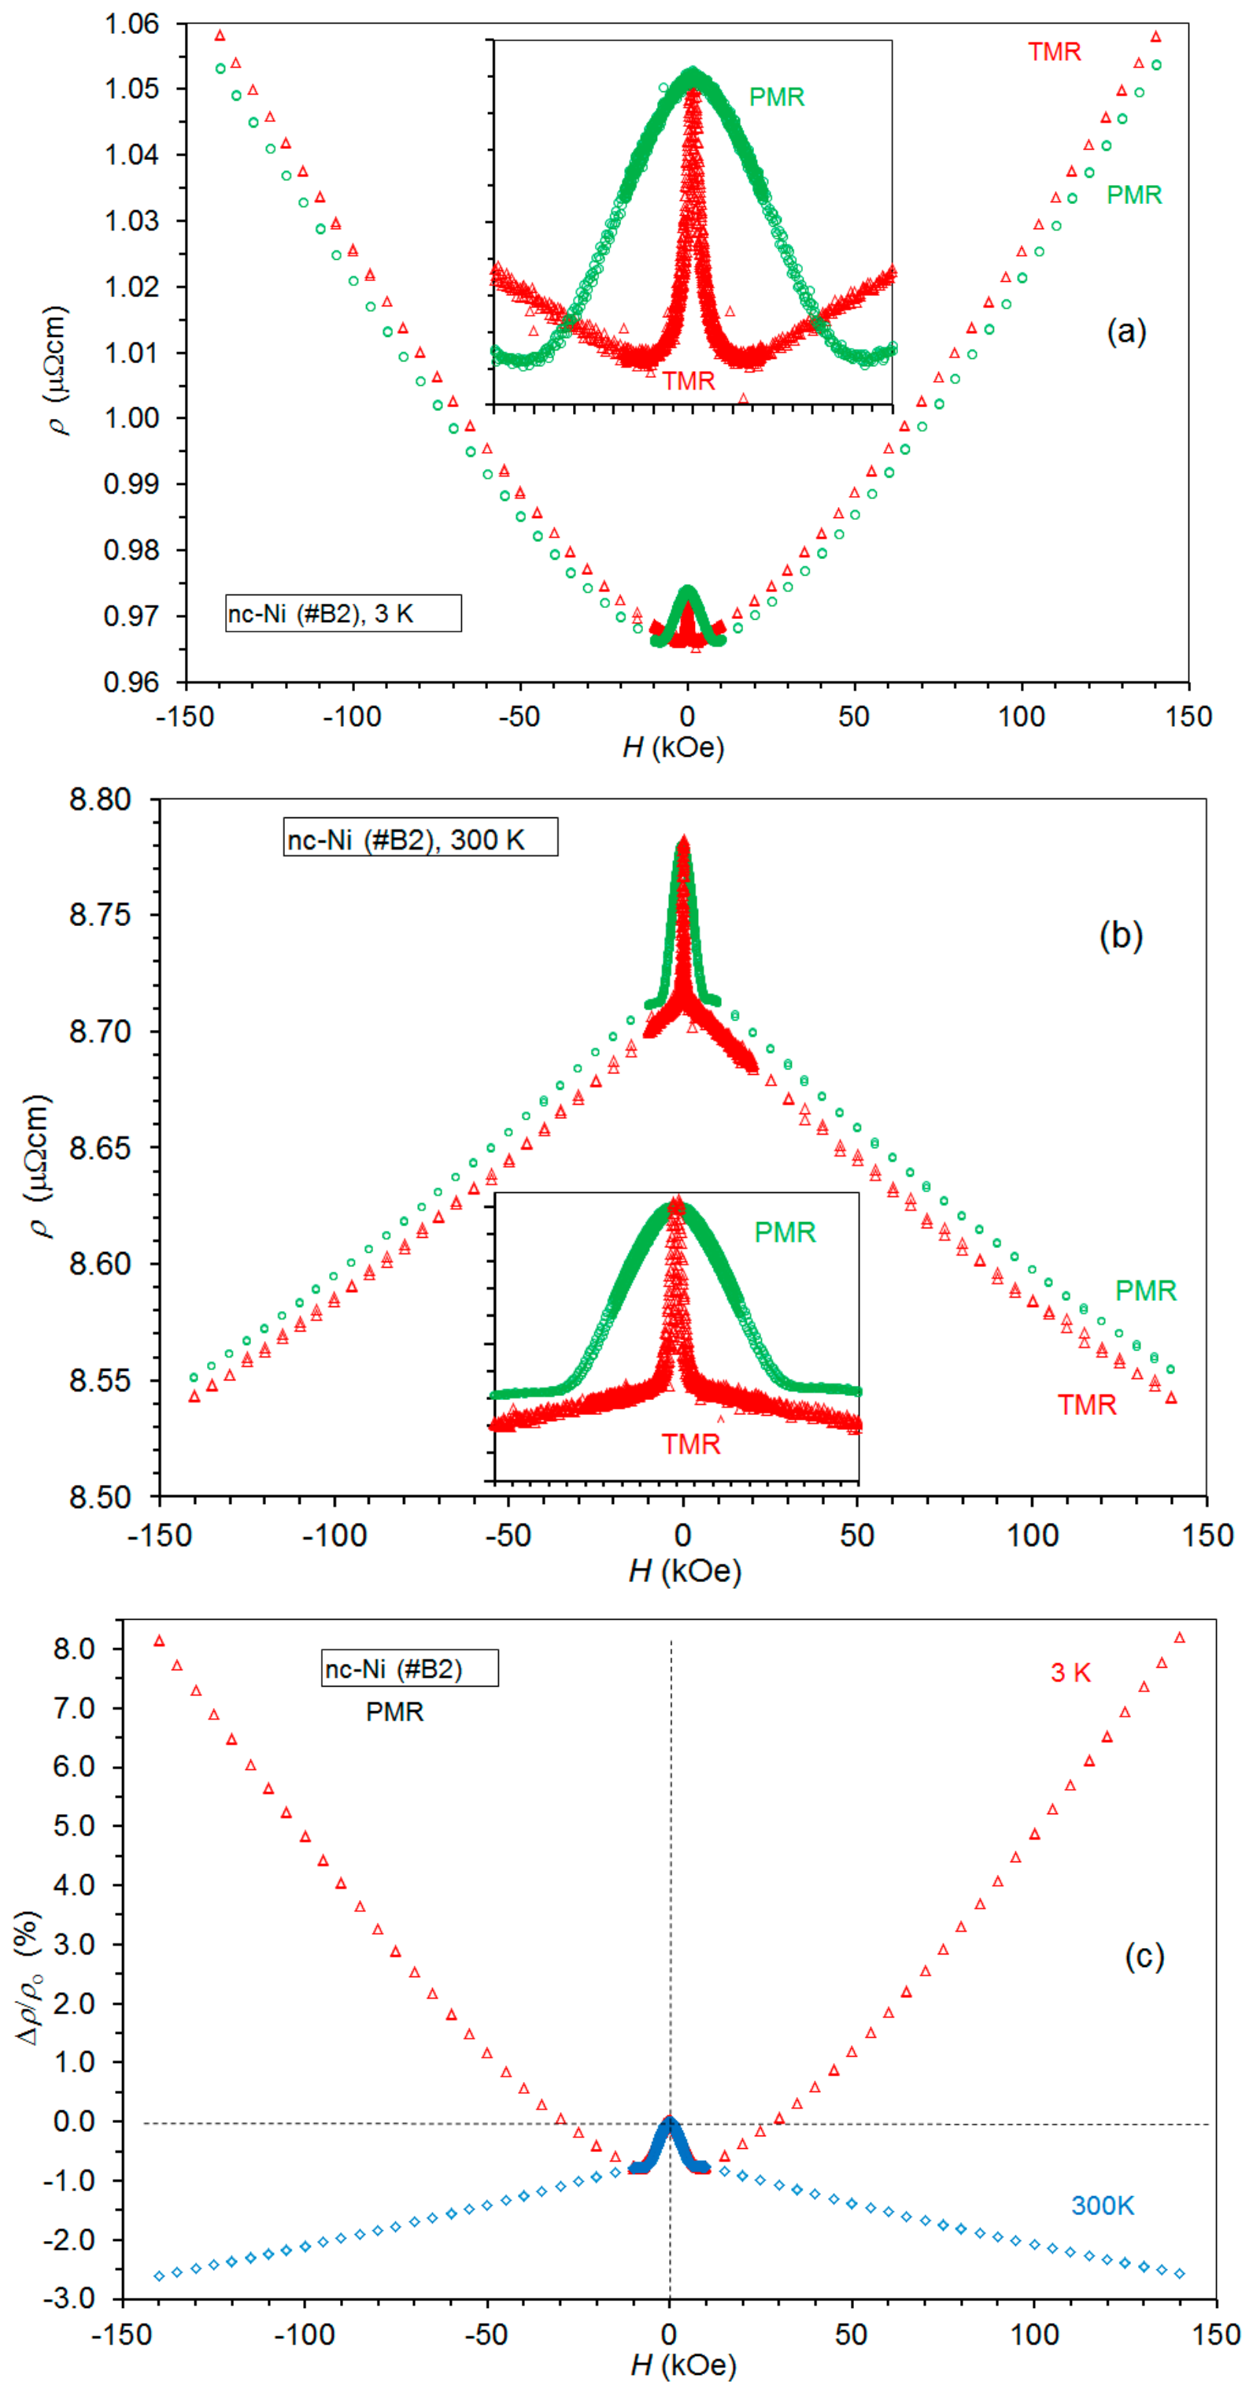
Figure 2a,b show the field dependence of the resistivity for the nc-Ni foil in the PMR and TMR configurations at T = 3 K and T = 300 K, respectively. The overall behavior of the PMR(H) curves is rather similar to the corresponding TMR(H) curves at both temperatures, with the latter presented in Ref. [1]. The major difference between the PMR(H) and TMR(H) curves is that the saturation field (Hs), which is approximately marked by the minimum at T = 3 K and the break at T = 300 K, in the field evolution of the resistivity is larger for PMR than for TMR. The saturation field is influenced by the magnetic anisotropies present and the demagnetizing effects. Because the latter is much stronger in the polar direction, the saturation field is much larger for the PMR component. On the other hand, the magnetic anisotropies and the demagnetizing effects, the latter scaling with magnetization, usually do not depend strongly on temperature; therefore, the saturation fields do not change significantly between 3 K and 300 K.
In order to better illustrate the different field dependencies of resistivity with magnetic fields in the saturation region between 3 K and 300 K, Figure 2c shows the MR ratio for the PMR component at both temperatures (the qualitative behavior would also be very similar for the TMR component). One can see a resistivity increase at low temperatures due to the ordinary magnetoresistance (OMR) contribution and a decrease in the resistivity at room-temperature due the magnon suppression contribution [1].
In Ref. [1], the in-plane magnetoresistance data were evaluated with the help of the Kohler plots from which the zero induction resistivities ρL(B = 0) and ρT(B = 0) could be derived. We applied here the same analysis for the PMR data to obtain ρP(B = 0) (the subscripts “L,” “T,” and “P” correspond to LMR, TMR, and PMR, respectively.)
In the case of the in-plane magnetic field configurations (LMR and TMR), one can safely neglect the fairly small in-plane demagnetizing fields when constructing the Kohler plots, and, therefore, we could use the relationship B = H + 4πMs [1]. However, in the PMR configuration, we have to take into account the large out-of-plane demagnetizing field Hd = NcMs, where Nc is the demagnetizing factor in the direction perpendicular to the foil plane. Therefore, we have B = H + 4πMsHd [9,10]. By substituting for Hd, we obtain B = H + 4πMsNcMs, which can be written in the form of B = H + 4πMs (1 − Nc/4π). For sufficiently thin foil samples, we first assume that Nc/4π = 1 [11], which leads to B = H (we will examine later a case where Nc/4π < 1).
From the zero induction resistivities, the AMR parameters can be derived as follows. An in-plane AMR ratio is defined as AMRIP = Δρ(AMRIP)/ρis, where the in-plane resistivity anisotropy splitting Δρ(AMRIP) is given by the difference [ρL(B = 0) − ρT(B = 0)] and the isotropic resistivity ρis is defined as ρis = [ρL(B = 0) + 2 ρT(B = 0)]/3. In Ref. [1], we obtained the following in-plane AMR parameters for the nc-Ni foil from the Kohler plot analysis:
T = 3 K: AMRIP = 1.62%, Δρ(AMRIP) = 0.0157 μΩ cm and ρis = 0.9692 μΩ cm;
T = 300 K: AMRIP = 1.91%, Δρ(AMRIP) = 0.168 μΩ cm and ρis = 8.78 μΩ cm.
Because the magnetic field is perpendicular to the measuring current in both the TMR and PMR configurations, we can define another AMR ratio, as was done also for the Co-Ni alloys [12]. An out-of-plane AMR ratio (AMROP) is defined analogously to AMRIP by using the ρL(B = 0) and ρP(B = 0) values (and, likewise, an out-of-plane resistivity anisotropy splitting Δρ(AMROP)). These derived out-of-plane parameters for the nc-Ni foil were as follows:
T = 3 K: AMROP = 1.64%, Δρ(AMROP) = 0.0159 μΩ cm and ρis = 0.9691 μΩ cm;
T = 300 K: AMROP = 1.89%, Δρ(AMROP) = 0.166 μΩ cm and ρis = 8.78 μΩ cm.
A comparison of the corresponding data of the in-plane and out-of-plane results reveals good agreement between the two datasets. For a polycrystalline macroscopic (bulk) foil-shaped sample, the magnetoresistance should be the same if the magnetic field is oriented in any direction in a plane perpendicular to the current flow direction. As a consequence, an agreement of the AMR parameters for the IP and OP configurations is expected for the nc-Ni foil. This is because the investigated strip-shaped foil (with its physical dimensions of 5 mm × 1 mm × 9 μm) of the nc-Ni sample can be considered a macroscopic specimen and, therefore, surface scattering effects do not contribute to the electrical transport parameters. Therefore, the fairly good agreement of the AMR parameters for the two configurations corresponds to expectations, as was obtained also for the Co-Ni alloys previously [12]. It should be noted that Rijks et al. [13] demonstrated for Ni80Fe20 thin films that below about 100 nm thickness, the out-of-plane AMR parameters show a deviation from the bulk values due to the non-negligible surface scattering effects on the electrical transport parameters in this thickness range.
At this point, we should make note of the possible influence of the demagnetizing effect on the evaluation of the magnetoresistance results in the PMR configuration in which the magnetic field is oriented perpendicular to the foil plane. Namely, for a finite size ferromagnetic slab, such as the foil specimen used for the present magnetoresistance measurements, which has the physical dimensions given in the previous paragraph, substantial demagnetizing effects may arise, which can have an influence on the field evolution of the resistivity, as discussed in a previous paper [14]. Because the demagnetizing effect is especially large in the PMR configuration, we have estimated the demagnetization factors Na, Nb, and Nc for a slab with the axis lengths a = 5 mm, b = 1 mm, and c = 9 μm, which correspond to the physical dimensions of our sample. By using the graphs in Ref. [11], in the general ellipsoid approximation, the result was Na/4π = 0.001, Nb/4π = 0.009, and Nc/4π = 0.99.
In preparing the Kohler plots above for the PMR configuration, we have made the assumption that B = H, i.e., we have neglected the in-plane demagnetizing effects by taking Nc/4π = 1. On the other hand, we can see in the previous paragraph that the actual value of Nc/4π for our sample is 0.99 and, therefore, we have also created the Kohler plots by using this Nc/4π value. For the case Nc/4π = 1, we obtained from the experimental ρP(B) vs. B data with the help of the Kohler plot a ρP(B = 0) value of 0.9638(1) μΩ cm for T = 3 K and 8.727(1) μΩ cm for T = 300 K. It turns out that in the case of Nc/4π = 0.99, the ρP(B = 0) values agreed within the specified experimental error at both temperatures with the values deduced for the case of Nc/4π = 1. Thus, the AMR parameters and the isotropic resistivity determined by using the data in the PMR configuration are also the same., i.e., they are not influenced by neglecting the very small in-plane demagnetizing effects for such a thin nc-Ni foil.

5. Hall Effect Measurements

5.1. Experimental Results

In the measurement of the Hall effect, the magnetic field H is oriented perpendicular to the plane of the thin foil sample, and the voltage drop across the sample width is measured while using a current I along the long axis of the strip (see Figure 1 of Ref. [9] or Figure 1 of Ref. [10]). In this configuration, the current direction is along the x-axis, the voltage drop is measured along the y-axis, and the magnetic field is oriented along the z-axis. This experimentally measured voltage is denoted as Vxy, where the indices refer to the current direction and the direction along which the voltage drop is measured, respectively.
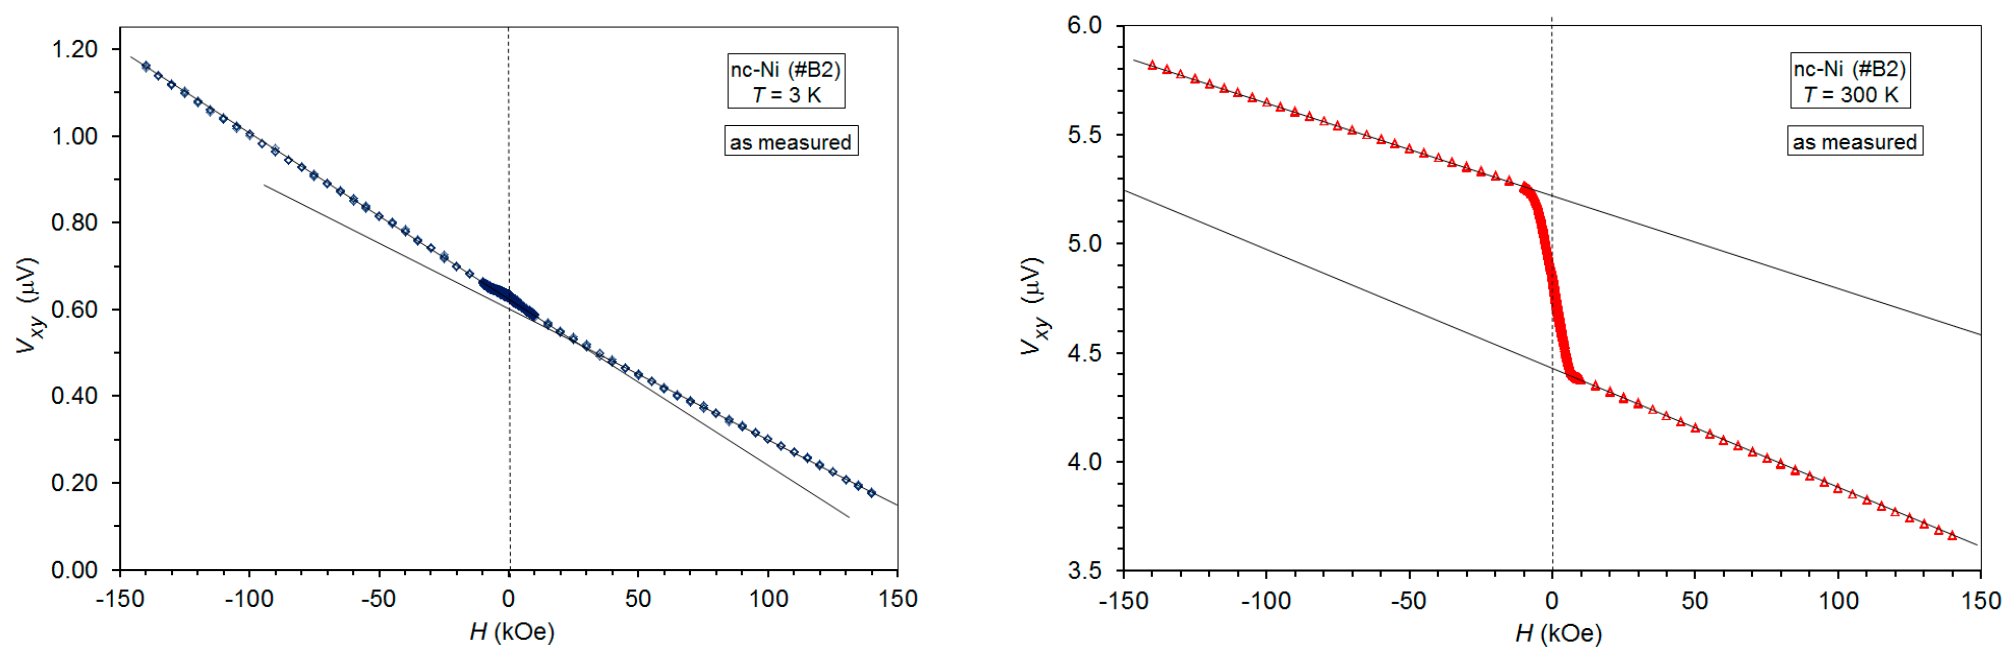
The field evolution of the measured voltage Vxy for the nc-Ni foil at both temperatures is displayed in Figure 3. At room temperature, Vxy sharply increases with the magnetic field in both field directions, and, beyond a given magnetic field value, linear behavior can be observed with different slopes in the H < 0 and H > 0 field ranges. At low temperatures, the high-field data exhibit similarly linear behavior as observed at room temperature, even including the different slopes in the H < 0 and H > 0 field ranges.
One can also observe that there is fairly large background voltage (i.e., Vxy(H = 0) is not zero) and it is even strongly temperature dependent. This background voltage and also the difference in the high-field slopes for the H < 0 and H > 0 field ranges do not have anything to do with the Hall effect. Therefore, they should be eliminated from the measured data before we can analyze the field dependence of the true Hall voltage and Hall resistivity from which the Hall coefficients can be deduced.
The source of the observed background voltage in our measurements is a small misalignment of the positions of the two Hall contacts along the length of the foil strip, which are placed at the opposite strip edges. Such a misalignment is hardly avoidable except in lithographically prepared Hall contacts, which was not the case here. Due to the misalignment, there will be a small voltage Vxx(H) present even at a zero magnetic field. As we will see later, the true Hall resistivity ρHall(H) = ρxy(H) is much smaller than the zero-field resistivity ρxx(H = 0) measured along the current flow direction. Therefore, the true Hall voltage VHall is also very small, and the relatively large Vxx(H) voltage due to the misalignment effect appears superimposed on the true Hall effect as a background voltage.
Furthermore, because Ni is a ferromagnetic metal, its resistivity ρxx changes in a magnetic field [9]; thus, we definitely have a field-dependent voltage contribution Vxx(H) as well, which can be made responsible for the difference in the high-field slopes of the measured Vxy(H) curves for the H < 0 and H > 0 field ranges. Therefore, the measured Vxy(H) voltage will consist of two contributions:
Vxy(H) = VHall(H) + Vxx(H)
where VHall(H) is the true Hall voltage of interest. To eliminate the unwanted Vxx(H) term from the measured signal, we will invoke the Onsager relations for conductivity [9,15]. Adapting these symmetry relations for our context, we arrive at the following expressions:
Vxx(−H) = Vxx(H),
VHall(−H) = −VHall(H).
The first expression tells us that the resistance voltage Vxx(H) is an even function of the magnetic field whereas, according to the second expression, the true Hall voltage VHall(H) is an odd function of the magnetic field. Although one may have concerns about the applicability of the Onsager relations for some specific cases, they are definitely valid for the high-field Hall effect data, i.e., for the magnetically saturated state. As we will see later, our evaluation will rely on the high-field data only.
Because we have measured Vxy(H) data for both H < 0 and H > 0, we can effectively eliminate the unwanted Vxx(H) term by combining the three equations above. We can easily arrive in this manner at an expression for the true Hall voltage for H ≥ 0 field values:
VHall(H) = [Vxy(H) − Vxy(−H)]/2.
The Hall voltage VHall(H) obtained will have no background voltage anymore, and also the slope of the high-field data will correspond to the average of the slopes of the originally measured Vxy(H) data for the H < 0 and H > 0 field ranges. However, we will not show the true VHall(H) data but rather convert these Hall voltage values directly into Hall resistivity data ρHall(H) = ρxy(H) to make the derivation of the Hall coefficients of interest more straightforward.

5.2. Data Evaluation: Derivation of the Hall Coefficients

According to Figure 1 in Ref. [9], the Hall resistivity ρHall can be obtained from the Hall voltage VHall as
ρHall = VHall t/I.
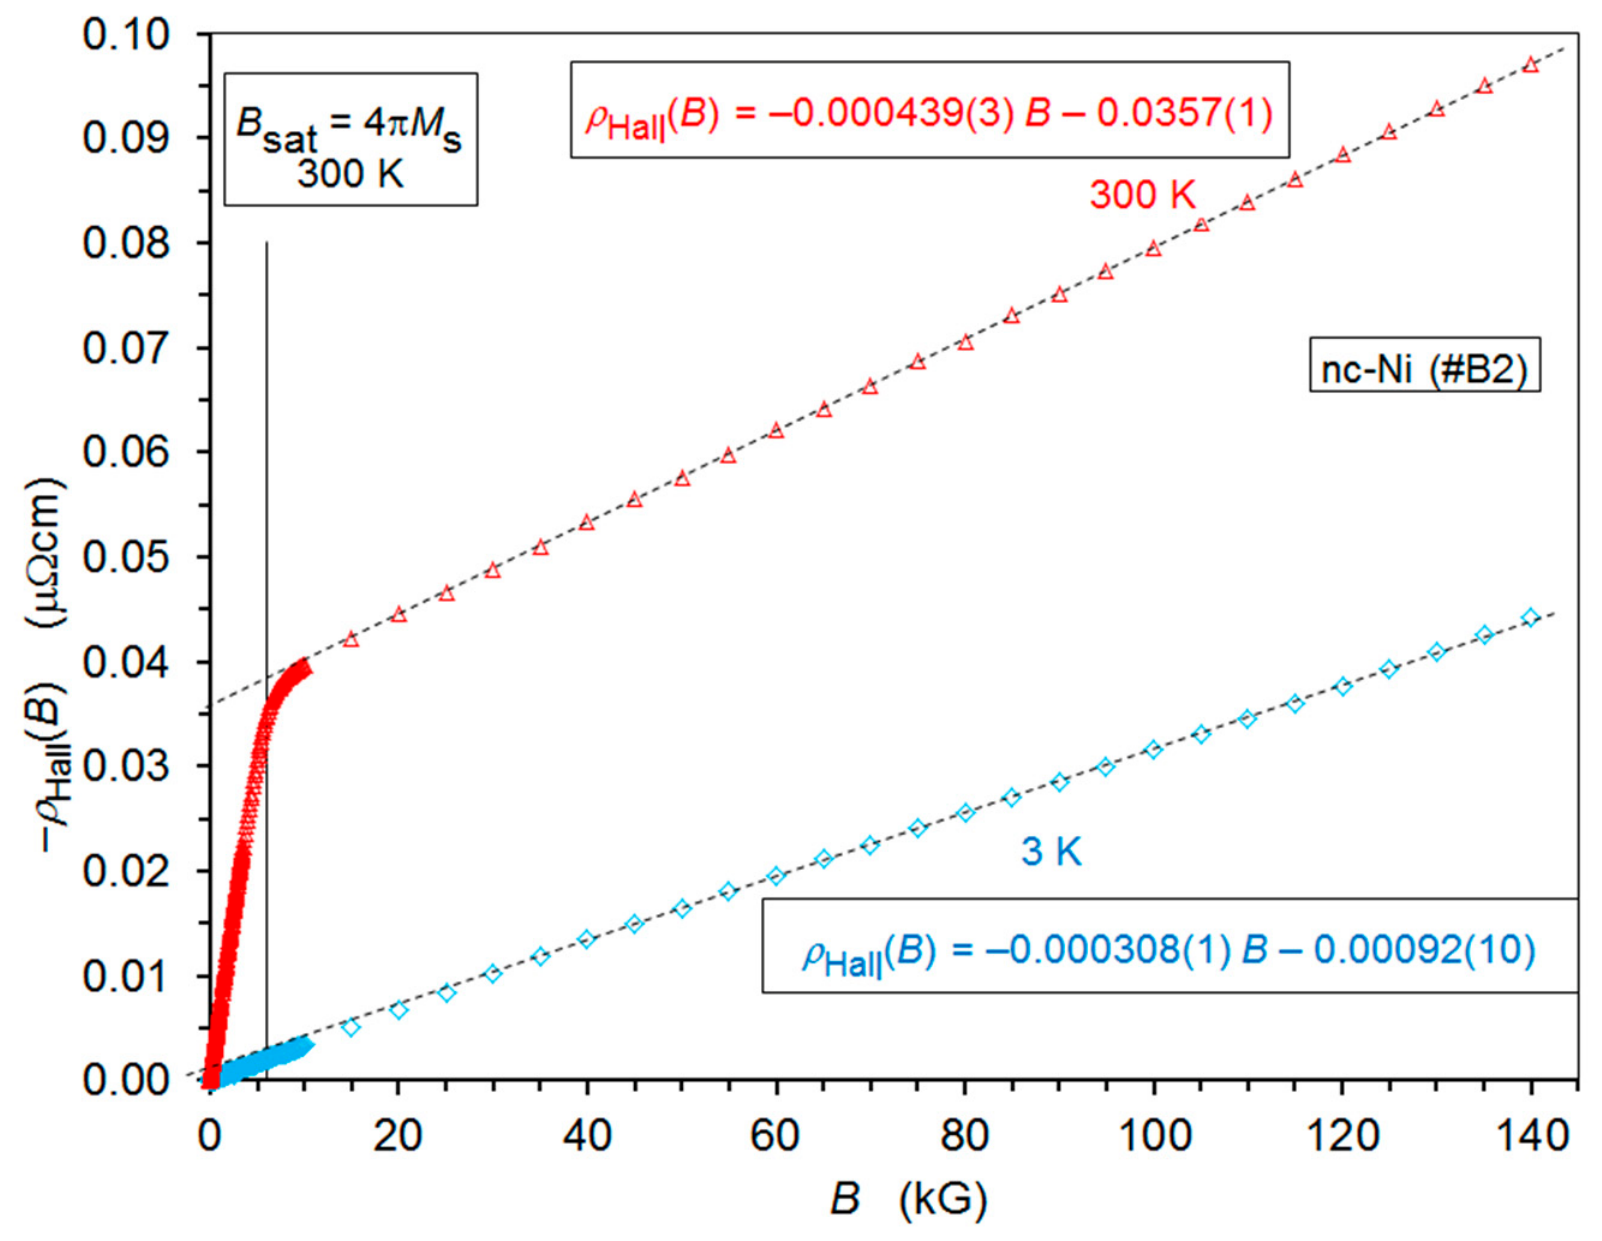
In this expression, t is the sample foil thickness and I is the current along the x direction. For the investigated nc-Ni sample (#B2), we have t = 9 μm, and the measuring current is I = 10 mA. By using these values, we have converted the VHall(H) data into ρHall(H) data, and the results are shown in Figure 4 for both temperatures. It should be noted that we have actually displayed here the Hall resistivity as a function of the magnetic induction B. The reason for this is that from the viewpoint of electrical transport, the effective field acting on the electron trajectories in a metallic ferromagnet is B [9]. On the other hand, as discussed in Section 4, due to the large demagnetizing field in a thin foil such as our nc-Ni specimen, when measuring the Hall effect with the magnetic field perpendicular to the foil plane beyond magnetic saturation, the relationship B = H holds with great accuracy (later, when evaluating the Hall coefficients, we will return to this point again).
For the evaluation of the Hall effect data presented in Figure 4, we should recall that it is customary to partition the Hall resistivity in two terms [9,16]:
ρHall(B) = Ro B + 4πMs Rs.
The first term is the ordinary Hall effect present in any conductor, which arises due to the Lorentz force acting on the trajectories of electrons moving in a magnetic field [9]. It is usually linear in B, and the quantity Ro is the ordinary Hall coefficient from which the effective current carrier density of the conductor can be estimated [17,18]. The second term occurs in any metallic ferromagnet and is proportional to the saturation magnetization Ms with the proportionality constant Rs. This term is called various names, such as extraordinary or anomalous or spontaneous Hall effect. We will adhere to the currently most frequently used term “anomalous Hall effect” [3]. The quantity Rs is the anomalous Hall constant, where the subscript s is used to denote that this effect is connected to the presence of spontaneous magnetization.
A brief glance at Figure 4 reveals that our experimental results in the high-field region can be well-described with Equation (6). Namely, above a critical magnetic field/induction, the Hall resistivity increases linearly with B, as is typical for pure Ni metal (see, e.g., Figure 1 of Ref. [3]). The critical induction is achieved when the magnetization is fully saturated perpendicular to the foil plane, i.e., along the magnetic induction vector. This saturation induction value is just 4πMs indicated for 300 K with the vertical line. It corresponds approximately to the induction value beyond which the resistivity increases linearly with induction, as in any conductor, as the magnetization is already fully saturated for high fields (apart from a weak paraprocess discussed later). The saturation magnetization at 3 K is 5% higher than the room-temperature value and, therefore, the saturation induction at 3 K is only slightly higher than at room temperature, so it is not indicated separately.
From the fit parameter values given in Figure 4, with the help of Equation (6), we can derive the following Hall coefficient values:
T = 3 K:    Ro = −0.308(15) × 10−12 Ω cm/G    Rs = −0.144(22) × 10−12 Ω cm/G
T = 300 K:    Ro = −0.439(22) × 10−12 Ω cm/G    Rs = −5.87(30) × 10−12 Ω cm/G
The figures in the brackets refer to the error in the last digit of the parameter values and were obtained by taking into account that the thickness determination of our nc-Ni has an accuracy of ±5% for each parameter value, which comes in when converting the measured VHall voltages to Hall resistivities according to Equation (5). The errors of the fit parameters as indicated in the textboxes in Figure 4 are much smaller than 5%, except for the value of Rs(3 K), where the fit error of about 10% was also included in the above specified error for this parameter.
As we can see in Figure 4, Rs changes only slightly with temperature, whereas Rs exhibits a strong temperature dependence. These features correspond well to the known behavior of the ferromagnetic metals [16]. In Section 5.3, we will discuss in more detail our results for the nc-Ni sample in comparison with all available results for pure Ni metal. Before doing that, we make some comments on two issues that have relevance for the accuracy of our data.
As already noted in Section 4, the relationship B = H is valid for a magnetic field perpendicular to the plane of the investigated ferromagnetic foil, which is just the case for the Hall effect measurement, only if the demagnetizing factor of the specimen along the field direction (Nc/4π) is equal to 1. It was shown in Section 4 that for the particular specimen used for the Hall effect measurement, Nc/4π = 0.99. We have checked that this slight deviation of Nc/4π from unity has a minor influence only on the Hall coefficient Rs (the coefficient Ro is independent of the demagnetizing factor). Namely, the difference of the Rs values for the Nc/4π = 0.99 and 1 cases is of the order of 0.1% only, which is much less than the other possible errors.
The other issue is connected with the so-called paraprocess, i.e., the slight increase of Ms in high magnetic fields, which is also present in Ni metal [19]. This increase is linear and can be characterized with high-field susceptibility χHF. For Ni metal, χHF(300 K) = 52.1 × 10⁻⁶ emu/cm3 [19]. Furthermore, at 300 K, we have 4πMs(B = 0) = 6080 G, and the increase in magnetization due to the paraprocess from B = 0 to B = 140 kG amounts to 91.6 G, i.e., the relative increase is only about 1.5%. This means that at 300 K, the measured slope of the ρHall(B) vs. B curve is by this amount larger due to the paraprocess rather than the true slope. Consequently, the extrapolated ρHall(B = 0) = 4πMsRs value obtained in Figure 4 according to Equation (6) and from which Rs is derived is smaller by 1.5% than the true value. All of this means that the error due to neglecting the paraprocess influence in Figure 4 causes an error of only about 1.5% in the derived Ro and Rs values at 300 K, which is fairly small. Since χHF(4.2.K) = 16.9 × 10⁻⁶ emu/cm3 for Ni metal [19], the error of the Hall coefficients due to the paraprocess is even smaller by a factor of 3 than at 300 K.

5.3. Discussion and Comparison with Literature Results for Ni Metal

The available experimental data [20,21,22,23,24,25,26,27,28,29,30,31,32,33,34,35,36,37,38,39,40,41] for the Hall coefficients of Ni metal are summarized in Table A1 in the Appendix A. Some important characteristics of the investigated samples (e.g., purity and room-temperature resistivity) are also included in the table in case such details were specified in the reports. In the two subsequent subsections, the ordinary and anomalous Hall coefficients will be separately discussed, and our present data will be evaluated in light of previous corresponding results.

5.3.1. Ordinary Hall Coefficient of Ni Metal

For non-magnetic metals, the ordinary Hall effect can be expressed as Ro = −1/(ne) in the free-electron model of Drude [17,18], where n is the number of electrons in a unit volume and e is the electronic charge (here, e > 0). Actual values of the experimental Ro values show evident deviations from this expression inasmuch as the metal electronic band structure cannot be described by the free-electron approximation. This is clearly demonstrated in Table 1.4 of Ashcroft and Mermin [17] and Table 11.4 of Mizutani [18].
The situation is rather similar for magnetic metals and alloys as their electronic band structure clearly deviates from the free-electron model. Nevertheless, their Ro values are comparable with those of the non-magnetic metals.
For metallic ferromagnets, the electrical transport processes are usually discussed in light of the two-band model by dividing the charge carriers into a spin-up (majority electrons, ↑) and a spin-down (minority electrons, ↓) conduction channel. Campbell [42] also extended this model for the ordinary Hall coefficient. In particular, he pointed out that for very pure metals at low temperatures, i.e., for long electron mean-free paths, the resulting value of Ro will lie somewhere between the individual Ro↑ and Ro↓ values, depending on the ratio α = ρo↓/ρo↑ of the dominant residual impurity, where ρo↓ and ρo↑ are the residual resistivities of the spin-down and spin-up conduction channels, respectively. This explains the large scatter of experimental Ro values in various studies of sufficiently pure metals at low temperatures, as we will also see in the case of Ni below.
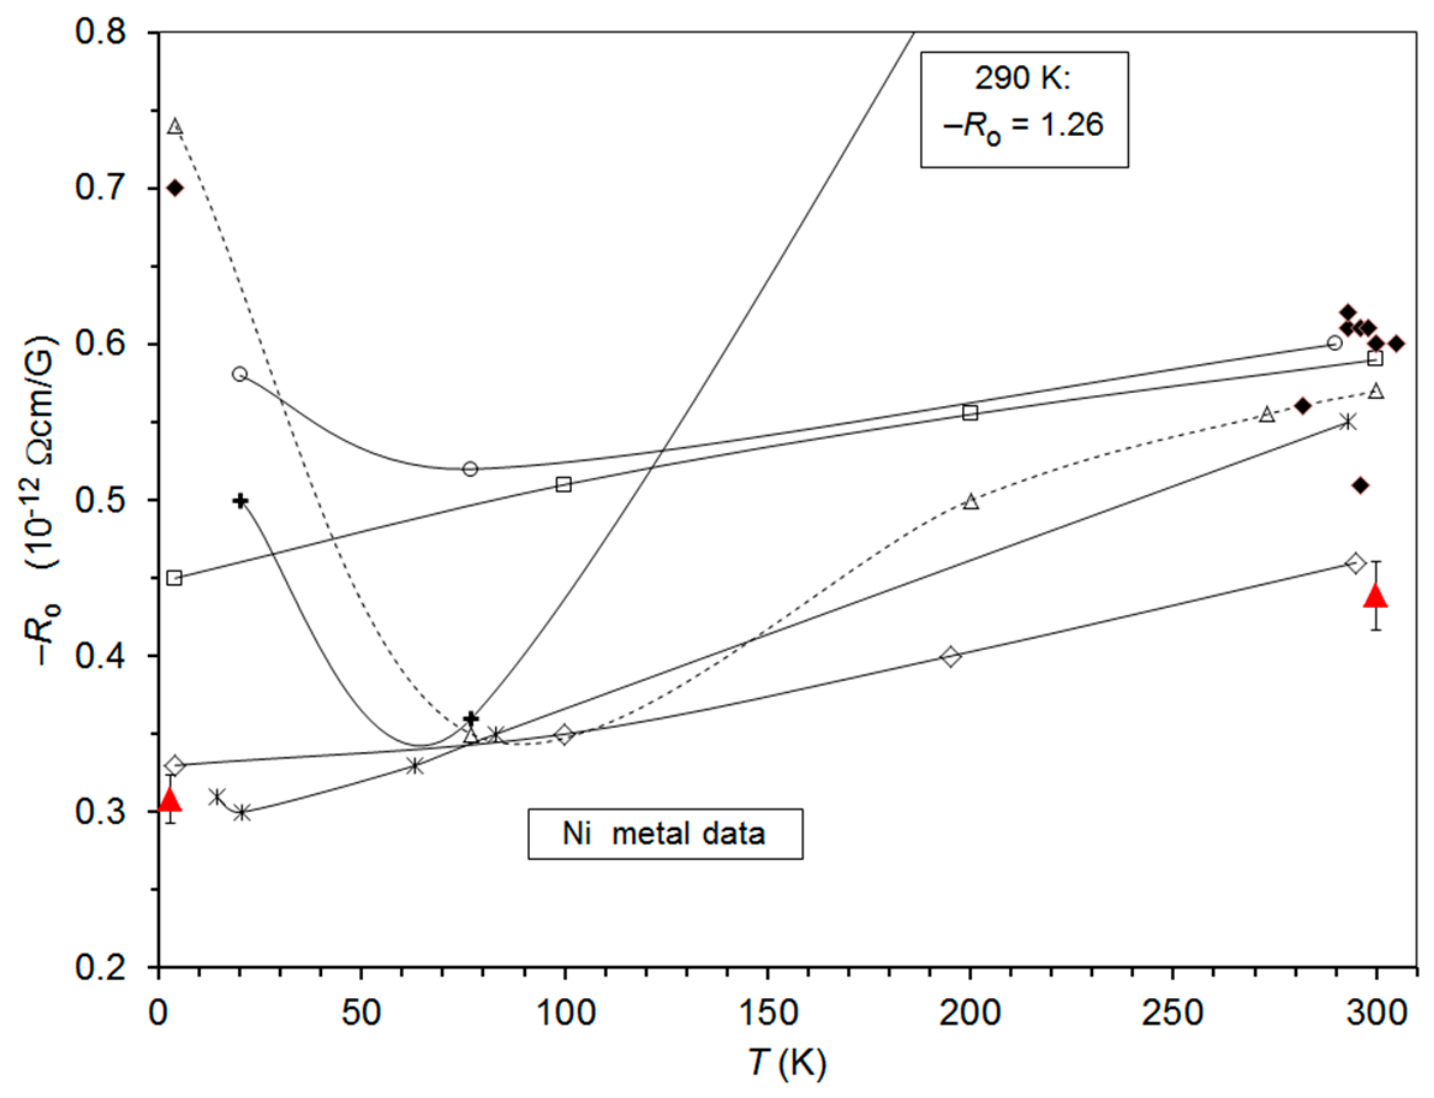
The value of Ro in metals is usually weakly temperature dependent only. According to Figure 5, this is also the case for Ni metal. In most studies, a weak reduction of Ro was observed from room temperature to the liquid helium range. The only exception is the series by Smit [25] on carbonyl Ni (crosses in Figure 5), where strong temperature dependence was obtained due to the very high room-temperature value. This latter result is rather strange and unexplainable, especially because in the same study the other commercial Ni sample (circles in Figure 5) of definitely lower purity exhibited a room-temperature Ro value that fit well with the other data.
Our data for the nc-Ni metal sample (red filled triangles) fit well with data from the literature for both the magnitude and the temperature evolution. This also implies that the nanocrystalline state does not have a significant influence on the ordinary Hall coefficient in Ni metal. This is actually expected, as neither the electron density nor the electronic band structure differ for the nanocrystalline or the bulk states at the grain size range of our sample.
The strong low-temperature upturn of Ro for two series (open triangles and crosses) may be ascribed to the effect described above by Campbell [42], since in these two reports [22,25] very high-purity Ni was used. Above this temperature range, we could not identify specific sample details in the reports, which could unambiguously explain the scatter of the Ro data at a given temperature.
A source of error can also be the uncertainty of the sample thickness determination, as this parameter is involved in the conversion of the measured true Hall voltages into Hall resistivities (see Equation (5) in Section 5.2). Furthermore, the value of Ro can also be underestimated if the Hall contacts are not exactly on the edge of the sample but eventually also cover a small part of the upper strip surface. If that is the case, the measured voltage is smaller than the true Hall voltage, which then results in a smaller slope of the VHall(H) and ρHall(B) curves.
Also, we can see in Section 5.1 that the slopes of the high-field region of the Vxy vs. H curves are different in the H < 0 and H > 0 field ranges. If this difference has not been eliminated because the Vxy voltages were measured with one field direction only, this can clearly influence the value of Ro, which is derived from the slope of the ρHall vs. H curves. Unfortunately, in reports on the Ni Hall effect, no mention is made of this issue.
Summarizing the above considerations about Hall effect data, one can conclude that according to the available reliable data collected in Figure 5, the average values for the ordinary Hall coefficient of pure Ni metal can be taken as Ro(300 K) = −0.5(1) × 10−12 Ω cm/G and Ro(0 K) = −0.4(1) × 10−12 Ω cm/G.
We will now make a brief note on the temperature dependence of the ordinary Hall coefficient. As we can see in Figure 5, based on the results of several reports, Ro decreases approximately linearly from 300 K down to about 100 K. The lattice parameter and the volume of metals also exhibit a nearly linear reduction in the same temperature range (see, e.g., the lattice parameter results of Eastman et al. [43] on Pd). Because in the free-electron model of Drude Ro depends on the number of electrons in a unit volume, it may be interesting to compare the temperature coefficients of the thermal expansion and Ro. In the Drude model, we have Ro = 1/(ne) with n = Ne/V, where Ne is the number of electrons in the sample and V is the sample volume. Therefore, after substituting, we have Ro = 1/(ne) = (V/Ne)/e. It follows from this that RoV. This proportionality means that the temperature coefficients of these two quantities are equal: (1/Ro)(∂Ro/∂T) = (1/V)(∂V/∂T). If we take now the results of Volkenshtein and Fedorov [20] (see open circles in Figure 5) as representative data for the temperature dependence of Ro between 100 K and 300 K, we obtain αRo = (1/Ro)(∂Ro/∂T) = 1000 ppm/K. At the same time, the average linear thermal expansion coefficient of Ni metal in the temperature range between 100 K and 300 K is αl = (1/l)(∂l/∂T) = 10(3) ppm/K [44], where l is the length. On the other hand, the relationship αV = 3 αl also holds, so, finally, we end up with αV = (1/V)(V/∂T) = 30 ppm/K. It follows from these data that αRo = 33 αV, i.e., the temperature coefficient of the ordinary Hall coefficient is larger by more than an order of magnitude than the thermal coefficient of the volume expansion. This result emphasizes again that the simple free-electron picture in which Ro depends only on the density of charge carriers cannot properly account for the ordinary Hall coefficient of transition metals, including the ferromagnetic ones, which exhibit both s- and d-conductions bands. Therefore, the explanation of Ro should invoke a model based on the electronic band structure of the metal [42,45].

5.3.2. Anomalous Hall Coefficient of Ni Metal

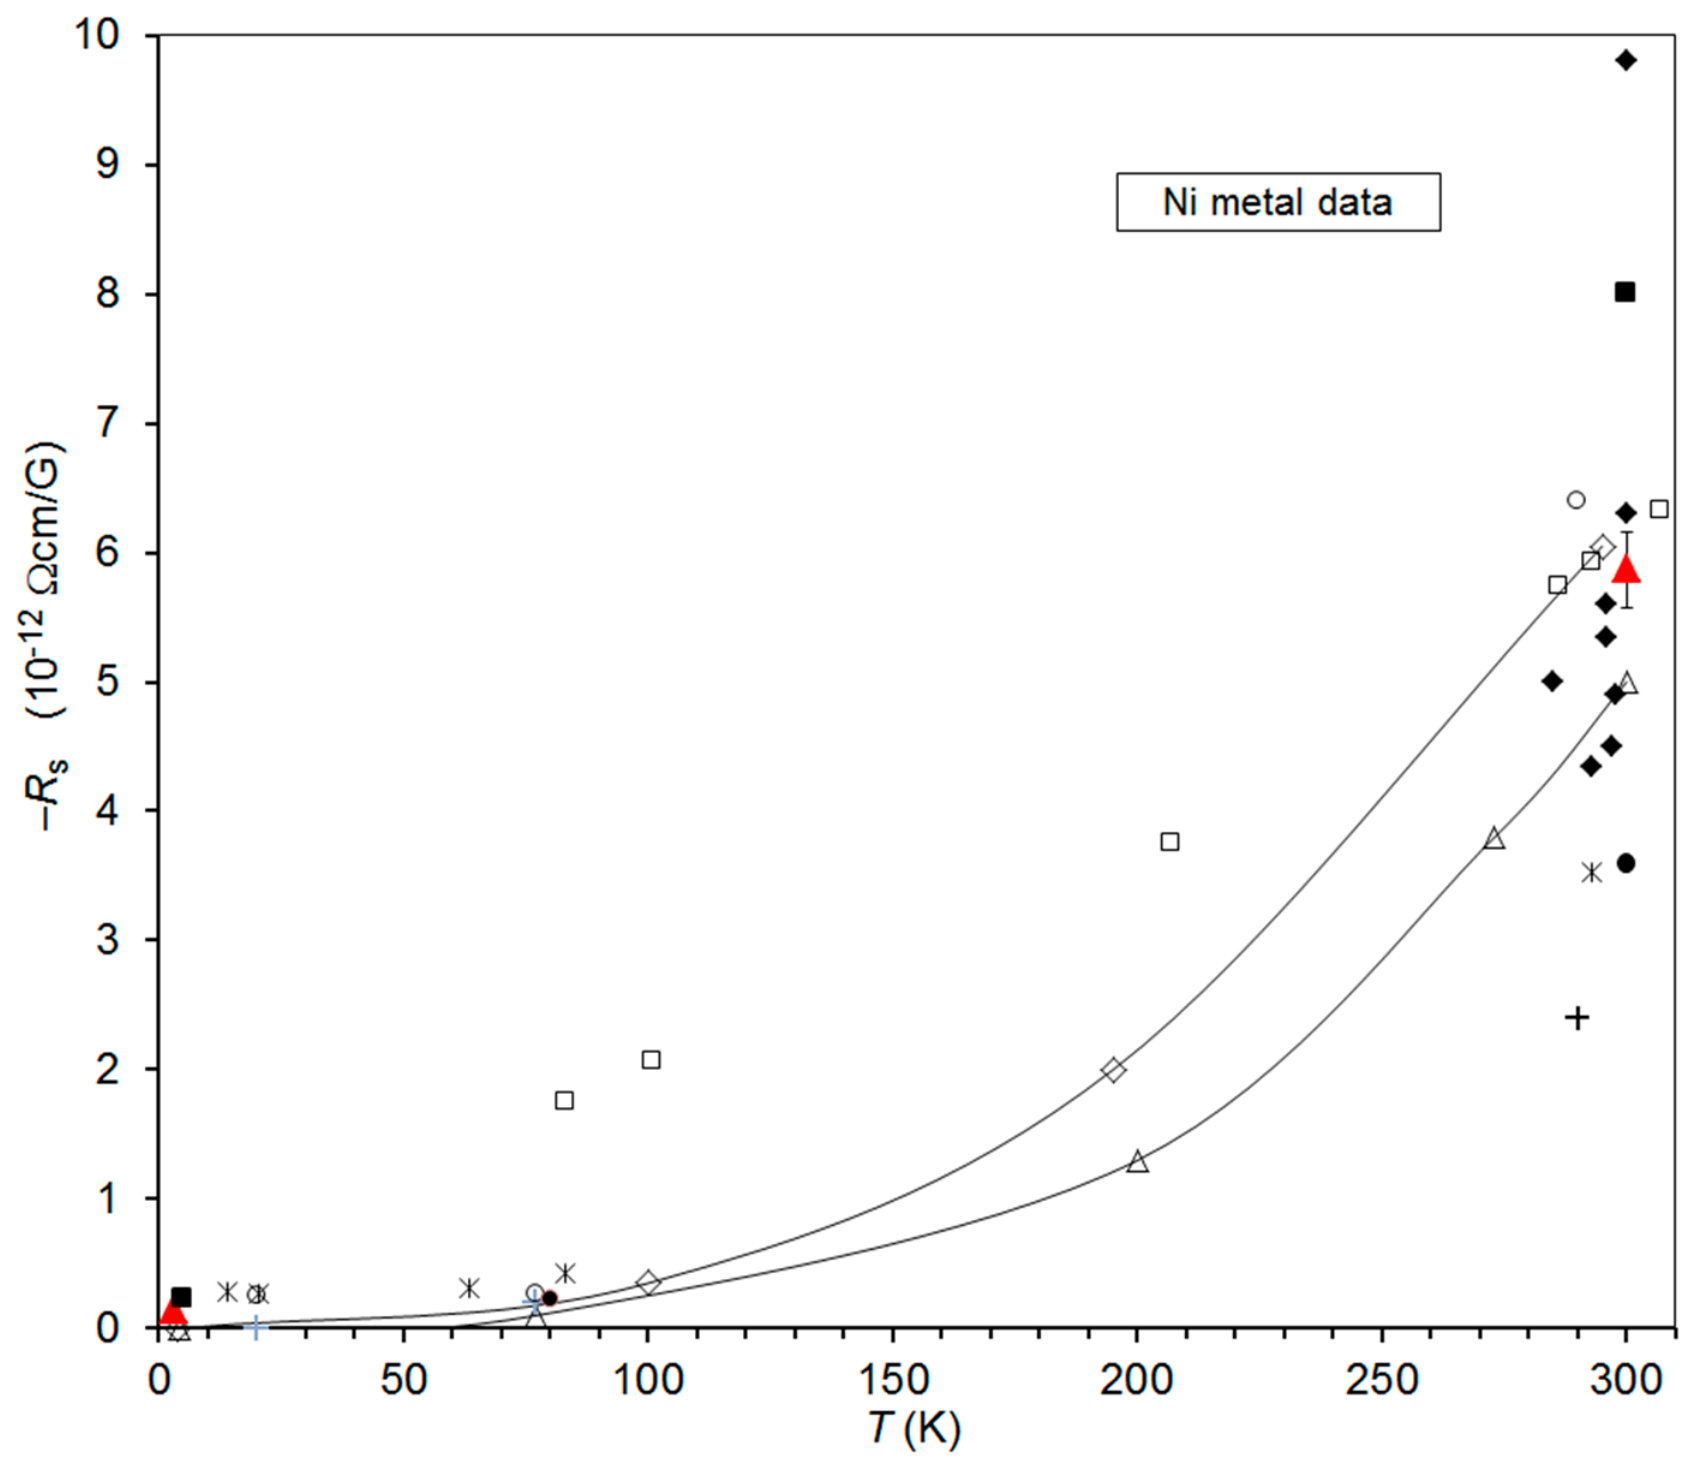
In contrast to the ordinary Hall coefficient, the anomalous Hall coefficient Rs has a strong temperature dependence, as shown in Figure 6. In spite of the large scatter of the data around room temperature, the trend is clear in that Rs continuously decreases towards lower temperatures, as indicated by two data series (diamond and open triangle symbols connected with solid lines). Actually, the results of Refs. [26,37,39] strongly confirm this trend as well. According to most of the reports, Rs takes an at least 10 times smaller value below about 100 K than the room-temperature value for any of the samples studied, and it rapidly approaches zero towards T = 0 K.
It should be noted that in addition to the error sources listed for Ro in Section 5.3.1, if the specimen demagnetization factor along the magnetic field direction for the Hall effect measurement was not equal to that of a very thin plate (i.e., Nc/4π = 1) and this fact was not properly taken into account, an error due to this in the actual Rs value may have also contributed to the large scatter of the anomalous Hall coefficient at a given temperature. As to the average room-temperature Rs value, in view of the data in Figure 6, it can only be estimated to lie at about Rs(300 K) = −5 × 10⁻¹² Ω cm/G, with a fairly large uncertainty of at least ±20%.
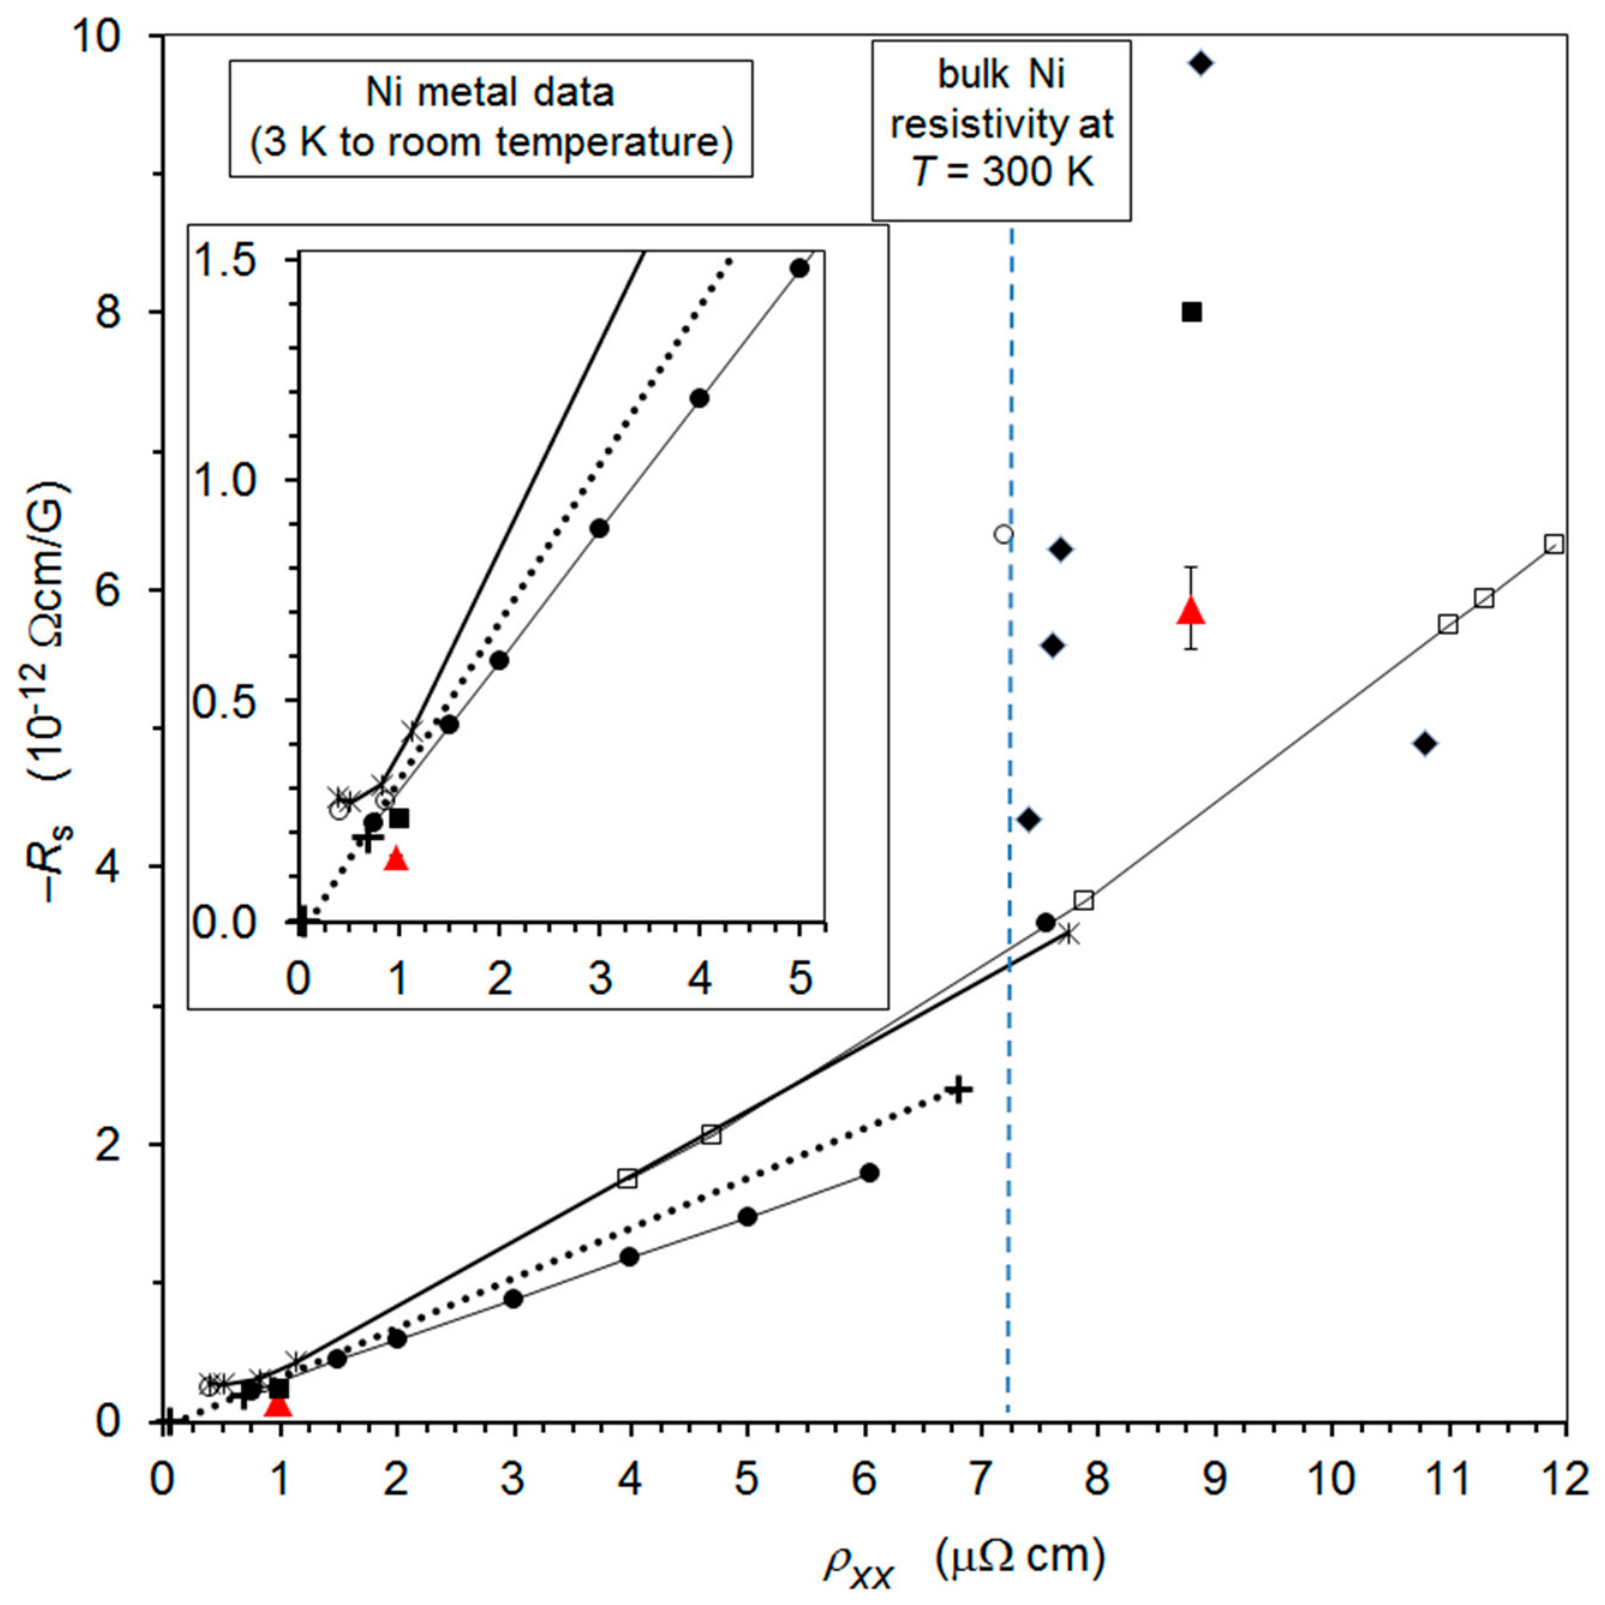
Because the observed temperature dependence of Rs strongly resembles the evolution of the resistivity of Ni with temperature [6,7], it was quickly recognized that the anomalous Hall coefficient might scale with the zero-field resistivity ρxx. As noted by Nagaose et al. [3], early experiments have indeed been evaluated by describing the data assuming a relationship of the form Rs ∝ (ρxx)β. Therefore, we have also displayed in Figure 7 the collected Rs data on Ni metal (see Appendix Table A1) in the form of an Rs vs. ρxx correlation with the temperature as an internal parameter.
Nagaose et al. [3] have discussed in detail the various theoretical models elaborated for Hall effect contributions in ferromagnets. Before discussing in detail the experimental data for Ni in Figure 7, we first briefly summarize the evaluation framework in light of the current level of theoretical understanding of the AHE on the basis of this review [3]. In this framework, the total measured AHE conductivity can be decomposed into three contributions:
σxy(AH) = σxy(AH)intr + σxy(AH)skew + σxy(AH)sj.
The mechanisms by which these three terms cause a current perpendicular to the longitudinal current yielding ρxy resistivity terms are illustrated in an illuminating manner in Figure 3 of Ref. [3]. The first term is the intrinsic contribution, which depends only on the electronic band structure of the perfect crystal, and this is the reason to call it intrinsic. Because it is derived from interband coherence effects, it causes a deflection of electrons without involving scattering events. It can usually be calculated using band structure methods (see, e.g., the work of Ködderitzsch et al. [46]), and it can be derived experimentally as well (see, e.g., Refs. [39,47]).
The other two mechanisms, which are the consequence of electron scattering events, are considered to yield so-called extrinsic contributions to AHE. The second term, the so-called skew mechanism, arises from asymmetric scattering due to the effective spin–orbit coupling of the electron or the impurity. The last term, the so-called side-jump mechanism, arises because the electron velocity is deflected in the opposite direction by the opposite electric fields when an electron approaches and leaves an impurity. This term can be best obtained by subtracting the intrinsic and skew terms from total measured AHE conductivity.
More details about the three mechanisms can be found in the extended review by Nagaosa et al. [3]. Another review paper by Yue and Jun [47] discusses the determination of the intrinsic contribution to the AHE from the experimental data on ferromagnets.
We will start the discussion of data from the literature displayed in Figure 7 with the work of Kaul [26] from 1979, which is the latest experimental paper on the Hall effect of bulk Ni. This is definitely a reliable and valuable paper, as it used a very high-purity and well-annealed Ni specimen (see the Appendix Table A1). Also, the room-temperature resistivity of the investigated sample was very close to the standard bulk Ni value. The measurement accuracy was high, and the theoretical discussion was very deep and extended. Important statements from the paper by Kaul [26] are summarized below and compared to the previous results, as well.
(i) In the temperature range of 77 K to 260 K, the relationship Rs ∝ (ρxx)β with β = 1 was quantitatively demonstrated [26] (see full dots in Figure 7). The observed β = 1 value corresponds to the prediction of the skew scattering model [3] and, accordingly, it indicates that this mechanism dominates here. The low-temperature data (above 77 K) of Lavine [37] on a high-purity Ni sample yielded a β = 1.1 value. As we can see in Figure 7, the results of several previous reports also follow the relationship Rs ∝ (ρxx)β with β = 1, although the magnitude of the proportionality factor of the relationship Rsρxx varies from study to study, which may be connected to the different purities of the samples. This is also reflected by the different RRR values of the investigated Ni samples (see Appendix Table A1).
(ii) In the temperature range of 260 K to 420 K, Kaul [26] found that the relationship Rs ∝ (ρxx)β is valid with a β = 2.05 value. For this temperature range, we have made a reading only of the Rs(300 K) value of the results of Ref. [26], and this is added as a full dot to Figure 7. Among the previous studies, Lavine [37] reported a β = 1.97 value from measurements above room temperature on high-purity Ni. The side-jump model predicts a β = 2 value [3]. Accordingly, these experimental results with β values close to 2 speak to the dominance of the side-jump mechanism at around and somewhat above room temperature.
(iii) In the temperature range of 420 K to 600 K, the results of Kaul [26] show that here the dominant contribution to Rs comes from spin–disorder scattering, which becomes more and more important as the temperature approaches the Curie point (631 K).
(iv) Kaul [26] concluded from these results that in different temperature ranges, different contributions to Rs may dominate.
(v) Lavine [37] found that at intermediate temperatures, the high-purity Ni had a β = 1.70 value and the Ni sample with lower purity had β = 1.49. Jan [24] found that low-purity Ni yielded a β = 1.46 value. Kaul [26] suggested that the observed β values between 1 and 2 indicate that various mechanisms can be simultaneously present under certain circumstances (temperature, purity).
The only limitation of the work of Kaul [26] is that the measurements were carried out from 77 K upwards only (up to the Curie temperature). Therefore, a similar high-quality study of the Hall effect on a high-quality, well-characterized pure bulk Ni sample spanning the temperature range from liquid He to the Curie point would still be highly desirable in order to have a full set of consistent Hall effect data. One could then derive reliable values of the Hall coefficients and also clarify the actual value of the proportionality factor of the relationship Rsρxx.
Returning to Figure 7, we may notice that the displayed data show an overall common behavior only for resistivity data below the room-temperature resistivity of pure bulk Ni (ρxx(300 K) = 7.24 μΩ cm). This behavior was discussed in detail above. The remaining data displayed in Figure 7 are results for Ni samples, which exhibit a room-temperature resistivity higher than the pure bulk Ni value. The Ni samples with ρxx(300 K) values up to 8 μΩ cm [26,30,31] may still be considered as corresponding approximately to bulk Ni, but those with ρxx(300 K) values above this [24,34,37] do not (their insufficient quality is also reflected in their low RRR or RRR(77 K) values; see Appendix Table A1).
The reason for these high ρxx(300 K) values measured on macroscopic-size Hall samples is either high impurity level, deformation-induced microstructure, and/or reduced grain size. Therefore, the scattered Rs values for these nominally bulk Ni samples cannot be evaluated at all from the viewpoint of possible AHE mechanisms. This again underpins the need mentioned in the previous paragraph for reliable data for bulk Ni around room temperature.
From the data from the literature listed in the Appendix Table A1, we have not yet discussed two papers [39,40] on Ni thin films. Actually, we have omitted in both Figure 6 and Figure 7 the very large Rs(294 K) = −19.7 × 10⁻¹² Ω cm/G value of Gerber et al. [40] on a 100 nm Ni thick film as the room-temperature resistivity of this film was extremely large ρxx = 17.5 μΩ cm. No details regarding sample preparation, microstructure, or purity were reported by the authors to explain the origin of this very large resistivity. For lack of this information, we cannot speculate about the origin of the very high Rs value either.
The other thin film study is that by Li et al. [39] on much thinner and high-quality sputtered Ni films (with thicknesses from 6 nm to 30 nm). The authors studied for all films the temperature dependence of both ρxx and Rs. According to their results on the thickness dependence of ρxx, it turned out that surface scattering effects do not contribute to the 30 nm thick film, for which it was demonstrated that the relationship Rs ∝ (ρxx)β holds with β = 1.2 around T = 5 K, with β = 1.5 around T = 150 K, and with β = 1.8 around T = 330 K. This is qualitatively in agreement with the conclusion of Kaul [26] that β increases with temperature and that in various temperature ranges different mechanisms contribute predominantly to the AHE.
Actually, the main interest of Li et al. [39] was the determination of the more recently realized intrinsic contribution to the AHE. Li et al. [39] deduced the temperature dependence of the intrinsic contribution of the anomalous Hall conductivity, and they claimed that this is characteristic for Ni metal. Although their data analysis seems to be consistent in itself, we should make note of their results for their thickest Ni film (see the full square symbols in Figure 6 and Figure 7).
According to their data, the 30 nm thick Ni film, which they described as “bulk-like,” has a residual resistivity of about ρxx(5 K) = 1 μΩ cm. This compares well with the ρxx(3 K) = 0.975 μΩ cm value of our nc-Ni sample, with the latter well-documented as having a crystallite size of about 75 nm [4]. Furthermore, the two samples also have very close values of room-temperature resistivity (nc-Ni: ρxx = 8.78 μΩ cm; 30 nm Ni film: ρxx = 8.8 μΩ cm). It follows from this comparison that the 30 nm thick Ni film of Li et al. [39] does not correspond to a pure bulk Ni sample; the larger residual and room-temperature resistivity is the consequence of the presence of either a large density of grain boundaries or some uncharacterized impurities.
If we return to Figure 7, we can see that at roughly the same ρxx (300 K) value as our nc-Ni sample (red full triangle), the 30 nm thick Ni film [39] has a much larger Rs value (black full square). One can speculate that the relatively large room-temperature Rs values in both cases may originate from an enhanced grain-boundary scattering contribution to the AHE; because thin films typically consist of fine grains, eventually even smaller than our nc-Ni foil, this could also explain the difference in the observed high Rs values.
Because the influence of a possible contribution of grain boundaries on the AHE is not yet known, the conclusions of Li et al. [39] may be questioned in the sense that they may not be valid for pure bulk Ni metal. On the other hand, the need to explain the room-temperature Rs values obtained on these two samples underpins the importance of studying the influence of grain boundaries on the AHE in greater detail in the future.
We should also mention that our low-temperature Rs value at T = 3 K (see the red full triangle with a resistivity of ρxx = 0.975 μΩ cm in Figure 7) on the nc-Ni sample is definitely below the bulk Ni data at about the same ρxx values (as noted in the caption to Figure 7, the error of the Rs (3 K) value of our nc-Ni sample is within the data symbol). It is believed that this anomaly should be connected with the nanocrystalline state of our Ni sample, although it is not yet clear what might be the microscopic mechanism causing this difference in the induced Hall current. This is not simply a mean-free path effect, as both the bulk Ni samples and the nc-Ni sample have the same resistivity (ca. 1 μΩ cm), i.e., the same electron mean-free path, which was estimated to be about 42 nm for the nc-Ni sample [1], which is about the half of the crystallite size of this sample.
What we can see from these data is that at low temperatures, apparently, the same magnitude of resistivity leads to quite different Rs values depending on whether the resistivity is due to impurities (chemical impurities or lattice defects) distributed on an atomic-length scale or due to grain boundaries that are spatially distributed on a much larger length scale, corresponding to the average crystallite size.
In this section, the various theoretical models [3] regarding possible mechanisms contributing to the AHE of metallic ferromagnets were described. The available experimental data on the Rs values of bulk Ni metal were discussed within the framework of these models. At the same time, this extensive dataset also provided an appropriate basis against which we could compare our new results on nc-Ni. It turns out that there seem to be systematic deviations from the bulk values both at low temperatures and at room temperature, which can arise eventually due to the nanocrystalline state. However, further studies on both bulk and nanocrystalline Ni are necessary to clarify this issue.

6. Summary

In the present work, the temperature dependence of the resistivity as well as high-field magnetotransport data obtained at T = 3 K and 300 K are presented and discussed for a nc-Ni sample with an average crystallite size of 75 nm.
Due to the large density of grain boundaries, which represent additional scattering centers, the room-temperature zero-field resistivity was found to be about 20% higher than the value for bulk Ni, the latter resulting from the phonon term. Because grain-boundary scattering does not change with temperature (static disorder in the Ni lattice), the resistivity at 3 K, i.e., the residual resistivity, was only 11% of the room-temperature value. These features are in accordance with known results for nc-Ni [4,8].
In previous work [1], the LMR and TMR data were measured with an in-plane magnetic field up to H = 140 kOe for the same nc-Ni sample. In the present work, the resistivity was also measured with an out-of-plane magnetic field (polar magnetoresistance, PMR). From the difference of the previous LMR and the present PMR data in the magnetically saturated state, an out-of-plane anisotropic magnetoresistance (AMR) could be derived. It was found that the out-of-plane AMR parameters were in fairly good agreement at both temperatures with the corresponding in-plane AMR data [1], the latter obtained from the difference of the LMR and TMR data both measured with an in-plane magnetic field on the same nc-Ni foil. This agreement is actually an expected result, as the foil thickness was 9 μm and thus no surface scattering effects occurred.
The Hall effect data were also obtained up to 140 kOe at both temperatures with the magnetic field oriented perpendicular to the foil plane. The voltage drop Vxy across the width of the strip was measured for both positive and negative magnetic fields, which enabled us to eliminate voltage contributions not related to the Hall effect. From the obtained true Hall voltages, the Hall resistivity ρxx(B) was determined. From the ρxx(B) datasets, the ordinary (Ro) and anomalous (Rs) Hall coefficients were derived.
The Hall coefficients Ro and Rs obtained for the nc-Ni sample fitted into the large amount of data from the literature on Ni metal at both temperatures, although the latter ones exhibited fairly large scatter at a given temperature. We have listed several possible sources that can lead to incorrect experimental data if not properly taken into account. It turns out from a detailed overview of previously reported data that sample purity and microstructural state were not always well-documented in previous Hall effect studies. It was already noted in the literature that both purity [24] and strong mechanical deformations [30] (evidently causing microstructural changes) lead to a well-measurable change in the AHE coefficient in Ni metal, and this is definitely another reason for the large scatter of the reported Hall effect data.
Nevertheless, it could be established that for Ni metal, Ro decreases approximately linearly by about 20% from room temperature down to the liquid helium range. The fairly good agreement of our Ro data for nc-Ni with the bulk Ni data at both temperatures indicates that the nanocrystalline state does not have a noticeable influence on Ro, as expected considering the origin of Ro.
The anomalous Hall coefficient Rs of bulk Ni metal shows a drastic decrease with temperature; its value for bulk Ni is by more than an order of magnitude smaller at around 4 K than at room temperature. Most of the data for pure bulk Ni suggest that below room temperature, the relationship Rs ∝ (ρxx)β holds with β =1, which indicates the dominance of the skew-scattering mechanism here. Because this relationship remains valid down to the liquid He range, this also implies that as ρxx disappears for T ⟶ 0, the quantity Rs will also become zero for pure bulk Ni. The literature data also revealed that at around and somewhat above room temperature, the exponent β increases and it approaches 2, indicating that the side-jump mechanism becomes the dominant one. For temperatures approaching the Curie point, the contribution from spin–disorder becomes the most important one in the observed AHE coefficient Rs. These three mentioned mechanisms are properly discussed for Ni by Kaul [26].
Our overview of the available Hall effect data found that there is still a need for a new study of the Hall effect on a well-characterized pure bulk (well-annealed, coarse-grained) Ni sample from low temperatures up to the Curie point in order to determine the true Hall coefficients of Ni metal. This would be especially important for the AHE (Rs), as more recent developments in the theory of the AHE of ferromagnets have also revealed a so-called intrinsic mechanism [3] connected to electronic band structure effects. There have been already a few efforts to study this mechanism even for Ni metal both experimentally [39] and theoretically (see the paper by Ködderitzsch et al. [46] and references therein), and more efforts are needed in this field.
The major purpose of collecting AHE data for bulk Ni was, however, to provide a proper perspective for evaluating the Rs data obtained on our nc-Ni sample. Because this sample was properly characterized for both purity and microstructure (crystallite size), we had a chance to reveal if there is any influence of a large density of grain boundaries on the AHE. It should be noted that no previous report has been found in which the Ni sample was characterized for microstructure, especially for crystallite size or grain size.
At low temperatures (T = 3 K), we found that the nc-Ni sample has a smaller Rs value than bulk Ni samples with the same resistivity ρxx. It is tempting to assign this difference to the nanocrystalline state of our sample. Although we cannot put forward yet a microscopic mechanism to explain the different Rs values between nc-Ni and bulk Ni, it seems that the same magnitude of resistivity leads to different Rs values depending on whether resistivity is caused by impurities distributed randomly on an atomic-length scale or well-localized grain boundaries that are spatially distributed on a much larger length scale corresponding to the average crystallite size.
Our Rs data for the nc-Ni sample at T = 300 K compare well to the reported room-temperature Rs values on bulk Ni samples, which show a large scatter, probably due to impurities revealed by their too-large room-temperature resistivity. However, a corresponding result on a 100 nm Ni film was comparable to our results, and because both can be considered nanocrystalline, this may hint at a possible influence of grain boundaries on Rs also at T = 300 K. However, further studies on nc-Ni with various grain sizes are required to clarify this issue.

Author Contributions

I.B.: conceptualization; formal analysis; data curation; writing—original draft preparation; writing—review and editing; funding acquisition; M.B.: methodology; writing—review and editing; funding acquisition; F.D.C. and A.T.K.: investigation. All authors have read and agreed to the published version of the manuscript.

Funding

This research was funded by the DFG within the priority program SPP 1666 and by the project CeNIKS co-financed by the Croatian Government and the European Union through the European Regional Development Fund, Competitiveness and Cohesion Operational Programme (Grant no. KK.01.1.1.I02.0013).

Data Availability Statement

The data that support the findings of this study are available from the authors upon reasonable request.

Acknowledgments

I.B. is indebted to the Humboldt Foundation, Germany, for a one-month fellowship and to H. Ebert (Ludwig-Maximilians-Universität, München) for their kind hospitality during this research stay. The authors also acknowledge S.T.B. Gönnenwein and R. Gross (Walther-Meissner Institute for Low Temperature Research, Bavarian Academy of Sciences and Humanities, Garching) for generously putting the necessary experimental facility at our disposal in their laboratory for carrying out the electrical transport measurements described here. M.B. acknowledges the support of the European Union—NextGenerationEU through the National Recovery and Resilience Plan 2021–2026 institutional grant from University of Zagreb Faculty of Science “Encouraging competitive projects and top-tier scientific publications at the Department of Physics (ProPubFO)—ProPuBFO-1.1.3.2026”. The nc-Ni sample was kindly provided by E. Tóth-Kádár.

Conflicts of Interest

The authors declare that the research was conducted in the absence of any commercial or financial relationships that could be construed as a potential conflict of interest.

Appendix A

Table A1. Nickel Hall coefficient data. Notes: Figures in brackets for the data from this work refer to the error in the last digit; RT: room temperature; RRR = ρ(RT)/ρ(4.2 K): residual resistivity ratio; RRR(77 K) = ρ(RT)/ρ(77 K); for pure bulk Ni: RRR(77 K) = 14.5 [6,48] and ρ(300 K) = 7.25 μΩ cm [6].
T
(K)
RoRSρ(RT)
(μΩ cm)
Remarks
on Sample
Reference
(10−12 Ω cm/G)
3−0.308(15)−0.144(22)8.78electrodeposited nc-Ni
RRR = 9.1,
crystallite size: 75 nm
This work
300−0.439(22)−5.87(30)
4−0.330 RRR = 57.2Volkenshtein60 [20]
100−0.35−0.35
195−0.40−2.0
295−0.46−6.05
4−0.45 8Ni(99.99%), annealedDreesen60 [21]
100−0.51
200−0.555
300−0.59
4.15−0.740 JM Ni(99.999),
annealed (1050 °C, 24 h)
RRR = 480
Huguenin65 [22]
77−0.35−0.1
200−0.50−1.3
273−0.555−3.8
300−0.57−5
14.2−0.31−0.287.74electrolytic Ni
RRR = 19.8
Jan+Gijsman52 [23]
20.4−0.30−0.27
63.3−0.33−0.31
83−0.35−0.43
293−0.55−3.53
83 −1.7511.3commercial Ni
RRR(77 K) = 2.9
Jan52 [24]
101 −2.07
207 −3.76
286 −5.75
293 −5.93
307 −6.33

20
−0.58−0.257.2commercial Ni
annealed in hydrogen, 1 h
RRR = 18
Smit55 [25]
77−0.52−0.27
290−0.60−6.4
20−0.50.06.8Carbonyl Ni (99.88% Ni)
annealed in hydrogen, 1 h
RRR = 115
Smit55 [25]
77−0.36−0.19
290−1.26−2.4
80 −0.227.55JM spec-pure Ni (99.999%)
annealed (950 °C, 24 h)
in vacuum (10−5 Torr)
RRR(77 K) = 11.1
Kaul79 [26]
300 −3.6
4.15−0.700 JM spectr. pure Ni
RRR = 2200
Ehrlich68 [27]
282−0.56 (Cu: 1.2 w/o; Co: 2.3 w/o)Foner53 [28]
293−0.61 annealed/unannealedSchindler53 [29]
293−0.62−4.347.4sintered carbonyl Ni powder annealed in H2 (1150 °C, 2 h)Jellinghaus60 [30]
296−0.51−5.67.61Ni(99.9)
annealed (1050 °C, 15 min)
Köster61 [31]
296−0.61−5.35 Pugh53 [32] *
297 −4.5 single-crystal NiHiraoka68 [33]
298−0.61−4.910.8single-crystal film, RRR ≅ 3.1Galepov69 [34]
285 −5.0 Ni annealed; Hmax = 3 kOeKurbanniyazov73 [35]
305−0.6 7.5JM Ni, spec-pure annealed
(vacuum, 800 °C, 24 h)
Roy69 [36]
300−0.6−6.37.6799.9% Ni, RRR(77 K) = 11.0Lavine61 [37]
300−0.6−9.88.8899.4% Ni, RRR(77 K) = 4.1
300 −6.7 Ni annealed; Hmax = 3 kOeKondorskii64 [38]
5 −0.238.8evap. Ni film, 30 nm thick
RRR = 8.8
Ye12 [39]
300 −8.0
294 −19.717.5evap. Ni film, 100 nm thick
RRR ≅ 1.8
Gerber02 [40]
* The Hall coefficients reported in Ref. [32] have been obtained by these authors via reevaluating the original experimental data of Ref. [41].

References

  1. Bakonyi, I.; Czeschka, F.D.; Kiss, L.F.; Isnaini, V.A.; Krupp, A.T.; Palotás, K.; Zsurzsa, S.; Péter, L. High-field magnetoresistance of microcrystalline and nanocrystalline Ni metal at 3 K and 300 K. Eur. Phys. J. Plus 2022, 137, 871. [Google Scholar] [CrossRef] [Scilit]
  2. Jan, J.P. Galvanomagnetic and Thermomagnetic Effects in Metals. Solid State Phys. 1958, 5, 1–96. [Google Scholar]
  3. Nagaosa, N.; Sinova, J.; Onoda, S.; MacDonald, A.H.; Ong, N.P. Anomalous Hall Effect. Rev. Mod. Phys. 2010, 82, 1539–1592. [Google Scholar] [CrossRef] [Scilit]
  4. Bakonyi, I.; Isnaini, V.A.; Kolonits, T.; Czigány, Z.; Gubicza, J.; Varga, L.K.; Tóth-Kádár, E.; Pogány, L.; Péter, L. The specific grain-boundary electrical resistivity of Ni. Philos. Mag. 2019, 99, 1139–1162. [Google Scholar] [CrossRef] [Scilit]
  5. Bakonyi, I.; Tóth, E.; Pogány, L.; Cziráki, Á.; Gerőcs, I.; Varga, K.; Arnold, B.; Wetzig, K. Preparation and characterization of d.c.-plated nanocrystalline nickel electrodeposits. Surf. Coat. Technol. 1996, 78, 124–136. [Google Scholar] [CrossRef] [Scilit]
  6. Laubitz, M.J.; Matsumura, T.; Kelly, P.J. Transport properties of the ferromagnetic metals. II. Nickel. Can. J. Phys. 1976, 54, 92–102. [Google Scholar] [CrossRef] [Scilit]
  7. Bass, J. Electrical resistivity of pure metals and dilute alloys. In Landolt-Börnstein—Group III; New Series; Springer: Berlin/Heidelberg, Germany; New York, NY, USA, 1982; Chapter 1; Volume 15a, pp. 1–287. [Google Scholar]
  8. Bakonyi, I.; Tóth, E.; Tóth, J.; Cziráki, Á.; Fogarassy, B. Electronic transport in nanocrystalline metals: A study of electrodeposited nickel foils. Nanophase Mater. 1994, 260, 423–432. [Google Scholar]
  9. Campbell, I.A.; Fert, A. Transport Properties of Ferromagnets. Handb. Ferromagn. Mater. 1982, 3, 747–804. [Google Scholar]
  10. Bakonyi, I. Guidelines for the evaluation of magnetotransport parameters from measurements on thin strip-shaped samples of bulk metallic ferromagnets with finite residual resistivity. Eur. Phys. J. Plus 2018, 133, 521. [Google Scholar] [CrossRef] [Scilit]
  11. Kiss, L.F.; Bakonyi, I. An update to the demagnetization factor dataset calculated for the general ellipsoid by Osborn. Magnetism 2024, 4, 173–182. [Google Scholar] [CrossRef] [Scilit]
  12. Bakonyi, I.; Czeschka, F.D.; Isnaini, V.A.; Krupp, A.T.; Gubicza, J.; Varga, L.K.; Péter, L. High-field magnetoresistance measurements on Ni75Co25 and Ni40Co60 alloys at 3 K and 300 K. J. Magn. Magn. Mater. 2024, 591, 171683. [Google Scholar] [CrossRef] [Scilit]
  13. Rijks, T.G.S.M.; Lenczowski, S.K.J.; Coehoorn, R.; de Jonge, W.J.M. In-plane and out-of-plane anisotropic magnetoresistance in Ni80Fe20 thin film. Phys. Rev. B 1997, 56, 362–366. [Google Scholar] [CrossRef] [Scilit]
  14. Péter, L.; Kiss, L.F.; Bakonyi, I. Influence of demagnetizing effect on the shape and broadening of magnetoresistance curves. J. Magn. Magn. Mater. 2025, 622, 172947. [Google Scholar] [CrossRef] [Scilit]
  15. Onsager, L. Reciprocal relations in irreversible processes. II. Phys. Rev. 1931, 38, 2265–2279. [Google Scholar] [CrossRef] [Scilit]
  16. Coleman, R.V. Hall effect and transport in 3d ferromagnetic metals. AIP Conf. Proc. 1976, 29, 520–526. [Google Scholar] [CrossRef] [Scilit]
  17. Ashcroft, N.W.; Mermin, N.D. Solid State Physics; Holt-Saunders Japan Ltd.: Tokyo, Japan, 1981. [Google Scholar]
  18. Mizutani, U. Introduction to the Electron Theory of Metals; Cambridge University Press: Cambridge, UK, 2001. [Google Scholar]
  19. Foner, S.; Freeman, A.J.; Blum, N.A.; Frankel, B.; McNiff, E.J., Jr.; Praddaude, H.C. High-Field Studies of Band Ferromagnetism in Fe and Ni by Mössbauer and Magnetic Moment Measurements. Phys. Rev. 1969, 181, 863–882. [Google Scholar] [CrossRef] [Scilit]
  20. Volkenstein, N.V.; Fedorov, G.V. Temperature dependence of the Hall effect of pure ferromagnets. Sov. Phys. JETP 1960, 11, 48–50. [Google Scholar]
  21. Dreesen, J.A.; Pugh, E.M. Hall effect and resistivity of Ni-Pd alloys. Phys. Rev. 1960, 120, 1218–1223. [Google Scholar] [CrossRef] [Scilit]
  22. Huguenin, R.; Rivier, D. Effet Hall ordinaire et aimantation dans le nickel et les alliages dilués nickel-fer, nickel-cobalt et nickel-cuivre. Helv. Phys. Acta 1965, 38, 900–912. [Google Scholar]
  23. Jan, J.P.; Gijsman, J.M. L’effet Hall du fer et du nickel aux basses températures. Physica 1952, 18, 339–355. [Google Scholar] [CrossRef] [Scilit]
  24. Jan, J.P. Effet Hall et température dans les conducteurs ferromagnétiques. Helv. Phys. Acta 1952, 25, 677. [Google Scholar]
  25. Smit, J. The spontaneous Hall effect in ferromagnetics I. Physica 1955, 21, 877–887. [Google Scholar] [CrossRef] [Scilit]
  26. Kaul, S.N. Anomalous Hall effect in nickel and nickel-rich nickel-copper alloys. Phys. Rev. B 1979, 20, 5122–5130. [Google Scholar] [CrossRef] [Scilit]
  27. Ehrlich, A.C.; Rivier, D. Hall effect, magnnetoresistance, resistivity and size effect in Ni. J. Phys. Chem. Sol. 1968, 29, 1293–1304. [Google Scholar] [CrossRef] [Scilit]
  28. Foner, S.; Pugh, E.M. Hall effects of cobalt nickel alloys and of Armco iron. Phys. Rev. 1953, 91, 20–27. [Google Scholar] [CrossRef] [Scilit]
  29. Schindler, A.E.; Pugh, E.M. The Hall effect of copper-nickel alloys. Phys. Rev. 1953, 89, 295–298. [Google Scholar] [CrossRef] [Scilit]
  30. Jellinghaus, W.; de Andrés, M.P. Hall-Effekt und Leitfähigkeit der Eisen-Nickel-Legirungen. Ann. Phys. 1960, 460, 187–199. [Google Scholar] [CrossRef] [Scilit]
  31. Köster, W.; Gmöhling, W.Z. Leitfähigkeit und Hallkonstante XV. Die Mischkristalle des Nickels mit Nachbarelementen im Periodischen System. Metallkunde 1961, 52, 713–720. [Google Scholar]
  32. Pugh, E.M.; Rostoker, N. Hall effect in ferromagnetic metals. Rev. Mod. Phys. 1953, 25, 151–157. [Google Scholar] [CrossRef] [Scilit]
  33. Hiraoka, T. Hall Effect and the Pressure Effect in Single Crystals of Nickel. J. Sci. Hiroshima Univ. 1968, 32, 153. [Google Scholar]
  34. Galepov, P.S.; Kovalevich, A.A. Hall effect and conductivity in single-crystal iron-nickel films. Sov. Phys. J. 1969, 12, 937–939. [Google Scholar] [CrossRef] [Scilit]
  35. Kurbanniyazov, N.; Cheremushkina, A.V.; Akmuradov, B.A. Hall effect and electrical resistance of Ni, Co, and Ni-Co alloys. Sov. Phys. J. 1973, 16, 539–541. [Google Scholar] [CrossRef] [Scilit]
  36. Roy, S.K.D.; Subrahmanyam, A.V. Hall effect, magnetic resistivity, and magnetic susceptibity of nickel and nickel –copper alloys. Phys. Rev. 1969, 177, 1133–1138. [Google Scholar] [CrossRef] [Scilit]
  37. Lavine, J.M. Extraordinary Hall-effect measurements on Ni, some Ni alloys, and ferrites. Phys. Rev. 1961, 123, 1273–1277. [Google Scholar] [CrossRef] [Scilit]
  38. Kondorskii, E.I.; Cheremushkina, A.V.; Kurbaniyazov, N. Hall effect in ferromagnetic metals and alloys. Sov. Phys. Solid State 1964, 6, 422–429. (In Russian) [Google Scholar]
  39. Ye, L.; Tian, Y.; Jin, X.F.; Xiao, D. Temperature dependence of the intrinsic anomalous Hall effect in nickel. Phys. Rev. B 2012, 85, 220403. [Google Scholar] [CrossRef] [Scilit]
  40. Gerber, A.; Milner, A.; Karpovsky, M.; Lemke, B.; Habermeier, H.U.; Tuaillon-Combes, J.; Négrier, M.; Boisron, O.; Mélinon, P.; Perez, A. Extraordinary Hall effect in magnetic films. J. Magn. Magn. Mater. 2002, 242–245, 90–97. [Google Scholar] [CrossRef] [Scilit]
  41. Smith, A.W. The variation of the Hall effect in metals with change of temperature. Phys. Rev. 1910, 39, 1–35. [Google Scholar] [CrossRef] [Scilit]
  42. Campbell, I.A. Hall effect and resistivity anisotropy in Ni alloys. Phys. Rev. Lett. 1970, 24, 269–271. [Google Scholar] [CrossRef] [Scilit]
  43. Eastman, J.A.; Fitzsimmons, M.R.; Thompson, L.J. The thermal properties of nanocrystalline Pd from 16 to 300 K. Philos. Mag. B 1992, 66, 667–696. [Google Scholar] [CrossRef] [Scilit]
  44. Nix, F.C.; McNair, D. The Thermal Expansion of Pure Metals: Copper, Gold, Aluminum, Nickel, and Iron. Phys. Rev. 1941, 60, 597–605. [Google Scholar] [CrossRef] [Scilit]
  45. Miedema, A.R.; Dorleijn, J.W.F. On the normal Hall effect in nickel alloys. J. Phys. 1977, 7, L27–L31. [Google Scholar] [CrossRef] [Scilit]
  46. Ködderitzsch, D.; Chadova, K.; Minár, J.; Ebert, H. Impact of finite temperatures and correlations on the anomalous Hall conductivity from ab initio theory. New J. Phys. 2013, 15, 053009. [Google Scholar] [CrossRef] [Scilit]
  47. Yue, D.; Jin, X. Towards a Better Understanding of the Anomalous Hall Effect. J. Phys. Soc. Jpn. 2017, 86, 011006. [Google Scholar] [CrossRef] [Scilit]
  48. White, G.K.; Woods, S.B. Electrical and thermal resistivity of the transition elements at low temperatures. Philos. Trans. R. Soc. Lond. Ser. A Math. Phys. Sci. 1959, 251, 273–302. [Google Scholar] [CrossRef] [Scilit]
Figure 1. Temperature dependence of the normalized resistivity measured in zero magnetic field on the nc-Ni foil.
Magnetism 06 00019 g001
Figure 2. Field dependence of the resistivity ρ at (a) T = 3 K and (b) T = 300 K for the nc-Ni foil with magnetic field orientations as indicated (TMR, PMR) in the magnetic field range from −150 kOe to +150 kOe. (c) Magnetoresistance ratio Δρ/ρo vs. magnetic field H at T = 3 K and 300 K. The insets in (a,b) show data on an enlarged scale in the magnetic field range from −10 kOe to +10 kOe.
Magnetism 06 00019 g002
Figure 3. Field dependence of the measured voltage Vxy at T = 3 K (left) and T = 300 K (right) for the nc-Ni foil with the magnetic field oriented perpendicular to the foil plane. The straight lines through the data points in the high-field range are given only to indicate that at both temperatures the high-field slopes are different for the H < 0 and H > 0 field ranges.
Magnetism 06 00019 g003
Figure 4. Dependence of the Hall resistivity ρHall(B) on the magnetic induction B at T = 300 K and T = 3 K for the nc-Ni foil with the magnetic field oriented perpendicular to the foil plane. The experimental data are indicated by the red (300 K) and blue (3 K) symbols. The dashed lines through the data points in the high-field range are the linear fits according to Equation (6) to the experimental data. The expressions in the text boxes describe the results of the linear fits in units of the axes.
Magnetism 06 00019 g004
Figure 5. Ordinary Hall coefficient Ro data for Ni metal as a function of temperature. Key to symbols: ▲ nc-Ni, sample #B2 (this work); ◇ Volkenshtein60 [20]; □ Dreesen60 [21]; △ Huguenin65 [22]; * Jan+Gijsman [23]; ○ Smit55 (commercial Ni) [25]; + Smit55 (carbonyl Ni) [25]; ◆ data reported at a single temperature from Refs. [27,28,29,30,31,32,34,36,37]. The lines through the data points are given only as guides for the eye and to better identify the general evolution of data with temperature. In order to keep the ordinate scale at high resolution, the Ro(290 K) value of Smit55 (carbonyl Ni) [25] is indicated in a textbox only.
Magnetism 06 00019 g005
Figure 6. Anomalous Hall coefficient Rs data for Ni metal as a function of temperature. Key to symbols: ▲ nc-Ni, sample #B2 (this work); ◇ Volkenshtein60 [20]; □ Jan52 [24]; △ Huguenin65 [22]; * Jan+Gijsman52 [23]; ○ Smit55 (commercial Ni) [25]; + Smit55 (carbonyl Ni) [25]; ● Kaul79 [26]; ■ Ye12 [39], 30 nm thick film; ◆ data reported at a single temperature from Refs. [30,31,32,33,34,35,37,38]. Note: The error bar for our nc-Ni sample at T = 3 K is within the data symbol (red solid triangle). The lines through the data points from two references are provided only as guides for the eye and to better identify the general evolution of the data with temperature.
Magnetism 06 00019 g006
Figure 7. Anomalous Hall coefficient Rs data for Ni metal as a function of the zero-field resistivity ρxx with the temperature as an internal parameter. Key to symbols: ▲ nc-Ni, sample #B2 (this work); □ Jan52 [24]; * Jan+Gijsman52 [23]; ○ Smit55 (commercial Ni) [25]; + Smit55 (carbonyl Ni) [25]; ● Kaul79 [26]; ■ Ye12 [39], 30 nm thick film; ◆ data reported at a single temperature from Refs. [30,31,34,37]. The solid and dotted lines through the data points of different series are provided only as guides for the eye. The vertical dashed line indicates the room-temperature value of ρxx for pure bulk Ni [6,7]. The inset shows a magnified view of the data in the vicinity of the origin. Note: The error bar for our nc-Ni sample at T = 3 K is within the data symbol (red solid triangle).
Magnetism 06 00019 g007
Disclaimer/Publisher’s Note: The statements, opinions and data contained in all publications are solely those of the individual author(s) and contributor(s) and not of MDPI and/or the editor(s). MDPI and/or the editor(s) disclaim responsibility for any injury to people or property resulting from any ideas, methods, instructions or products referred to in the content.