Article

Ab Initio Investigation on the Magnetic Moments, Magnetocrystalline Anisotropy and Curie Temperature of Fe2P-Based Magnets

by
Stephan Erdmann
1,*,
Halil İbrahim Sözen
1,2 and
Thorsten Klüner
1
1
Institute of Chemistry, Carl von Ossietzky University Oldenburg, D-26129 Oldenburg, Germany
2
Mercedes-Benz Turk A.S., Orhan Gazi Mahallesi, Mercedes Bulvari No. 17/1, Esenyurt, Istanbul 34519, Turkey
*
Author to whom correspondence should be addressed.
Magnetism 2025, 5(2), 14; https://doi.org/10.3390/magnetism5020014
Submission received: 30 April 2025 / Revised: 27 May 2025 / Accepted: 3 June 2025 / Published: 10 June 2025

Abstract

:
Permanent magnetic materials are essential for technological applications, with the majority of available magnets being either ferrites or materials composed of critical rare-earth elements, such as well-known Nd2Fe14B. The binary Fe2P material emerges as a promising candidate to address the performance gap, despite its relatively low Curie temperature T C of 214 K. In this study, density functional theory was employed to investigate the effect of Si and Co substitution on the magnetic moments, magnetocrystalline anisotropy energy (MAE) and Curie temperature in Fe 2 y CoyP1−xSix compounds. Our findings indicate that Si substitution enhances magnetic moments due to the increase in 3f-3f and 3f-3g interaction energies, which also contribute to higher T C values. Conversely, Co substitution leads to a reduction in magnetic moments, attributable to the inherently lower magnetic moments of Co. In all examined cases of different Si concentrations, such as hexagonally structured Fe 2 y CoyP, Fe 2 y CoyP0.92Si0.08 and Fe 2 y CoyP0.84Si0.16, Co substitution increases the Curie temperatures by augmenting 3g-3g exchange interaction energies. Both Si and Co substitutions decrease the magnetocrystalline anisotropy energy, resulting in the loss of the easy magnetization direction at higher Co contents. However, higher Si concentrations appear to confer resilience against the loss. In summary, Si and Co substitutions effectively modify the investigated magnetic properties. Nonetheless, to preserve a high MAE, the extent of substitution should be optimized.

1. Introduction

Magnetic materials are becoming increasingly vital for modern applications, such as renewable energy generation (e.g., wind power) and sustainable transportation (electric vehicles). This growing importance has led to significant efforts in developing new and cost-effective materials [1,2,3,4,5,6].
However, the market is divided into two primary segments, with a ratio of approximately 2:1 between Nd–Fe–B and hard ferrites [7,8]. Presently, the cost disparity between these two segments is estimated to be more than 25:1 [9].
Ferrites like BaFe12O19 or SrFe12O19, are composed of readily available elements and are inexpensive to manufacture, but their magnetic properties are relatively low. For high-performance applications, Nd2Fe14B magnets are predominantly used. These materials consist of rare-earth (RE) and transition metal (TM) elements. They benefit from high anisotropy and a high magnetization provided by the RE and TM elements, respectively. However, even though these materials exhibit excellent magnetic properties, they have the major disadvantage of high cost. This is due to the need to incorporate RE-elements like Nd, Dy, Sm or Tb to increase the Curie temperature to operational levels [10]. Additionally, most rare-earth elements and some transition metals are also labeled as critical resources for future applications [11,12].
This supremacy of ferrites and Nd2Fe14B magnets creates a performance gap in available permanent magnetic materials [13] and has led to extensive scientific research into promising RE-lean or RE-free materials. One noteworthy material that can potentially fill the performance gap of hard magnets is the hexagonally structured binary Fe2P compound [6,14,15]. It primarily consists of inexpensive and available Iron and exhibits a high magnetization value of 1.03 T. Due to its hexagonal crystal structure, it shows uniaxial anisotropy in the range of 2.3 to 2.6 MJ/m³ [13,16,17,18,19,20]. The main drawback of the binary Fe2P compound is its relatively low Curie temperature of only 214 K [17,19,21,22]. However, the Curie temperature of Fe2P can easily be increased, as has been shown in the literature [6,10,23,24]. One possible way to modify the Curie temperature is the substitution of Fe and P with other metals or metalloids, such as Co and Si.
In this study, we focus on the effect of Si and Co substitution on the magnetic moments ( m t o t ), the magnetocrystalline anisotropy energy (MAE), and the Curie temperature ( T C ) of previously investigated Fe2−yCoyP1−xSix compounds [6] in the hexagonal crystal structure. The main novelty of this work is the MAE calculations performed on ternary Fe2P1−xSix and Fe2−yCoyP and quarternary Fe2−yCoyP1−xSix compounds. On these compounds, only limited data is available regarding the influence of simultaneous Si and Co substitution on the MAE [13,25]. Another interesting point of this study is the calculation of theoretical T C s and magnetic moments with connected investigation of the J i j exchange interaction energies, which has also not been covered by many publications in the past [26]. To gain a systematic understanding, we started with the substitution-free binary Fe2P-structure and proceeded with the influence of Si substitution in Fe2P1−xSix compounds with 0 x 0.5 . Then, we investigated the influence of Co substitution with 0 y 1 Co per f.u. in Fe2−yCoyP1−xSix with x = 0.0, 0.08 and 0.16 Si per f.u. to see the sole and combined impact of both Si and Co substitution.
Our former investigation [6] and other studies [14,15,23,25,27,28,29] have shown that increasing Si and Co concentrations significantly influence the stability of the hexagonal crystal structure. Concentrations of Si higher than x = 0.25 (∼8 at.% Si) are reported to lead to a phase transition to a body-centered-orthorhombic structure, while high amounts of Co result in a transition to a Co2P phase. Note that in the case of quarternary Fe2−yCoyP1−xSix compounds, the transition to a Co2P structure shifts to higher Co concentrations with higher Si content. This results in solubility limits of 10, 13, and 20 at.% Co at y = 0.3, 0.4 and 0.6 Co per f.u. with x = 0.0, 0.08 and 0.16 Si. The stable area of the hexagonal structure is therefore enlarged by simultaneous Si and Co substitutions. For this work, we exclusively considered the hexagonal crystal structure in our calculations and neglected other phases like the BCO or Co2P phase, which appear at higher Si or Co concentrations, respectively. However, for completeness, we marked the experimentally found appearances of BCO (Si) or Co2P (Co) structures in the figures as dashed lines.
This paper is organized as follows. Section 2 provides a detailed description of the computational methods we used for the theoretical approaches and the calculation of the MAE. Section 3 starts with a brief overview of the Fe2P compound in Section 3.1. The following Section 3.2 details the calculated results for the magnetic moments and their connection to the exchange interaction energies J i j . Section 3.3 explores the influence of Si and Co on the magnetocrystalline anisotropy energy, which is followed in Section 3.4 by investigations on the Curie temperature and further details on the exchange interaction energies. Finally, the paper concludes in Section 4 with remarks and discussions.

2. Computational Details and Methods

First principles calculations were conducted within the framework of spin-polarized density functional theory using the Vienna ab initio Simulation Package (VASP) [30,31]. The projector-augmented wave method (PAW) was utilized as implemented in VASP. The exchange–correlation effects were treated within the generalized gradient approximation (GGA) of Perdew–Burke–Ernzerhof (PBE) [32]. The Brillouin zone was sampled with a k-point mesh described by a Γ-centered grid considering 10 × 10 × 10 meshes for supercells containing 36 atoms. The supercells were built by enlarging the primitive unit cell of the binary Fe2P by 2 × 2 and step-wise substitution of Fe and P atoms with Co and Si. For each substitution, all possible Wykoff sites were considered, and the atom positions and cell volumes were optimized self-consistently in our calculations. The energetically most favorable substitution site was chosen for each following step. The cut-off energy for the plane wave basis was 500 eV, and the width of the smearing parameter was 0.01 eV. The convergence criteria within the self-consistent field (SCF) scheme was set to 10 5 eV. The values of these input parameters ensured an energy convergence with an error equal to or smaller than 1 meV/atom.
For the magnetocrystalline anisotropy energy (MAE), additional calculations using the local spin density approximation (LSDA) were considered [33,34]. The optimized geometries from the GGA investigations were used as an input to account for the changes in cell volume and c/a ratio, which both have a considerable influence on MAE and T C . To account for the higher precision needed for MAE calculations, the k-point mesh density was increased to 12 × 12 × 12 meshes, and the convergence criteria was set to 10 7 eV.
The MAE was determined by calculating the energy difference between different magnetization directions with the following equation:
Δ E M A E = E ( [ 001 ] ) E ( [ 100 ] )
The energy difference E M A E was calculated between the easiest magnetization direction and harder-to-magnetize directions. For all compounds in this work, this corresponds to the [001] direction as the easy magnetization axis and [100] for the direction in the plane perpendicular to [001]. The angle ϕ between both directions is taken in this work as 90°, which directly translates the energy difference E M A E from the anisotropy constant K 1 .
For binary Fe2P, an uniaxial anisotropy is reported [17,19]. This is supported by an anisotropy constant K 1 > 0. The easy magnetization axis is found to be the c axis ([001]), and the considered direction in the plane perpendicular to c is the a axis ([100]).
With uniaxial anisotropy, the second-order and third-order anisotropy constants K 2 and K 3 are negligibly small compared to K 1  [35] and can therefore be neglected as long as K 1 > 0. In cases where K 1 < 0, the second and third-order constants K 2 and K 3 are important and need to be considered to determine the easy magnetization plane [36]. In this work, the focus is on compounds with K 1 > 0, and materials with a negative first-order anisotropy constant need to be further investigated in future works. For completeness, resulting negative anisotropy constant values were included in the results.
Additionally to the anisotropy constant K 1 , the anisotropy field H a can be evaluated. The anisotropy field H a represents the theoretical upper limit of the coercivity and can be calculated with the polarization magnetization μ 0 M s using Equation (2).
H a = 2 K 1 μ 0 M s
The presented values for K 1 and H a in this work are calculated at T = 0 K and exclude the temperature dependence of these properties.
Previous investigations [1,37,38,39] have shown that the GGA functional often does not sufficiently reproduce the MAE leading to an underestimation of the value. The cause of this can be the included gradient corrections, which can inaccurately represent the exchange–correlation energy. This makes it necessary to additionally consider the LSDA functionals, which are specifically designed to handle spin polarization and are therefore well suited to accurate MAE calculations.
In order to estimate the Curie temperature, the exchange interaction energies J i j for the converged ferromagnetic (FM) states of the hexagonal structures were calculated via the Liechtenstein method [40], employing the magnetic force theorem approach. In this approach, the exchange energies are determined by calculations of total energy variations for small deviations of some magnetic moments from the ground state magnetic configuration. The magnetic couplings were calculated using density functional theory, following the Korringa–Kohn–Rostoker (KKR) [41,42] method and Green’s function method, implemented in the AKAIKKR [43] code—also known as MACHIKANEYAMA—within the atomic sphere approximation incorporating the coherent potential approximation (CPA) [44,45]. The atomic sphere radii were based on the Wigner–Seitz radii of each atom [46]. Continuous concentration changes for both the Fe and P sublattices were considered based on KKR-CPA. All KKR calculations qwew based on the local density approximation [33,34], taking the exchange correlation function as parametrized by Moruzzi, Janak, and Williams [47]. In this work, the scattering was considered up to d scattering (lmax = 2) in the systems. For the Brillouin zone quality, 448 k -points in the irreducible Brillouin zone were chosen together with an edelt (an imaginary energy attached to the Fermi energy) of 0.001 Ry to achieve a convergence of the Curie temperatures up to a variation of only 5 K. As an input structure for each KKR calculation, the theoretically relaxed (VASP, GGA-PBE) values are considered to include cell volume and c/a ratio changes caused by Si and Co substitution.

3. Results

3.1. Physical and Magnetic Properties of the Binary Parent Fe2P

The hexagonally structured binary Fe2P compound consists of six Fe atoms in weakly magnetic 3f and strongly magnetic 3g Wykoff positions and three P atoms in the 2c and 1b sites. The P atoms are distributed in the 2c and 1b positions with a ratio of 2:1. The Fe atoms in the 3f position are surrounded by two metalloids in the 2c and two metalloids in the 1b position, forming a tetrahedral environment. The Fe atoms in the 3g site on the other hand are adjacent to four metalloids in the 2c position and one metalloid in the 1b position, thus forming a square-based pyramid. Additionally, the Fe atoms in the 3f and 3g Wykoff sites are in alternating layers in the c direction of the crystal structure. A schematic representation of the unit cell for binary Fe2P is shown in Figure 1. In Table 1, we summarize our estimated results for the physical and magnetic properties of substitution-free Fe2P to verify them against other theoretical [48] and experimental data [16,17,49]. Data by Khonghorzul et al. [48] shows identical lattice constants to the results in our study, which are 5.809 and 3.425 Å. Properties like magnetic moments and polarization magnetization compare well against experimental data by Tobola et al. [16] and Fujii et al. [17]. The bulk modulus of 214 GPa is calculated using the Birch–Murnaghan equation of states by changing the volume of the unit cell and plotting the resulting energy against the volume. Only a slight underestimation compared to the value of 223 GPa measured by Dera et al. [49] is observed, which is to be expected. The biggest difference can be attributed to the anisotropy constant K 1 and the anisotropy field H a , where the experimental values amount to 2.68 MJ/m³ and 6.5 T, respectively. Nevertheless, our GGA results of 3.26 MJ/m³ and 6.17 T are in reasonably good agreement with the experiment, while our LSDA results of 1.33 MJ/m³ and 2.52 T are clearly underestimated in the case of binary Fe2P.

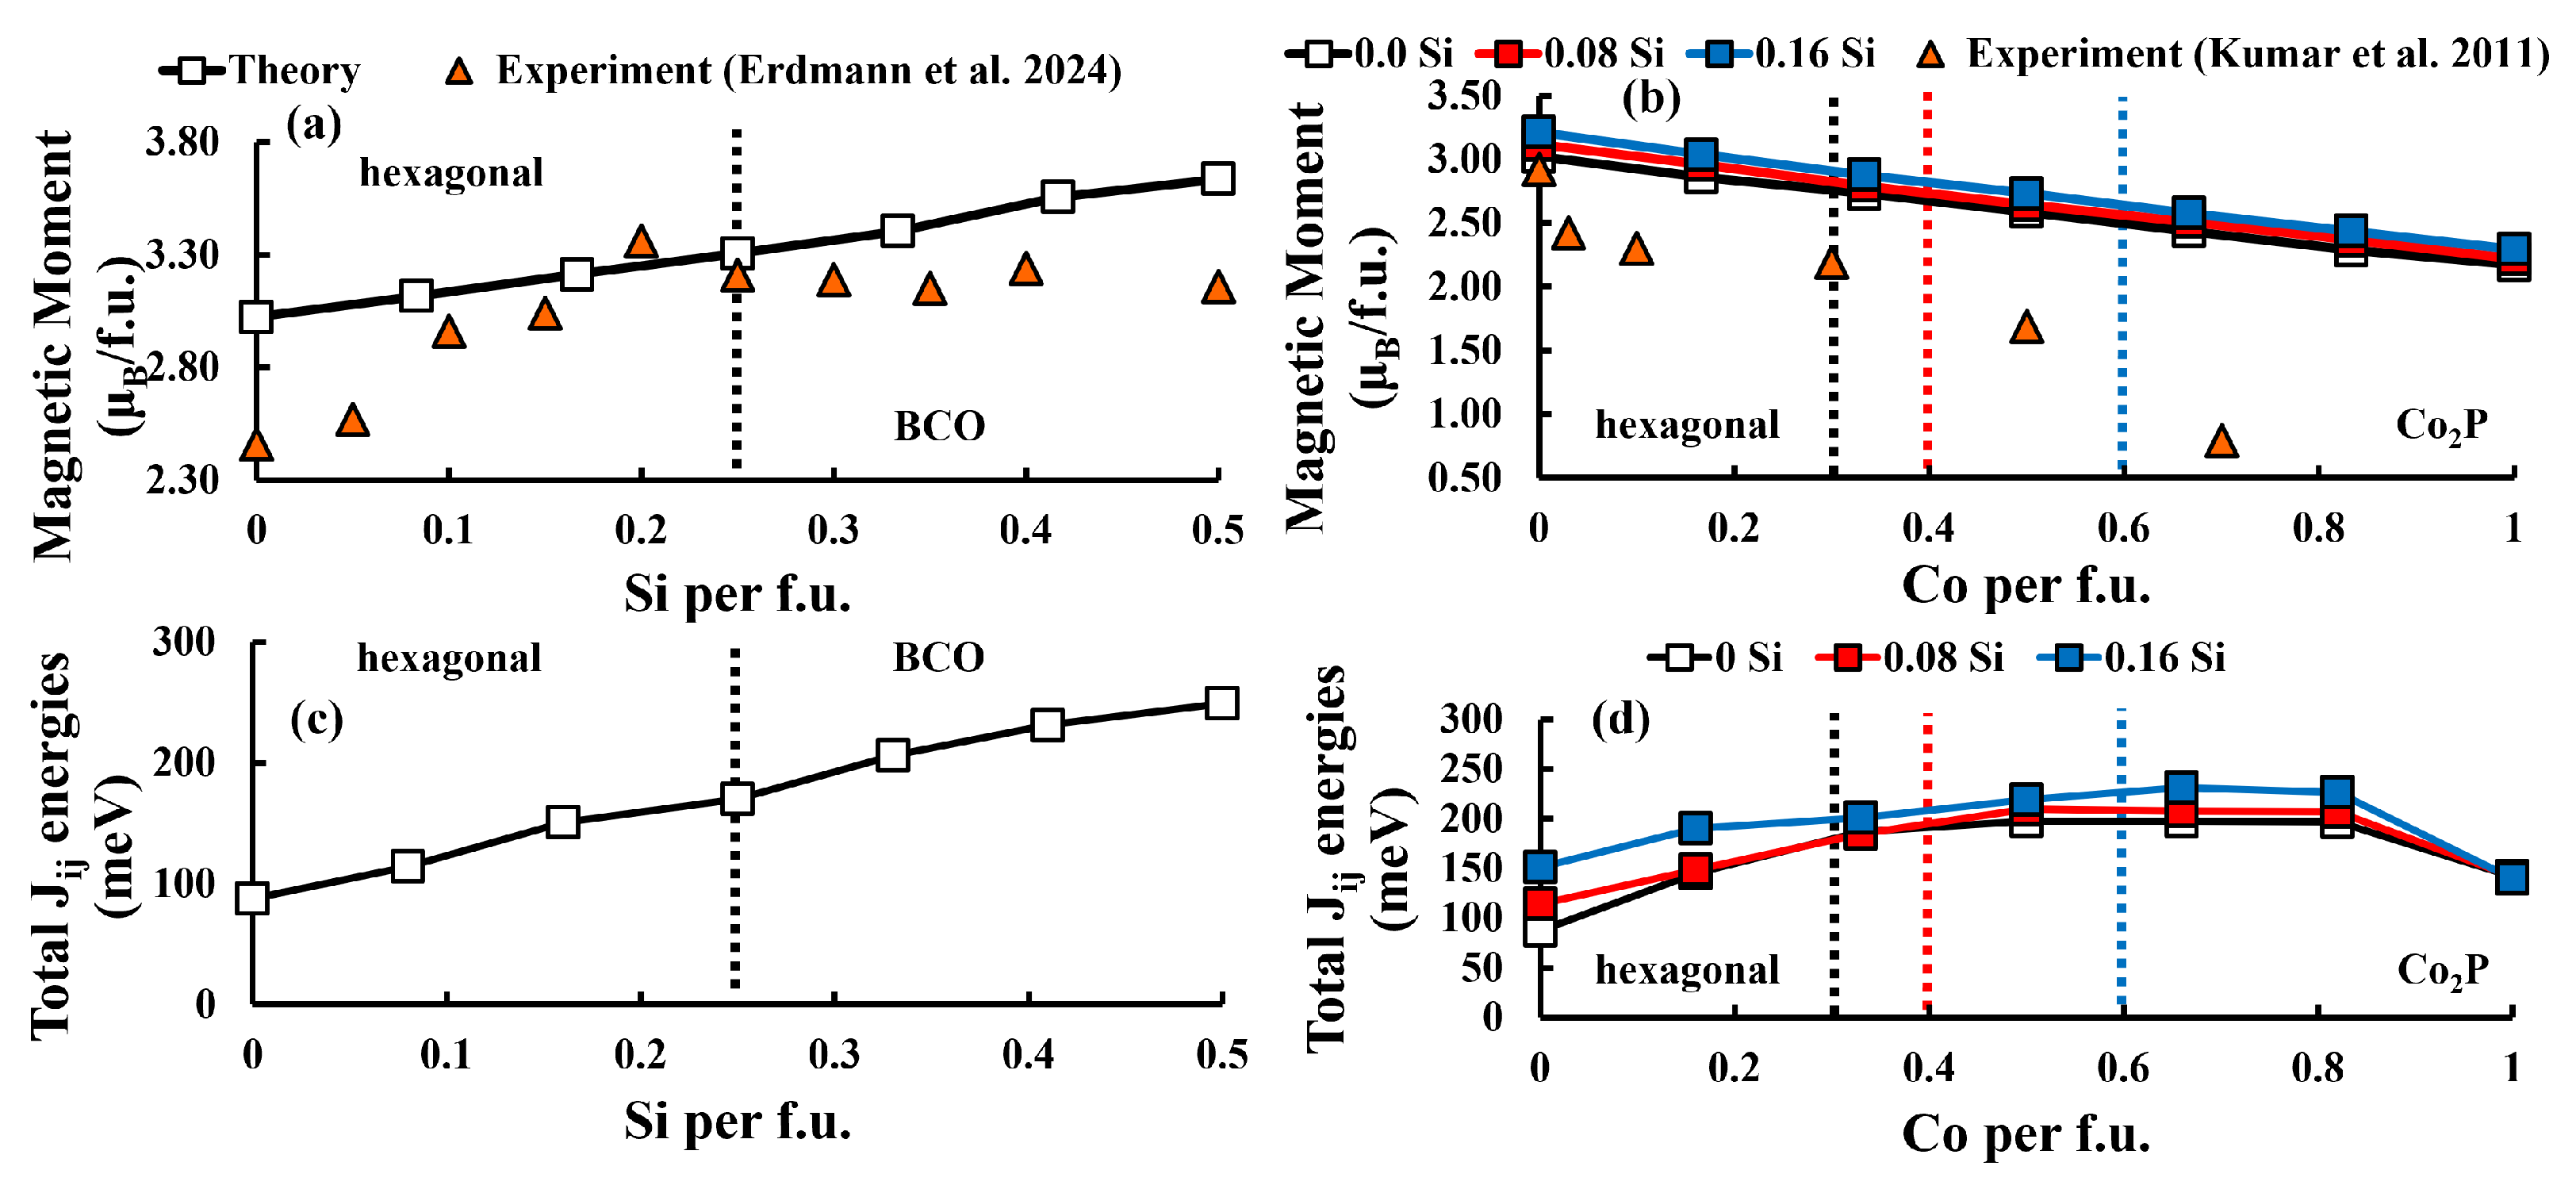
3.2. Evolution of Magnetic Moment, Polarization and | B H | m a x

Previous studies have shown that binary Fe2P can undergo different substitution schemes to modify its magnetic properties, e.g., the magnetic moments and Curie temperature [6,13,15,50]. The Fe atoms can readily be substituted by other 3d or 4d elements, such as the elements from Ti to Ni, as well as the elements Nb, Ru, Rh or Pd [51,52,53,54]. Additionally, the P atoms can easily be interchanged with other metalloids like B, Si, Ge or As [15,25,28]. Nevertheless, all of these substitution schemes raise a challenge in maintaining the desired hexagonal crystal structure of Fe2P as other competing structures such as a body-centered orthorhombic (BCO) or a Co2P phase begin to appear [6,15,55].
In our previous study, we found that Si tends to substitute into the 2c and Co into the tetrahedral 3f sites [6], which was confirmed in this work, too. Since we already examined the influence of Si and Co on properties like lattice constants and formation energies, we focused in this work on the magnetic moments, the magnetocrystalline anisotropy energy, and the Curie temperature. The magnetic moments and Curie temperature have been investigated in more detail by calculation of the exchange interaction energies J i j .
In Figure 2, the evolutions of the magnetic moments and total exchange interaction energies J i j as a function of Si and Co substitution are shown. In (a), it can be seen that the magnetic moment increases up to 3.61 μ B /f.u. with x = 0.5 Si per f.u., which aligns with the existing literature [50,56,57]. The main effect of this raise can be attributed to the 3f site, which increases systematically from 0.83 to 1.5 μ B /f.u., while the 3g atoms remain at a constant value of ∼2.2 μ B /f.u. Delczeg-Czirjak et al. [58] also reported a slight increase in the magnetic moments in the 3f position from 1.67 to 1.78 μ B at x = 0.4 Si per f.u. Experimental values from our previous investigation also support this trend of increasing magnetic moments with Si substitution [6]. However, note that the experimental data from our previous work are prone to uncertainties due to non-negligible secondary phases in the sample and experimental conditions that do not allow for a complete saturation. This leads to a certain discrepancy between the theoretical and experimental results as visible in Figure 2a. The observed increase in the 3f site can be attributed to the overall increase in the cell volume and to a decrease in the c/a ratio, which results in an overall increase in the exchange interaction energies from ∼87 meV to ∼250 meV in Figure 2c. The higher total exchange interaction energies result mainly from increasing values for the 3f-3f and 3f-3g interactions, while the 3g-3g energies remain relatively constant. This is illustrated in Figure 3.
The total magnetic moments as a function of Co substitution are shown in Figure 2b. It can be seen that there is a decreasing trend for all three cases ( Fe 2 y CoyP1−xSix with x = 0.0, 0.08 and 0.16 Si). This is corroborated by theoretical and experimental reports that found a lowering of the magnetization with increasing Co concentrations [13,15,26,28,59,60,61,62]. However, contrary to this decrease, the total exchange interaction energies increase significantly up to values of 198 (0.0 Si), 210 (0.08 Si) and 231 meV (0.16 Si) for y = 0.5, 0.5 and 0.66 Co per f.u., respectively. This can be attributed to an increase in the 3f-3f and 3g-3g exchange interaction energies as visible in Figure 3. It can be seen that the 3g-3g interactions significantly grow with higher Co concentrations, while the 3f-3f and 3f-3g interactions mostly increase at low Co contents ( y 0.2 Co per f.u.). With y 0.2 Co, both, 3f-3f and 3f-3g only see minor changes with the exception of the full substitution of the 3f site with Co atoms (y = 1.0), which causes a significant drop in the exchange interaction energies.
Figure 2. (a) Evolution of the magnetic moments in μ B /f.u. with Si substitution in the range 0 x 0.5 . Experimental data by from Erdmann et al. [6] is shown for comparison. (b) Evolution of the total magnetic moments with Co substitution in the range 0 y 1.0 for compounds with x = 0.0 (black), 0.08 (red) and 0.16 (blue) Si per f.u. Experimental data from Kumar et al. [62] is shown for comparison. (c) Increase in the total exchange interaction energies by Si substitution from x = 0.0 Si to x = 0.5 Si per f.u. (d) Increase in the total exchange interaction energies by Co substitution from x = 0.0 Si to x = 0.5 Si per f.u. for compounds with x = 0.0 (black), 0.08 (red), and 0.16 (blue) Si per f.u. Vertical dashed lines represent the reported phase transitions to the body-centered-orthorhombic (BCO) (∼8 at.% Si) or Co2P (Co) phases. For Co substitution, the vertical dashed lines represent the phase transitions for compounds with 0.0 (black, ∼10 at.% Co), 0.08 (red, ∼13 at.% Co), and 0.16 (blue, ∼20 at.% Co) Si per f.u.
Magnetism 05 00014 g002
Figure 3. Theoretical exchange interaction energies J i j for Fe2P1−xSix ternaries in the range of 0 x 0.5 Si (upper left) and Fe2−yCoyP1−xSix quaternaries with x = 0.0, 0.08 and 0.16 Si per f.u. in the range of 0 y 1.0 Co per f.u. Vertical dashed lines represent the reported phase transitions to the body-centered-orthorhombic (BCO) (∼8 at.% Si) or Co2P (Co) phases. In case of Co substitution, the phase transition to Co2P is marked with vertical dashed lines for compounds with 0.0 Si (black, ∼10 at.% Co), 0.08 Si (red, ∼13 at.% Co), and 0.16 Si per f.u. (blue, ∼20 at.% Co).
Magnetism 05 00014 g003
Since all partial exchange interaction energies 3f-3f, 3f-3g and 3g-3g increase at least by small amounts, except for the full Co substitution in the 3f site, the observed decrease in magnetic moments must be caused by the generally lower magnetic moments of the Co atom. Comparison of the magnetic moments for the Fe and Co atoms in the 3f site shows that the magnetic moments of the Fe atoms range from 0.73 to 1.02 μ B depending on Si and Co contents. However, all Co atoms in the 3f site exhibit a lower magnetic moment between 0.28 and 0.42 μ B . These values are roughly half as high as the magnetic moments of the Fe atoms in the 3f position and are therefore the main reason for the decrease in the total magnetic moment. All site-specific magnetic moments for the Fe 2 y CoyP1−xSix compounds with x = 0.0, 0.08 and 0.16 Si are shown in the Supplementary Material.
These changes in magnetic moments lead in parallel to the same changes in saturation polarization μ 0 M S and the | B H | m a x , which are also important magnetic properties [63,64]. The resulting values for both will be given in the supplementary material for completeness.

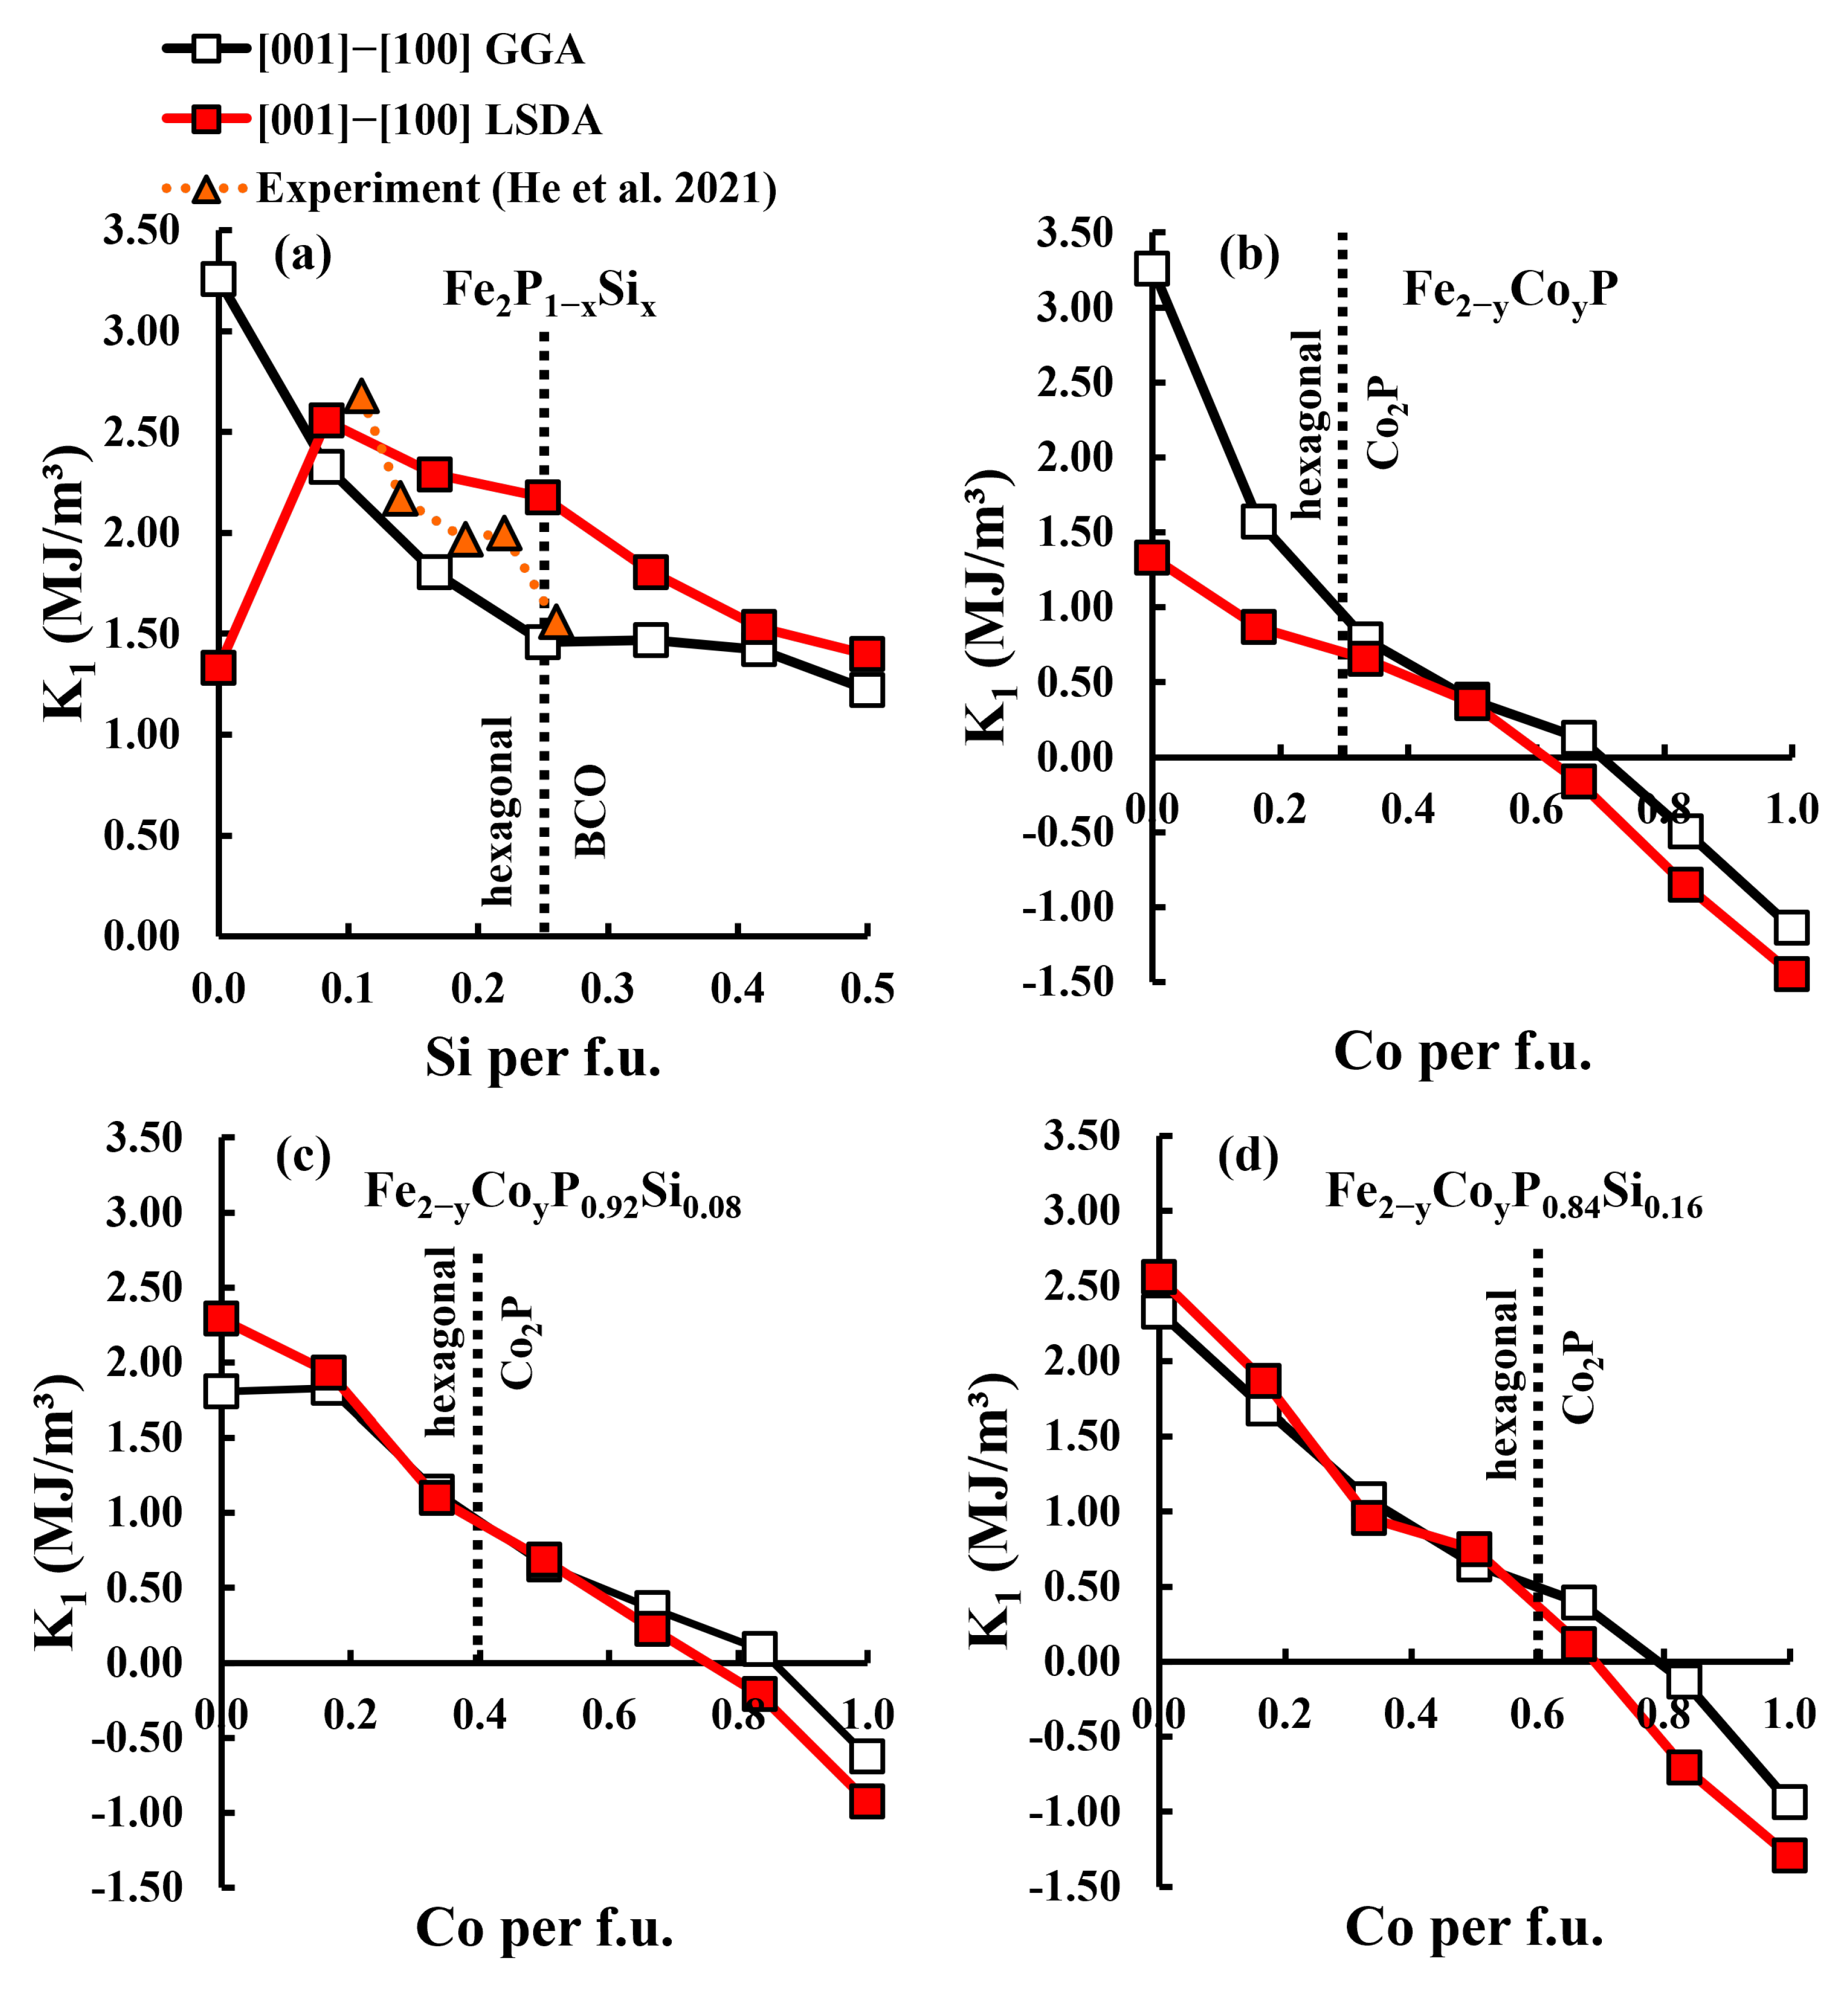
3.3. Magnetocrystalline Anisotropy Energy

In Figure 4a, the influence of Si substitution on K 1 is shown. Both GGA and LSDA functionals were considered to account for a possible underestimation in case of the GGA functional. As the MAE is a result of spin–orbit coupling and therefore based on very small energy differences, theoretical calculations are very challenging. Another limitation of these calculations is an assumed temperature of 0 K, which neglects any existing influence of the temperature on K 1 and H a . The influence of temperature on the MAE is therefore not handled in this study, and only the influence of Si and Co is investigated. The exact K 1 and H a values for the [001]–[100] direction have been given for both exchange functionals in Table 2.
With increasing Si concentrations, K 1 systematically decreases in the case of GGA, starting from a high value of 3.26 MJ/m³ for Fe2P. This value is lowered to a K 1 of 1.22 at x = 0.5 Si per f.u. It is noteworthy that the anisotropy constant is reduced more significantly at low concentrations of Si. Up to x = 0.25 Si per f.u., K 1 decreases by ∼−28 %, ∼−23 % and ∼−19 % to 2.33, 1.80 and 1.46 MJ/m³ for x = 0.08, 0.16 and 0.25 Si per f.u., respectively. For x > 0.25, the results change less, by only ∼0.7 %, ∼−3 %, and lastly, ∼−14 %, ending at 1.22 MJ/m³.
With LSDA, an increase in the anisotropy from 1.33 MJ/m³ to 2.55 MJ/m³ at x = 0.08 Si per f.u. can be seen. After this, higher Si contents cause a decrease in K 1 , similarly to the GGA functional. Contrary to GGA, a higher decrease at low Si contents is not observed with LSDA, and all changes amount to ∼10–17 %. The only exception is the change from 0.16 to 0.25 Si per f.u., where a decrease of only ∼5% is observed.
Comparing the GGA and LSDA functionals, higher values for LSDA are observed, except for the binary Fe2P compound, where LSDA (1.33 MJ/m³) is less than half the value of GGA (3.26 MJ/m³).
The experimental findings for the magnetocrystalline anisotropy energy by He et al. [13] describe a similar trend in K 1 with Si substitution in (Fe1.91Co0.09)2(P1−xSix) compounds in the range of 0.11 x 0.26. They measured K 1 at 2 K as 2.68 MJ/m³ for x = 0.11, which decreased to a value of 1.56 MJ/m³ at x = 0.26 Si per f.u. This result is in good accordance with the results of this work, where a decrease in K 1 in both cases of GGA and LSDA is apparent. Similar results on the decrease in the apparent MAE at room temperature (300 K) were measured by Guillou et al. [25] for (Fe1.80Co0.20)2(P1−xSix). Their values start at 0.4 MJ/m³ and end at ∼ 0.26 MJ/m³. In both experimental cases, a slight increase in the MAE between x = 0.15 and x = 0.2 was observed, which could not be reproduced in our calculations. Based on the comparison of our results with the low temperature data from He et al. [13], the GGA functional appears to be the better choice for MAE calculations, as the trend of a decrease in K 1 is slightly better represented than in the case of LSDA. The differences between the experimental results and GGA are in most cases smaller than the differences from LSDA. Note that only limited low-temperature experimental data is available on the influence of Si on the MAE.
Further magnetocrystalline anisotropy energy calculations for the substitution of Fe with Co were conducted for the hexagonally structured compounds with x = 0.0, 0.08 and 0.16 Si per f.u., to investigate the sole and combined effect of Co along with Si. In all three cases, K 1 becomes negative at Co concentrations y 0.66. This signifies a loss of the easy magnetization axis c and indicates that the lowest-order term K 1 is no longer responsible for the direction of the anisotropy. In these cases, an easy basal plane exists, i.e., the second- and third-term anisotropy constants are required [36]. In this work the higher-order anisotropy terms were not further investigated and need to be addressed in future works.
In Figure 4, the evolution of the calculated anisotropy constants K 1 for Fe 2 y CoyP (b)), Fe 2 y P0.92Si0.08 (c)), and Fe 2 y P0.84Si0.16 (d)) compounds is depicted for GGA and LSDA. With increasing Co contents, the values for both exchange functionals decrease significantly, and K 1 becomes negative at high Co concentrations.
When investigating the sole influence of Co on Fe 2 y CoyP (x = 0.0 Si per f.u.), K 1 is roughly halved by each considered concentration increase from y = 0.16 Co per f.u. to y = 0.66 Co per f.u. once the GGA exchange functional is considered. Even higher concentrations of y > 0.66 result in negative K 1 values. For LSDA, the lowering of K 1 is less pronounced and in the range of 25–45% each time. However, unlike GGA, a negative K 1 value is already achieved at y = 0.66 Co per f.u., which could be due to the lower values of LSDA for x = 0.0 Si overall. The lowest positive results for K 1 of 0.13 and 0.36 MJ/m³ were therefore attained at y = 0.66 and y = 0.5 Co per f.u. for GGA and LSDA, respectively. These results can be compared to findings by Tujii et al. [65] and Fujii et al. [66], who found decreasing values for K 1 for the substitution of Ni into the binary Fe2P. This trend for Co substitution on K 1 is further supported by de Vos et al. [20], who found a decreasing effect of Co on the anisotropy field H a up to y = 0.3 Co per f.u.
For quarternary compounds with x = 0.08 and 0.16 Si per f.u., a similar trend of K 1 was observed. At x = 0.08 Si, the GGA starting value decreases by ∼−28 % to 1.69 MJ/m³, followed by ∼−40 % for all higher Co concentrations. A concentration above 0.66 Co per f.u. (similarly to the Si-free case) leads to compounds with a K 1 value below zero. However, these K 1 results are less negative than for pure Co substitution.
In the case of LSDA, the considered changes from y = 0.0 to 0.16, 0.33, 0.5 and then to 0.66 Co per f.u. amount to ∼−27, −49, −22 and even −89%, producing values of 1.87, 0.96, 0.75 and 0.12 MJ/m³. Unlike pure Co substitution, a negative K 1 result is obtained at Co concentrations of y > 0.66 Co per f.u.
Even higher Si contents of 0.16 Si per f.u. combined with the GGA functional lead to an increase in K 1 by + 1.4% for the concentration change from y = 0.0 to 0.16 Co per f.u. This is then followed by decreases in −38, −43, −45 and −75% to the low value of 0.09 MJ/m³ at y = 0.82 Co per f.u. This suggests that with a higher concentration of Si, the compound becomes more resilient to the loss of uniaxial anisotropy due to Co substitution. Unlike before, K 1 values below zero are not obtained at y = 0.83 but at 1.0 Co per f.u., which could indicate that even higher Si concentrations could possibly prevent the loss of uniaxial anisotropy. This result of a higher resilience is also supported by Zhuravlev et al. [26], who reported on the influence of band filling on the magnetocrystalline anisotropy and suggested simultaneous substitution in the metal and metalloid sites.
Except for y = 0.0 and 0.16 Co per f.u., LSDA treatment yields very similar or lower values compared to GGA with x = 0.16 Si. Similarly to x = 0.08 Si, negative values are observed at y 0.83 Co per f.u. Nonetheless, the result still shows the same trend of a higher resilience, with a less negative value compared to the K 1 at x = 0.08 Si.
Overall, it can be deduced that higher Si concentrations in the compounds are beneficial to the resistance against the loss of uniaxial anisotropy. After the appearance of a negative K 1 , Co concentrations shift from y = 0.66 to y = 0.83 Co per f.u., and the negative results are much closer to zero than without Si included. Further investigations of Co substitution in compounds with higher amounts of Si are needed to further verify this trend. Nevertheless, both Si and Co substitution lead to significant decreases in the magnetocrystalline anisotropy energy, and for a desired high anisotropy, the amount of substitution should be kept as small as needed. Since very few reports are available about the magnetocrystalline anisotropy energy development depending on both Si and Co substitution, a comparison with experimental data is difficult.
Another magnetic property that depends on the anisotropy constant K 1 is the already mentioned anisotropy field H a . As mentioned, it is calculated with the anisotropy constant K 1 and the polarisation magnetization μ 0 M S , which results in similar trends as mentioned with the anisotropy constants. Therefore, the H a values will only be discussed briefly. The resulting values are listed in Table 2 next to the K 1 values for GGA and LSDA.
It can be seen that Si substitution causes the anisotropy field to reduce significantly. The binary parent Fe2P starts at a high value of 6.17 T, which decreases down to an anisotropy field of 1.96 T with substitution of 50 % P with Si. Considering the LSDA functional H a starts at only 2.52 T and first increases to a value of 4.72 T, that is higher than the according value of 4.30 T for GGA. However, after this first increase, the H a value shows a similar trend to the GGA results and is systematically reduced to 2.25 T at x = 0.5 Si. The effect of Co substitution is again similar to the effect on the anisotropy constant. Independently of the amount of substituted Si in the compound, increasing Co concentration reduces the anisotropy field to a higher degree than Si substitution. In both cases of GGA and LSDA functionals, Co substitution leads H a in all three considered cases to high decreases that even result in negative values for the anisotropy field. Contrary to the first Si substitution, the first substitution of only Co (x = 0) does not lead to an increase in the anisotropy field. Since H a is calculated with K 1 , the anisotropy field sees the same trend of turning to negative values.

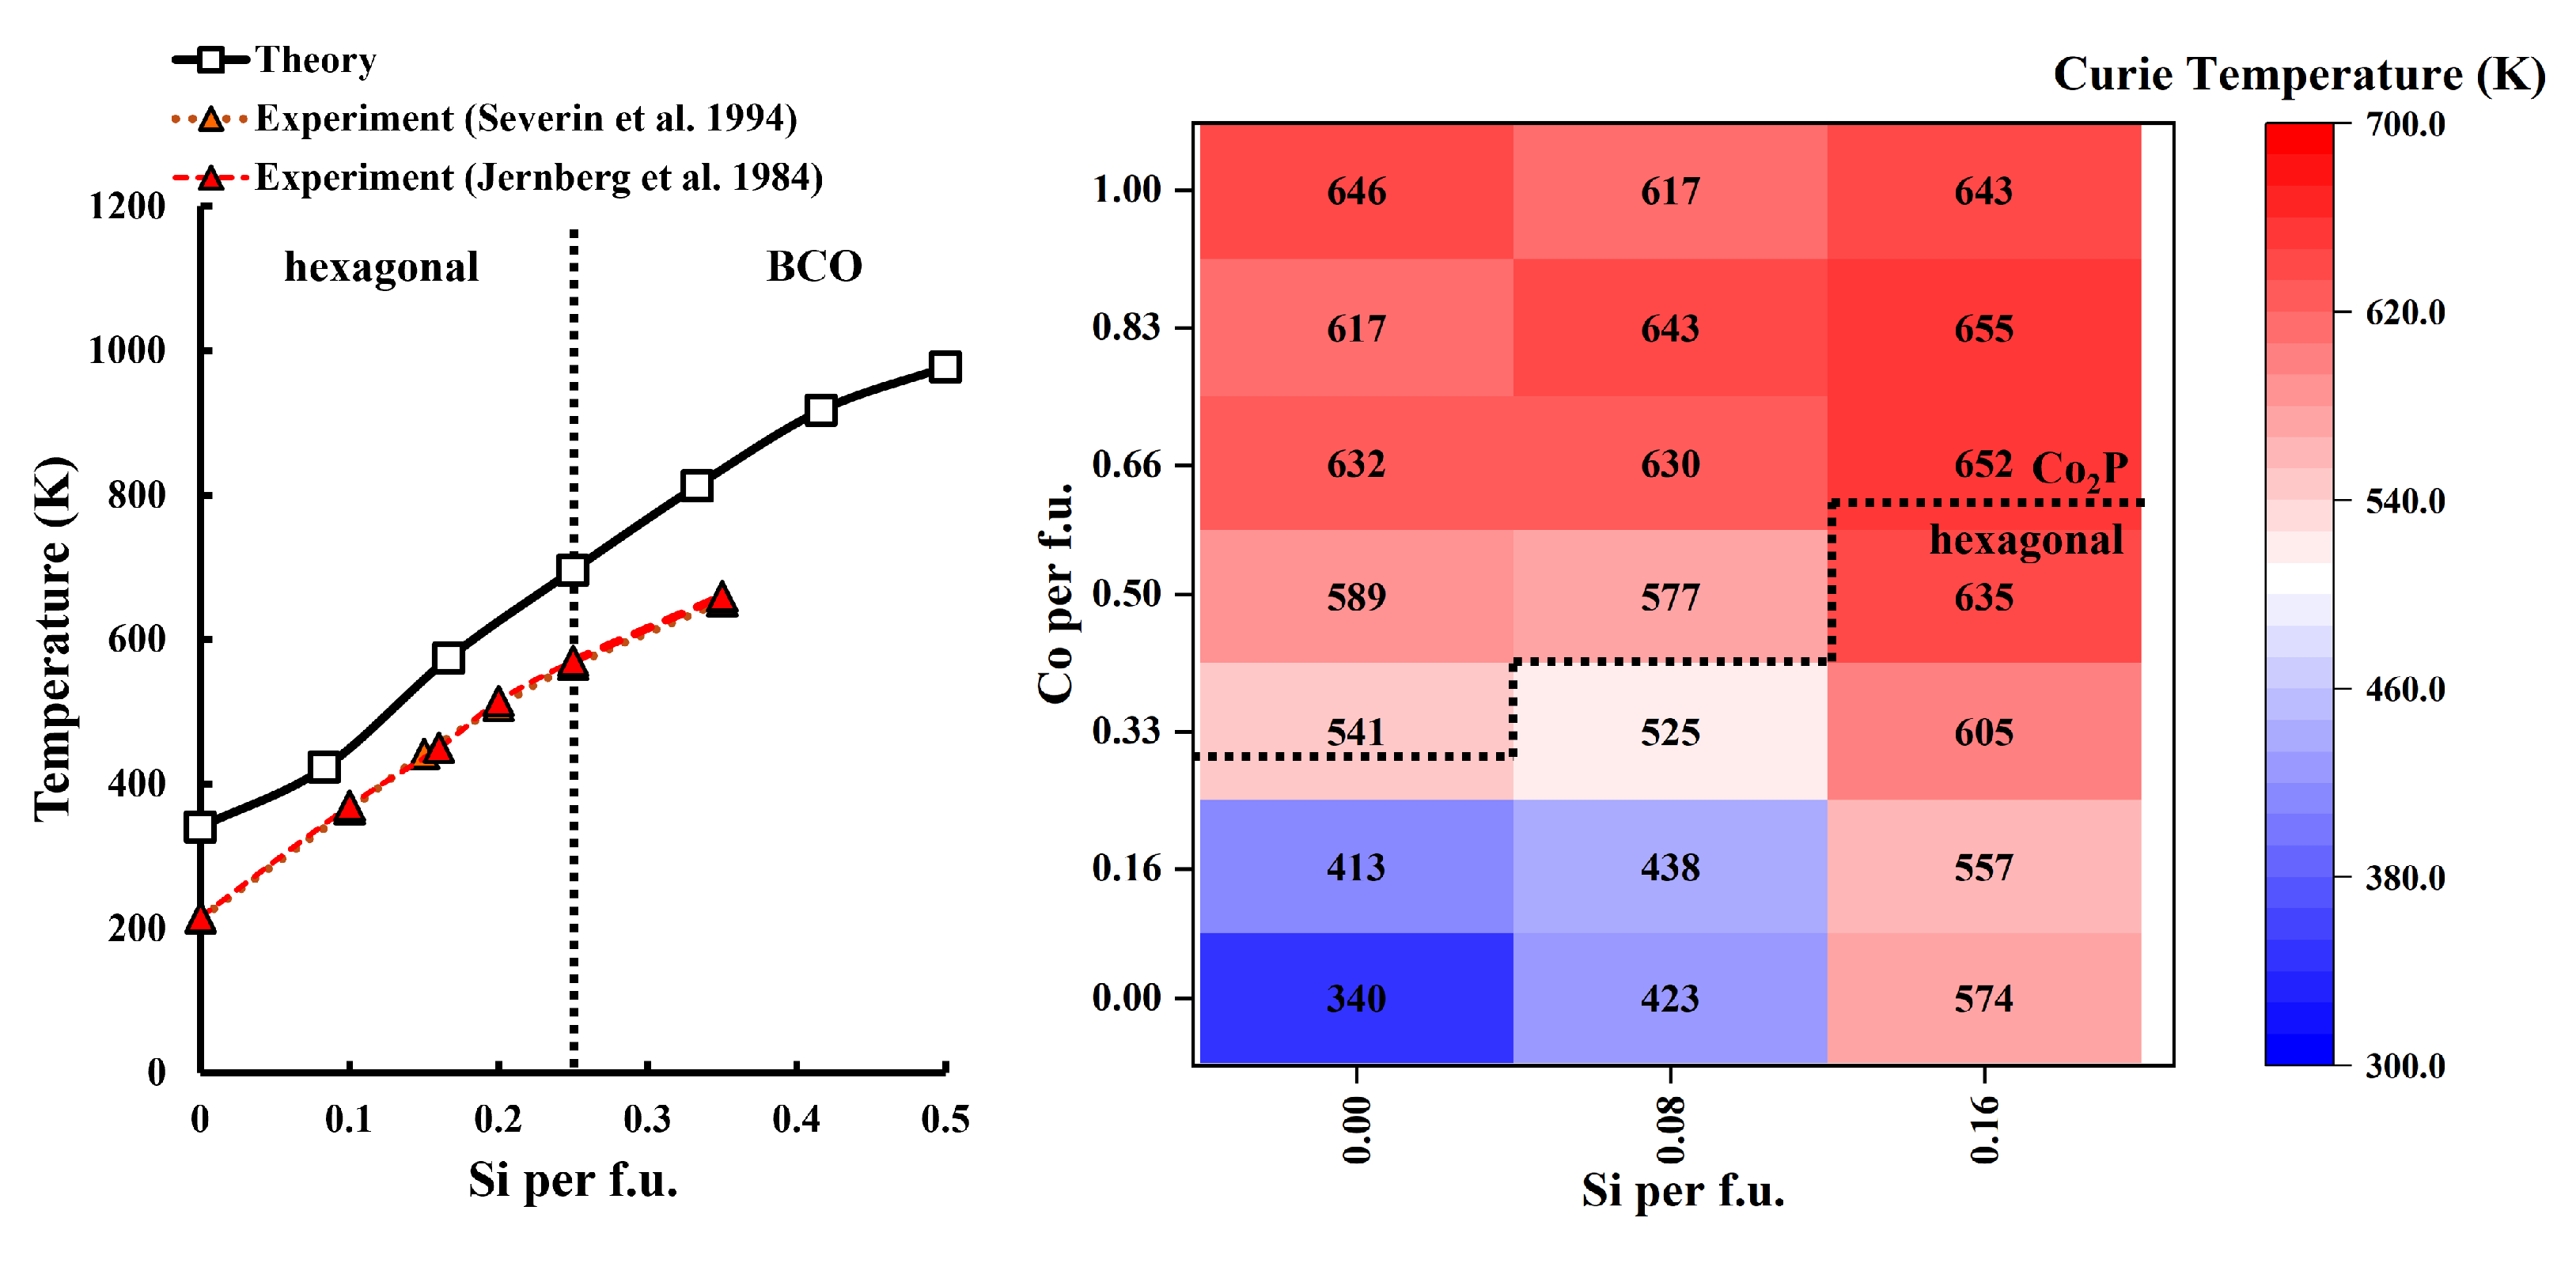
3.4. Curie Temperature

The comparably low Curie temperature T C of 214 K [17,19,21,22] is the main drawback of the binary Fe2P hard magnetic material. However, it can be modified by Si and Co substitution. In Figure 5, the calculated T C values for the hexagonally structured Fe 2 y CoyP1−xSix materials are shown as a function of Si (0 x 0.5) and combined Si and Co substitution (0 y 1) for x = 0.0, 0.08 and 0.16 Si per f.u. Note that the calculated results in the mean-field approximation theory (MFA) are prone to overestimation by up to ∼40%, which explains the higher T C value of 340 K for substitution-free Fe2P. This overestimation is caused by the limitations of the used KKR-CPA method, which fails to include correlation effects, short-range ordering, electron–electron interactions and multiple scattering effects [67,68,69]. Additionally, the mean-field approximation only assumes that each magnetic moment interacts with an averaged field created by its neighbors, which leads to the neglect of possible spin fluctuations. Nevertheless, even with these limitations the KKR-CPA calculations are precise enough to accurately predict the trends of the Curie temperatures. These trends and the resulting difference for each concentration are the main focus of these calculations.
With only Si substitution, a systematic rise of the T C s is observed. The results increase from 340 K up to values of ∼980 K for x = 0.5 Si. Even at lower Si concentrations of 0.08, 0.16, and 0.25 Si per f.u., T C already amounts to 423, 574, and 695 K, respectively. The reason for this rise can be attributed to the exchange interaction energies J i j , shown in Figure 2c,d and Figure 3. The J i j energies are crucial in defining the T C for a compound. Since Si substitution increases the total exchange interaction energies, the T C becomes higher as well. For the change from 340 K to 423 K at x = 0.0 and 0.08 Si per f.u., an increase in the interaction energies from ∼88 meV to 114 meV is observed. From x = 0.08 to 0.16 Si, T C rises from 423 to 574 K, which is related to an increase in J i j to 150 meV. This leads to a systematic trend of higher T C values with higher J i j s up to x = 0.5 Si with a T C of 977 K and a total J i j of 249 meV. This trend is in good agreement with the previous literature [15,26,58,70,71]. Experimental data by Jernberg et al. shows a similar increase in the T C as in the aforementioned theoretical data. In their study, the T C rises from 216 K to 450 K at x = 0.16 and 570 K at x = 0.25 Si per f.u. These values are in good agreement with the presented theoretical results of 574 and 695 K, considering the known overestimation of the KKR-CPA method.
The biggest contributions to the higher J i j energies with Si can mainly be attributed to the interactions involving the atoms at the 3f positions. As shown in Figure 3, the 3f-3g interactions rise significantly with Si from 28 meV to 132 meV at x = 0.5 Si. The 3g-3g energies remain relatively constant in the range of 50–70 meV, only increasing slightly. The last contribution, 3f-3f, also changes alongside 3f-3g. Up to x = 0.33 Si per f.u., they stay relatively unaffected. However, with x 0.33, they increase up to a value of 47 meV, thus greatly contributing to the total rise of the exchange interaction energies with Si substitution.
Unlike the magnetic moments, where the decrease in the total magnetic moments with Co was not reflected in the exchange interaction energies, the change in T C is clearly visible. In Figure 5, the influence of Co on the Curie temperature of Fe2P1−xSix compounded by x = 0.0, 0.08, and 0.16 Si is shown. In all three cases, T C reaches up to temperatures of ∼650 K, which is in good agreement with experimental data for quarternary Fe 2 y CoyP1−xSix compounds with x = 0.1 and 0.2 Si per f.u. by Bao et al. [15]. At low Si concentrations of x = 0.1, they reported an increase in the T C with increasing Co concentrations up to a value of ∼480 K at y = 0.4 Co, which is comparable to the theoretical data with x = 0.08 Si. They also reported a lower effect of Co at higher Si contents (x = 0.2 Si), where the T C s are only fluctuating around 500–520 K with increasing amounts of Co. This reduced influence is visible in this work too, as the increase in T C due to Co substitution is much lower at x = 0.16 Si, with an overall increase of only 69 K compared to 194 K at x = 0.08 Si.
The mentioned trends of overall increasing T C s with Co substitution are visible in all three considered partial exchange interaction energy contributions. Unlike Si, the greatest effect of Co is observed in the evolution of the 3g-3g exchange interaction energies, which are nearly twice as high at y = 1.0 Co per f.u. with values of 105 to 117 meV compared to the unsubstituted binary Fe2P parent material. However, similar importance can also be attributed to the 3f-3g interactions. With x = 0.0 and 0.08 Si, the 3f-3g energies initially increase drastically and then begin to slightly decrease at Co contents of y 0.5 Co per f.u. In the case of 0.16 Si, increasing the Co concentration up to y = 0.16 Co yields a J i j of ∼90 meV. With Co concentrations of y > 0.16 Co, the J i j energies only fluctuate around 90 meV.
The smallest contribution to the evolution of the T C s with Co can be seen for the 3f-3f exchange interaction energies. In this case, increasing the Co concentration from y = 0.0 to 0.16 Co per f.u. yields a change of values to between 15 and 20 meV. Further increases in Co concentration show only minor effects, with highest values around 0.66–0.83 Co per f.u. A noticeable change in the exchange interaction energies of the 3f-3f and 3f-3g interactions is observed with the full occupation of the 3f site with Co. However, even with the collapse of both contributions, the total exchange interaction energies (Figure 2d) only slightly decrease at this point, which explains the only minor decrease in T C . This indicates that with full substitution of the 3f site, the exchange interaction energies of 3g-3g increase so significantly that they more or less compensate for the loss of the other two interactions completely. Si and Co substitutions therefore show promising results in improving the Curie temperature and J i j exchange interaction energies of the materials.

4. Conclusions

Detailed investigations on the exchange interaction energies J i j revealed the dependence of the magnetic moment on the total exchange interaction energies in the case of Si substitution. With increasing Si concentrations, an increase in the 3f-3f and 3f-3g contributions was observed. For Co substitution, the decrease in the magnetic moment was found to be caused by the generally lower magnetic moment of the Co atoms in the 3f site (∼0.3 μ B ).
Magnetocrystalline anisotropy energy calculations showed decreasing values for the anisotropy constant K 1 and the anisotropy field H a with both Si and Co substitution. This is consistent with previous data in the case of Si substitution [13]. With Co concentrations y 0.6 (0.8 with 0.16 Si), a loss of the easy magnetization axis was observed. The loss of the easy magnetization axis appears to be less pronounced with increasing Si content, suggesting that Si enhances the resilience of the compounds against the loss of the easy magnetization direction.
The calculated trends of the Curie temperatures are in good agreement with experimental findings. A deeper analysis of the exchange interaction energies prompts a general increase in the J i j s with Si and Co substitution. For Si, significant changes in the 3f-3f and 3f-3g interaction energies are observed, while for Co substitution, the 3g-3g and 3f-3g interactions are relevant. In case of a full substitution of the 3f site with Co, the drop in 3f-3f and 3f-3g energies is mostly compensated by the increase in the 3g-3g interaction energies.
In summary, Si and Co substitution prove to be suitable for modifying the magnetic properties of the binary Fe2P compound. However, the amount of substitution should be kept to a minimum to achieve the highest possible magnetic properties combined with good operational temperatures. We propose an upper limit of x = 0.16 Si and y = 0.16 Co per f.u., resulting in the hexagonal Fe1.84Co0.16P0.84Si0.16 compound with a theoretical total magnetic moment of 3.04 μ B , a K 1 of 1.83 MJ/m3 (LSDA: 1.93 MJ/m3) and a theoretical Curie temperature of 557 K. This study underlines the potential of magnetic materials deriving from the parent Fe2P material to be suitable for future hard magnet application. They exhibit great magnetic properties at low substitution rates, especially good magnetic moments and anisotropy. Nevertheless, more studies on phase stabilities and other possible substitutes are needed to achieve a complete picture of the influence of substitution on binary Fe2P.

Supplementary Materials

The following supporting information can be downloaded at: https://www.mdpi.com/article/10.3390/magnetism5020014/s1.

Author Contributions

Conceptualization, S.E., H.İ.S. and T.K.; methodology, S.E. and H.İ.S.; software, H.İ.S. and T.K.; validation, S.E. and H.İ.S.; formal analysis, S.E.; investigation, S.E.; resources, T.K.; data curation, S.E.; writing—original draft preparation, S.E.; writing—review and editing, H.İ.S. and T.K.; visualization, S.E.; supervision, H.İ.S. and T.K.; project administration, H.İ.S. and T.K.; funding acquisition, T.K. All authors have read and agreed to the published version of the manuscript.

Funding

The simulations were performed at the HPC Cluster ROSA, located at the University of Oldenburg (Germany) and funded by the DFG through its Major Research Instrumentation Programme (INST 184/225-1 FUGG) and the Ministry of Science and Culture (MWK) of the Lower Saxony State.

Institutional Review Board Statement

Not applicable.

Informed Consent Statement

Not applicable.

Data Availability Statement

The original contributions presented in this study are included in the article/Supplementary Material. Further inquiries can be directed to the corresponding author.

Acknowledgments

We are thankful for Francois Guillou for fruitful discussions and remarks on the topic.

Conflicts of Interest

Author Halil İbrahim Sözen was employed by the company Mercedes-Benz Turk A.S. The remaining authors declare that the research was conducted in the absence of any commercial or financial relationships that could be construed as a potential conflict of interest.

Abbreviations

The following abbreviations are used in this manuscript:
MDPIMultidisciplinary Digital Publishing Institute
MAEMagnetocrystalline anisotropy energy
T C Curie temperature
RERare-earth
TMTransition metal
VASPVienna ab initio Simulation Package
PAWProjector-augmented wave
GGAGeneralzized gradient approximation
PBEPerdew–Burke–Ernzerhof
SCFSelf-consistent field
LSDALocal Spin Density approximation
J i j Exchange interaction energies
KKRKorringa–Kohn–Rostoker
FMFerromagnetic
CPACoherent potential approximation
BCOBody-centered orthorhombic
m t o t Total magnetic moment
μ 0 M S Polarization Saturation
| B H | m a x Maximum energy product
K 1 Anisotropy constant
H a Anisotropy field
HPCHigh-performance computing
DFGDeutsche Forschungsgemeinschaft
MWKMinistry of Science and Culture

References

  1. Erdmann, S.; Klüner, T.; İbrahim Sözen, H. Magnetic properties of rare-earth-lean ThMn12-type (Nd,X)Fe11Ti (X: Y and Ce) compounds: A DFT study. J. Magn. Magn. Mater. 2023, 572, 170645. [Google Scholar] [CrossRef]
  2. Sözen, H.I.; Klüner, T. Ab initio phase stabilities of rare-earth lean Nd-based hard magnets. J. Magn. Magn. Mater. 2022, 559, 169529. [Google Scholar] [CrossRef]
  3. Sözen, H.I. Ab initio Phase Stabilities of Ce-Based Hard Magnetic Materials. Ph.D. Thesis, Ruhr-Universität Bochum, Bochum, Germany, 2019. [Google Scholar]
  4. Sözen, H.I.; Ener, S.; Maccari, F.; Fayyazi, B.; Gutfleisch, O.; Neugebauer, J.; Hickel, T. Combined ab initio and experimental screening of phase stabilities in the Ce-Fe-Ti- X system (X = 3 d and 4 d metals). Phys. Rev. Mater. 2023, 7, 014410. [Google Scholar] [CrossRef]
  5. Wittemann, T.; Sözen, H.I.; Oezaslan, M.; Klüner, T. Ab initio calculations of the chemisorption of atomic H and O on Pt and Ir metal and on bimetallic PtxIry surfaces. Z. Fur Naturforschung Sect. B J. Chem. Sci. 2024, 79, 177–190. [Google Scholar] [CrossRef]
  6. Erdmann, S.; Sozen, H.I.; Guillou, F.; Yibole, H.; Kluner, T. Theoretical and experimental investigations on Fe2P -type magnets: Effects of Si and Co substitution on physical and magnetic properties. Phys. Rev. Mater. 2024, 8, 094401. [Google Scholar] [CrossRef]
  7. Coey, J.M. Perspective and Prospects for Rare Earth Permanent Magnets. Engineering 2020, 6, 119–131. [Google Scholar] [CrossRef]
  8. Gutfleisch, O.; Willard, M.A.; Brück, E.; Chen, C.H.; Sankar, S.G.; Liu, J.P. Magnetic materials and devices for the 21st century: Stronger, lighter, and more energy efficient. Adv. Mater. 2011, 23, 821–842. [Google Scholar] [CrossRef]
  9. Coey, J.M. Permanent magnets: Plugging the gap. Scr. Mater. 2012, 67, 524–529. [Google Scholar] [CrossRef]
  10. Woodcock, T.G.; Zhang, Y.; Hrkac, G.; Ciuta, G.; Dempsey, N.M.; Schrefl, T.; Gutfleisch, O.; Givord, D. Understanding the microstructure and coercivity of high performance NdFeB-based magnets. Scr. Mater. 2012, 67, 536–541. [Google Scholar] [CrossRef]
  11. Bauer, D.; Diamond, D.; Li, J.; McKittrick, M.; Sandalow, D.; Telleen, P. Critical Materials Strategy for Clean Energy Technologies; US Department of Energy Office of Policy and International Affairs (PI): Washington, DC, USA, 2011; pp. 1–170.
  12. Directorate-General for Internal Market, Industry, E.; Commission, S.E.; Grohol, M.; Veeh, C. Study on the Critical Raw Materials for the EU 2023—Final Report; Technical report; Publications Office of the European Union: Luxembourg, 2023. [Google Scholar] [CrossRef]
  13. He, Y.; Adler, P.; Schneider, S.; Soldatov, I.; Mu, Q.; Borrmann, H.; Schnelle, W.; Schaefer, R.; Rellinghaus, B.; Fecher, G.H.; et al. Intrinsic Magnetic Properties of a Highly Anisotropic Rare-Earth-Free Fe2P-Based Magnet. Adv. Funct. Mater. 2022, 32. [Google Scholar] [CrossRef]
  14. Surilemu, Z.; Bao, L.L.; Yibole, H.; Erdmann, S.; Sözen, H.; Klüner, T.; Guillou, F. Structure, phase transitions and hard magnetic properties of ternary Fe1.93(P1−xSix) compounds with x ≤ 0.5. Acta Mater. 2025, 291. [Google Scholar] [CrossRef]
  15. Bao, L.L.; Yibole, H.; Xu, J.Y.; Ou, Z.Q.; Haschuluu, O.; Tegus, O.; van Dijk, N.H.; Brück, E.; Guillou, F. Crystal structures and magnetic properties of Fe1.93−xCoxP1−ySiy compounds. J. Alloys Compd. 2022, 903. [Google Scholar] [CrossRef]
  16. Tobola, J.; Koumina, M.D.B.F.S.K.A.; Soubeyroux, S.N.J.L.; Zach, R. Magnetism of Fe2P investigated by neutron experiments and band structure calculations. J. Magn. Magn. Mater. 1996, 157–158, 708–710. [Google Scholar] [CrossRef]
  17. Fujii, H.; Hokabe, T.; Kamigaichi, T.; Okamoto, T. Magnetic Properties of Fe2P Single Crystal. J. Phys. Soc. Jpn. 1977, 43, 41–46. [Google Scholar] [CrossRef]
  18. Häggström, L.; Severin, L.; Andersson, Y. Experimental and theoretical studies of Si/P substituted orthorhombic Fe2P. Hyperfine Interact. 1994, 94, 2075–2079. [Google Scholar] [CrossRef]
  19. Caron, L.; Hudl, M.; Höglin, V.; Dung, N.H.; Gomez, C.P.; Sahlberg, M.; Brück, E.; Andersson, Y.; Nordblad, P. Magnetocrystalline anisotropy and the magnetocaloric effect in Fe2P. Phys. Rev. B Condens. Matter Mater. Phys. 2013, 88. [Google Scholar] [CrossRef]
  20. Vos, K.J.D.; Velge, W.A.; Steeg, M.G.V.D.; Zijlstra, H. Permanent magnetic properties of iron-cobalt-phosphides. J. Appl. Phys. 1962, 33, 1320–1322. [Google Scholar] [CrossRef]
  21. Wäppling, R.; Häggström, L.; Ericsson, T.; Devanarayanan, S.; Karlsson, E.; Carlsson, B.; Rundqvist, S. First Order Magnetic Transition, Magnetic Structure, and Vacancy Distribution in Fe2P. J. Solid State Chem. 1975, 13, 258–271. [Google Scholar] [CrossRef]
  22. Lundgren, L.; Tarmohamed, G.; Beckman, O.; Carlsson’, B.; Rundqvist’, S. First Order Magnetic Phase Transition in Fe2P. Phys. Scr. 1978, 17, 39–48. [Google Scholar] [CrossRef]
  23. Fruchart, R.; Roger, A.; Senateur, J.P. Crystallographic and magnetic properties of solid solutions of the phosphides M2P, M = Cr, Mn, Fe, Co, and Ni. J. Appl. Phys. 1969, 40, 1250–1257. [Google Scholar] [CrossRef]
  24. Xu, J.Y.; Bao, L.; Yibole, H.; Guillou, F. Structure and magnetic properties of Fe1.95−xNixP1−ySiy alloys. Solid State Commun. 2020, 319, 113996. [Google Scholar] [CrossRef]
  25. Guillou, F.; Liting, S.; Haschuluu, O.; Ou, Z.Q.; Brück, E.; Tegus, O.; Yibole, H. Room temperature magnetic anisotropy in Fe2P-type transition metal based alloys. J. Alloys Compd. 2019, 800, 403–411. [Google Scholar] [CrossRef]
  26. Zhuravlev, I.A.; Antropov, V.P.; Vishina, A.; Schilfgaarde, M.V.; Belashchenko, K.D. Tunable dimensional crossover and magnetocrystalline anisotropy in Fe2P-based alloys. Phys. Rev. Mater. 2017, 1. [Google Scholar] [CrossRef]
  27. Severin, L.; Häggström, L.; Nordström, L.; Andersson, Y.; Johansson, B. Magnetism and crystal structure in orthorhombic Fe2P: A theoretical and experimental study. J. Phys. Condens. Matter 1995, 7, 185–198. [Google Scholar] [CrossRef]
  28. Yibole, H.; Lingling-Bao, B.; Xu, J.Y.; Alata, H.; Tegus, O.; Hanggai, W.; van Dijk, N.H.; Brück, E.; Guillou, F. (Fe,Co)2(P,Si) rare-earth free permanent magnets: From macroscopic single crystals to submicron-sized particles. Acta Mater. 2021, 221, 117388. [Google Scholar] [CrossRef]
  29. Jernberg, P.; Yousif, A.A.; Häggström, L.; Andersson, Y. A Mössbauer Study of Fe2P1−xSix, (x ≤ 0.35). J. Solid State Chem. 1984, 53, 313–322. [Google Scholar] [CrossRef]
  30. Kresse, G.; Furthmüller, J. Efficient iterative schemes for ab initio total-energy calculations using a plane-wave basis set. Phys. Rev. B 1996, 54, 11169–11186. [Google Scholar] [CrossRef]
  31. Kresse, G.; Furthmüller, J. Efficiency of ab-initio total energy calculations for metals and semiconductors using a plane-wave basis set. Comput. Mater. Sci. 1996, 6, 15–50. [Google Scholar] [CrossRef]
  32. Perdew, J.P.; Burke, K.; Ernzerhof, M. Generalized gradient approximation made simple. Phys. Rev. Lett. 1996, 77, 3865–3868. [Google Scholar] [CrossRef]
  33. Hohenberg, P.; Kohn, W. Inhomogeneous Electron Gas. Phys. Rev. 1964, 136, B864–B871. [Google Scholar] [CrossRef]
  34. Kohn, W.; Sham, L. Self-Consistent Equations Including Exchange and Correlation Effects. Phys. Rev. 1965, 140, A1133–A1138. [Google Scholar] [CrossRef]
  35. Nikitin, S.A.; Tereshina, I.S.; Verbetsky, V.N.; Salamova, A.A. Magnetic anisotropy of YFe11Ti single crystal and its hydride. Int. J. Hydrogen Energy 1999, 24, 217–219. [Google Scholar] [CrossRef]
  36. Landau, L.; Lifshitz, E.M. Electrodynamics of Continuous Media; Pergamon Press: Oxford, UK, 1984; Volume 8. [Google Scholar]
  37. Merkt, N.Y.; Erdmann, S.; Klüner, T.; İbrahim Sözen, H. Effect of Zr Substitution on the Nd-based Magnets: Theoretical Investigation of (Zr,Nd)(Fe,Ti)12 Compounds. J. Magn. Soc. Jpn. 2024, 48, 60–74. [Google Scholar] [CrossRef]
  38. Herper, H.C.; Skokov, K.; Ener, S.; Thunström, P.; Diop, L.V.B.; Gutfleisch, O.; Eriksson, O. Magnetic Properties of NdFe11Ti and YFe11Ti, from Experiment and Theory. SSRN Electron. J. 2022. [Google Scholar] [CrossRef]
  39. Ke, L.; Johnson, D.D. Intrinsic magnetic properties in R(Fe1−xCox)11TiZ (R = Yand Ce; Z = H, C, and N). Phys. Rev. B 2016, 94, 024423. [Google Scholar] [CrossRef]
  40. Liechtenstein, A.; Katsnelson, M.; Antropov, V.; Gubanov, V. Local Spin Density Functional Approach to the Theory of Exchange Interactions in Ferromagnetic Metals and Alloys. J. Magn. Magn. Mater. 1987, 67, 65–74. [Google Scholar] [CrossRef]
  41. Korringa, J. On the Calculation of the Energy of a Bloch Wave in a Metal. Physica 1947, 13, 392–400. [Google Scholar] [CrossRef]
  42. Kohn, W.; Rostoker, N. Solution of the schrödinger equation in periodic lattices with an application to metallic lithium. Phys. Rev. 1954, 94, 1111–1120. [Google Scholar] [CrossRef]
  43. Akai, H. Available online: http://kkr.issp.u-tokyo.ac.jp (accessed on 25 April 2025).
  44. Shiba, H. A Reformulation of the Coherent Potential Approximation and Its Applications. Prog. Theor. Phys. 1971, 46, 77–94. [Google Scholar] [CrossRef]
  45. Akai, H. Residual resistivity of Ni-Fe, Ni-Cr and other ferromagnetic alloys. Physica B+C 1977, 86-88, 539–540. [Google Scholar] [CrossRef]
  46. Slater, J.C. Atomic radii in crystals. J. Chem. Phys. 1964, 41, 3199–3204. [Google Scholar] [CrossRef]
  47. Moruzzi, V.L.; Janak, J.F.; Williams, A.R. Calculated Properties of Metals; Pergamon Press: New York, NY, USA, 1978. [Google Scholar]
  48. Khongorzul, B.; Ochirkhuyag, T.; Taivansaikhan, P.; Odbadrakh, K.; Odkhuu, D. First-principles study on enhanced magnetocrystalline anisotropy of Fe2P-type alloys. AIP Adv. 2025, 15, 035015. [Google Scholar] [CrossRef]
  49. Dera, P.; Lavina, B.; Borkowski, L.A.; Prakapenka, V.B.; Sutton, S.R.; Rivers, M.L.; Downs, R.T.; Boctor, N.Z.; Prewitt, C.T. High-pressure polymorphism of Fe2P and its implications for meteorites and Earth’s core. Geophys. Res. Lett. 2008, 35, 1–6. [Google Scholar] [CrossRef]
  50. Gercsi, Z.; Delczeg-Czirjak, E.K.; Vitos, L.; Wills, A.S.; Daoud-Aladine, A.; Sandeman, K.G. Magnetoelastic effects in doped Fe2P. Phys. Rev. B 2013, 88, 024417. [Google Scholar] [CrossRef]
  51. Nylund, A.; Roger, A.; Sénateur, J.P.; Fruchard, R. Evolution Structurale des Phosphures, Arséniures et Arséniophosphures M2O, M2As et M2(O1−xAsx). J. Solid State Chem. 1972, 4, 115–122. [Google Scholar] [CrossRef]
  52. Miao, X.F.; Caron, L.; Roy, P.; Dung, N.H.; Zhang, L.; Kockelmann, W.A.; deGroot, R.A.; Dijk, N.H.V.; Brück, E. Tuning the phase transition in transition-metal-based magnetocaloric compounds. Phys. Rev. B 2014, 89, 174429. [Google Scholar] [CrossRef]
  53. Bacmann, M.; Soubeyroux, J.L.; Barrett, R.; Fruchart, D.; Zach, R.; Niziol, S.; Fruchart, R. Magnetoelastic transition and antiferro-ferromagnetic ordering in the system MnFeP1−yAsy. J. Magn. Magn. Mater. 1994, 134, 59–67. [Google Scholar] [CrossRef]
  54. Dung, N.H.; Zhang, L.; Ou, Z.Q.; Zhao, L.; Eijck, L.V.; Mulders, A.M.; Avdeev, M.; Suard, E.; Dijk, N.H.V.; Brück, E. High/low-moment phase transition in hexagonal Mn-Fe-P-Si compounds. Phys. Rev. B 2012, 86, 045134. [Google Scholar] [CrossRef]
  55. Berak, J. Das System Eisen-Phosphor-Kobalt. Arch. Das Eisenhüttenwesen 1951, 22, 131–135. [Google Scholar] [CrossRef]
  56. Zhu, D.; Zhou, T.; Sun, Q.; Shao, B. Tuning magnetic property of Si-doped Fe2P alloys via strain engineering. J. Magn. Magn. Mater. 2023, 587. [Google Scholar] [CrossRef]
  57. Delczeg-Czirjak, E.K.; Bergqvist, L.; Eriksson, O.; Gercsi, Z.; Nordblad, P.; Szunyogh, L.; Johansson, B.; Vitos, L. Microscopic theory of magnetism in the magnetocaloric material Fe2P1−xTx (T=B and Si). Phys. Rev. B 2012, 86, 045126. [Google Scholar] [CrossRef]
  58. Delczeg-Czirjak, E.K.; Delczeg, L.; Punkkinen, M.P.; Johansson, B.; Eriksson, O.; Vitos, L. Ab initio study of structural and magnetic properties of Si-doped Fe2P. Phys. Rev. B 2010, 82. [Google Scholar] [CrossRef]
  59. Kumar, S.; Krishnamurthy, A.; Srivastava, B.K. On nature of magnetism in ferromagnetic alloys (Fe1−xCox)2P. J. Phys. D Appl. Phys. 2008, 41. [Google Scholar] [CrossRef]
  60. Balli, M.; Fruchart, D.; Gignoux, D.; Tobola, J.; Hlil, E.K.; Wolfers, P.; Zach, R. Magnetocaloric effect in ternary metal phosphides (Fe1−xNix)2P. J. Magn. Magn. Mater. 2007, 316, 358–360. [Google Scholar] [CrossRef]
  61. Zach, R.; Toboła, J.; Średniawa, B.; Kaprzyk, S.; Casado, C.; Bacmann, M.; Fruchart, D. Magneto-elastic properties and electronic structure analysis of the (Fe1−xNix)2P system. J. Alloys Compd. 2004, 383, 322–327. [Google Scholar] [CrossRef]
  62. Kumar, S.; Krishnamurthy, A.; Srivastava, B.K. Influence of Co doping on structural and magnetic properties of Fe2P. Solid State Phenom. 2011, 171, 93–106. [Google Scholar] [CrossRef]
  63. Lewis, L.H.; Jiménez-Villacorta, F. Perspectives on permanent magnetic materials for energy conversion and power generation. Metall. Mater. Trans. A 2013, 44. [Google Scholar] [CrossRef]
  64. Coey, J.M. Hard magnetic materials: A perspective. IEEE Trans. Magn. 2011, 47, 4671–4681. [Google Scholar] [CrossRef]
  65. Tujii, H.; Kamigaichi, T.; Tsuneo, H.; Tetsuhiko, O. Magnetocrystalline Anisotropy of Fe2P and (Fe1−xNix)2P Compounds. J. Phys. Soc. Jpn. 1974, 37, 1712. [Google Scholar] [CrossRef]
  66. Fujii, H.; Hokabe, T.; Fujiwara, H.; Okamoto, T. Magnetic Properties of Single Crystals of the System (Fe1−xNix)2P. J. Phys. Soc. Jpn. 1977, 44. [Google Scholar] [CrossRef]
  67. Long, N.H.; Akai, H. First-principles KKR-CPA calculation of interactions between concentration fluctuations. J. Phys. Condens. Matter 2007, 19, 365232. [Google Scholar] [CrossRef] [PubMed]
  68. Köhler, S.; Ruocco, G.; Schirmacher, W. Coherent potential approximation for diffusion and wave propagation in topologically disordered systems. Phys. Rev. B 2013, 88, 064203. [Google Scholar] [CrossRef]
  69. Rowlands, D.A. Short-range correlations in disordered systems: Nonlocal coherent-potential approximation. Rep. Prog. Phys. 2009, 72, 086501. [Google Scholar] [CrossRef]
  70. Delczeg-Czirjak, E.K.; Gercsi, Z.; Bergqvist, L.; Eriksson, O.; Szunyogh, L.; Nordblad, P.; Johansson, B.; Vitos, L. Magnetic exchange interactions in B-, Si-, and As-doped Fe2P from first-principles theory. Phys. Rev. B Condens. Matter Mater. Phys. 2012, 85, 179903. [Google Scholar] [CrossRef]
  71. Liu, X.B.; Liu, J.P.; Zhang, Q.; Altounian, Z. Fe magnetic moment formation and exchange interaction in Fe2P: A first-principles study. Phys. Lett. Sect. A Gen. At. Solid State Phys. 2013, 377, 731–735. [Google Scholar] [CrossRef]
Figure 1. Schematic representation of the unit cell of the hexagonally structured binary Fe2P hard magnetic materials, with Fe occupying the 3f and 3g sites and P in the 2c and 1b positions.
Magnetism 05 00014 g001
Figure 4. (a) Calculated anisotropy constant K 1 as a function of Si concentration for the magnetocrystalline anisotropy energy of the [001]–[100] direction change for the hexagonally structured Fe2P1−xSix compound using the GGA (black) and LSDA (red) exchange functionals. A vertical dashed line marks the experimentally found transition (∼8 at.% Si) to the BCO phase with increasing Si contents. Experimental data from He et al. [13]. Calculated anisotropy constants K 1 depending on Co substitution for (b) hexagonal Fe2−yCoyP, (c) hexagonal Fe2−yP0.92Si0.08, and (d) hexagonal Fe2−yP0.84Si0.16 using the GGA (black) and LSDA (red) exchange functionals. Vertical dashed lines in (bd) mark the experimentally found phase transitions to a Co2P structure with increasing Co concentrations (∼10, 13, and 20 at.% Co for x = 0, 0.08 and 0.16 Si).
Magnetism 05 00014 g004
Figure 5. (left) Calculated Curie temperatures for Fe2P1−xSix ternaries in the range of 0 x 0.5 Si. Experimental data by Severin et al. [27] and Jernberg et al. [29] are shown for comparison. (right) Curie temperatures for Fe2−yCoyP1−xSix quarternaries with x = 0.0, 0.08 and 0.16 Si per f.u. in the range of 0 y 1.0 Co per f.u.
Magnetism 05 00014 g005
Table 1. Theoretical and experimental results for the lattice parameters a and c, volume V, magnetic moment m t o t , magnetization μ 0 M S , maximum energy product | B H | m a x , anisotropy constant K 1 , anisotropy field H a , and bulk modulus of the unsubstituted Fe2P compound.
Lattice Constant (Å)Volume (Å3) m tot ( μ B /f.u.) μ 0 M S (T) | BH | max K 1 H a Bulk Modulus (GPa)
a c
This work5.8083.425100.093.021.06221.8GGA 3.26 1
LSDA 1.33 2
6.17
2.52
214
Theory5.809 33.425 3100.07 33.01 31.04 3 3.0 35.77 3
Experiment5.872 43.460 4 2.94 51.03 6 2.68 6,7
2.32 5,8
6.5 6,7223 9
1 Calculated with GGA exchange functional. 2 Calculated with LSDA exchange functional. 3 Data from Khongorzul et al. [48] calculated with GGA exchange functional. 4 Data from Tobola et al. [16]. 5 Data from Fujii et al. [17]. 6 Data from He et al. [13]. 7 Measured at 2.0 K. 8 Measured at 4.2 K. 9 Data from Dera et al. [49].
Table 2. Theoretical anisotropy constant K 1 and anisotropy field H a for Si substitution and and Co substitutions into compounds with x = 0.0, 0.08, and 0.16 Si per f.u. LSDA values are given in parenthesis.
Si Subst.Co-FreeCo subst.x = 0.0 Six = 0.08 Six = 0.16 Si
K 1 H a (T) K 1 H a (T) K 1 H a (T) K 1 H a (T)
Fe2P3.26
(1.33)
6.17
(2.52)
Fe2P1−x3.26
(1.33)
6.17
(2.52)
2.33
(2.55)
4.30
(4.72)
1.80
(2.29)
3.25
(4.12)
Fe2P0.92Si0.082.33
(2.55)
4.30
(4.72)
Fe1.84Co0.16P1−xSix1.57
(0.87)
3.13
(1.72)
1.68
(1.87)
3.27
(3.62)
1.83
(1.93)
3.47
(4.12)
Fe2P0.84Si0.161.80
(2.29)
3.25
(4.12)
Fe1.67Co0.33P1−xSix0.78
(0.66)
1.64
(1.37)
1.08
(0.96)
2.20
(1.95)
1.14
(1.10)
2.27
(2.19)
Fe2P0.75Si0.251.46
(2.18)
2.57
(3.83)
Fe1.5Co0.5P1−xSix0.38
(0.36)
0.83
(0.79)
0.65
(0.75)
1.39
(1.61)
0.66
(0.69)
1.37
(1.44)
Fe2P0.67Si0.331.47
(1.80)
2.51
(3.09)
Fe1.34Co0.66P1−xSix0.13
(−0.16)
0.30
(−0.38)
0.39
(0.12)
0.89
(0.26)
0.36
(0.23)
0.80
(0.50)
Fe2P0.59Si0.411.42
(1.53)
2.33
(2.51)
Fe1.17Co0.83P1−xSix−0.50
(−0.85)
−1.22
(−2.10)
−0.14
(−0.71)
−0.32
(−1.68)
0.09
(−0.21)
0.21
(−0.49)
Fe2P0.5Si0.51.22
(1.40)
1.96
(2.25)
FeCoP1−xSix−1.14
(−1.45)
−2.96
(−3.75)
−0.94
(−1.29)
−2.38
(−3.29)
−0.63
(−0.93)
−1.54
(−2.29)
Disclaimer/Publisher’s Note: The statements, opinions and data contained in all publications are solely those of the individual author(s) and contributor(s) and not of MDPI and/or the editor(s). MDPI and/or the editor(s) disclaim responsibility for any injury to people or property resulting from any ideas, methods, instructions or products referred to in the content.

