Review

Advancing Molecular Spectroscopy Efficiency with Extensive Parallelism

1
Department of Computer Science, University of Nevada, Las Vegas, NV 89154, USA
2
Department of Physics and Astronomy, University of Nevada, Las Vegas, NV 89154, USA
*
Author to whom correspondence should be addressed.
These authors contributed equally to this work.
Metrology 2024, 4(4), 736-764; https://doi.org/10.3390/metrology4040043
Submission received: 14 September 2024 / Revised: 21 November 2024 / Accepted: 2 December 2024 / Published: 5 December 2024
(This article belongs to the Special Issue Advancements in Optical Measurement Devices and Technologies)

Abstract

:
Molecular spectroscopy, with a legacy spanning over a century, has profoundly enriched our understanding of the microscopic world, driving major advancements across science and engineering. Over time, this field has steadily advanced, incorporating innovations such as lasers and digital computers to reach new levels of precision and sensitivity. Over the past decade, the integration of high-speed embedded electronic systems and advanced light sources has ushered molecular spectroscopy into a new era, characterized by extensive parallelism and enhanced sensitivity. This review delves into two pioneering technologies that embody recent advancements in molecular spectroscopy: Chirped-Pulse Fourier Transform Microwave (CP-FTMW) spectroscopy and optical frequency comb (OFC) spectroscopy. We provide an overview of the fundamental principles behind these methods, examine their most impactful applications across diverse fields, and discuss their potential to drive future developments in molecular spectroscopy. By highlighting these technologies, we aim to underscore the transformative impact of integrating high-speed digital electronics and advanced light sources with molecular spectroscopy, enabling extensive parallelism and paving the way for groundbreaking discoveries and innovations in this rapidly evolving field.

1. Introduction

Molecular spectroscopy, which investigates the interaction between matter and electromagnetic radiation, has a rich history marked by groundbreaking experiments that have profoundly deepened our understanding of the microscopic world. These studies have illuminated the fundamental characteristics and quantum properties of molecules. From the early 20th century, when scientists first analyzed molecular spectra to reveal chemical compositions and molecular structures, to the mid-20th century’s introduction of laser spectroscopy—which dramatically enhanced precision—the field has consistently remained at the forefront of scientific innovation. Each technological and methodological advancement has expanded our knowledge of molecular structures and dynamics, playing a pivotal role in the progression of the physical sciences. This continuous evolution reflects the intrinsic curiosity that drives scientific inquiry and underscores the central role of molecular spectroscopy in uncovering the universe’s complexities at its most fundamental level.
Over the past few decades, groundbreaking advancements in molecular spectroscopy have significantly expanded the scope of scientific research, particularly by improving spectroscopic accuracy [1,2,3,4] and increasing detection sensitivity [5,6,7,8,9]. The field is also experiencing a profound shift toward quantum control of molecular systems [10,11,12,13,14]. This transition from passive observation to active manipulation of molecular behavior is opening up exciting possibilities for uncovering novel physical phenomena. Additional key advancements include (1) the development of rapid data acquisition, facilitating the real-time analysis of complex molecular interactions [15,16]; (2) the integration of Artificial Intelligence (AI), enhancing data interpretation and key information extraction [17,18]; and (3) the progress of portable spectroscopic devices, marking a leap beyond traditional laboratory settings [19,20]. Together, these breakthroughs are expanding the scope of molecular spectroscopy and paving the way for transformative discoveries across a wide range of scientific disciplines.
This review highlights two cutting-edge technologies that have become prominent in molecular spectroscopy: Chirped-Pulse Fourier Transform Microwave (CP-FTMW) spectroscopy and optical frequency comb (OFC) spectroscopy. These innovative techniques leverage broad excitation sources, enabling extensive parallel measurements and marking a substantial shift from the narrowband sources traditionally used in microwave and laser spectroscopy. This multiplexing capability significantly improves experimental efficiency, allowing for more comprehensive data collection in a shorter time frame.
The primary aim of this paper is not to provide a comprehensive history of molecular spectroscopy. Instead, our focus is on highlighting recent frequency synthesis methods that have driven significant advancements in the field. These innovations have catalyzed substantial scientific progress across a range of disciplines, including physics, chemistry, biology, and environmental science.

2. CP-FTMW Spectroscopy

Microwave spectroscopy is a benchmark technique for identifying molecular species and determining molecular structures. With a spectroscopic resolution of approximately 0.1 MHz, it offers a resolution 3–4 orders of magnitude higher than traditional laser spectroscopy, allowing for the precise extraction of essential molecular constants, such as rotational constants, hyperfine splittings, and isotope shifts [21,22,23,24]. In addition to high resolution, detection sensitivity and data acquisition speed are crucial factors, which determine the experimental efficiency. Traditional instruments, such as the Balle–Flygare Fourier transform microwave (BF-FTMW) spectrometer, achieve enhanced sensitivity by employing a high-quality (high-Q) resonant cavity, which traps the microwave field, allowing repeated interactions with the sample and thus improving signal strength [25]. However, the narrowband excitation pulse, typically around 1 MHz, limits the speed of spectral acquisition. Capturing a spectrum with multiple rotational transitions requires extensive frequency scanning, often involving thousands of steps, which is time-consuming and susceptible to intensity fluctuations caused by variations in the molecular source or state preparation.
To address the slow data acquisition limitations of traditional BF-FTMW spectrometers, a fast tunable or broadband microwave source is essential. Developed in the 1950s, the backward-wave oscillator (BWO) is a high-power, tunable continuous-wave (CW) microwave source with a broad frequency range, making it suitable for applications requiring stable and precise frequency control, such as microwave spectroscopy and radar [26,27,28,29]. Compared to BF-FTMW sources, the BWO offers much faster frequency tuning rates, typically on the order of milliseconds. Recent advancements have extended its operating frequencies into the THz range, achieving continuous tunability of approximately 100 GHz [30]. While the BWO is primarily used in continuous frequency-scanning mode, some experiments have demonstrated its potential for broadband excitation in the time domain, which could further expand its range of applications [31].
At the beginning of the 21st century, advances in high-speed digital electronics led to the development of a transformative technology: the CP-FTMW spectrometer, pioneered by Pate’s group at the University of Virginia [32,33,34]. Unlike the BWO source, which typically operates in CW mode, the CP-FTMW spectrometer generates extremely short pulses, typically in the sub-microsecond range, with a bandwidth exceeding 10 GHz. This broadband excitation allows for the simultaneous recording of multiple molecular transitions, significantly enhancing the data acquisition speed. Moreover, digital frequency synthesis enables the CP-FTMW spectrometer to generate arbitrary frequency patterns with precise phase control, yielding highly accurate phase information. In addition to these advantages, the CP-FTMW spectrometer is significantly lighter and more portable than the bulky, high-power-consuming BWO system, making it ideal for on-site applications in both scientific and industrial settings.

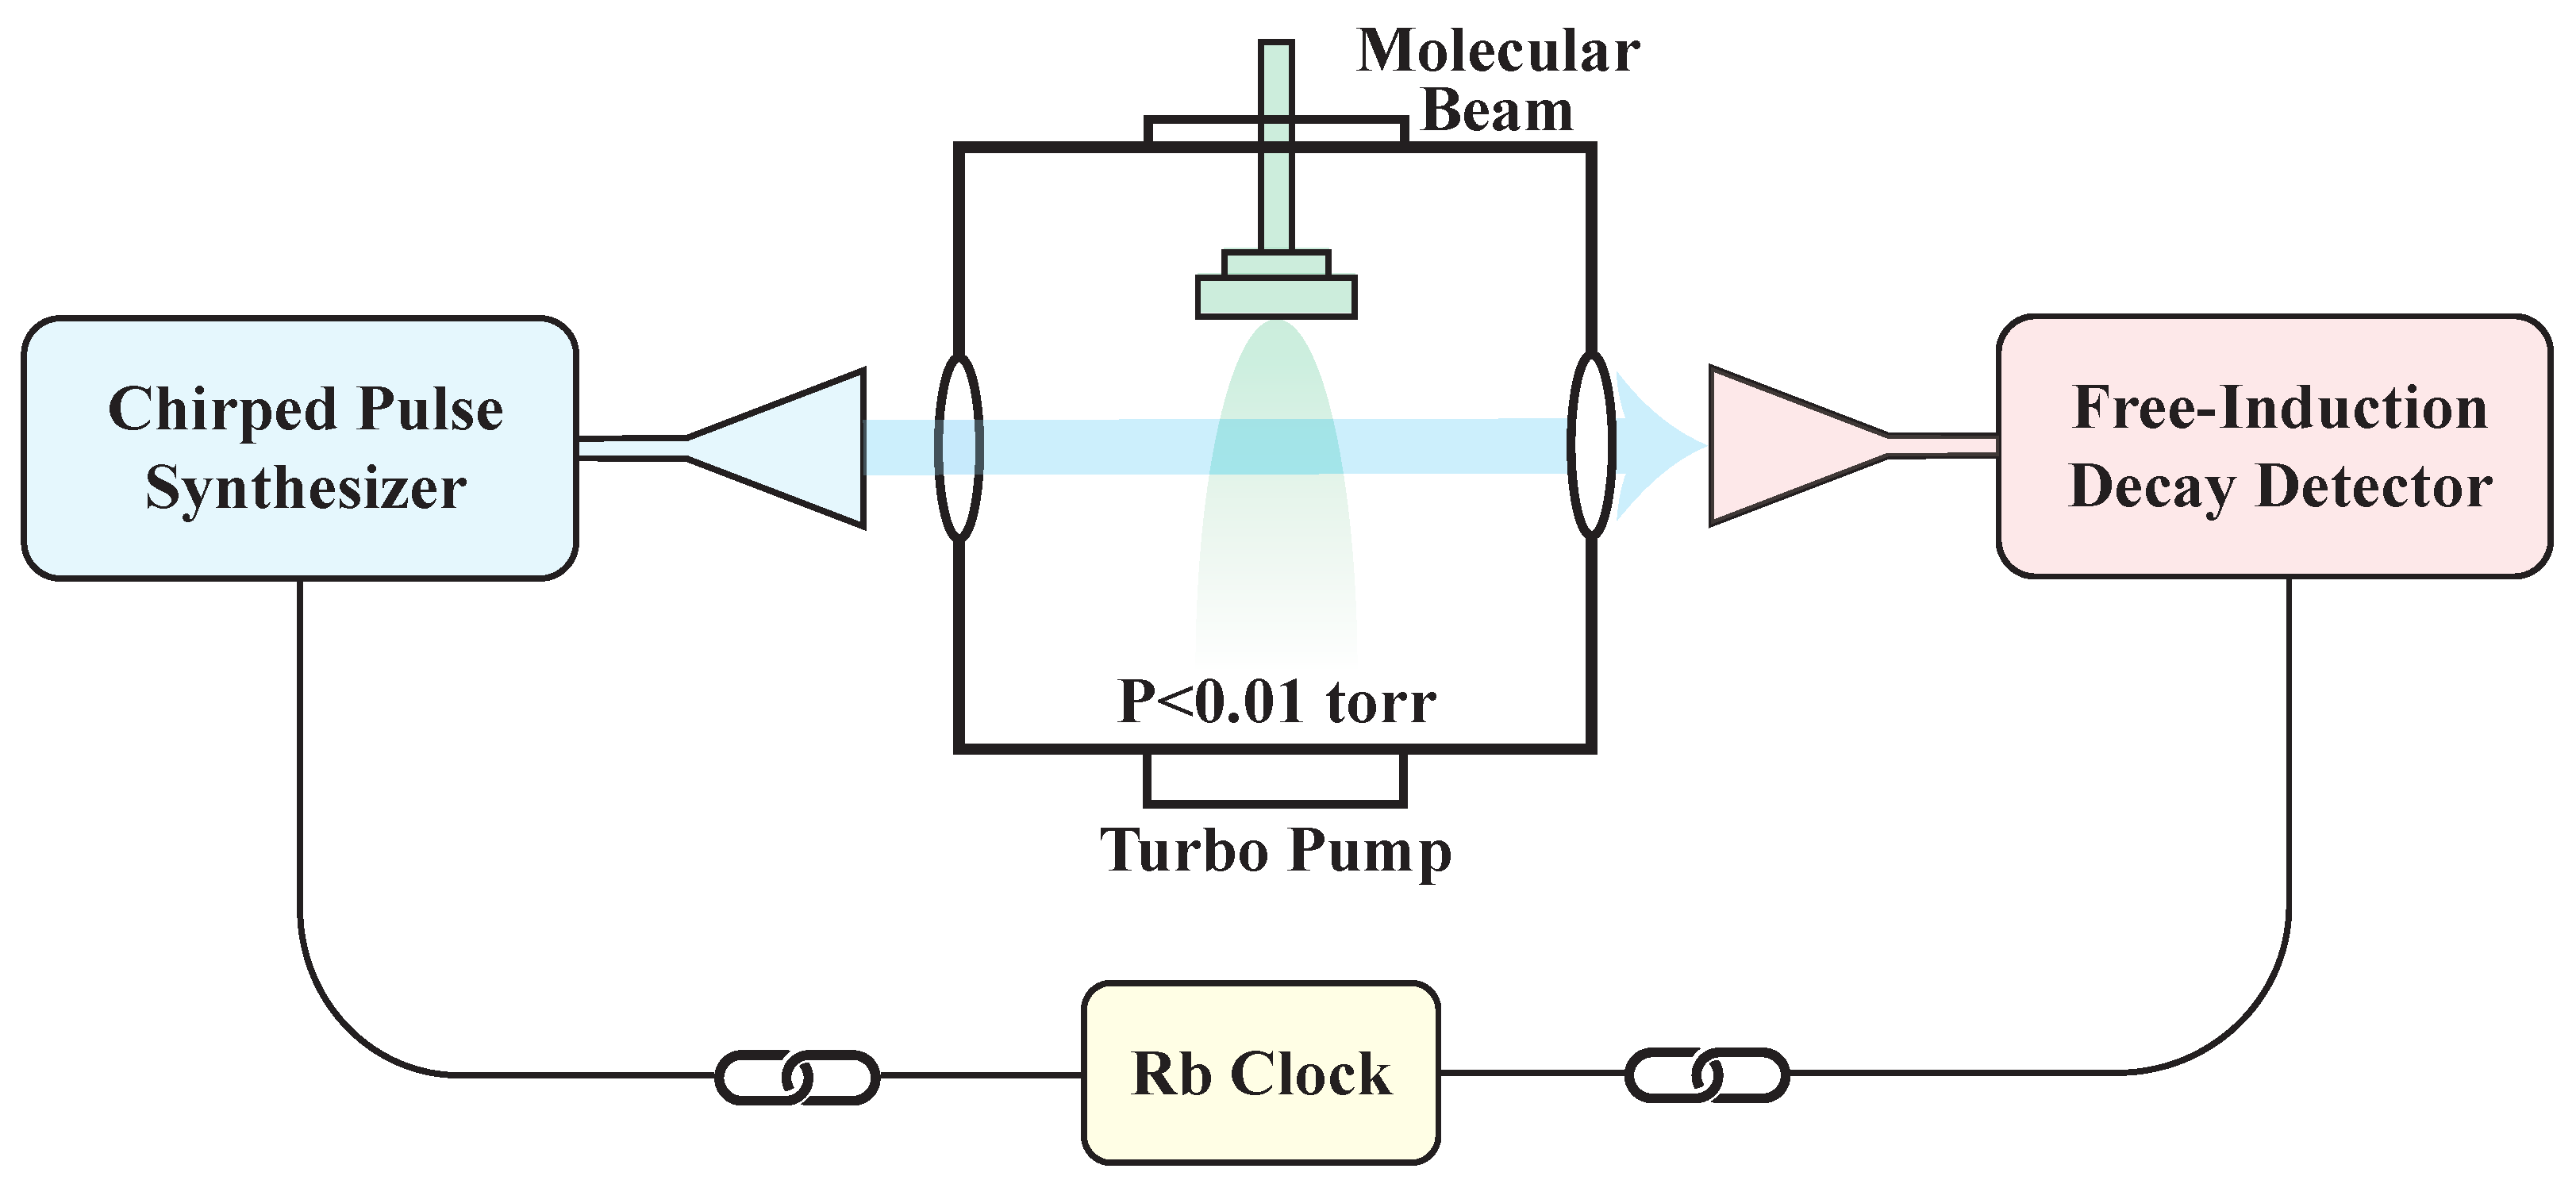
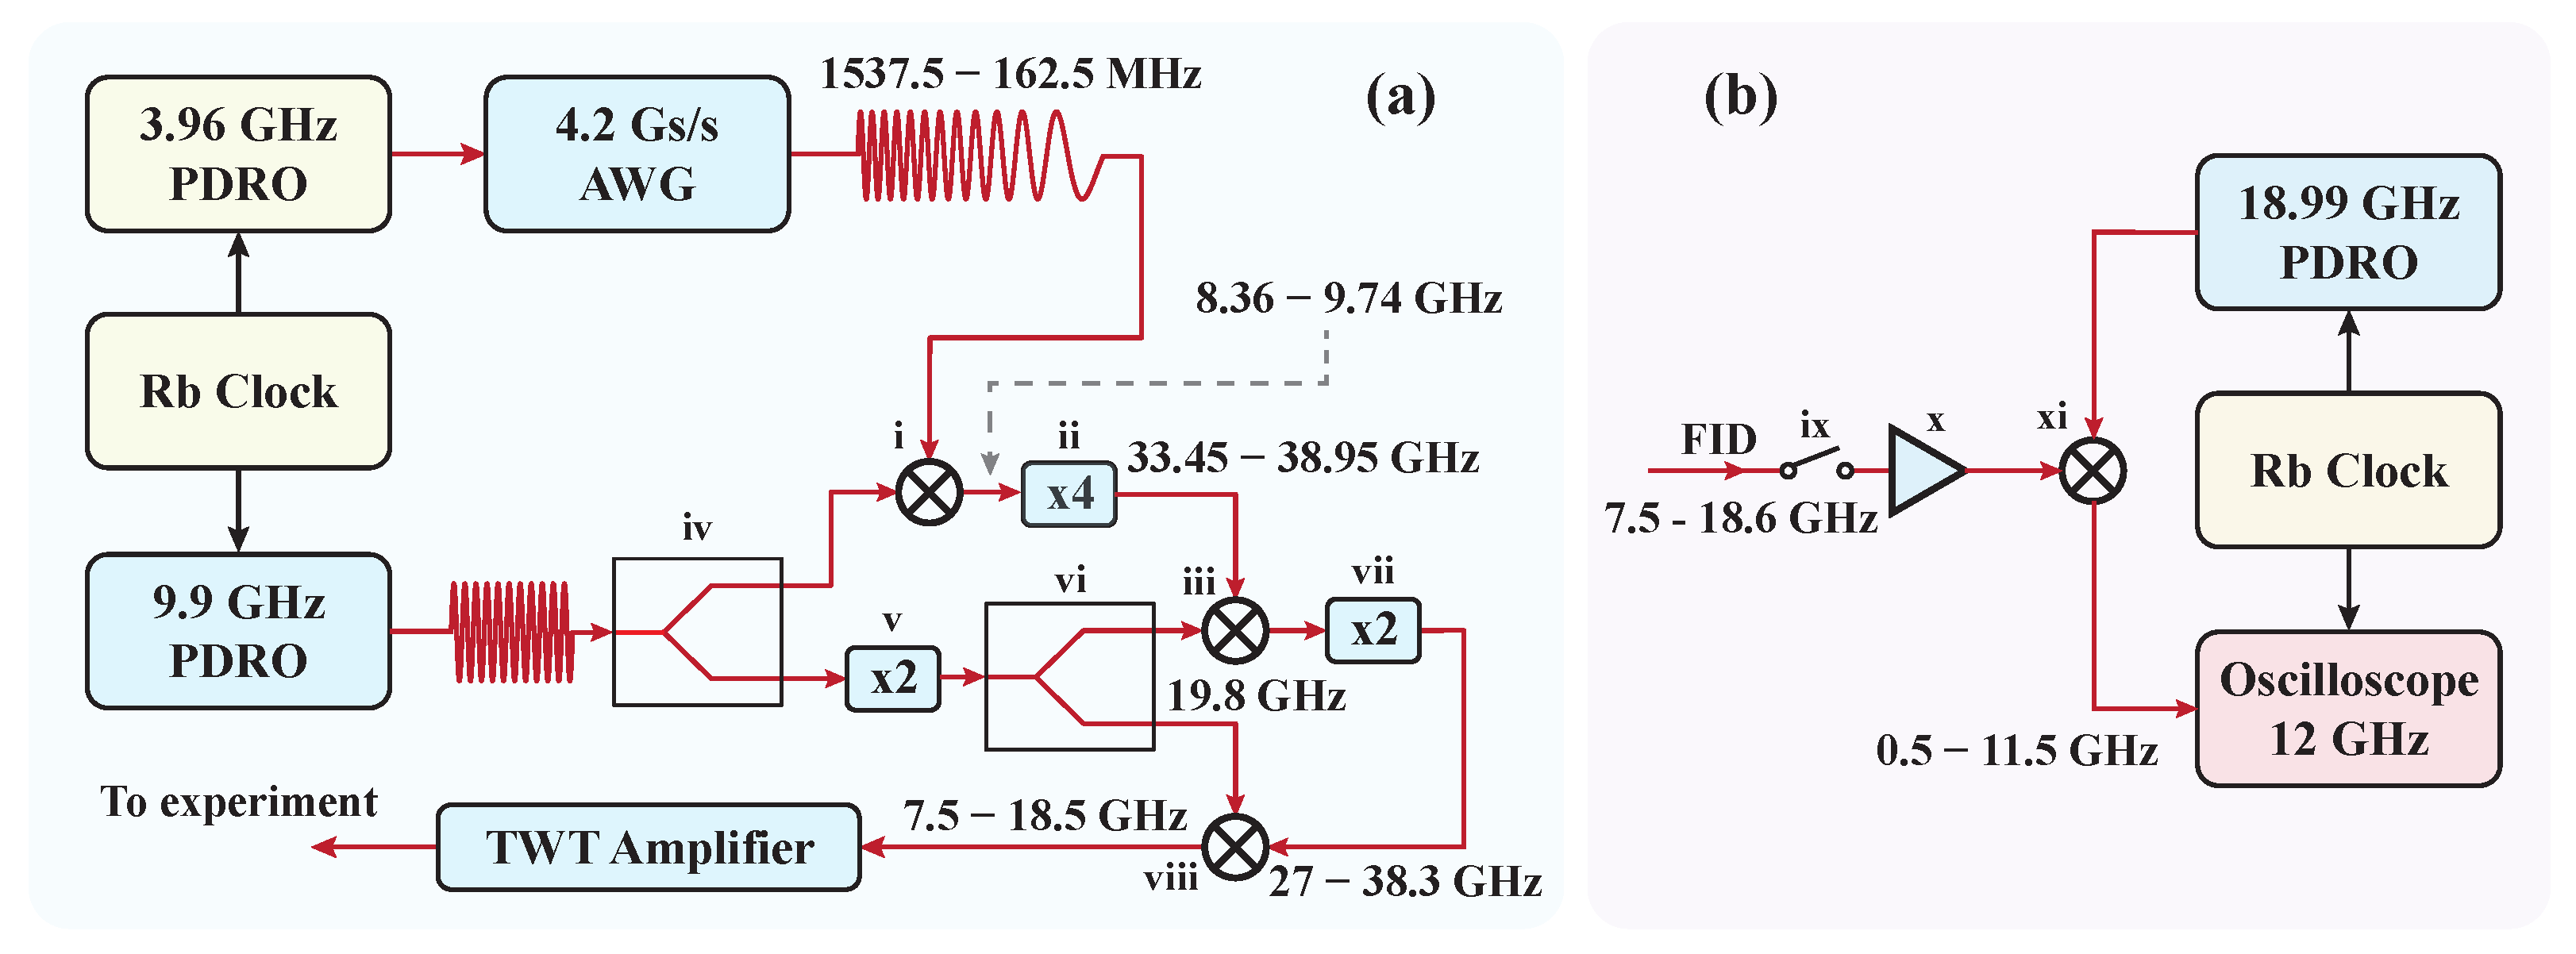
2.1. CP-FTMW Spectrometer

The CP-FTMW spectrometer eliminates the need for frequency stepping, allowing the rapid acquisition of high-resolution broadband spectra. This capability is realized through four key aspects:
  • The approach of using rapid frequency sweeps to generate strong polarization was first demonstrated by McGurk, Schmalz, and Flygare in 1974 [35]. At that time, however, technological limitations made it difficult to quickly adjust microwave frequencies. To overcome this, they used a ramped electric field to produce a rapid Stark shift sweep, effectively shifting the relative frequency between the microwave signal and the molecular transitions.
  • To achieve broadband excitation, the chirped-pulse (CP) approach replaces ultra-short, Fourier-transform-limited pulses, which typically distribute low power across individual frequency components. In contrast, CPs have longer pulse durations (∼1 μs) and wide bandwidths (>10 GHz), providing broad spectral coverage with a more uniform power distribution. High-speed digital Arbitrary Waveform Generators (AWGs) are now commonly used to efficiently generate CPs.
  • Molecules polarized by CPs emit a Free-Induction Decay (FID) signal, which can be captured and digitized in the time domain using a high-speed oscilloscope. This FID signal contains information across the entire bandwidth (>10 GHz) in a single-shot measurement. A frequency-domain spectrum is then obtained by applying a fast Fourier transform (FFT) to the FID signal.
  • The devices used for generating the CPs and detecting the FID signals are phase-referenced to an accurate frequency standard. This precise synchronization ensures that the phase-reproducible FID signals are coherently averaged in the time domain, resulting in a linear enhancement of the signal-to-noise ratio (SNR).
Building on these advancements, Pate’s group developed the first CP-FTMW spectrometer in 2006 [32,33]. This spectrometer generates a one-microsecond CP that linearly sweeps frequencies from 7.5 to 18.5 GHz. As shown in Figure 1, the setup is organized into three main operational components: (1) the CP synthesizer, (2) the interaction zone, and (3) the FID detector. In the interaction zone, a supersonic molecular beam interacts with the CP within a vacuum chamber, where the pressure is kept below 0.01 torr to minimize collisional broadening to less than 100 kHz.
In the CP-FTMW spectrometer, the initial CP is generated by a 4.2 Gs/s AWG, covering a frequency range of 162.5 to 1537.5 MHz. To broaden the CP’s bandwidth, the spectrometer employs a series of frequency multiplication and mixing stages, as illustrated in Figure 2a. First, the initial CP is mixed with a 9.9 GHz single-frequency wave from a Phase-locked Dielectric Resonator Oscillator (PDRO). Second, the resulting signals (sum and difference) pass through a bandpass filter to isolate the desired difference frequency. Third, a frequency quadrupler increases both the frequency and bandwidth by a factor of four, extending the range to 33.45–38.95 GHz. Fourth, a second mixer down-converts the frequency to 13.65–19.15 GHz by mixing it with a 19.8 GHz single-frequency wave, generated by doubling the 9.9 GHz signal from the PDRO. Fifth, a frequency doubler further doubles the frequency and bandwidth, resulting in a CP spanning 27.3–38.3 GHz. Finally, a third mixer down-converts the signal to the final range of 7.5–18.5 GHz by mixing it with an additional 19.8 GHz single-frequency wave.
Through these processes, the CP’s bandwidth expands eightfold, from an initial 1.375 GHz to a final 11 GHz, with sequential mixing steps preserving the bandwidth while shifting the center frequency to approximately 10 GHz. After frequency synthesis, the CP is amplified by a high-power Traveling-Wave Tube (TWT) amplifier, raising its peak power to 2 kW. This amplification is essential for achieving sufficient rotational polarization across the entire 11 GHz frequency range within a one-microsecond window.
To detect the FID signal, a frequency down-conversion circuit is used, as shown in Figure 2b. First, a fast microwave switch eliminates or significantly attenuates the strong CP to prevent the saturation of subsequent components. Second, the FID signal, which follows the CP, is amplified by a low-noise amplifier. Third, the amplified FID signal is down-converted by mixing it with an 18.99 GHz single-frequency wave generated by a PDRO. Finally, the down-converted signal is digitized using a high-speed oscilloscope with a 12 GHz bandwidth and a sampling rate of 40 Gs/s.
To enable the coherent averaging of FID signals up to several thousand times, all time-critical components—including the AWG, oscilloscope, and PDROs—are phase-referenced to a rubidium clock to ensure precise phase stability. The AWG’s versatility is especially valuable, as it supports not only linear frequency sweeps but also complex, arbitrary frequency modulations. This flexibility is essential for tailoring excitation pulses to a wide range of applications beyond spectroscopy, such as coherent quantum control of atoms and molecules [10,36,37].

2.2. Extensions of CP Spectrometers

Since its invention, the CP-FTMW spectrometer, with its unique high-bandwidth capability—four orders of magnitude greater than that of the traditional BF-FTMW spectrometer—has transformed molecular rotational spectroscopy. Over the past decade, substantial technological advancements have been made to extend its applications across diverse scientific fields, including (1) reaching higher frequency ranges and wider bandwidths, (2) developing more cost-effective and compact systems, and (3) hybridizing CP-FTMW and BF-FTMW technologies to improve accuracy and detection sensitivity.

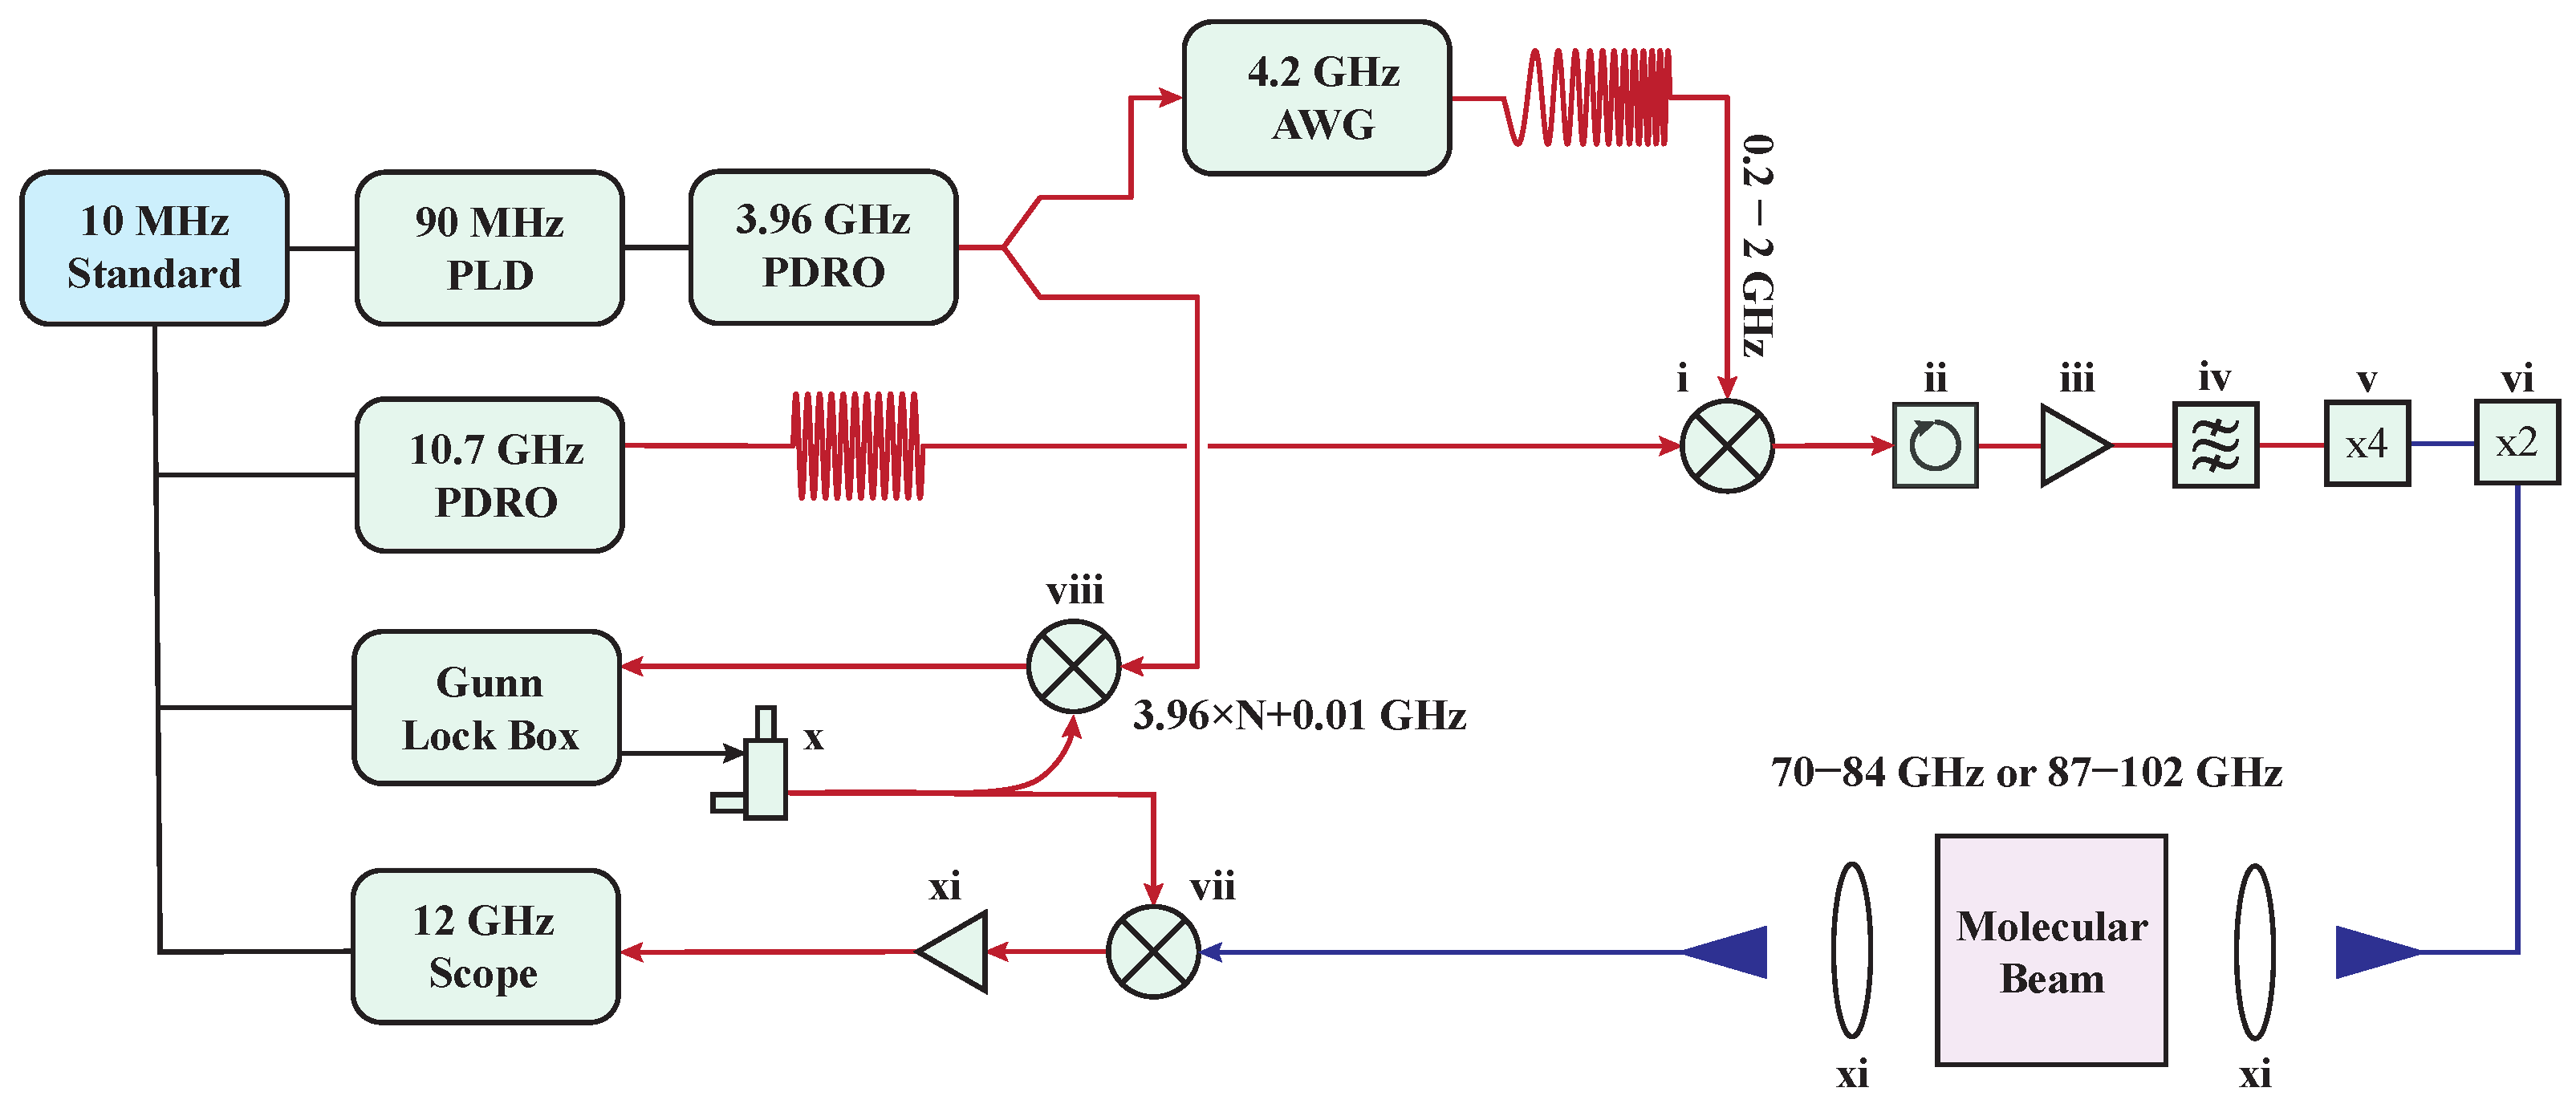
2.2.1. Spectrometers Toward Terahertz Frequencies

In 2011, Field’s group at MIT extended CP-FTMW technology into the millimeter-wave domain by leveraging advancements in broadband millimeter-wave amplifiers and heterodyne receivers [38]. This extension is especially beneficial for small molecules with large rotational constants. The Chirped-Pulse millimeter-Wave (CPmmW) spectrometer operates in the 70–102 GHz range, as illustrated in Figure 3.
In this configuration, a CP spanning 0.2 to 2 GHz, generated by a 4.2 Gs/s AWG, is mixed with a 10.7 GHz radio frequency (RF) signal from a PDRO in mixer i. This setup retains both the sum (10.9–12.7 GHz) and difference (8.7–10.5 GHz) frequencies. Through an active frequency multiplication chain (v: x4; vi: x2), the CP covers frequencies from 69.6 to 84 GHz and 87.2 to 101.6 GHz, achieving a maximum bandwidth exceeding 28 GHz. A bandpass filter (iv) allows the selection of a specific frequency range or coverage of the entire bandwidth as needed.
As with its predecessor, the CPmmW spectrometer requires the down-conversion of the detection signal for digitization by an oscilloscope. A Gunn oscillator with a phase-locked loop (PLL) circuit (x), synchronized to a 3.96 GHz PDRO, generates harmonic frequencies of the form 3.96 GHz × N + 0.01 GHz, where N is an adjustable integer between 18 and 24. For instance, setting N to 20 provides a down-conversion mixer (vii) input at 79.2 GHz, enabling the digitization of frequency components in the ranges of 69.6–84 GHz and 87.2–91.2 GHz using a 12 GHz oscilloscope. To detect higher-frequency components, adjusting N on the Gunn oscillator (e.g., setting N to 23 to obtain 91.08 GHz) allows the detection of frequencies up to 101.6 GHz.
In the coming decade, advancements in high-frequency circuits and opto-electronic hybrid technologies are expected to extend operational frequencies toward, and potentially beyond, one terahertz (THz) [39,40,41,42,43]. This progress could enable the exploration of soft vibrational modes in large polyatomic molecules [44]. Additionally, Chirped-Pulse THz (CP-THz) spectrometers offer substantial potential for improving trace gas sensing due to several key advantages: (1) FID detection is inherently free of background noise, (2) coherent averaging in the time domain linearly improves the SNR, and (3) for small polyatomic molecules, the spectral region around 0.5 THz corresponds closely with the peak of the Boltzmann distribution at room temperature. These attributes make the CP-THz spectrometer especially effective for detecting key atmospheric species, such as nitrous oxide and water vapor, as well as volatile organic compounds like formaldehyde and methanol [34,42,45,46,47].

2.2.2. Segmented CP Spectrometers

Over the past decade, building on the CP-FTMW technology pioneered by Pate’s group, more than a hundred CP spectrometers have been constructed and are actively used for molecular physics research worldwide. However, to broaden its applications—particularly for industrial and on-site research outside of laboratories—the cost of the equipment remains a significant challenge. This is largely due to the expense of the two critical components: the AWG and the oscilloscope, especially those with wider bandwidths. Beyond technical challenges, a fundamental limitation exists in that the polarization amplitude induced by the CP is inversely proportional to the excitation bandwidth [38]. Consequently, for a CP with a bandwidth of 20 GHz or more, the excitation power at each frequency component may be insufficient to polarize the molecules. This issue becomes especially pronounced above 100 GHz, where high-power amplifiers are still limited in both availability and performance.
To advance technology and improve cost efficiency, segmented CP-FTMW spectrometers have been developed using low-cost digital hardware, offering broader frequency coverage at significantly reduced costs [43,48,49,50]. Instead of generating a single CP with a bandwidth of tens or even hundreds of GHz, this system uses multiple segmented 1 GHz CPs to cover the entire frequency range. The design of the segmented CP-FTMW spectrometer developed in Zhou’s group is shown in Figure 4 [49]. This approach achieves substantial cost savings by using low-cost embedded devices, including a Direct Digital Synthesizer (DDS, 0.1–5 GHz), a low-speed AWG (100 MHz), and a moderately fast digitizer (1 GHz) based on Field-Programmable Gate Array (FPGA) technology. Further cost reductions are realized by using the same frequency multiplier chain for both up-conversion and down-conversion processes.
First, a CP with a frequency range f c = 40–60 MHz, generated by an AWG, is mixed with a tunable f 0 = 3–4 GHz wave from a DDS, producing a signal at f i = f 0 ± f c . This signal is then frequency-multiplied by a factor of 24 through an active frequency multiplier chain (ii, iv, and v). The multiplier chain not only up-converts the frequency to the 72–96 GHz range but also expands the CP bandwidth from 40 MHz to approximately 1 GHz, including both the sum and difference frequencies at mixer i. Following the excitation pulse, the FID radiation is received by a second horn, amplified (x), down-converted via a mixer (xi), and recorded by a fast digitizer with a 1 GHz bandwidth. The DDS frequency can be tuned to adjust the center frequency, which automatically shifts the frequency in the down-conversion arm, keeping the signal within the 1 GHz range of the digitizer. To characterize the frequency of the excitation pulse, the notch filter (iii) can be removed, allowing the detection of beat signals between the CP and the leakage DDS frequency through mixer i.
The complete pulse train, consisting of 24 segments, spans the entire bandwidth from 72 to 96 GHz. While this segmented approach reduces the spectroscopic coverage of a single chirp, it concentrates more power per frequency element, thereby enhancing the strength of the FID signal. Additionally, strategic optimizations—such as adaptive data acquisition, buffered post-data processing, and the use of multiple CPs on a single gas pulse—can improve experimental efficiency. These enhancements have the potential to bring the performance of the segmented spectrometer in line with that of standard CP-FTMW spectrometers while reducing costs by a factor of five to ten. Furthermore, incorporating AI-based algorithms into the data acquisition process could further enhance efficiency by focusing on the most information-rich regions instead of covering the entire bandwidth.

2.2.3. Hybrid of CP-FTMW and BF-FTMW Spectrometers

While the CP-FTMW spectrometer provides a substantial advantage over BF-FTMW spectrometers by capturing spectra across 10 GHz bandwidth, the BF-FTMW approach remains superior in sensitivity for detecting individual transitions, primarily due to its use of high-Q cavities. Moreover, the BF-FTMW spectrometer typically provides higher spectroscopic resolution (several kHz) compared to the CP-FTMW spectrometer (several tens of kHz). This enhanced resolution is also achieved through the high-Q cavity, which traps the coherent microwave field for durations that can exceed the FID decay time. This extended interaction time selectively enhances signals from a subgroup of molecules with longer coherence, partially mitigating inhomogeneous broadening effects such as Doppler broadening and resulting in sharper spectral lines.
While the CP-FTMW spectrometer generally offers slightly lower spectroscopic resolution than the BF-FTMW spectrometer, it remains highly effective for most spectroscopic applications. In cases where exceptionally high frequency accuracy and detection sensitivity are required, McCarthy’s group at Harvard University has developed a hybrid method that combines the CP-FTMW spectrometer with the cavity-enhanced BF-FTMW spectrometer [24]. This approach utilizes the broad spectral coverage of CP-FTMW to locate the important regions, followed by the high sensitivity and resolution of the BF-FTMW spectrometer to precisely identify and assign molecular transitions.
Building on the strengths of the hybrid method that combines two spectrometers, McCarthy’s group demonstrated a new approach named microwave spectral taxonomy. This method enables rapid, unbiased spectroscopic surveys with substantial potential for discovering new molecules, making it particularly valuable in fields like astrophysics and radical chemistry. By categorizing spectral lines based on their responses to varying experimental conditions—such as applied magnetic fields or changes in gas precursors—McCarthy’s group effectively narrows down potential molecular carriers. Follow-up double-resonance experiments are then conducted to link transitions that share common energy levels, further refining the identification process. This semi-automated approach significantly enhances the efficiency and precision of spectroscopic analysis, allowing for more detailed studies of complex molecular mixtures and facilitating the discovery of new species [51,52].

2.3. Applications in Structural Determination

As described in Section 2.1, the multiplexing capabilities of CP-FTMW spectrometers have significantly accelerated spectral acquisition rates, facilitating the study of increasingly complex molecular species. Historically, high-resolution rotational spectroscopy was primarily restricted to molecules with only a few atoms. Recent advancements, however, have expanded its capabilities, enabling the analysis of species with more than ten atoms. [34].
The CP-FTMW spectrometer in the 26.5–40 GHz range has recently been employed to analyze and distinguish two structurally similar organic molecules, N-ethyl maleimide (NEM) and N-ethyl succinimide (NES) [53]. Under cryogenic conditions (<10 K), this technique provides highly precise frequency measurements with sub-100 kHz accuracy and a high signal-to-noise ratio (60–200) across numerous rotational transitions. Such precision allows for the rapid and accurate extraction of molecular constants essential for structural determination, including rotational constants, centrifugal distortion constants, and nuclear quadrupole coupling constants. These constants are obtained by fitting the CP-FTMW spectrum to an effective Hamiltonian model that accounts for rotational energy levels and relevant perturbations. The exceptional agreement between experimental measurements and quantum chemistry calculation—within a 0.15% discrepancy for the A, B, and C rotational constants—demonstrates the power of the CP-FTMW spectrometer in providing detailed structural insights into structurally similar organic molecules.
Another example of structural determination using the CP-FTMW spectrometer is the study of 3’- and 4’-aminoacetophenone [54]. Beyond precise frequency measurements, the technique’s ability to capture relative intensity information in a single shot plays a pivotal role. By leveraging the relative intensities of different conformers and assuming thermal equilibrium, the energy difference between the two conformers of aminoacetophenone is determined. This use of intensity data is particularly valuable, as it provides direct insights into conformational stability and energetics, offering a deeper understanding of molecular structure that extends beyond standard frequency measurements.
Chiral molecules are essential to the functionality of many biological systems and are also of significant interest in fundamental physics due to their potential to probe parity violation effects [55,56,57,58]. However, while structurally similar molecules can still be differentiated by subtle differences in their molecular constants, enantiomers of chiral molecules share identical constants, making them indistinguishable using traditional microwave spectroscopy. Conventional methods for assessing chirality—such as optical circular birefringence [59,60], circular dichroism [61,62], and Raman optical activity [63,64]—rely on higher-order nonlinear excitation processes. These techniques often produce weaker signals and typically require condensed-phase samples with high molecular concentrations for reliable chirality determination.
The development of CP-FTMW, particularly with advancements in phase information extraction, has introduced a novel approach that combines resonant three-wave mixing with an adiabatically switched DC electric field to tackle the challenge of enantiomer differentiation [23,65,66,67,68,69,70]. This technique enables the determination of molecular chirality in the gas phase by utilizing linear rotational transitions with large electric dipole moments. Rather than relying on frequency shifts, it distinguishes enantiomers through unique phase signatures, as depicted in Figure 5. The ability to resolve enantiomers of chiral molecules underscores the critical role of phase information extraction in CP-FTMW spectrometers, a capability typically absent in BF-FTMW spectrometers.

2.4. Applications in Investigating Dynamics

Beyond molecular structure determination, the CP-FTMW spectrometer has opened new avenues for investigating molecular dynamics. This progress is largely due to its broad bandwidth and rapid time-domain data acquisition, which allow for the precise capture and analysis of intensity information. With this capability, it can directly measure population distributions across a wide range of quantum states. Coupled with high-resolution spectral analysis, the CP-FTMW spectrometer becomes a powerful tool for probing transition states in molecular fragmentation processes [46,71,72]. Furthermore, it is well suited for chemical kinetics studies, enabling the detection and quantification of relative transition intensities among reaction products. This versatility makes it invaluable for extracting detailed information about molecular species, conformers, relative concentrations, vibrational population distributions, and the quantum yields of reaction products [73].
For example, Field’s group at MIT utilized intensity data to uncover a previously undetected transition state in the photolysis of CH2CHCN [46]. Figure 6 illustrates the microwave spectrum of HCN and HNC, the photolysis products of CH2CHCN. This spectrum highlights the rotational J = 1 → 0 transitions of both HCN and HNC across various vibrational states within the 86.5–93.0 GHz range, with vibrational quantum numbers assigned based on their corresponding transition frequencies. By analyzing the relative intensities of these J = 1 → 0 lines, the Vibrational-level Population Distributions (VPDs) of the photolysis products can be precisely determined. These VPDs are critical for understanding the transition state’s properties in the parent molecule during fragmentation, offering insights into molecular structures, relative fluxes through different transition state regions, and the post-transition dynamics that drive product formation.
In addition to studying dynamics through key transitions, ultrafast intramolecular dynamics, such as vibrational energy redistribution and isomerization [74], can be captured with sub-nanosecond resolution. Unlike ultrafast pump-probe spectroscopy, which primarily focuses on temporal dynamics, the CP-FTMW spectrometer uniquely provides simultaneous information on both quasi-static molecular structures and dynamics on sub-nanosecond timescales. This integrated approach is critical for identifying the majority of conformers and degrees of freedom involved in the dynamics, effectively bridging the gap between dynamic processes and structural information.
A milestone study demonstrated the capabilities of the CP-FTMW spectrometer by investigating the nuclear motion dynamics of CPCA ((3 α -carbomethoxy-4 β -(4-chlorophenyl)-N- methylpiperidine)) molecules, which exhibit two stable conformers, as shown in Figure 7a [75]. In this experiment, CPCA molecules are excited with an infrared laser to energy levels exceeding the threshold of their double-well potential, inducing rapid isomerization between the conformers. In these excited states, the moments of inertia evolve over time. To capture these time-dependent structural changes, multiple rotational transitions spaced several GHz apart are recorded simultaneously. This approach, known as dynamic rotational spectroscopy (DRS), effectively captures time-sensitive dynamics by integrating them into spectral measurements.
To identify the molecular conformers and understand their dynamic behavior, an infrared-microwave two-dimensional (2D) double-resonance spectrum is recorded, as shown in Figure 7b,c. Constructing this 2D spectrum requires collecting about 17,000 rotational spectra while scanning the infrared laser frequency from 2670 to 2850 cm−1. Performing this task with a traditional BF-FT spectrometer would have taken an estimated 27 years. However, the CP-FTMW spectrometer completes the entire dataset in just 52 h.
The ultrafast isomerization dynamics are analyzed using a rotational Bloch model to fit the intensity distribution. The rate of isomerization is extracted from the width of the double-peak fit, with broader peaks indicating faster processes, as illustrated in Figure 7d. The temporal resolution of these dynamics is determined by the Fourier transform limit, which depends on the CP’s bandwidth. In this case, the 10 GHz bandwidth enables the detection of dynamics occurring on sub-100-picosecond timescales.

2.5. Applications in Rydberg Spectroscopy

In addition to rotational spectroscopy, the CP-FTMW spectrometer has been demonstrated to acquire high-resolution spectra of Rydberg–Rydberg transitions. Rydberg states of atoms or molecules are a class of highly electronically excited states characterized by a loosely bound electron with an orbital radius significantly larger than the Bohr radius [76]. The energies of these states are described by the Rydberg formula: E = I P R y / ( n δ ) 2 , where I P represents the ionization potential, R y is the Rydberg constant, n is the principal quantum number, and δ is the quantum defect. For states where n > 30 , Rydberg–Rydberg transitions involving a change in n of one fall within the microwave or millimeter-wave range. Moreover, the wavefunctions associated with a Rydberg series exhibit distinct periodic structures that can be calculated using hydrogenic equations and follow n-dependent scaling rules. Due to the highly nonlinear scaling of many properties with n, Rydberg states have unique features, including transition dipole moments over three orders of magnitude larger than those of the ground state and significantly extended lifetimes.
The study of atomic Rydberg states using microwave radiation began over three decades ago [77]. Recently, interdisciplinary research at the intersection of physics and chemistry has increasingly focused on the control, manipulation, and high-precision spectroscopy of molecular Rydberg states [78,79,80,81]. Unlike their atomic counterparts, molecular Rydberg states feature a more complex ion core with additional degrees of freedom, including vibration, rotation, and a permanent electric dipole moment. These characteristics give rise to anisotropic and inelastic interactions between the Rydberg electron and the ion core, involving exchanges of energy and angular momentum [82,83]. Consequently, the Rydberg electron can act as a quantum sensor, utilizing its exceptional sensitivity to probe and reveal the structure of the ion core.
A major challenge in understanding the structure and dynamics of molecular Rydberg states lies in the highly congested spectroscopic data, even for diatomic molecules. For example, in the case of BaF, a typical dataset capturing transitions into v + = 0 and l 5 Rydberg states within an (n, n + 1) energy interval contains about 75 possible electronic-rotational transitions originating from a single initial level with known N ( N 4) and parity. This complexity arises from the electronic structure, particularly the different values of Λ (orbital angular momentum projection along the inter-nuclear axis) and spin-orbit couplings for each l series. Notably, the energy width of such an interval is only about 3 cm−1 for n = 40. The introduction of external electric or magnetic fields further complicates the spectrum by lifting the degeneracy of the m-levels, significantly increasing the number of observable transitions.
CP-FTMW spectroscopy provides a powerful experimental approach for capturing a series of Rydberg–Rydberg transitions, uncovering periodic structures across a broad spectral range with high resolution. By analyzing these periodic patterns in Rydberg series, key features of the molecular ion core can be accurately extracted by well-established scaling rules [84,85]. When the transition frequency within the ion core resonates with the Kepler frequency of the Rydberg electron, a resonantly enhanced exchange of energy or momentum occurs between the ion core and the Rydberg electron. This phenomenon, known as “Stroboscopic resonance”, arises at specific n values and plays a pivotal role in amplifying and isolating certain interactions within the ion core [86]. Strong interactions manifest as pronounced periodic patterns, while weaker interactions become detectable through the amplification provided by stroboscopic resonances.
Unlike rotational transitions, Rydberg–Rydberg transitions exhibit exceptionally large electric dipole moments, reaching values of several thousand Debyes. This characteristic enables even weak chirped pulses (1 mW, 1 μs, 10 GHz bandwidth) to generate strong FID signals, as demonstrated in Figure 8 [87]. Furthermore, in environments with high densities of Rydberg molecules, the FID signal can experience re-absorption, leading to phase correlations among molecules. Under such conditions, collective dynamics play a significant role in shaping the overall radiative behavior. A striking example of this collective dynamic is superradiance, a quantum many-body phenomenon where coherence among a closely packed ensemble of molecules results in enhanced radiative coupling [88,89,90]. These interactions provide a compelling platform for investigating quantum optical phenomena.

2.6. Outlook

The CP-FTMW spectrometer has revolutionized rotational spectroscopy and opened new avenues in Rydberg spectroscopy. Over the next decade, advancements in high-frequency circuits and opto-electronic hybrid technologies are expected to extend operational frequencies beyond one terahertz. In addition to generating linear frequency sweeps, the AWG in the CP-FTMW spectrometer can produce a microwave comb that not only covers a broad spectral range but also enhances detection sensitivity when coupled with a microwave resonant cavity. This approach is analogous to the cavity-enhanced optical frequency comb, which will be discussed in Section 3.2. Furthermore, the evolution of CP-FTMW technology will also benefit from the adoption of FPGA-based embedded hardware systems and AI-driven software, which promise to optimize performance and streamline data processing. Complementing these technological innovations, improvements in molecular sources and sample delivery methods are set to elevate the field of molecular spectroscopy. Developments in supersonic beam technology and cryogenic buffer gas cells, designed to achieve higher molecular densities and lower temperatures, will be instrumental in advancing research [87,91,92,93,94]. Together, these advancements will expand the applicability of spectroscopy to a broader range of molecular species, significantly enhancing its impact across diverse scientific disciplines.

3. OFC Spectroscopy

Vibrational spectroscopy, in contrast to rotational spectroscopy—which primarily focuses on determining overall molecular structures—examines the specific vibrations of atoms within molecules. Stronger bonds and lighter atoms typically vibrate at higher frequencies, making vibrational spectroscopy especially effective for accurately identifying chemical bonds. This capability is invaluable for analyzing large molecules by leveraging their distinctive vibrational frequencies. Vibrational spectroscopy has found widespread application across various academic and industrial fields [95,96,97], including (1) chemical identification and functional group characterization, particularly in large organic molecules; (2) the detection of specific gases and pollutants in environmental matrices, such as air, water, and soil; (3) compound identification, quality assurance, and quantitative analysis of active ingredients in pharmaceuticals; and (4) non-invasive disease diagnostics through the analysis of biological samples like blood or tissue, opening possibilities for early disease detection and monitoring.
Functional groups exhibit distinct absorption signatures at specific frequencies within the infrared (IR) spectrum, typically ranging from 1500 to 3000 cm−1 [98]. Traditional Fourier Transform Infrared (FTIR) spectrometers are widely utilized due to their broad spectroscopic range, spanning from 10 to 10,000 cm−1 [98]. Equipped with a long-arm scanning Michelson interferometer, these instruments can achieve exceptional resolutions of up to 0.001 cm−1, making them highly effective for detailed vibrational analysis. Despite its many advantages, FTIR spectroscopy faces a significant limitation in its lengthy acquisition time, driven by two key factors: (1) achieving high resolution requires the interferometer arm to scan distances exceeding a meter, and (2) the relatively low brightness of the thermal light source requires a long averaging time to achieve a satisfactory SNR. As a result, there is a growing demand for next-generation IR spectrometers capable of significantly reducing acquisition time. Furthermore, the demand for in situ and real-time sample analysis, particularly in environmental science, underscores the need for instruments that are both highly reliable and portable.
Over the past decade, optical frequency comb (OFC) spectroscopy has emerged as a powerful alternative to traditional FTIR spectrometers [99]. OFCs represent a unique class of light sources that combine ultrafast temporal resolution in the femtosecond range with exceptionally precise phase information, accurate to about 1 part in 1019 to 1020 over 1000 s [100,101]. Recognized with the Nobel Prize in Physics in 2005 for their transformative role in the development of the world’s most accurate atomic clocks, OFCs serve as highly precise optical frequency synthesizers, driving advancements across a wide range of scientific fields [102]. Furthermore, their extensive spectroscopic coverage, ultra-narrow linewidth, and exceptional frequency accuracy have transformed the field of molecular spectroscopy [103]. This paper focuses on the application of OFCs in molecular spectroscopy.

3.1. Fundamental Principles of OFC

The origins of OFCs can be traced back to the well-established field of ultrafast optics, particularly the development of mode-locked lasers (MLLs) [104,105,106,107]. This section provides a brief overview of the operational principles of MLLs and highlights a key distinction that sets OFCs apart: phase stability.
By placing a gain medium within a highly frequency-selective optical cavity, a laser can be configured to operate in a single frequency mode, where only one longitudinal mode is amplified, resulting in a narrow and stable output spectrum. In contrast, MLLs utilize a less stringent frequency selectivity, allowing gain media with broader emission spectra to support multiple frequency modes simultaneously, as shown in Figure 9a. The resulting output of an MLL is a coherent superposition of the electric fields from all the excited modes within the cavity:
E = E 0 q = ( N 1 ) / 2 + ( N 1 ) / 2 e i 2 π f 0 + q ( 2 π f r ) t + i ϕ q ,
where f 0 represents the central frequency of the MLL, f r is the free spectral range (FSR) of the laser cavity, q is an integer identifying each cavity mode, N denotes the total number of modes excited in the cavity, and ϕ q represents the initial phase associated with each mode. Equation (1) sums over all active lasing modes. The intensity (I) of the laser’s output is directly proportional to the square of the electric field, expressed as I | E | 2 . When the initial phases of the modes are independent, the laser output intensity exhibits random temporal fluctuations, as illustrated in the top panel of Figure 9b. If the initial phases of all lasing modes are identical, the phase component can be factored out of the summation in Equation (1):
E = E 0 e i 2 π f 0 t + i ϕ q = ( N 1 ) / 2 + ( N 1 ) / 2 e i q ( 2 π f r ) t = E 0 e i 2 π f 0 t + i ϕ sin N 2 π f r t / 2 sin 2 π f r t / 2 ,
I = I 0 sin N 2 π f r t / 2 sin 2 π f r t / 2 2 .
The bottom panel of Figure 9b illustrates the time-dependent intensity of the laser output, characterized by distinct, regularly spaced sharp peaks, as described by Equation (3). In the time domain, the interval between consecutive pulses is determined by the length of the laser cavity, corresponding to a separation of 2 L / c , where L is the cavity length, and c is the speed of light. Furthermore, the width of these pulses depends on the number of modes excited simultaneously; a larger number of active modes results in narrower laser pulses:
Δ t p 1 N f r .
In a standard Ti:Sapphire MLL with a ring cavity design, the cavity length (L) is approximately 1 m, and the optical bandwidth ( Δ λ ) is around 20 nm. This configuration enables the activation of roughly 670,000 lasing modes (N), resulting in the generation of laser pulses with durations as short as 100 femtoseconds. The generation of these ultrashort pulses relies on maintaining a coherent phase relationship among all lasing modes. Over the past four decades, various phase-locking techniques have been developed to achieve this. Two prominent approaches are (1) active mode-locking, which utilizes components such as an electro-optic modulator (EOM) [104,108], acousto-optical modulator (AOM) [109,110], or synchronous pumping [111] within the laser cavity, and (2) passive mode-locking, which employs a saturable absorber [112,113,114,115] or nonlinear medium, such as a Kerr lens [106,116,117,118].
Among these methods, passive mode-locking using a Kerr lens has become the most effective and widely adopted approach for generating stable, ultrashort laser pulses. Unlike a standard optical medium with a fixed refractive index, a Kerr medium exhibits a refractive index that varies with light intensity, described by n = n 0 + n 2 I , where I is the light intensity, n 0 is the intensity-independent refraction index, and n 2 represents the medium’s nonlinear response to intensity. Since the total optical energy within the laser cavity is conserved, the pulsed mode achieves significantly higher peak intensities by concentrating energy into shorter time intervals. This enhanced peak intensity causes the pulsed beam to bend more strongly when passing through the Kerr medium, as illustrated in the middle panel of Figure 9b. An optical aperture placed within the cavity selectively transmits the pulsed mode while attenuating the continuous-wave mode. This preferential transmission, combined with the stimulated emission cascade within the laser gain medium, enables the pulsed mode to dominate, effectively suppressing the continuous-wave mode.
Femtosecond pulses generated by MLLs are indispensable for probing ultrafast dynamics in the time domain. Furthermore, the precisely defined pulse-to-pulse interval has been a cornerstone of frequency metrology since the late 1980s [119]. Through Fourier transformation, a sequence of time-domain pulses is mapped into the frequency domain, resulting in a comb of discrete frequencies. The spacing between consecutive modes, f r , is determined by the laser cavity FSR, 2 L / c , and typically lies within the RF spectrum, ranging from 20 MHz to 20 GHz. By precisely measuring the optical frequency of a single lasing mode and calibrating f r against an RF standard, the frequencies of all other modes can be determined using the relationship f = f c + N ^ f r , where f c is the known frequency of a reference mode, and N ^ identifies the mode index relative to f c . This technique effectively extends the precision of a single frequency measurement to cover millions of other frequencies.
Accurately determining the absolute frequency hinges critically on f c . If the discrete frequencies extrapolated to the lowest end were precisely zero, the optical frequency could be directly synthesized as f = N ˜ f r , where N ˜ is referenced to zero frequency rather than f c . However, this ideal scenario is complicated by the presence of a carrier-envelope offset (ceo) offset—a phase mismatch between the oscillation of the carrier wave and the pulse envelope, as illustrated in the inset panel of Figure 10. In the time domain, this phase offset cannot be directly measured with an intensity detector. In the frequency domain, it manifests as a frequency shift affecting all modes, particularly pronounced near the origin of the frequency axis, as depicted in Figure 10. Precisely measuring or effectively eliminating f c e o is essential for establishing an absolute optical frequency, transforming the MLL into an OFC.
Figure 10 illustrates two widely used methods for determining f c e o . Both approaches start by broadening the OFC’s wavelength spectrum to span more than an octave, typically achieved using frequency mixing in a highly nonlinear optical fiber. After spectral broadening, two lasing modes are selected with frequencies nearly a factor of two apart, denoted by ν N ˜ = N ˜ f r + f c e o and ν 2 N ˜ = 2 N ˜ f r + f c e o . The first method employs second-harmonic generation (SHG) to double the frequency of the lower mode, ν N ˜ , producing ν d = 2 N ˜ f r + 2 f c e o . By interfering with ν d and ν 2 N ˜ and extracting the resulting RF beat frequency, f c e o can be determined as f c e o = ν d ν 2 N ˜ . This offset frequency is then stabilized using a negative feedback loop to the pump laser [120,121]. The second method, developed by TOPTICA Photonics, utilizes difference frequency generation (DFG) to directly combine light from ν N ˜ and ν 2 N ˜ , effectively canceling f c e o [122,123]. This process yields ν = ν 2 N ˜ ν N ˜ = N ˜ f r , which depends solely on f r . After DFG, the OFC light, now free of f c e o , is amplified to a usable power level.
While CE-DFCS leverages the millions of frequency elements provided by the OFC, it encounters the specific challenge of spectrally resolving individual comb teeth. Two prominent techniques for addressing this challenge are the Virtually Imaged Phase Array (VIPA) etalon and the Michelson interferometer. A VIPA etalon combined with a reflection grating is particularly effective for dispersing OFC light into a two-dimensional array, enabling single-shot capture by a camera [124,125]. However, extending this method to the mid- and far-IR spectral regions is limited by the diffraction constraints of optical components and the resolution of available cameras. The Michelson interferometer, a cornerstone of FTIR spectroscopy, provides broad spectral coverage in the infrared region and sufficient resolution to distinguish individual comb teeth. Despite its advantages, the mechanical scanning required by this approach is inherently slow and can undermine system stability, posing challenges for applications requiring high-speed data acquisition.
A promising alternative is the dual-comb configuration, which leverages the interference between OFC light and an additional phase-referenced OFC beam. This approach has the potential to surpass both the VIPA etalon and the Michelson interferometer in terms of efficiency and resolution, as will be further explored in Section 3.3.

3.2. Direct Frequency Comb Spectroscopy

As described above, the absolute frequencies of all comb teeth can be precisely determined using either an RF source or an optical frequency reference. When comb light interacts with a molecular sample, it facilitates the simultaneous acquisition of a broadband absorption spectrum encompassing the frequencies of all comb teeth. This technique, known as Direct Frequency Comb Spectroscopy (DFCS), has revolutionized molecular spectroscopy by leveraging massive parallelism. With millions of comb teeth probing the sample in parallel, DFCS achieves data acquisition speeds that are up to six orders of magnitude faster than those of traditional laser-scanning spectrometers [126,127].
Compared to FTIR spectrometers, which also utilize broadband light sources, DFCS delivers a substantial enhancement in spectroscopic resolution, often exceeding that of FTIR systems by several orders of magnitude. In FTIR spectrometry, the maximum resolution is determined by the translation distance of the interferometer arm, which defines the achievable optical path difference and, consequently, the ability to resolve fine spectral details. For a double-pass interferometer arm with a one-meter travel distance, the resolution is 150 MHz. In contrast, the resolution in DFCS depends on the stability of the OFC and the interrogation time. With an interrogation time of approximately 100 μs, the Fourier transform limit yields a resolution on the order of a few kilohertz—four to five orders of magnitude finer than that of an FTIR spectrometer [126].
Furthermore, the evenly spaced frequency intervals of the OFC light source enable resonant coupling with high-finesse optical cavities that exhibit a matching frequency structure. The enhanced cavity significantly extends the interaction time between the light and the sample. This approach, known as Cavity-Enhanced Direct Frequency Comb Spectroscopy (CE-DFCS) [124,125], can amplify the absorption signal by up to three orders of magnitude. Such an enhancement allows for the highly sensitive and precise detection of trace amounts of low-concentration toxic or indicator gases [128,129].
Since its inception, the CE-DFCS spectrometer has been a transformative tool in decoding the complexities of molecular structures, leveraging its broad spectral coverage, exceptional resolution, and remarkable sensitivity. One of its most notable achievements is its application in the high-resolution spectroscopy of large polyatomic molecules, such as adamantane (C10H16) and fullerene (C60) [130,131]. By integrating buffer gas cooling technology, which significantly reduces the number of molecular degrees of freedom, with the advanced capabilities of CE-DFCS to enhance parallelism, the rovibrational transitions of adamantane and C60 have been successfully recorded and meticulously characterized, as shown in Figure 11.
Another notable application of CE-DFCS is its use in recording the high-resolution spectra of molecular ions in a plasma tube, facilitated by velocity modulation. While neutral molecules can often be produced with high number densities in molecular beams, ion beams typically have much lower densities due to strong Coulomb repulsion. Generating ions within plasma provides a sufficiently dense sample for absorption detection. However, the presence of background noise, especially from neutral molecules, can obscure the signals of target ions. To overcome this limitation, velocity modulation combined with lock-in detection is employed, effectively isolating the Doppler-shifted signals of ions. Figure 12 illustrates the experimental setup and high-resolution spectroscopy of HfF+ [132], which has enabled the most precise measurement of the electron’s electric dipole moment (eEDM) to date, imposing stringent constraints on the Standard Model of particle physics [133,134].
Beyond its contributions to fundamental research, the extensive spectroscopic capabilities of CE-DFCS—enabling simultaneous analysis of multiple molecular species in a single experiment—have proven invaluable in fields such as environmental science, industrial process monitoring, and the life sciences. One notable application emerged in 2008 with the development of a CE-DFCS-based breathalyzer [135]. Human breath, which contains over 1000 distinct trace molecules serving as biomarkers for various health conditions, presents a highly complex sample matrix. The precise identification of these trace molecules using CE-DFCS is critical for accurate chemical and biological diagnostics, offering a non-invasive yet powerful tool for health monitoring and disease detection.
Over the past decade, the sensitivity of the CE-DFCS breathalyzer has improved by a factor of 1000, largely due to the transition from near-IR to mid-IR wavelengths, where breath molecules exhibit stronger rovibrational absorption features. This shift has significantly enhanced the instrument’s ability to detect and quantify molecular concentrations. Furthermore, advancements in data acquisition and analysis have become increasingly important, particularly for biological systems where simple models may not apply. Machine learning has emerged as a transformative tool in this domain, enabling the analysis of complex datasets from breath samples to create predictive models for disease diagnosis. By detecting subtle changes in molecular concentrations associated with specific health conditions, machine learning algorithms identify patterns and establish robust diagnostic criteria. A compelling demonstration of this approach was the detection of SARS-CoV-2 infection in a cohort of 170 volunteers, where the CE-DFCS breathalyzer achieved an impressive accuracy rate of 84.9%, as illustrated in Figure 13 [136]. This underscores the potential of integrating advanced spectroscopy with machine learning to revolutionize non-invasive diagnostics and disease monitoring.
In addition to capturing static information, the broad spectroscopic coverage of CE-DFCS, combined with its rapid data acquisition and ability to perform extended coherent averaging, enables the study of chemical reaction kinetics on microsecond timescales [137,138,139]. This capability is particularly advantageous for tracking the evolution of multiple transient intermediate compounds within a reaction sequence. A notable application of this technique is its time-resolved implementation to investigate the pressure-dependent kinetics of the OH + CO → HOCO → H + CO2 reaction [140], a critical pathway in the atmospheric degradation of OH radicals. These studies highlight CE-DFCS’s ability to provide detailed insights into dynamic chemical processes with precision and speed.

3.3. Dual-Comb Spectroscopy

While OFC light sources have been successfully extended into the mid- and far-infrared regions, implementing CE-DFCS in these spectral ranges remains challenging, primarily due to the limitations of existing detection techniques. The VIPA etalon method is constrained by significant diffraction at long wavelengths and its reliance on high-performance infrared imaging detectors, whereas the Michelson interferometer is hindered by slow scanning rates and stability issues. To overcome these obstacles, researchers have developed an innovative technique: employing a second OFC beam that is phase-coherent with the original to decode spectral information through precise interference measurements. This method, known as dual-comb spectroscopy (DCS), offers a highly efficient and promising solution for extracting and analyzing spectral data in the challenging mid- and far-infrared regions [99,141,142,143].
DCS utilizes the first OFC beam to interact with the sample and a second, phase-coherent OFC beam to down-convert optical frequencies—too high for direct digitization—into RF frequencies, as depicted in Figure 14. Only the first OFC, operating at a repetition rate f r , is coupled to an enhancement cavity, where it directly interacts with the sample. The second OFC, with a slightly offset repetition rate of f r + Δ f r , is combined and interferes with the first OFC beam after its interaction with the sample. The resulting heterodyne RF signals are captured by a single photodetector, generating an RF comb with a spacing of Δ f r that can be directly digitized. Typically, f r ranges from tens of MHz to tens of GHz, and Δ f r falls within 100 Hz to tens of kHz. By applying a Fourier transform to the heterodyne RF signals, the sample’s absorption or emission spectrum can be reconstructed with exceptional spectroscopic resolution and precision.
DCS retains the advantages of DFCS while significantly streamlining detection processes and broadening its spectroscopic capabilities. Like FTIR spectroscopy, DCS utilizes a single-point detector, eliminating the need for a high-resolution infrared camera. Moreover, unlike FTIR, DCS bypasses the mechanically moving Michelson interferometer, enabling much faster data acquisition and enhanced system stability. DCS also offers a high SNR and a consistent baseline, achieved through extended coherent averaging, time-multiplexed signal and reference measurements, and sequential acquisition of subbands to mitigate detector nonlinearity. Additionally, incorporating a high-finesse optical cavity into the path of the first comb beam to enhance detection sensitivity aligns closely with the CE-DFCS approach.
Over the past decade, DCS has emerged as a transformative tool, particularly in environmental science and atmospheric chemistry. One of its most groundbreaking advancements is real-time, high-resolution atmospheric gas analysis, enabling precise and rapid monitoring of pollutants and greenhouse gases [129,144,145,146]. A remarkable example is shown in Figure 15, where DCS was deployed over a 113 km horizontal open-air path. Using two synchronized OFCs, DCS provided direct measurements of spectral features without the need for moving parts or scanning lasers. This innovative setup, incorporating a bistatic configuration and advanced time–frequency dissemination, facilitated broadband, high-speed measurements of greenhouse gases such as CO2 over a long distance. The experiment achieved a CO2 sensing precision of less than 2 parts per million (ppm) within 5 min, further improving to below 0.6 ppm over 36 min—an unprecedented level of accuracy for long-distance, open-air measurements. Moreover, this advancement paves the way for deploying DCS in satellite-based systems, offering the potential for real-time, global environmental monitoring.
To advance DCS for field applications and potential satellite-based deployments, the development of compact optical devices is essential to enhance portability and reliability. Recent breakthroughs in photonic technologies have led to the creation of on-chip DCSs [147,148,149,150]. The on-chip DCSs leverage microresonators to generate two stable OFCs, enabling high-precision, broadband spectroscopic measurements in a compact form factor. Microresonators, typically designed as ring or disk structures, are fabricated from high-quality materials like silicon nitride or silicon dioxide, which facilitate low-loss light propagation. When a continuous-wave (CW) laser is coupled to these microresonators, nonlinear optical processes such as four-wave mixing produce a series of equally spaced comb lines, forming an OFC. The spacing between these comb lines, known as the FSR, is determined by the geometry of the microresonator. The compact, power-efficient architecture significantly reduces the size and complexity of DCS systems, making them well suited for portable and field-deployable devices.
In addition to the MLL-based OFC generation discussed in Section 3.1, a novel approach utilizing EOMs has emerged and developed rapidly in recent years [139,151,152,153]. In this configuration, a CW laser is passed through one or more EOMs, which impose periodic phase modulation on the light. When the modulation amplitude is sufficiently large, multiple rounds of sideband generation occur, significantly extending the spectral coverage of the OFC. By precisely controlling the modulation frequency and amplitude with advanced, high-speed digital devices, such as Arbitrary Waveform Generators (AWGs), a series of equally spaced spectral lines can be generated, forming a highly tunable and stable OFC. Figure 16 illustrates the use of an EOM-based OFC to perform nanosecond time-resolved absorption spectroscopy on a supersonic jet.
One of the primary advantages of the EOM-based OFC is its simplicity and compactness. Unlike MLLs, which require complex cavity designs, EOM-based OFCs can be seamlessly integrated with a single CW laser and are highly amenable to miniaturization, making them ideal for portable applications. The digital electronics driving the EOMs are compact and robust, resulting in a system that is inherently more stable and less susceptible to environmental disturbances, such as temperature fluctuations, which can affect traditional OFC sources. Moreover, the comb line spacing in an EOM-based system is governed by the electronic modulation frequency, which can be precisely controlled and easily adjusted. This flexibility allows for the fine-tuning of the comb spacing to meet the resolution and bandwidth requirements of specific spectroscopic applications. Another notable advantage of EOM-based OFCs is their low power consumption. While MLLs typically require significant power to maintain stable comb operation, EOM-based systems achieve comb generation with substantially lower power demands. This efficiency makes EOM-based DCS particularly well suited for remote sensing and field-deployable applications, where power resources are often limited.

3.4. Outlook

Over the next decade, DCS is anticipated to increasingly supplant DFCS, particularly in the mid-IR and far-IR spectral regions. However, transitioning to high-repetition, high-precision DCS poses significant technical challenges. These challenges arise from the need to generate two highly correlated OFCs, where even femtosecond-scale temporal discrepancies or phase variations can distort interference patterns and introduce anomalies that are difficult to correct during post-processing [154,155]. While this level of precision has been largely achieved in the near-IR spectrum, extending such accuracy to the mid-IR and far-IR regions remains a key focus of ongoing research [156].
In parallel, extending the operational wavelength into the ultraviolet (UV) and extreme UV (XUV) regimes has already unlocked new applications, leveraging the high peak power of short pulses. This advancement has facilitated studies of rare isotope atomic ions, highly charged ions, and even nuclear transitions, with further breakthroughs anticipated in these domains [127,157,158,159].
Simultaneously, the integration of advanced digital technologies, such as embedded systems and FPGAs, into both DFCS and DCS systems holds great potential for enhancing efficiency and performance. Embedded systems can streamline control sequences, minimize downtime, and improve the experimental duty cycle [160]. Meanwhile, FPGAs, with their capabilities for high-speed data processing and reconfigurability, can manage the substantial data throughput inherent in these techniques. This enables real-time data acquisition and processing, improved coherence averaging efficiency, faster data acquisition rates, and enhanced temporal resolution—critical for investigating transient phenomena.

4. Conclusions

The development of innovative spectroscopic technologies, such as CP-FTMW and OFC spectroscopy, has revolutionized the field of molecular spectroscopy by dramatically improving precision, sensitivity, and efficiency. These advancements, driven by rapid progress in fast digital electronics and parallel processing, have broadened the horizons of molecular spectroscopy, enabling transformative applications across a wide range of scientific domains, including nuclear physics, environmental science, and astrophysics. As these technologies continue to advance, particularly with the integration of embedded systems and FPGAs, their capabilities are expected to reach unprecedented levels.
Looking forward, the transition to advanced techniques such as CE-DCS is anticipated to overcome existing challenges in mid-IR and far-IR spectroscopy, opening new frontiers for molecular analysis. The integration of cutting-edge digital technologies and the development of novel experimental designs will be critical to pushing the boundaries of these methodologies. These advancements promise to make complex, high-resolution spectroscopic measurements more accessible, versatile, and efficient, unlocking new possibilities for both discovery and practical applications. Such efforts will not only deepen our understanding of molecular dynamics and structures but also drive groundbreaking discoveries across a broad spectrum of scientific disciplines.

Author Contributions

Conceptualization, Y.Z. and J.P.; writing—original draft preparation, J.L. and R.F.; writing—review and editing, B.G. All authors have read and agreed to the published version of the manuscript.

Funding

This work is financially supported by the NSF RII Track-4 (Grant No. 2327247), HDRFS Nevada grant (70524459), NASA Space Grant Consortium (70524408), and UNLV TTDGRA program.

Acknowledgments

Y. Zhou thanks the host of the Ion Storage Group, NIST, Boulder.

Conflicts of Interest

The authors declare no conflicts of interest.

References

  1. Quack, M.; Merkt, F. Handbook of High-Resolution Spectroscopy; Wiley: Hoboken, NJ, USA, 2011. [Google Scholar] [CrossRef]
  2. Riyadh, S.M.S.; Telfah, H.; Jones, I.W.; Bersson, J.S.; Cheng, C.F.; Hu, S.M.; Foote, D.B.; Liu, J. Mid-infrared Doppler-free saturation absorption spectroscopy of the Q branch of CH4ν3=1 band using a rapid-scanning continuous-wave optical parametric oscillator. Opt. Lett. 2024, 49, 4230–4233. [Google Scholar] [CrossRef] [PubMed]
  3. Liu, Q.H.; Tan, Y.; Cheng, C.F.; Hu, S.M. Precision spectroscopy of molecular hydrogen. Phys. Chem. Chem. Phys. 2023, 25, 27914–27925. [Google Scholar] [CrossRef] [PubMed]
  4. Wieman, C.; Hansch, T.W. Doppler-free laser polarization spectroscopy. Phys. Rev. Lett. 1976, 36, 1170–1173. [Google Scholar] [CrossRef]
  5. Zalicki, P.; Zare, R.N. Cavity ring-down spectroscopy for quantitative absorption measurements. J. Chem. Phys. 1995, 102, 2708–2717. [Google Scholar] [CrossRef]
  6. Berden, G.; Peeters, R.; Meijer, G. Cavity ring-down spectroscopy: Experimental schemes and applications. Int. Rev. Phys. Chem. 2000, 19, 565–607. [Google Scholar] [CrossRef]
  7. Scherer, J.J.; Paul, J.B.; O’keefe, A.; Saykally, R.J. Cavity ringdown laser absorption spectroscopy: History, development, and application to pulsed molecular beams. Chem. Rev. 1997, 97, 25–52. [Google Scholar] [CrossRef]
  8. Fiedler, S.E.; Hese, A.; Ruth, A.A. Incoherent broad-band cavity-enhanced absorption spectroscopy. Chem. Phys. Lett. 2003, 371, 284–294. [Google Scholar] [CrossRef]
  9. Engeln, R.; Berden, G.; Peeters, R.; Meijer, G. Cavity enhanced absorption and cavity enhanced magnetic rotation spectroscopy. Rev. Sci. Instrum. 1998, 69, 3763–3769. [Google Scholar] [CrossRef]
  10. Schindewolf, A.; Bause, R.; Chen, X.Y.; Duda, M.; Karman, T.; Bloch, I.; Luo, X.Y. Evaporation of microwave-shielded polar molecules to quantum degeneracy. Nature 2022, 607, 677–681. [Google Scholar] [CrossRef]
  11. Bigagli, N.; Yuan, W.; Zhang, S.; Bulatovic, B.; Karman, T.; Stevenson, I.; Will, S. Observation of Bose–Einstein condensation of dipolar molecules. Nature 2024, 631, 289–293. [Google Scholar] [CrossRef]
  12. Vilas, N.B.; Hallas, C.; Anderegg, L.; Robichaud, P.; Winnicki, A.; Mitra, D.; Doyle, J.M. Magneto-optical trapping and sub-Doppler cooling of a polyatomic molecule. Nature 2022, 606, 70–74. [Google Scholar] [CrossRef] [PubMed]
  13. Jin, D.S.; Ye, J. Introduction to ultracold molecules: New frontiers in quantum and chemical physics. Chem. Rev. 2012, 112, 4801–4802. [Google Scholar] [CrossRef] [PubMed]
  14. Tobias, W.G.; Matsuda, K.; Li, J.R.; Miller, C.; Carroll, A.N.; Bilitewski, T.; Rey, A.M.; Ye, J. Reactions between layer-resolved molecules mediated by dipolar spin exchange. Science 2022, 375, 1299–1303. [Google Scholar] [CrossRef] [PubMed]
  15. Xia, J.; Enemali, G.; Zhang, R.; Fu, Y.; McCann, H.; Zhou, B.; Liu, C. FPGA-accelerated distributed sensing system for real-time industrial laser absorption spectroscopy tomography at kilo-hertz. IEEE Trans. Ind. Inform. 2024, 20, 2529–2539. [Google Scholar] [CrossRef]
  16. Davies, V.; Wandy, J.; Weidt, S.; Hooft, J.J.V.D.; Miller, A.; Daly, R.; Rogers, S. Rapid development of improved data-dependent acquisition strategies. Anal. Chem. 2021, 93, 5676–5683. [Google Scholar] [CrossRef]
  17. Manu, V.S.; Olivieri, C.; Veglia, G. AI-designed NMR spectroscopy RF pulses for fast acquisition at high and ultra-high magnetic fields. Nat. Commun. 2023, 14, 4144. [Google Scholar] [CrossRef]
  18. Angulo, A.; Yang, L.; Aydil, E.S.; Modestino, M.A. Machine learning enhanced spectroscopic analysis: Towards autonomous chemical mixture characterization for rapid process optimization†. Digit. Discov. 2022, 1, 35–44. [Google Scholar] [CrossRef]
  19. Crocombe, R.A. Portable spectroscopy. Appl. Spectrosc. 2018, 72, 1701–1751. [Google Scholar] [CrossRef]
  20. Yu, H.; Tan, Y.; Cunningham, B.T. Smartphone fluorescence spectroscopy. Anal. Chem. 2014, 86, 8805–8813. [Google Scholar] [CrossRef]
  21. Townes, C.; Schawlow, A. Microwave Spectroscopy; Dover books on physics; Dover Publications: Mineola, NY, USA, 2013. [Google Scholar]
  22. Schwarting, M.; Seifert, N.A.; Davis, M.J.; Blaiszik, B.; Foster, I.; Prozument, K. Twins in rotational spectroscopy: Does a rotational spectrum uniquely identify a molecule? arXiv 2024, arXiv:2404.04225. [Google Scholar] [CrossRef]
  23. Patterson, D.; Schnell, M.; Doyle, J.M. Enantiomer-specific detection of chiral molecules via microwave spectroscopy. Nature 2013, 497, 475–477. [Google Scholar] [CrossRef] [PubMed]
  24. Crabtree, K.N.; Martin-Drumel, M.A.; Brown, G.G.; Gaster, S.A.; Hall, T.M.; McCarthy, M.C. Microwave spectral taxonomy: A semi-automated combination of chirped-pulse and cavity Fourier-transform microwave spectroscopy. J. Chem. Phys. 2016, 144, 124201. [Google Scholar] [CrossRef] [PubMed]
  25. Balle, T.J.; Flygare, W.H. Fabry-Perot cavity pulsed Fourier transform microwave spectrometer with a pulsed nozzle particle source. Rev. Sci. Instrum. 1981, 52, 33–45. [Google Scholar] [CrossRef]
  26. Johnson, H.R. Backward-Wave Oscillators. Proc. IRE 1955, 43, 684–697. [Google Scholar] [CrossRef]
  27. Goebel, D.M.; Butler, J.M.; Schumacher, R.W.; Santoru, J.; Eisenhart, R.L. High-power microwave source based on an unmagnetized backward-wave oscillator. IEEE Trans. Plasma Sci. 1994, 22, 547–553. [Google Scholar] [CrossRef]
  28. Chen, C.; Liu, G.; Huang, W.; Song, Z.; Fan, J.; Wang, H. A repetitive X-band relativistic backward-wave oscillator. IEEE Trans. Plasma Sci. 2002, 30, 1108–1111. [Google Scholar] [CrossRef]
  29. Nusinovich, G.S.; Member, S.; Carmel, Y.; Antonsen, T.M.; Goebel, D.M.; Santoru, J. Recent progress in the development of plasma-filled traveling-wave tubes and backward-wave oscillators. IEEE Trans. Plasma Sci. 1998, 26, 151. [Google Scholar] [CrossRef]
  30. Hummelt, J.S.; Lewis, S.M.; Shapiro, M.A.; Temkin, R.J. Design of a metamaterial-based backward-wave oscillator. IEEE Trans. Plasma Sci. 2014, 42, 930–936. [Google Scholar] [CrossRef]
  31. Khodos, V.V.; Ryndyk, D.A.; Vaks, V.L. Fast-passage microwave molecular spectroscopy with frequency sweeping. Eur. Phys. J. Appl. Phys. 2004, 25, 203–208. [Google Scholar] [CrossRef]
  32. Brown, G.G.; Dian, B.C.; Douglass, K.O.; Geyer, S.M.; Pate, B.H. The rotational spectrum of epifluorohydrin measured by chirped-pulse Fourier transform microwave spectroscopy. J. Mol. Spectrosc. 2006, 238, 200–212. [Google Scholar] [CrossRef]
  33. Brown, G.G.; Dian, B.C.; Douglass, K.O.; Geyer, S.M.; Shipman, S.T.; Pate, B.H. A broadband Fourier transform microwave spectrometer based on chirped pulse excitation. Rev. Sci. Instrum. 2008, 79, 053103. [Google Scholar] [CrossRef] [PubMed]
  34. Park, G.B.; Field, R.W. Perspective: The first ten years of broadband chirped pulse Fourier transform microwave spectroscopy. J. Chem. Phys. 2016, 144, 200901. [Google Scholar] [CrossRef] [PubMed]
  35. McGurk, J.C.; Schmalz, T.G.; Flygare, W.H. Fast passage in rotational spectroscopy: Theory and experiment. J. Chem. Phys. 1974, 60, 4181–4188. [Google Scholar] [CrossRef]
  36. Anderegg, L.; Burchesky, S.; Bao, Y.; Yu, S.S.; Karman, T.; Chae, E.; Ni, K.K.; Ketterle, W.; Doyle, J.M. Observation of microwave shielding of ultracold molecules. Science 2021, 373, 779–782. [Google Scholar] [CrossRef] [PubMed]
  37. Wright, S.C.; Wall, T.E.; Tarbutt, M.R. Microwave trap for atoms and molecules. Phys. Rev. Res. 2019, 1, 033035. [Google Scholar] [CrossRef]
  38. Park, G.B.; Steeves, A.H.; Kuyanov-Prozument, K.; Neill, J.L.; Field, R.W. Design and evaluation of a pulsed-jet chirped-pulse millimeter-wave spectrometer for the 70–102 GHz region. J. Chem. Phys. 2011, 135, 024202. [Google Scholar] [CrossRef]
  39. Lauzin, C.; Schmutz, H.; Agner, J.A.; Merkt, F. Chirped-pulse millimetre-wave spectrometer for the 140–180 GHz region. Mol. Phys. 2018, 116, 3656–3665. [Google Scholar] [CrossRef]
  40. Gerecht, E.; Douglass, K.O.; Plusquellic, D.F. Chirped-pulse terahertz spectroscopy for broadband trace gas sensing. Opt. Express 2011, 19, 8973–8984. [Google Scholar] [CrossRef]
  41. Steber, A.L.; Harris, B.J.; Neill, J.L.; Pate, B.H. An arbitrary waveform generator based chirped pulse Fourier transform spectrometer operating from 260 to 295 GHz. J. Mol. Spectrosc. 2012, 280, 3–10. [Google Scholar] [CrossRef]
  42. Stroud, J.R.; Plusquellic, D.F. Difference-frequency chirped-pulse dual-comb generation in the THz region: Temporal magnification of the quantum dynamics of water vapor lines by >60,000. J. Chem. Phys. 2022, 156, 044302. [Google Scholar] [CrossRef]
  43. Neill, J.L.; Harris, B.J.; Steber, A.L.; Douglass, K.O.; Plusquellic, D.F.; Pate, B.H. Segmented chirped-pulse Fourier transform submillimeter spectroscopy for broadband gas analysis. Opt. Express 2013, 21, 19743–19749. [Google Scholar] [CrossRef] [PubMed]
  44. Barnum, T.J.; Lee, K.L.K.; McGuire, B.A. Chirped-Pulse Fourier transform millimeter-wave spectroscopy of Furan, isotopologues, and vibrational excited states. ACS Earth Space Chem. 2021, 5, 2986–2994. [Google Scholar] [CrossRef]
  45. Sironneau, V.; Chelin, P.; Tchana, F.K.; Kleiner, I.; Pirali, O.; Roy, P.; Guillemin, J.C.; Orphal, J.; Marguls, L.; Motiyenko, R.A.; et al. Reinvestigation of the microwave and new high resolution far-infrared spectra of cis-methyl nitrite, CH3ONO: Rotational study of the two first torsional states. J. Mol. Spectrosc. 2011, 267, 92–99. [Google Scholar] [CrossRef]
  46. Prozument, K.; Baraban, J.H.; Changala, P.B.; Park, G.B.; Shaver, R.G.; Muenter, J.S.; Klippenstein, S.J.; Chernyak, V.Y.; Field, R.W. Photodissociation transition states characterized by chirped pulse millimeter wave spectroscopy. Proc. Natl. Acad. Sci. USA 2020, 117, 146–151. [Google Scholar] [CrossRef] [PubMed]
  47. Fritz, S.M.; Mishra, P.; Wullenkord, J.; Fugazzi, P.G.; Kohse-Höinghaus, K.; Zwier, T.S.; Hansen, N. Detecting combustion intermediates via broadband chirped-pulse microwave spectroscopy. Proc. Combust. Inst. 2021, 38, 1761–1769. [Google Scholar] [CrossRef]
  48. Zou, L.; Motiyenko, R.A.; Margulès, L.; Alekseev, E.A. Millimeter-wave emission spectrometer based on direct digital synthesis. Rev. Sci. Instrum. 2020, 91, 063104. [Google Scholar] [CrossRef]
  49. Li, J.; Ojeda, J.M.; Letourneau, S.; Zhou, Y. Cost-effective segmented CP-FTMW spectrometers. Department of Physics and Astronomy, University of Nevada, Las Vegas, NV 89154, USA, 2024. In preparation.
  50. Fatima, M.; Pérez, C.; Arenas, B.E.; Schnell, M.; Steber, A.L. Benchmarking a new segmented K-band chirped-pulse microwave spectrometer and its application to the conformationally rich amino alcohol isoleucinol. Phys. Chem. Chem. Phys. 2020, 22, 17042–17051. [Google Scholar] [CrossRef]
  51. McCarthy, M.C.; Zou, L.; Martin-Drumel, M.A. To kink or not: A search for long-chain cumulenones using microwave spectral taxonomy. J. Chem. Phys. 2017, 146, 154301. [Google Scholar] [CrossRef]
  52. McGuire, B.A.; Martin-Drumel, M.A.; Lee, K.L.K.; Stanton, J.F.; Gottlieb, C.A.; McCarthy, M.C. Vibrational satellites of C2S, C3S, and C4S: Microwave spectral taxonomy as a stepping stone to the millimeter-wave band. Phys. Chem. Chem. Phys. 2018, 20, 13870–13889. [Google Scholar] [CrossRef]
  53. York, L.; Sorrells, C.; Dim, C.A.; Crabtree, K.N.; Hernandez-Castillo, A.O. A Tale of Two Tails: Rotational Spectroscopy of N-Ethyl Maleimide and N-Ethyl Succinimide. J. Phys. Chem. A 2024, 128, 5541–5547. [Google Scholar] [CrossRef]
  54. Salvitti, G.; Sigismondi, S.; Melandri, S.; López, J.C.; Blanco, S.; Maris, A. Structure and dynamics of 3’-aminoacetophenone and 4’-aminoacetophenone from rotational spectroscopy. Phys. Chem. Chem. Phys. 2024, 26, 1881–1890. [Google Scholar] [CrossRef] [PubMed]
  55. Landau, A.; Eduardus; Behar, D.; Wallach, E.R.; Pašteka, L.F.; Faraji, S.; Borschevsky, A.; Shagam, Y. Chiral molecule candidates for trapped ion spectroscopy by ab initio calculations: From state preparation to parity violation. J. Chem. Phys. 2023, 159, 114307. [Google Scholar] [CrossRef] [PubMed]
  56. Fiechter, M.R.; Haase, P.A.; Saleh, N.; Soulard, P.; Tremblay, B.; Havenith, R.W.; Timmermans, R.G.; Schwerdtfeger, P.; Crassous, J.; Darquié, B.; et al. Toward detection of the molecular parity violation in Chiral Ru(acac)3 and Os(acac)3. J. Phys. Chem. Lett. 2022, 13, 10011–10017. [Google Scholar] [CrossRef] [PubMed]
  57. Quack, M. On the measurement of the parity violating energy difference between enantiomers. Chem. Phys. Lett. 1986, 132, 147–153. [Google Scholar] [CrossRef]
  58. Quack, M.; Seyfang, G.; Wichmann, G. Perspectives on parity violation in chiral molecules: Theory, spectroscopic experiment and biomolecular homochirality. Chem. Sci. 2022, 13, 10598–10643. [Google Scholar] [CrossRef]
  59. Berry, M.V.; Dennis, M.R. The optical singularities of birefringent dichroic chiral crystals. Proc. R. Soc. London. Ser. A Math. Phys. Eng. Sci. 2003, 459, 1261–1292. [Google Scholar] [CrossRef]
  60. Hodgkinson, I.; Wu, Q.h. Inorganic Chiral Optical Materials. Adv. Mater. 2001, 13, 889–897. [Google Scholar] [CrossRef]
  61. Govorov, A.O.; Fan, Z.; Hernandez, P.; Slocik, J.M.; Naik, R.R. Theory of Circular Dichroism of Nanomaterials Comprising Chiral Molecules and Nanocrystals: Plasmon Enhancement, Dipole Interactions, and Dielectric Effects. Nano Lett. 2010, 10, 1374–1382. [Google Scholar] [CrossRef]
  62. Freedman, T.B.; Cao, X.; Dukor, R.K.; Nafie, L.A. Absolute configuration determination of chiral molecules in the solution state using vibrational circular dichroism. Chirality 2003, 15, 743–758. [Google Scholar] [CrossRef]
  63. Barron, L.D.; Lutz Hecht, I.H.M.; Blanch, E.W. Raman optical activity comes of age. Mol. Phys. 2004, 102, 731–744. [Google Scholar] [CrossRef]
  64. He, Y.; Bo, W.; Dukor, R.K.; Nafie, L.A. Determination of absolute configuration of chiral molecules using vibrational optical activity: A review. Appl. Spectrosc. 2011, 65, 699–723. [Google Scholar] [CrossRef] [PubMed]
  65. Patterson, D.; Doyle, J.M. Sensitive chiral analysis via microwave three-wave mixing. Phys. Rev. Lett. 2013, 111, 023008. [Google Scholar] [CrossRef] [PubMed]
  66. Lee, J.H.; Bischoff, J.; Hernandez-Castillo, A.O.; Abdiha, E.; Sartakov, B.G.; Meijer, G.; Eibenberger-Arias, S. The influence of microwave pulse conditions on enantiomer-specific state transfer. New J. Phys. 2024, 26, 033015. [Google Scholar] [CrossRef]
  67. Lee, J.; Abdiha, E.; Sartakov, B.G.; Meijier, G.; Eibenberger-Arias, S. Near-complete chiral selection in rotational quantum states. Nat. Commun. 2024, 15, 7441. [Google Scholar] [CrossRef] [PubMed]
  68. Singh, H.; Berggötz, F.E.; Sun, W.; Schnell, M. Chiral control of gas-phase molecules using microwave pulses. Angew. Chem. Int. Ed. 2023, 62, e202219045. [Google Scholar] [CrossRef]
  69. Sun, W.; Schnell, M. Microwave three-wave mixing spectroscopy of chiral molecules in weakly bound complexes. J. Phys. Chem. Lett. 2023, 14, 7389–7394. [Google Scholar] [CrossRef]
  70. Domingos, S.R.; Pérez, C.; Schnell, M. Sensing Chirality with Rotational Spectroscopy. Annu. Rev. Phys. Chem. 2018, 69, 499–519. [Google Scholar] [CrossRef]
  71. Prozument, K.; Shaver, R.G.; Ciuba, M.; Muenter, J.S.; Park, G.B.; Stanton, J.F.; Guo, H.; Wong, B.M.; Perry, D.S.; Field, R.W. A new approach toward transition state spectroscopy. Faraday Discuss. 2013, 163, 33–57. [Google Scholar] [CrossRef]
  72. Prozument, K.; Park, G.B.; Shaver, R.G.; Vasiliou, A.K.; Oldham, J.M.; David, D.E.; Muenter, J.S.; Stanton, J.F.; Suits, A.G.; Ellison, G.B.; et al. Chirped-pulse millimeter-wave spectroscopy for dynamics and kinetics studies of pyrolysis reactions. Phys. Chem. Chem. Phys. 2014, 16, 15739–15751. [Google Scholar] [CrossRef]
  73. Zaleski, D.P.; Harding, L.B.; Klippenstein, S.J.; Ruscic, B.; Prozument, K. Time-resolved kinetic chirped-pulse rotational spectroscopy in a room-temperature flow reactor. J. Phys. Chem. Lett. 2017, 8, 6180–6188. [Google Scholar] [CrossRef]
  74. Schnell, M. Broadband rotational spectroscopy for molecular structure and dynamics studies. Z. Fur Phys. Chem. 2013, 227, 1–21. [Google Scholar] [CrossRef]
  75. Dian, B.C.; Brown, G.G.; Douglass, K.O.; Pate, B.H. Measuring picosecond isomerization kinetics via broadband microwave spectroscopy. Science 2008, 320, 924–928. [Google Scholar] [CrossRef] [PubMed]
  76. Gallagher, T.F. Rydberg atoms. Rep. Prog. Phys. 1988, 51, 143. [Google Scholar] [CrossRef]
  77. Gentile, T.; Hughey, B.; Kleppner, D.; Ducas, T. Microwave spectroscopy of calcium Rydberg states. Phys. Rev. A 1990, 42, 440. [Google Scholar] [CrossRef]
  78. Merkt, F. Molecules in high Rydberg states. Annu. Rev. Phys. Chem. 1997, 48, 675–709. [Google Scholar] [CrossRef]
  79. Hogan, S.; Seiler, C.; Merkt, F. Rydberg-state-enabled deceleration and trapping of cold molecules. Phys. Rev. Lett. 2009, 103, 123001. [Google Scholar] [CrossRef]
  80. Seiler, C.; Hogan, S.D.; Merkt, F. Dynamical processes in Rydberg-Stark deceleration and trapping of atoms and molecules. Chimia 2012, 66, 208. [Google Scholar] [CrossRef]
  81. Hogan, S.D. Rydberg-Stark deceleration of atoms and molecules. EPJ Tech. Instrum. 2016, 3, 2. [Google Scholar] [CrossRef]
  82. Jakubek, Z.J.; Field, R.W. Core-penetrating Rydberg series of BaF: spdf supercomplexes. Phys. Rev. Lett. 1994, 72, 2167. [Google Scholar] [CrossRef]
  83. Kay, J.J.; Coy, S.L.; Petrović, V.S.; Wong, B.M.; Field, R.W. Separation of long-range and short-range interactions in Rydberg states of diatomic molecules. J. Chem. Phys. 2008, 128, 194301. [Google Scholar] [CrossRef]
  84. Altunata, S.N.; Coy, S.L.; Field, R.W. Properties of nearly one-electron molecules. II. Application to the Rydberg spectrum of CaF. J. Chem. Phys. 2005, 123, 084319. [Google Scholar] [CrossRef] [PubMed]
  85. Coy, S.L.; Grimes, D.D.; Zhou, Y.; Field, R.W.; Wong, B.M. Electric potential invariants and ions-in-molecules effective potentials for molecular Rydberg states. J. Chem. Phys. 2016, 145, 234301. [Google Scholar] [CrossRef] [PubMed]
  86. Kay, J.J.; Altunata, S.N.; Coy, S.L.; Field, R.W. Resonance between electronic and rotational motions in Rydberg states of CaF. Mol. Phys. 2007, 105, 1661–1673. [Google Scholar] [CrossRef]
  87. Zhou, Y.; Grimes, D.D.; Barnum, T.J.; Patterson, D.; Coy, S.L.; Klein, E.; Muenter, J.S.; Field, R.W. Direct detection of Rydberg-Rydberg millimeter-wave transitions in a buffer gas cooled molecular beam. Chem. Phys. Lett. 2015, 640, 124–136. [Google Scholar] [CrossRef]
  88. Wang, T.; Yelin, S.F.; Côté, R.; Eyler, E.E.; Farooqi, S.M.; Gould, P.L.; Koštrun, M.; Tong, D.; Vrinceanu, D. Superradiance in ultracold Rydberg gases. Phys. Rev. A 2007, 75, 033802. [Google Scholar] [CrossRef]
  89. Zhou, Y. Cooperative effects in a dense Rydberg gas. Mol. Phys. 2012, 110, 1909–1915. [Google Scholar] [CrossRef]
  90. Grimes, D.D.; Coy, S.L.; Barnum, T.J.; Zhou, Y.; Yelin, S.F.; Field, R.W. Direct single-shot observation of millimeter-wave superradiance in Rydberg-Rydberg transitions. Phys. Rev. A 2017, 95, 043818. [Google Scholar] [CrossRef]
  91. Hutzler, N.R.; Lu, H.I.; Doyle, J.M. The buffer gas beam: An intense, cold, and slow source for atoms and molecules. Chem. Rev. 2012, 112, 4803–4827. [Google Scholar] [CrossRef]
  92. Wright, S.C.; Doppelbauer, M.; Hofsäss, S.; Schewe, H.C.; Sartakov, B.; Meijer, G.; Truppe, S. Cryogenic buffer gas beams of AlF, CaF, MgF, YbF, Al, Ca, Yb and NO - a comparison. Mol. Phys. 2023, 121, 2146541. [Google Scholar] [CrossRef]
  93. Patterson, D.; Doyle, J.M. Bright, guided molecular beam with hydrodynamic enhancement. J. Chem. Phys. 2007, 126, 154307. [Google Scholar] [CrossRef]
  94. Lu, H.I.; Rasmussen, J.; Wright, M.J.; Patterson, D.; Doyle, J.M. A cold and slow molecular beam. Phys. Chem. Chem. Phys. PCCP 2011, 13, 18986–18990. [Google Scholar] [CrossRef] [PubMed]
  95. Baiz, C.R.; Błasiak, B.; Bredenbeck, J.; Cho, M.; Choi, J.H.; Corcelli, S.A.; Dijkstra, A.G.; Feng, C.J.; Garrett-Roe, S.; Ge, N.H.; et al. Vibrational spectroscopic map, vibrational spectroscopy, and intermolecular interaction. Chem. Rev. 2020, 120, 7152–7218. [Google Scholar] [CrossRef] [PubMed]
  96. Perakis, F.; Marco, L.D.; Shalit, A.; Tang, F.; Kann, Z.R.; Kühne, T.D.; Torre, R.; Bonn, M.; Nagata, Y. Vibrational spectroscopy and dynamics of water. Chem. Rev. 2016, 116, 7590–7607. [Google Scholar] [CrossRef] [PubMed]
  97. Cheng, J.X.; Xie, X.S. Vibrational spectroscopic imaging of living systems: An emerging platform for biology and medicine. Science 2015, 350, 6264. [Google Scholar] [CrossRef] [PubMed]
  98. Berthomieu, C.; Hienerwadel, R. Fourier transform infrared (FTIR) spectroscopy. Photosynth. Res. 2009, 101, 157–170. [Google Scholar] [CrossRef]
  99. Coddington, I.; Newbury, N.; Swann, W. Dual-comb spectroscopy. Optica 2016, 3, 414–426. [Google Scholar] [CrossRef]
  100. Available online: https://www.menlosystems.com/products/optical-frequency-combs/fc1500-250-uln-plus/ (accessed on 15 November 2024).
  101. Available online: https://www.toptica.com/frequency-combs (accessed on 15 November 2024).
  102. Hall, J.L. Nobel Lecture: Defining and measuring optical frequencies. Rev. Mod. Phys. 2006, 78, 1279. [Google Scholar] [CrossRef]
  103. Picqué, N.; Hänsch, T.W. Frequency comb spectroscopy. Nat. Photonics 2019, 13, 146–157. [Google Scholar] [CrossRef]
  104. Hargrove, L.E.; Fork, R.L.; Pollack, M.A. Locking of hene laser modes induced by synchronous intracavity modulation. Appl. Phys. Lett. 1964, 5, 4–5. [Google Scholar] [CrossRef]
  105. Kuizenga, D.J.; Siegman, A.E. FM and AM mode locking of the homogeneous laser-Part I: Theory. IEEE J. Quaktum Electron. 1970, 6, 694–708. [Google Scholar] [CrossRef]
  106. Brabec, T.; Spielmann, C.; Curley, P.F.; Krausz, F. Kerr lens mode locking. Opt. Lett. 1992, 17, 1292–1294. [Google Scholar] [CrossRef]
  107. Haus, H.A. Mode-Locking of Lasers. IEEE J. Sel. Top. Quantum Electron. 2000, 6, 1173–1185. [Google Scholar] [CrossRef]
  108. Hudson, D.D.; Holman, K.W.; Jones, R.J.; Cundiff, S.T.; Ye, J.; Jones, D.J. Mode-locked fiber laser frequency-controlled with an intracavity electro-optic modulator. Opt. Lett. 2005, 30, 2948–2950. [Google Scholar] [CrossRef] [PubMed]
  109. Haus, H. A theory of forced mode locking. IEEE J. Quantum Electron. 1975, 11, 323–330. [Google Scholar] [CrossRef]
  110. Revin, D.G.; Hemingway, M.; Wang, Y.; Cockburn, J.W.; Belyanin, A. Active mode locking of quantum cascade lasers in an external ring cavity. Nat. Commun. 2016, 7, 11440. [Google Scholar] [CrossRef]
  111. Mollenauer, L.F.; Vieira, N.D.; Szeto, L. Mode locking by synchronous pumping using a gain medium with microsecond decay times. Opt. Lett. 1982, 7, 414–416. [Google Scholar] [CrossRef]
  112. Demaria, A.J.; Stetser, D.A.; Heynau, H. Self mode-locking of lasers with saturable absorbers. Appl. Phys. Lett. 1966, 8, 174–176. [Google Scholar] [CrossRef]
  113. Paschotta, R.; Keller, U. Passive mode locking with slow saturable absorbers. Appl. Phys. B Lasers Opt. 2001, 73, 653–662. [Google Scholar] [CrossRef]
  114. Kärtner, F.X.; Jung, I.D.; Keller, U. Soliton Mode-Locking with Saturable Absorbers. IEEE J. Sel. Top. Quantum Electron. 1996, 2, 540–556. [Google Scholar] [CrossRef]
  115. Haus, H.A. Theory of mode locking with a fast saturable absorber. J. Appl. Phys. 1975, 46, 3049–3058. [Google Scholar] [CrossRef]
  116. Herrmann, J. Theory of Kerr-lens mode locking: Role of self-focusing and radially varying gain. JOSA b 1994, 11, 498–512. [Google Scholar] [CrossRef]
  117. Cerullo, G.; Silvestri, S.D.; Magni, V. Self-starting Kerr-lens mode locking of a Ti:sapphire laser. Opt. Lett. 1994, 19, 1040–1042. [Google Scholar] [CrossRef] [PubMed]
  118. Morgner, U.; Cho, S.H.; Chen, Y.; Haus, H.A.; Fujimoto, J.G.; Ippen, E.P.; Scheuer, V.; Angelow, G.; Tschudi, T. Sub-two-cycle pulses from a Kerr-lens mode-locked Ti : Sapphire laser. Opt. Lett. 1999, 24, 411–413. [Google Scholar] [CrossRef] [PubMed]
  119. Udem, T.; Holzwarth, R.; Hansch, T.W. Optical frequency metrology. Nature 2002, 416, 233–237. [Google Scholar] [CrossRef]
  120. Telle, H.R.; Steinmeyer, G.; Dunlop, A.E.; Stenger, J.; Sutter, D.H.; Keller, U. Carrier-envelope offset phase control: A novel concept for absolute optical frequency measurement and ultrashort pulse generation. Appl. Phys. B 1999, 69, 327–332. [Google Scholar] [CrossRef]
  121. Keller, U. Ultrafast solid-state laser oscillators: A success story for the last 20 years with no end in sight. Appl. Phys. B Lasers Opt. 2010, 100, 15–28. [Google Scholar] [CrossRef]
  122. Krauss, G.; Fehrenbacher, D.; Brida, D.; Riek, C.; Sell, A.; Huber, R.; Leitenstorfer, A. All-passive phase locking of a compact Er:fiber laser system. Opt. Lett. 2011, 36, 540–542. [Google Scholar] [CrossRef]
  123. Puppe, T.; Sell, A.; Kliese, R.; Hoghooghi, N.; Zach, A.; Kaenders, W. Characterization of a DFG comb showing quadratic scaling of the phase noise with frequency. Opt. Lett. 2016, 41, 1877–1880. [Google Scholar] [CrossRef]
  124. Thorpe, M.J.; Ye, J. Cavity-enhanced direct frequency comb spectroscopy. Appl. Phys. B 2008, 91, 397–414. [Google Scholar] [CrossRef]
  125. Adler, F.; Thorpe, M.J.; Cossel, K.C.; Ye, J. Cavity-enhanced direct frequency comb spectroscopy: Technology and applications. Annu. Rev. Anal. Chem. 2010, 3, 175–205. [Google Scholar] [CrossRef]
  126. Stowe, M.C.; Thorpe, M.J.; Pe’er, A.; Ye, J.; Stalnaker, J.E.; Gerginov, V.; Diddams, S.A. Direct frequency comb spectroscopy. Adv. At. Mol. Opt. Phys. 2008, 55, 1–60. [Google Scholar] [CrossRef]
  127. Cingoz, A.; Yost, D.C.; Allison, T.K.; Ruehl, A.; Fermann, M.E.; Hartl, I.; Ye, J. Direct frequency comb spectroscopy in the extreme ultraviolet. Nature 2012, 482, 68–71. [Google Scholar] [CrossRef] [PubMed]
  128. Cossel, K.C.; Adler, F.; Bertness, K.A.; Thorpe, M.J.; Feng, J.; Raynor, M.W.; Ye, J. Analysis of trace impurities in semiconductor gas via cavity-enhanced direct frequency comb spectroscopy. Appl. Phys. B 2010, 100, 917–924. [Google Scholar] [CrossRef]
  129. Coburn, S.; Alden, C.B.; Wright, R.; Cossel, K.; Baumann, E.; Truong, G.W.; Giorgetta, F.; Sweeney, C.; Newbury, N.R.; Prasad, K.; et al. Regional trace-gas source attribution using a field-deployed dual frequency comb spectrometer. Optica 2018, 5, 320–327. [Google Scholar] [CrossRef]
  130. Weichman, M.L.; Changala, P.B.; Ye, J.; Chen, Z.; Yan, M.; Picqué, N. Broadband molecular spectroscopy with optical frequency combs. J. Mol. Spectrosc. 2019, 355, 66–78. [Google Scholar] [CrossRef]
  131. Changala, P.B.; Weichman, M.L.; Lee, K.F.; Fermann, M.E.; Ye, J. Rovibrational quantum state resolution of the C60 fullerene. Science 2019, 363, 49–54. [Google Scholar] [CrossRef]
  132. Sinclair, L.C.; Cossel, K.C.; Coffey, T.; Ye, J.; Cornell, E.A. Frequency comb velocity-modulation spectroscopy. Phys. Rev. Lett. 2011, 107, 093002. [Google Scholar] [CrossRef]
  133. Cairncross, W.B.; Gresh, D.N.; Grau, M.; Cossel, K.C.; Roussy, T.S.; Ni, Y.; Zhou, Y.; Ye, J.; Cornell, E.A. Precision measurement of the electron’s electric Dipole moment using trapped molecular ions. Phys. Rev. Lett. 2017, 119, 153001. [Google Scholar] [CrossRef]
  134. Roussy, T.S.; Caldwell, L.; Wright, T.; Cairncross, W.B.; Shagam, Y.; Ng, K.B.; Schlossberger, N.; Park, S.Y.; Wang, A.; Ye, J.; et al. An improved bound on the electron’s electric dipole moment. Science 2023, 381, 46–50. [Google Scholar] [CrossRef]
  135. Thorpe, M.J.; Balslev-Clausen, D.; Kirchner, M.S.; Ye, J. Cavity-enhanced optical frequency comb spectroscopy: Application to human breath analysis. Opt. Express 2008, 16, 2387–2397. [Google Scholar] [CrossRef]
  136. Liang, Q.; Chan, Y.C.; Toscano, J.; Bjorkman, K.K.; Leinwand, L.A.; Parker, R.; Nozik, E.S.; Nesbitt, D.J.; Ye, J. Breath analysis by ultra-sensitive broadband laser spectroscopy detects SARS-CoV-2 infection. J. Breath Res. 2023, 17, 036001. [Google Scholar] [CrossRef] [PubMed]
  137. Asahara, A.; Minoshima, K. Development of ultrafast time-resolved dual-comb spectroscopy. APL Photonics 2017, 2, 041301. [Google Scholar] [CrossRef]
  138. Fleisher, A.J.; Bjork, B.J.; Bui, T.Q.; Cossel, K.C.; Okumura, M.; Ye, J. Mid-infrared time-resolved frequency comb spectroscopy of transient free radicals. J. Phys. Chem. Lett. 2014, 5, 2241–2246. [Google Scholar] [CrossRef] [PubMed]
  139. Long, D.A.; Cich, M.J.; Mathurin, C.; Heiniger, A.T.; Mathews, G.C.; Frymire, A.; Rieker, G.B. Nanosecond time-resolved dual-comb absorption spectroscopy. Nat. Photonics 2024, 18, 127–131. [Google Scholar] [CrossRef]
  140. Bjork, B.J.; Bui, T.Q.; Heckl, O.H.; Changala, P.B.; Spaun, B.; Heu, P.; Follman, D.; Deutsch, C.; Cole, G.D.; Aspelmeyer, M.; et al. Direct frequency comb measurement of OD + CO→DOCO kinetics. Science 2016, 354, 444–448. [Google Scholar] [CrossRef]
  141. Makowiecki, A.S.; Herman, D.I.; Hoghooghi, N.; Strong, E.F.; Cole, R.K.; Ycas, G.; Giorgetta, F.R.; Lapointe, C.B.; Glusman, J.F.; Daily, J.W.; et al. Mid-infrared dual frequency comb spectroscopy for combustion analysis from 2.8 to 5 μm. Proc. Combust. Inst. 2021, 38, 1627–1635. [Google Scholar] [CrossRef]
  142. Hu, G.; Mizuguchi, T.; Oe, R.; Nitta, K.; Zhao, X.; Minamikawa, T.; Li, T.; Zheng, Z.; Yasui, T. Dual terahertz comb spectroscopy with a single free-running fibre laser. Sci. Rep. 2018, 8, 11155. [Google Scholar] [CrossRef]
  143. Fu, H.; Jiang, X.; Wu, J.; Qiu, L.; Yuan, Y.; Guo, X.; Zhu, Y. Terahertz dual-comb spectroscopy: A comparison between time- and frequency-domain operation modes. Infrared Phys. Technol. 2021, 115, 103699. [Google Scholar] [CrossRef]
  144. Giorgetta, F.R.; Peischl, J.; Herman, D.I.; Ycas, G.; Coddington, I.; Newbury, N.R.; Cossel, K.C. Open-path dual-comb spectroscopy for multispecies trace gas detection in the 4.5–5 μm spectral region. Laser Photonics Rev. 2021, 15, 2000583. [Google Scholar] [CrossRef]
  145. Malarich, N.A.; Washburn, B.R.; Cossel, K.C.; Mead, G.J.; Giorgetta, F.R.; Herman, D.I.; Newbury, N.R.; Coddington, I. Validation of open-path dual-comb spectroscopy against an O2 background. Opt. Express 2023, 31, 5042–5055. [Google Scholar] [CrossRef]
  146. Han, J.J.; Zhong, W.; Zhao, R.C.; Zeng, T.; Li, M.; Lu, J.; Peng, X.X.; Shi, X.P.; Yin, Q.; Wang, Y.; et al. Dual-comb spectroscopy over 100km open-air path. arXiv 2023, arXiv:2310.19294. [Google Scholar]
  147. Dutt, A.; Joshi, C.; Ji, X.; Cardenas, J.; Okawachi, Y.; Luke, K.; Gaeta, A.L.; Lipson, M. On-chip dual-comb source for spectroscopy. Sci. Adv. 2018, 4, e1701858. [Google Scholar] [CrossRef]
  148. Gaeta, A.L.; Lipson, M.; Kippenberg, T.J. Photonic-chip-based frequency combs. Nat. Photonics 2019, 13, 158–169. [Google Scholar] [CrossRef]
  149. Yu, M.; Okawachi, Y.; Griffith, A.G.; Picqué, N.; Lipson, M.; Gaeta, A.L. Silicon-chip-based mid-infrared dual-comb spectroscopy. Nat. Commun. 2018, 9, 1869. [Google Scholar] [CrossRef] [PubMed]
  150. Suh, M.G.; Yang, Q.F.; Yang, K.Y.; Yi, X.; Vahala, K.J. Microresonator soliton dual-comb spectroscopy. Science 2016, 354, 600–603. [Google Scholar] [CrossRef]
  151. Rueda, A.; Sedlmeir, F.; Kumari, M.; Leuchs, G.; Schwefel, H.G. Resonant electro-optic frequency comb. Nature 2019, 568, 378–381. [Google Scholar] [CrossRef]
  152. Long, D.A.; Bresler, S.M.; Bao, Y.; Reschovsky, B.J.; Hodges, J.T.; Lawall, J.R.; LeBrun, T.W.; Gorman, J.J. Single-modulator, direct frequency comb spectroscopy via serrodyne modulation. Opt. Lett. 2023, 48, 892–895. [Google Scholar] [CrossRef]
  153. Parriaux, A.; Hammani, K.; Millot, G. Electro-optic frequency combs. Adv. Opt. Photon. 2020, 12, 223–287. [Google Scholar] [CrossRef]
  154. Coddington, I.; Swann, W.C.; Newbury, N.R. Coherent dual-comb spectroscopy at high signal-to-noise ratio. Phys. Rev. A 2010, 82, 043817. [Google Scholar] [CrossRef]
  155. Phillips, C.R.; Willenberg, B.; Nussbaum-Lapping, A.; Callegari, F.; Camenzind, S.L.; Pupeikis, J.; Keller, U. Coherently averaged dual-comb spectroscopy with a low-noise and high-power free-running gigahertz dual-comb laser. Opt. Express 2023, 31, 7103–7119. [Google Scholar] [CrossRef]
  156. Chen, Z.; Hänsch, T.W.; Picqué, N. Mid-infrared feed-forward dual-comb spectroscopy. Proc. Natl. Acad. Sci. USA 2019, 116, 3454–3459. [Google Scholar] [CrossRef] [PubMed]
  157. Zhang, C.; Ooi, T.; Higgins, J.S.; Doyle, J.F.; von der Wense, L.; Beeks, K.; Leitner, A.; Kazakov, G.A.; Li, P.; Thirolf, P.G.; et al. Frequency ratio of the 229mTh nuclear isomeric transition and the 87Sr atomic clock. Nature 2024, 633, 63–70. [Google Scholar] [CrossRef] [PubMed]
  158. Ozawa, A.; Davila-Rodriguez, J.; Bounds, J.R.; Schuessler, H.A.; Hänsch, T.W.; Udem, T. Single ion fluorescence excited with a single mode of an UV frequency comb. Nat. Commun. 2017, 8, 44. [Google Scholar] [CrossRef] [PubMed]
  159. Nauta, J.; Borodin, A.; Ledwa, H.B.; Stark, J.; Schwarz, M.; Schmöger, L.; Micke, P.; López-Urrutia, J.R.C.; Pfeifer, T. Towards precision measurements on highly charged ions using a high harmonic generation frequency comb. Nucl. Instrum. Methods Phys. Res. Sect. B Beam Interact. Mater. At. 2017, 408, 285–288. [Google Scholar] [CrossRef]
  160. Kameyama, R.; Takizawa, S.; Hiramatsu, K.; Goda, K. Dual-comb coherent Raman spectroscopy with near 100% duty cycle. ACS Photonics 2021, 8, 975–981. [Google Scholar] [CrossRef]
Figure 1. A schematic diagram of the Chirped-Pulse Fourier Transform Microwave (CP-FTMW) spectrometer. Molecules cooled to a few kelvins are generated by a supersonic molecular beam within a vacuum chamber, where the pressure is maintained below 0.01 torr by a turbo pump to minimize collisional broadening. The microwave pulse from the chirped-pulse (CP) synthesizer intersects the molecular beam perpendicularly and is detected by the Free-Induction Decay (FID) detector. Both the CP synthesizer and FID detector are phase-referenced to a rubidium (Rb) clock for phase stability. Teflon lenses are used to seal the vacuum chamber and to collimate the microwave beam.
Metrology 04 00043 g001
Figure 2. Schematic diagram illustrating (a) the synthesis of the chirped pulse (CP) and (b) the detection of Free-Induction Decay (FID). Black lines indicate low-frequency radio frequency signals, while red lines represent high-frequency microwave signals transmitted through coaxial cables. AWG: Arbitrary Waveform Generator; TWT: Traveling-Wave Tube; PDRO: Phase-locked Dielectric Resonator Oscillator; i, iii, viii, and xi: frequency mixer; ii: frequency quadrupler; vii and v: frequency doubler; iv and iv: power divider; ix: fast microwave switch; x: power amplifier. Further details are provided in the main text. The figure is adapted from Brown (2006) [32].
Metrology 04 00043 g002
Figure 3. A schematic diagram of the Chirped-Pulse millimeter-Wave (CPmmW) spectrometer. Black lines represent low-frequency radio frequency signals, red lines indicate high-frequency microwave signals in coaxial cables, and blue lines denote high-frequency millimeter-wave signals in waveguides. PLD: Phase-locked Crystal Oscillator; PDRO: Phase-locked Dielectric Resonator Oscillator; i, vii, and viii: frequency mixer; ii: microwave circulator; iii and xi: power amplifier; iv: bandpass filter; v: frequency quadrupler; vi: frequency doubler; x: Gunn diode oscillator; xi: Teflon lens. Further details are provided in the main text. The figure is adapted from Park (2011) [38].
Metrology 04 00043 g003
Figure 4. Segmented Chirped-Pulsed millimeter-Wave (CPmmW) spectrometer. Black lines represent low-frequency radio frequency signals, red lines indicate high-frequency microwave signals in coaxial cables, and blue lines denote high-frequency millimeter-wave signals in waveguides. i and xi: frequency mixer; ii and iv: frequency doublers; iii: programmable notch filter; v: frequency sextupler; vi: microwave power divider; vii: fast switch; viii: programmable power attenuator; ix, x, and xii: power amplifiers. DDS: Direct Digital Synthesizer; AWG: Arbitrary Waveform Generator. Further details are provided in the main text.
Metrology 04 00043 g004
Figure 5. Enantiomer-specific detection of chiral molecules using microwave spectroscopy. (a) The two enantiomers of chiral 1,2−propanediol. (b) The relevant energy diagram and microwave three-wave mixing scheme. (c) Enantiomer-dependent microwave radiation exhibiting distinct phase shifts. The figure is adapted from Patterson (2013) [65].
Metrology 04 00043 g005
Figure 6. The rotational spectrum of the photolysis products HCN and HNC in the 86.5 to 93.0 GHz region, showing vibrationally assigned J = 1 → 0 transitions. The vibrational states ( v 1 : C–H or N–H stretch; v 2 : bend; v 3 : C–N stretch) of HCN and HNC are indicated in round and square brackets, respectively, near their rotational lines. Two insets illustrate the electric quadrupole hyperfine ( e Q q ) N structure. The figure is adapted from Prozument (2020) [46].
Metrology 04 00043 g006
Figure 7. Dynamic rotational spectroscopy (DRS) measurements of CPCA (3 α –carbomethoxy–4 β –(4–chlorophenyl)–N–methylpiperidine). (a) The potential energy surface depicting the conformational isomerization of CPCA. (b) The CP-FTMW spectrum of CPCA (positive, black) compared with the calculated spectra for the syn (negative, blue) and anti (negative, red) conformers. (c) DRS measurements of CPCA in the 2819 to 2825 cm−1 region, presented in a 2D format, with red and blue lines indicating the pure rotational frequencies of the anti and syn transitions, respectively. (d) A comparison of the best-fit overall line shape with the DRS measurements in the microwave frequency region, with the smooth line-shape profile from the rotational Bloch model shown in red. The red and blue vertical lines correspond to the horizontal lines shown in (c). The figure is adapted from Dian (2008) [75].
Metrology 04 00043 g007
Figure 8. A schematic diagram of Rydberg–Rydberg transitions detected using Chirp-Pulsed millimeter-Wave (CPmmW) spectroscopy. BaF molecules are synthesized, cooled, and directed as a beam from a cryogenic cell. These molecules are subsequently excited to Rydberg states using two lasers. After excitation, a chirp pulse (CP) is applied to polarize the Rydberg molecules, inducing Free-Induction Decay (FID). The resulting FID signals are captured, digitized, and shown in the inset panel. The figure is adapted from Zhou (2015) [87].
Metrology 04 00043 g008
Figure 9. Principles of mode-locked lasers (MLLs). (a) Multiple longitudinal modes within the laser cavity are simultaneously excited. c: Speed of light; L: cavity length; FSR: free spectral range. (b) The Kerr medium in the laser cavity (middle panel) imposes much higher losses on continuous-wave light (top panel) than on pulsed light (bottom panel).
Metrology 04 00043 g009
Figure 10. Two methods for determining absolute frequency. f c e o : carrier-envelope frequency offset; ϕ c e o : carrier-envelope phase offset; f r : repetition rate. N ˜ represents the mode index relative to zero frequency. Inset: carrier-envelope phase offset visualized in the time domain. Further details are provided in the main text.
Metrology 04 00043 g010
Figure 11. Cavity-Enhanced Direct Frequency Comb Spectroscopy (CE-DFCS) of C60. (a) A schematic of the experimental setup integrating CE-DFCS with a cryogenic buffer gas cell. (b) High-resolution rovibrational spectra of C60 recorded at room temperature and cryogenic temperature. The figure is adapted from Changala (2019) [131].
Metrology 04 00043 g011
Figure 12. Cavity-Enhanced Direct Frequency Comb Spectroscopy (CE-DFCS) of velocity-modulated HfF+. (a) A schematic of the experimental setup featuring a VIPA etalon and a grating for resolving individual comb teeth. (b) Visualization of the resolved comb teeth. (c) High-resolution spectrum of HfF+, including five isotopes with assigned rotational band structures. The figure is adapted from Sinclair (2011) [132].
Metrology 04 00043 g012
Figure 13. A Cavity-Enhanced Direct Frequency Comb Spectroscopy (CE-DFCS) breathalyzer. (a) A schematic diagram illustrating the working principle. Exhaled human breath was collected in a Tedlar bag and introduced into an analysis chamber surrounded by high-reflectivity optical mirrors. A mid-infrared frequency comb laser interacted with the sample, generating a broadband molecular absorption spectrum. This spectroscopy data were then analyzed using supervised machine learning to classify the research subject’s condition as either positive or negative. (b) A sample absorption spectrum obtained from a research subject’s breath (black line). Inverted and displayed in different colors are the fitted contributions from four dominant species (CH3OH, H2O, HDO, and CH4) responsible for the most significant absorption features. Figure is adapted from Liang (2023) [136].
Metrology 04 00043 g013
Figure 14. Working principle of dual-comb spectroscopy (DCS), with optional cavity mirrors for enhanced sensitivity.
Metrology 04 00043 g014
Figure 15. Dual-comb spectroscopy (DCS) over a 100 km open-air path. (A) An overview of the 113 km DCS. (B) The main configuration and setup at each terminal. Rb: rubidium clock; USL: ultrastable laser; EDFA: Erbium-doped fiber amplifier; Tele: telescope; ADC: Analog-to-Digital Converter; GPS: global positioning system. Figure is adapted from Han (2023) [146].
Metrology 04 00043 g015
Figure 16. A schematic of the electro-optic modulator (EOM)-based, mid-infrared dual-comb spectrometer (DCS) used to interrogate a supersonic pulsed jet. (a) A near-infrared external cavity diode laser (ECDL) serves as the common source for two optical frequency combs generated using EOMs with slightly different repetition rates. To enhance the modulation depth, the two EOMs in the upper path are driven by identical waveforms. An acousto-optic modulator (AOM) in the lower beam path shifts the beat frequencies between the two optical frequency combs away from DC. The two OFCs are then combined and converted to mid-infrared wavelengths using an amplifier and a singly resonant CW optical parametric oscillator (OPO). The idler beam passes through the supersonic jet and is detected with a photodiode. All couplings shown in yellow indicate fiber connections. (b) A machine drawing of the supersonic pulsed jet, illustrating the plenum, a normally closed solenoid valve, a convergent–divergent (CD) nozzle, and the optical test chamber. The figure is adapted from Long (2023) [139].
Metrology 04 00043 g016
Disclaimer/Publisher’s Note: The statements, opinions and data contained in all publications are solely those of the individual author(s) and contributor(s) and not of MDPI and/or the editor(s). MDPI and/or the editor(s) disclaim responsibility for any injury to people or property resulting from any ideas, methods, instructions or products referred to in the content.

