
Interlaboratory Comparison of Power Measurements at Millimetre- and Sub-Millimetre-Wave Frequencies

 , , , , , , , and
Abstract
1. Introduction
2. Travelling Standards for Power Comparisons at Millimeter and Sub-Millimetre Frequencies
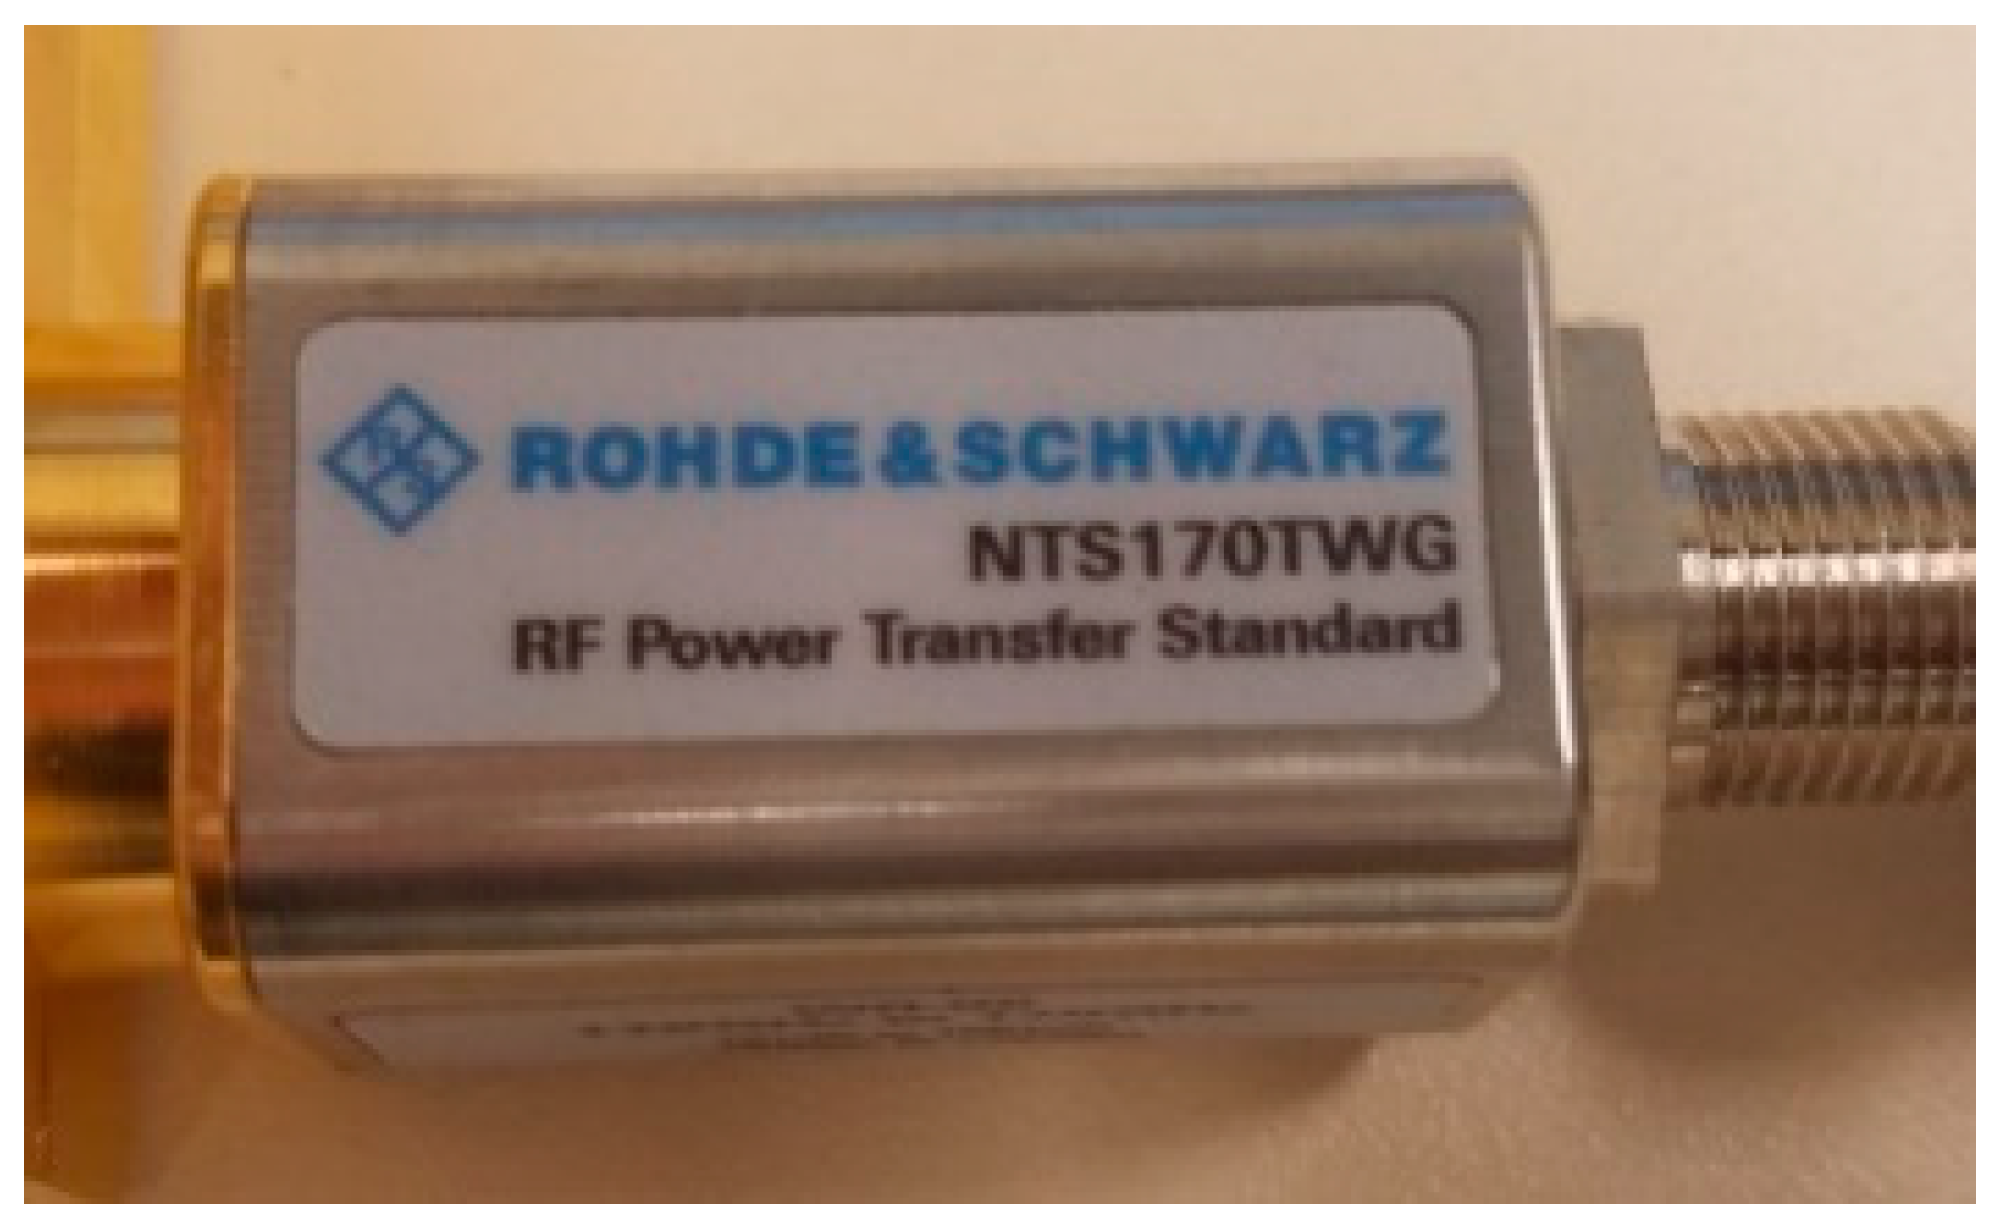
2.1. WR-6.5 Thermoelectric Power Sensor Heading
2.2. WR-6.5 Calorimetric Power Sensor
2.3. WR-1.5 Calorimetric Power Sensor
3. Participants’ Measurement Systems
3.1. NPL Measurement Setups
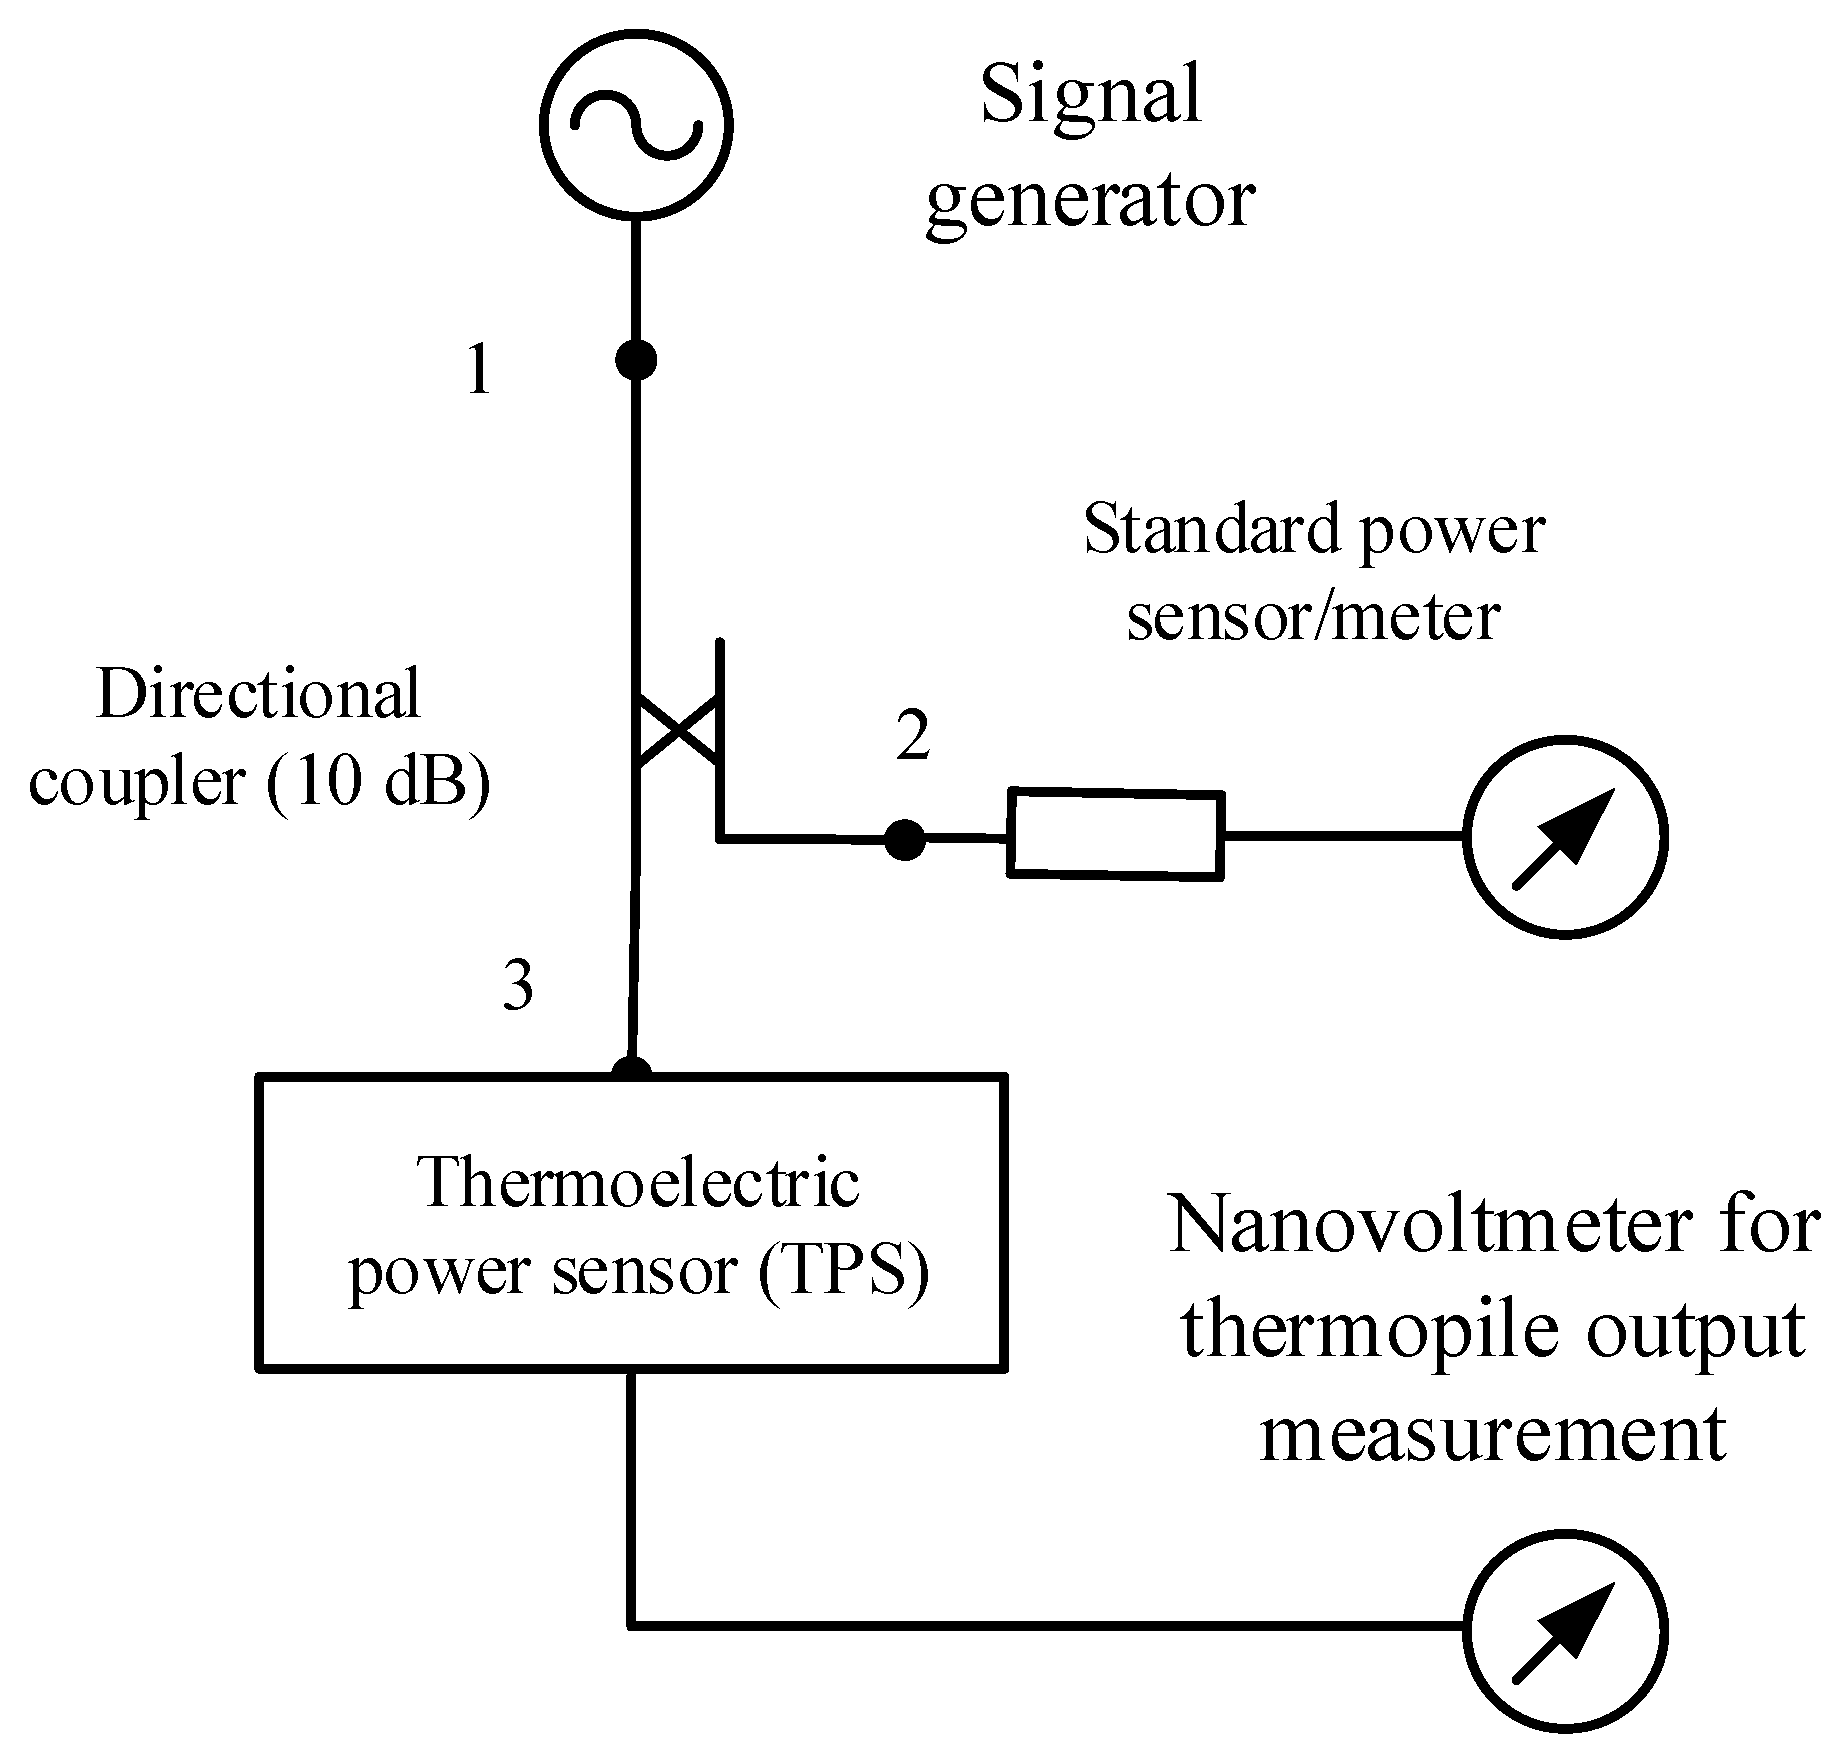
3.1.1. Thermoelectric Power Sensor Measurement
3.1.2. Calorimetric Power Sensor Measurement
3.2. METAS Measurement Setup and Calibration Process
3.3. TUBITAK UME Measurement Setup
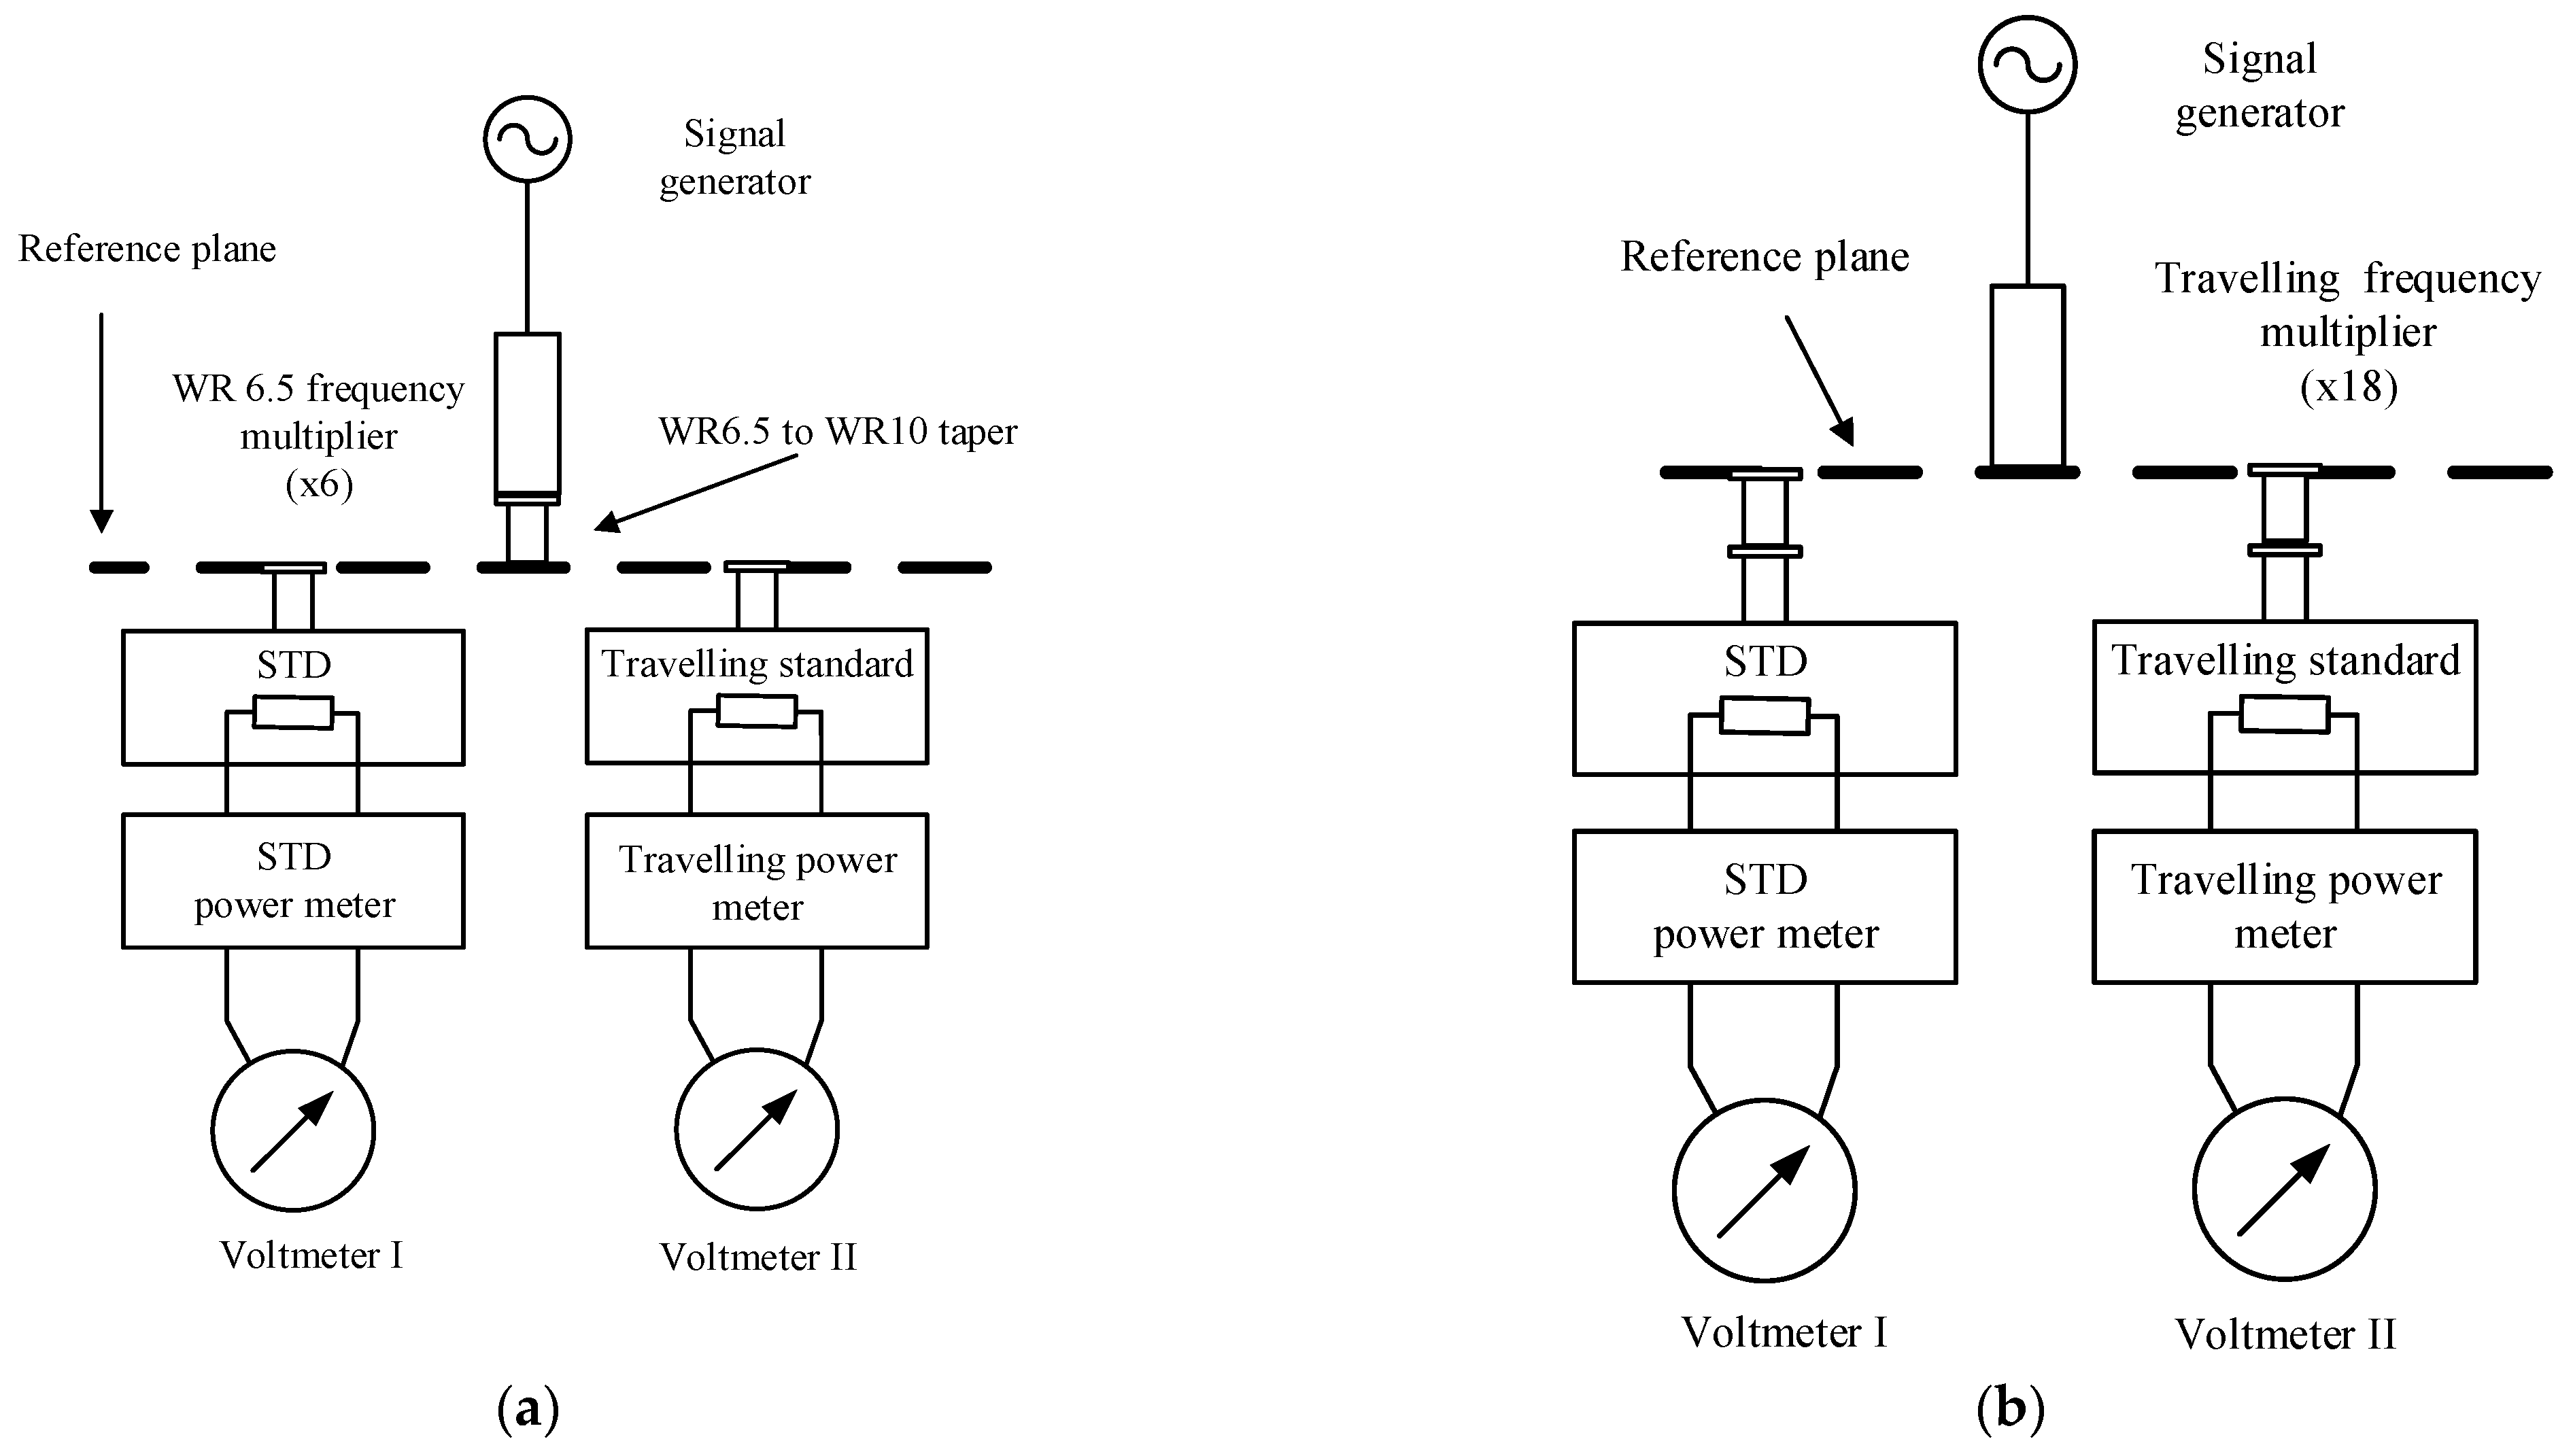
3.3.1. Thermoelectric Power Sensor Measurement
3.3.2. Calorimetric Power Sensor Measurement
3.4. WAT and GUM Measurement Setup
3.5. LNE Measurement Setup
3.6. VDI Measurement Setup
4. Measurement Results
4.1. Travelling TPS Measurement Results
4.2. Travelling CPS Measurement Results in the WR-6.5 Band
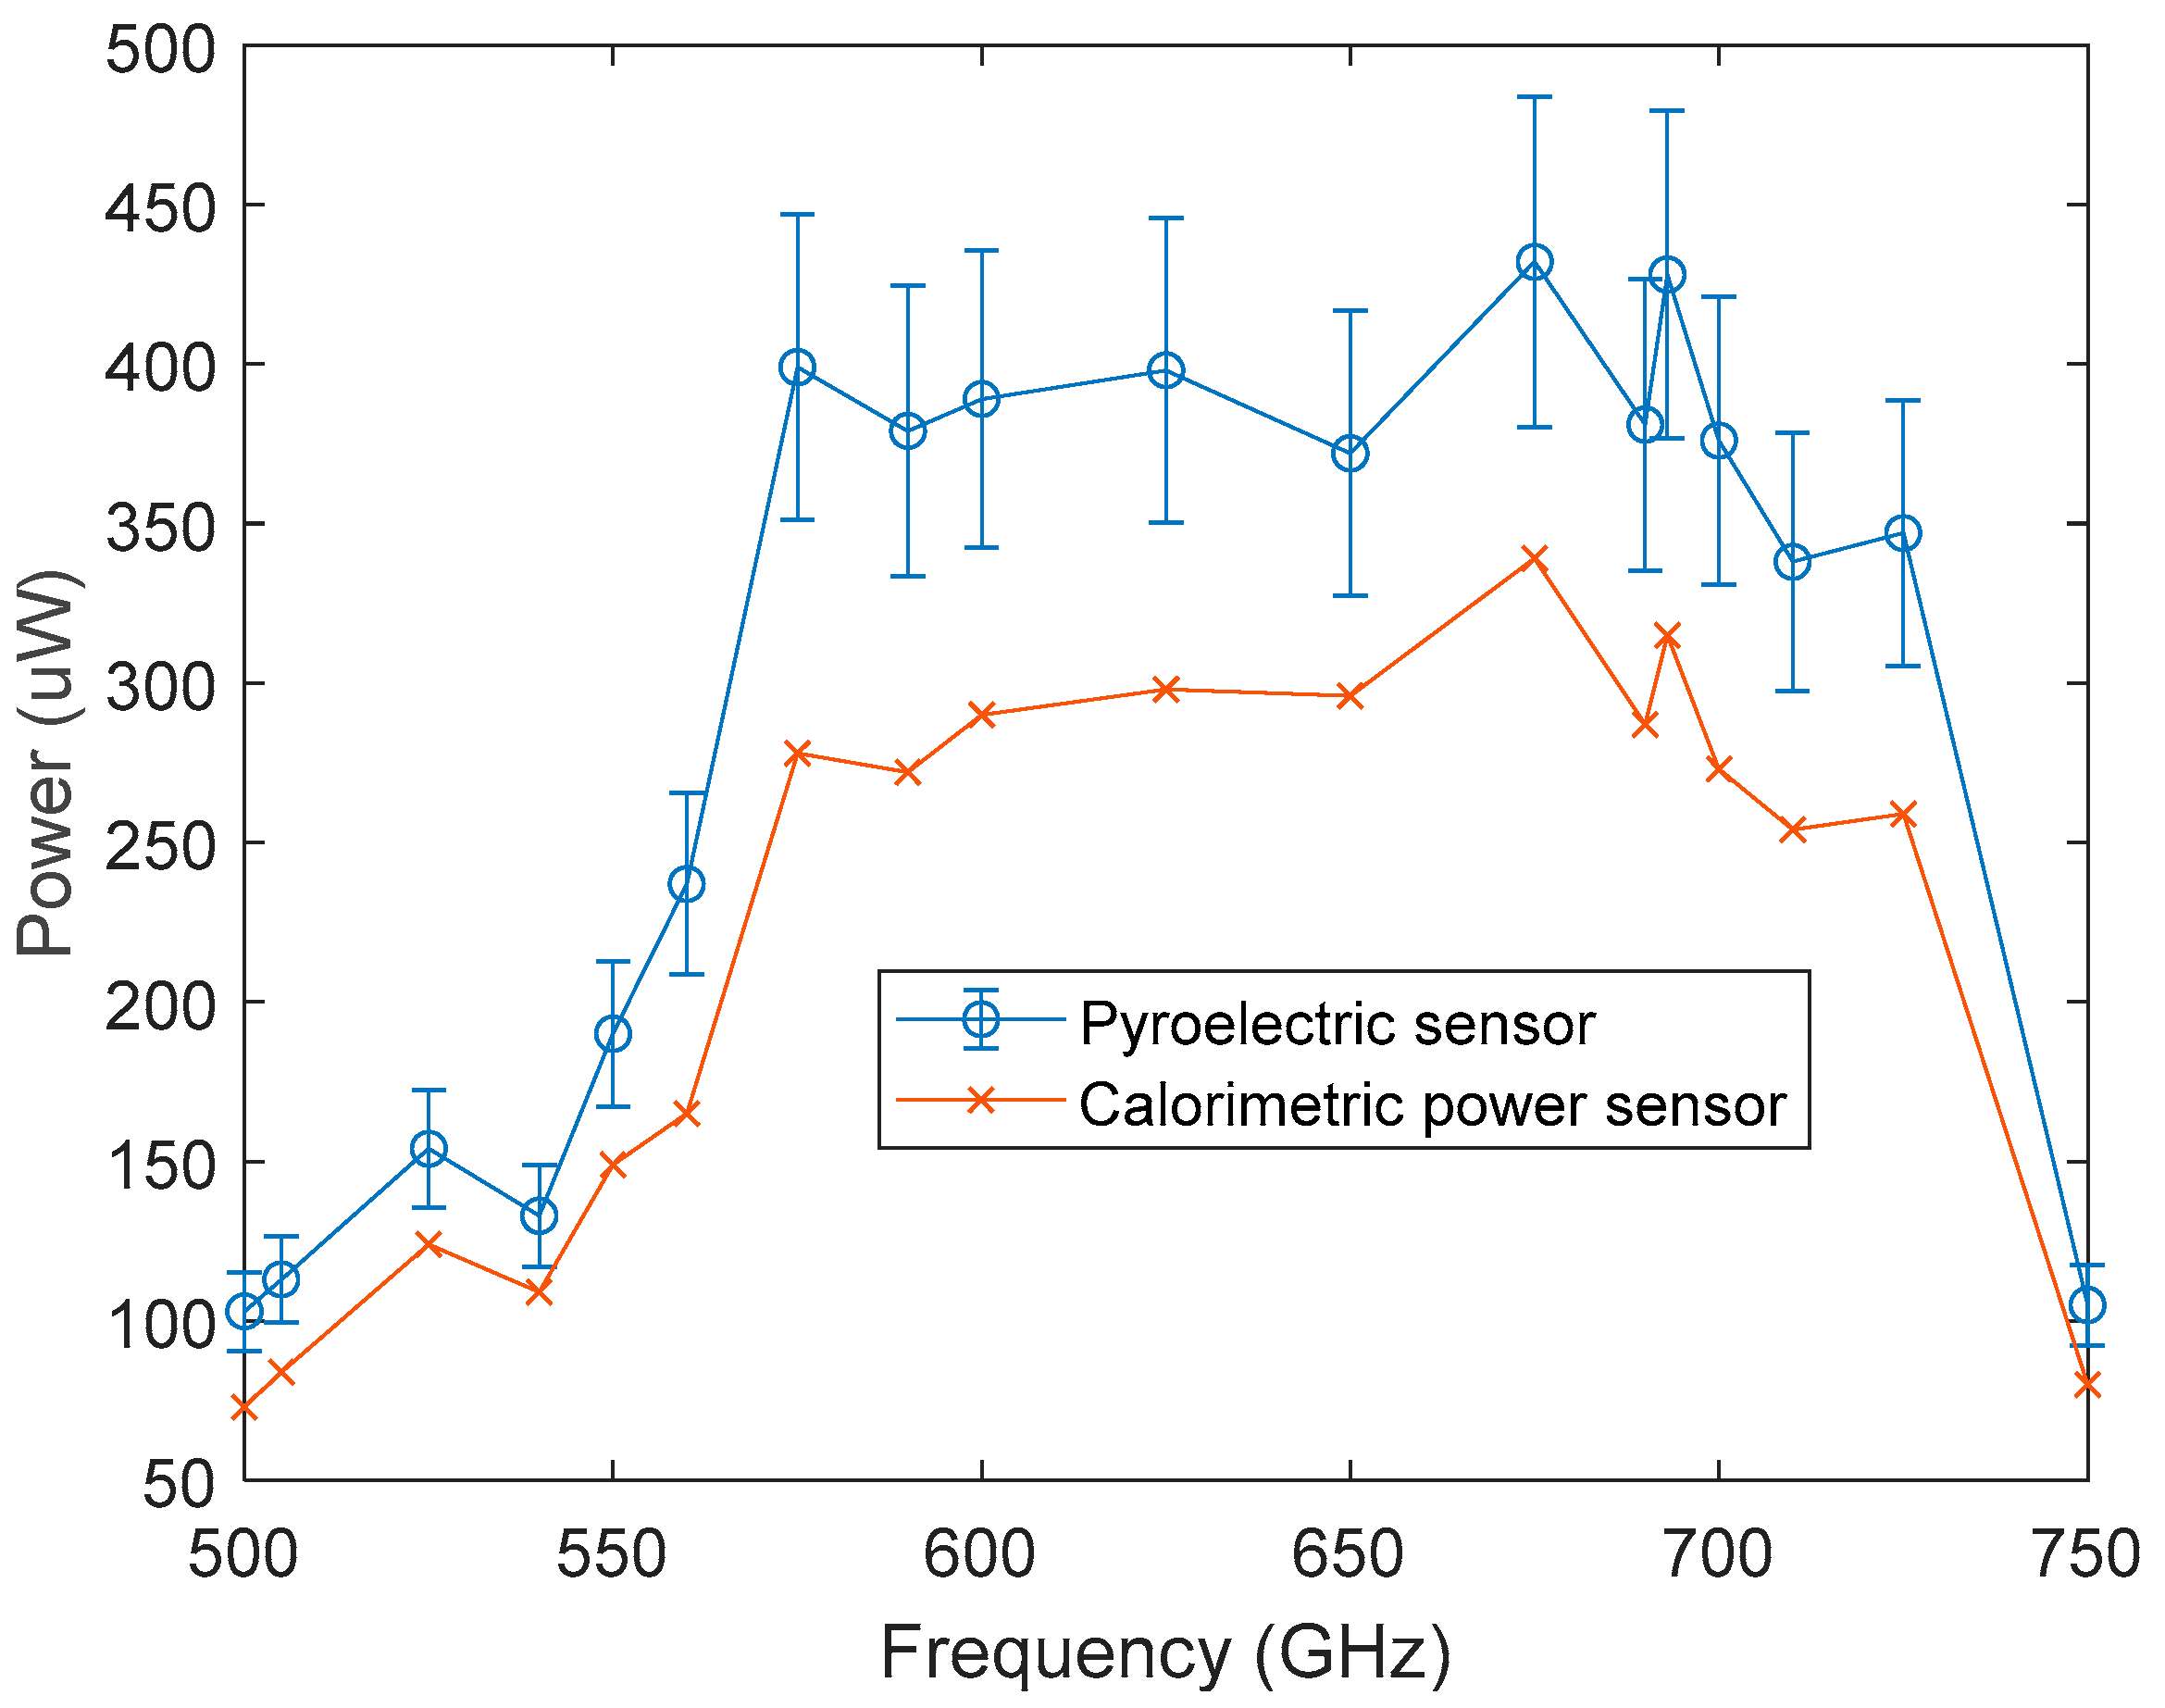
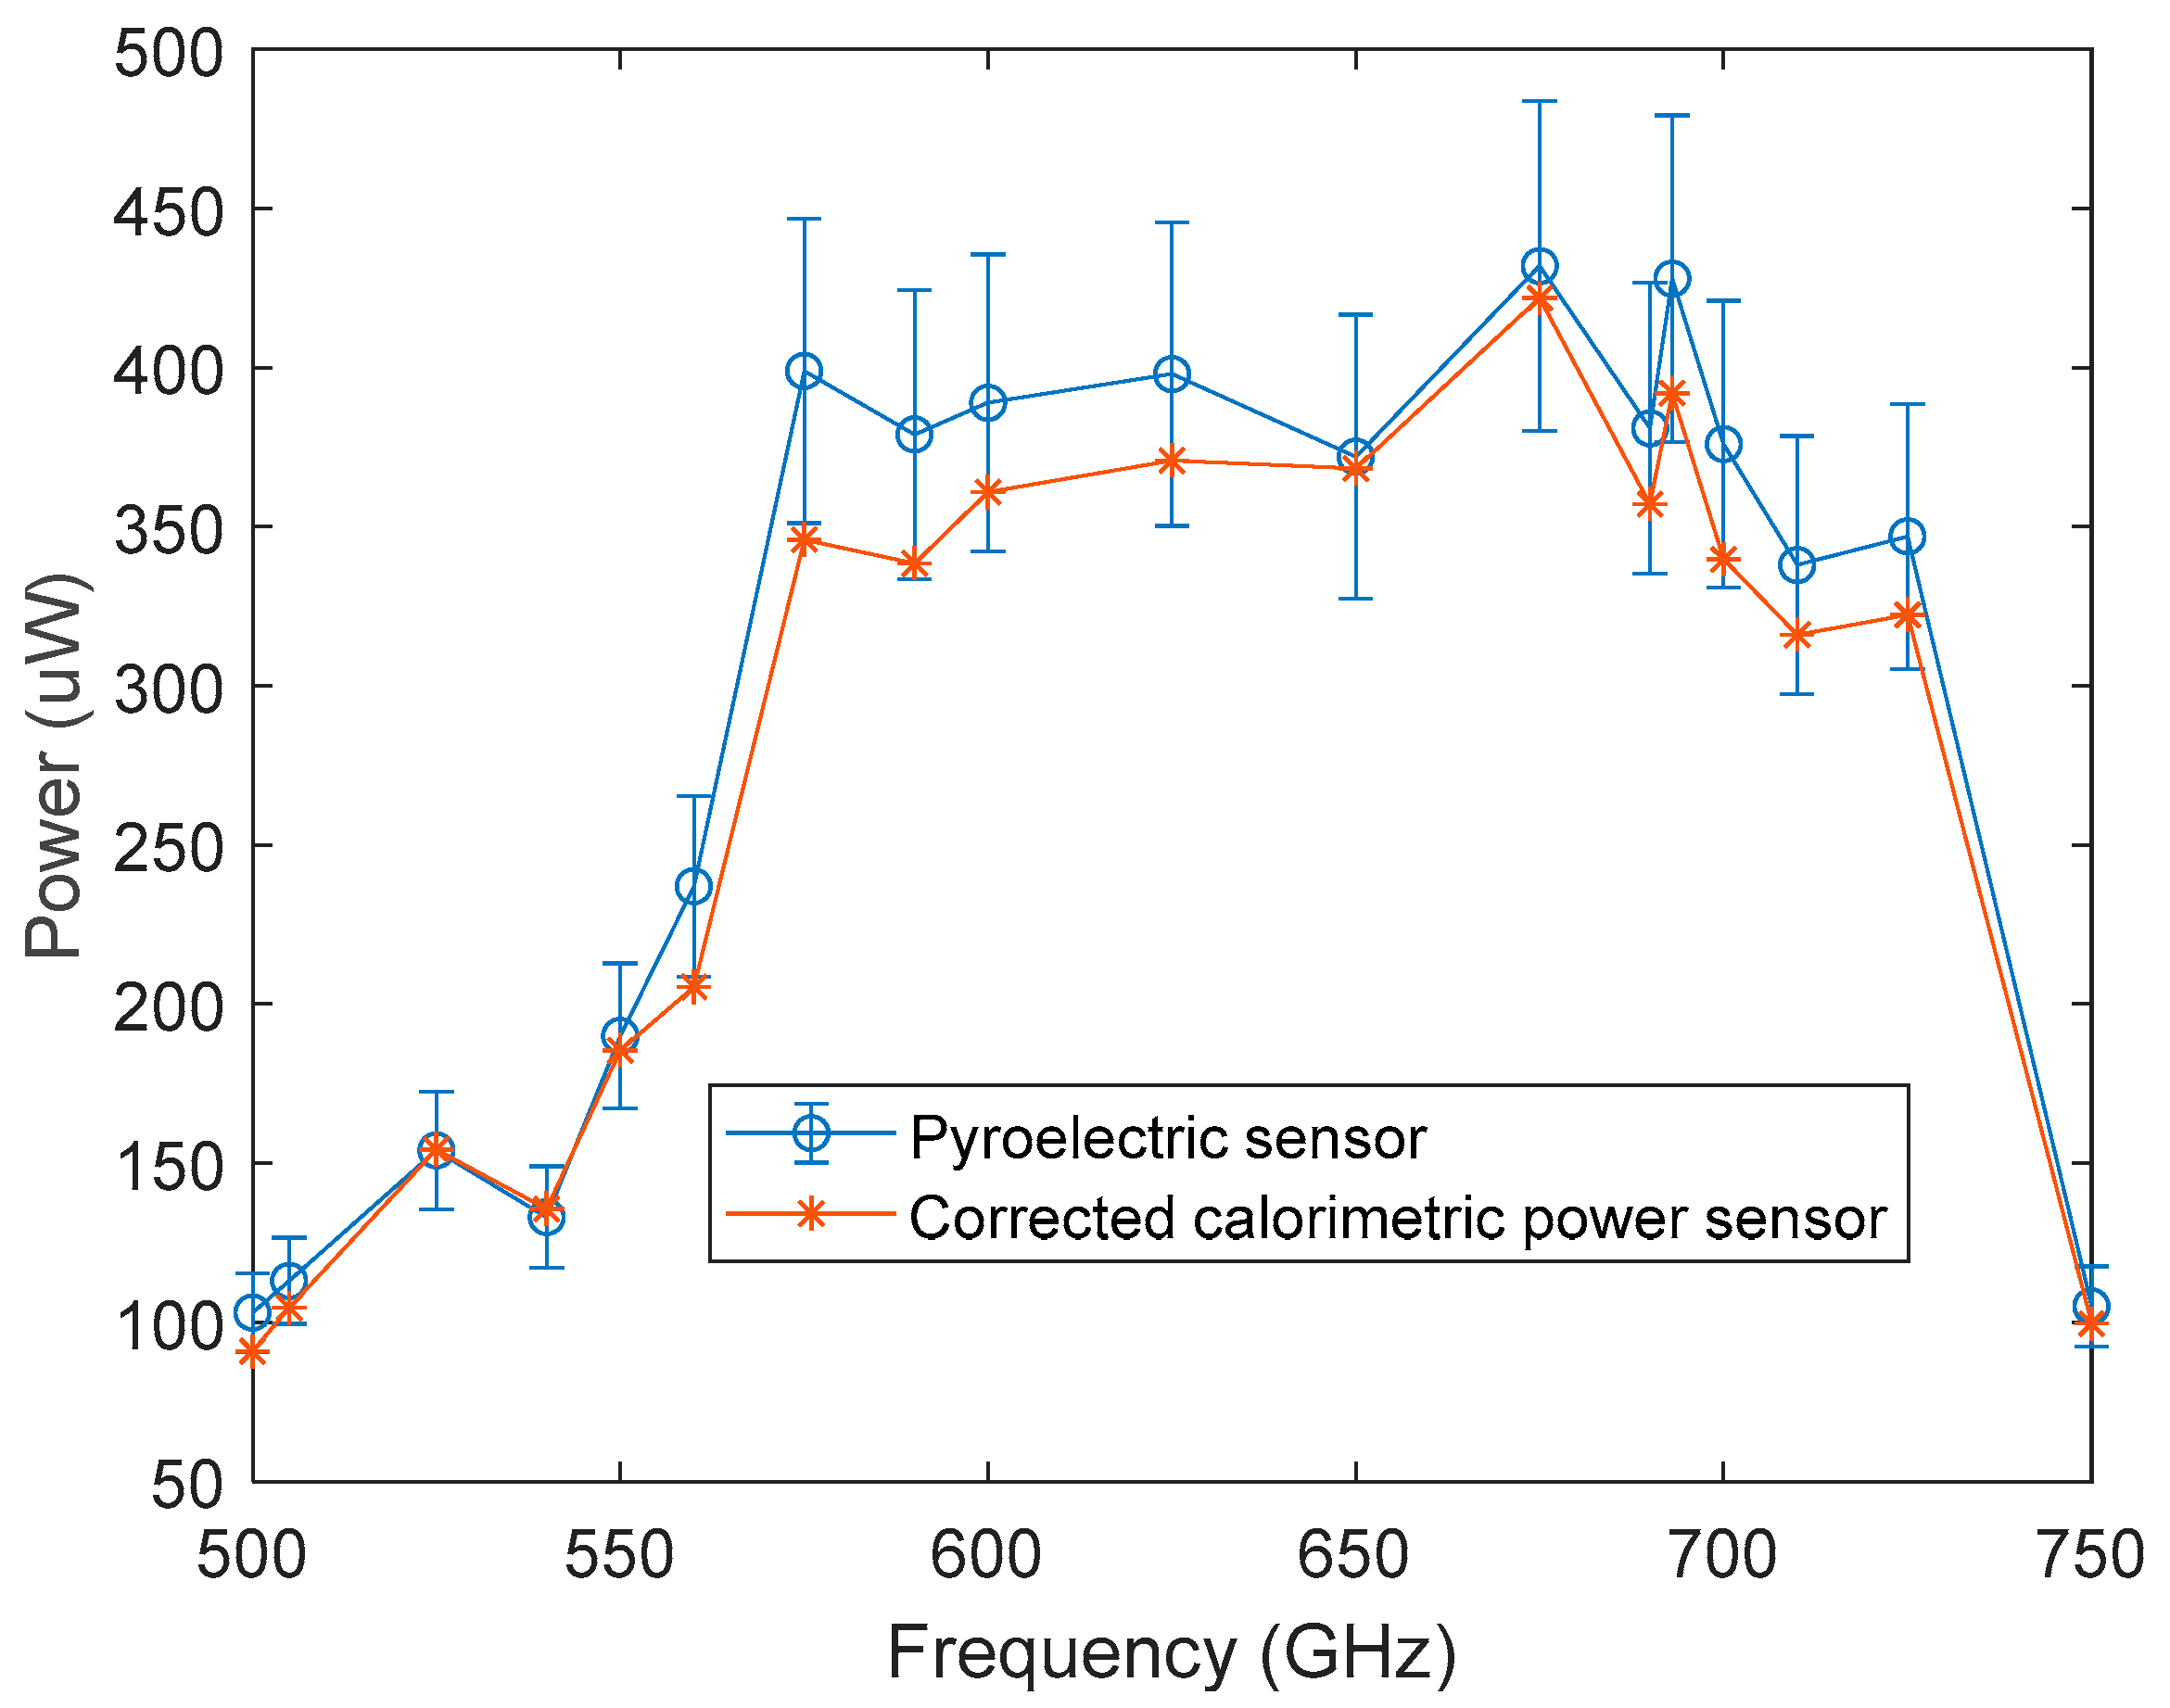
4.3. WR-1.5 Frequency Multiplier Measurement
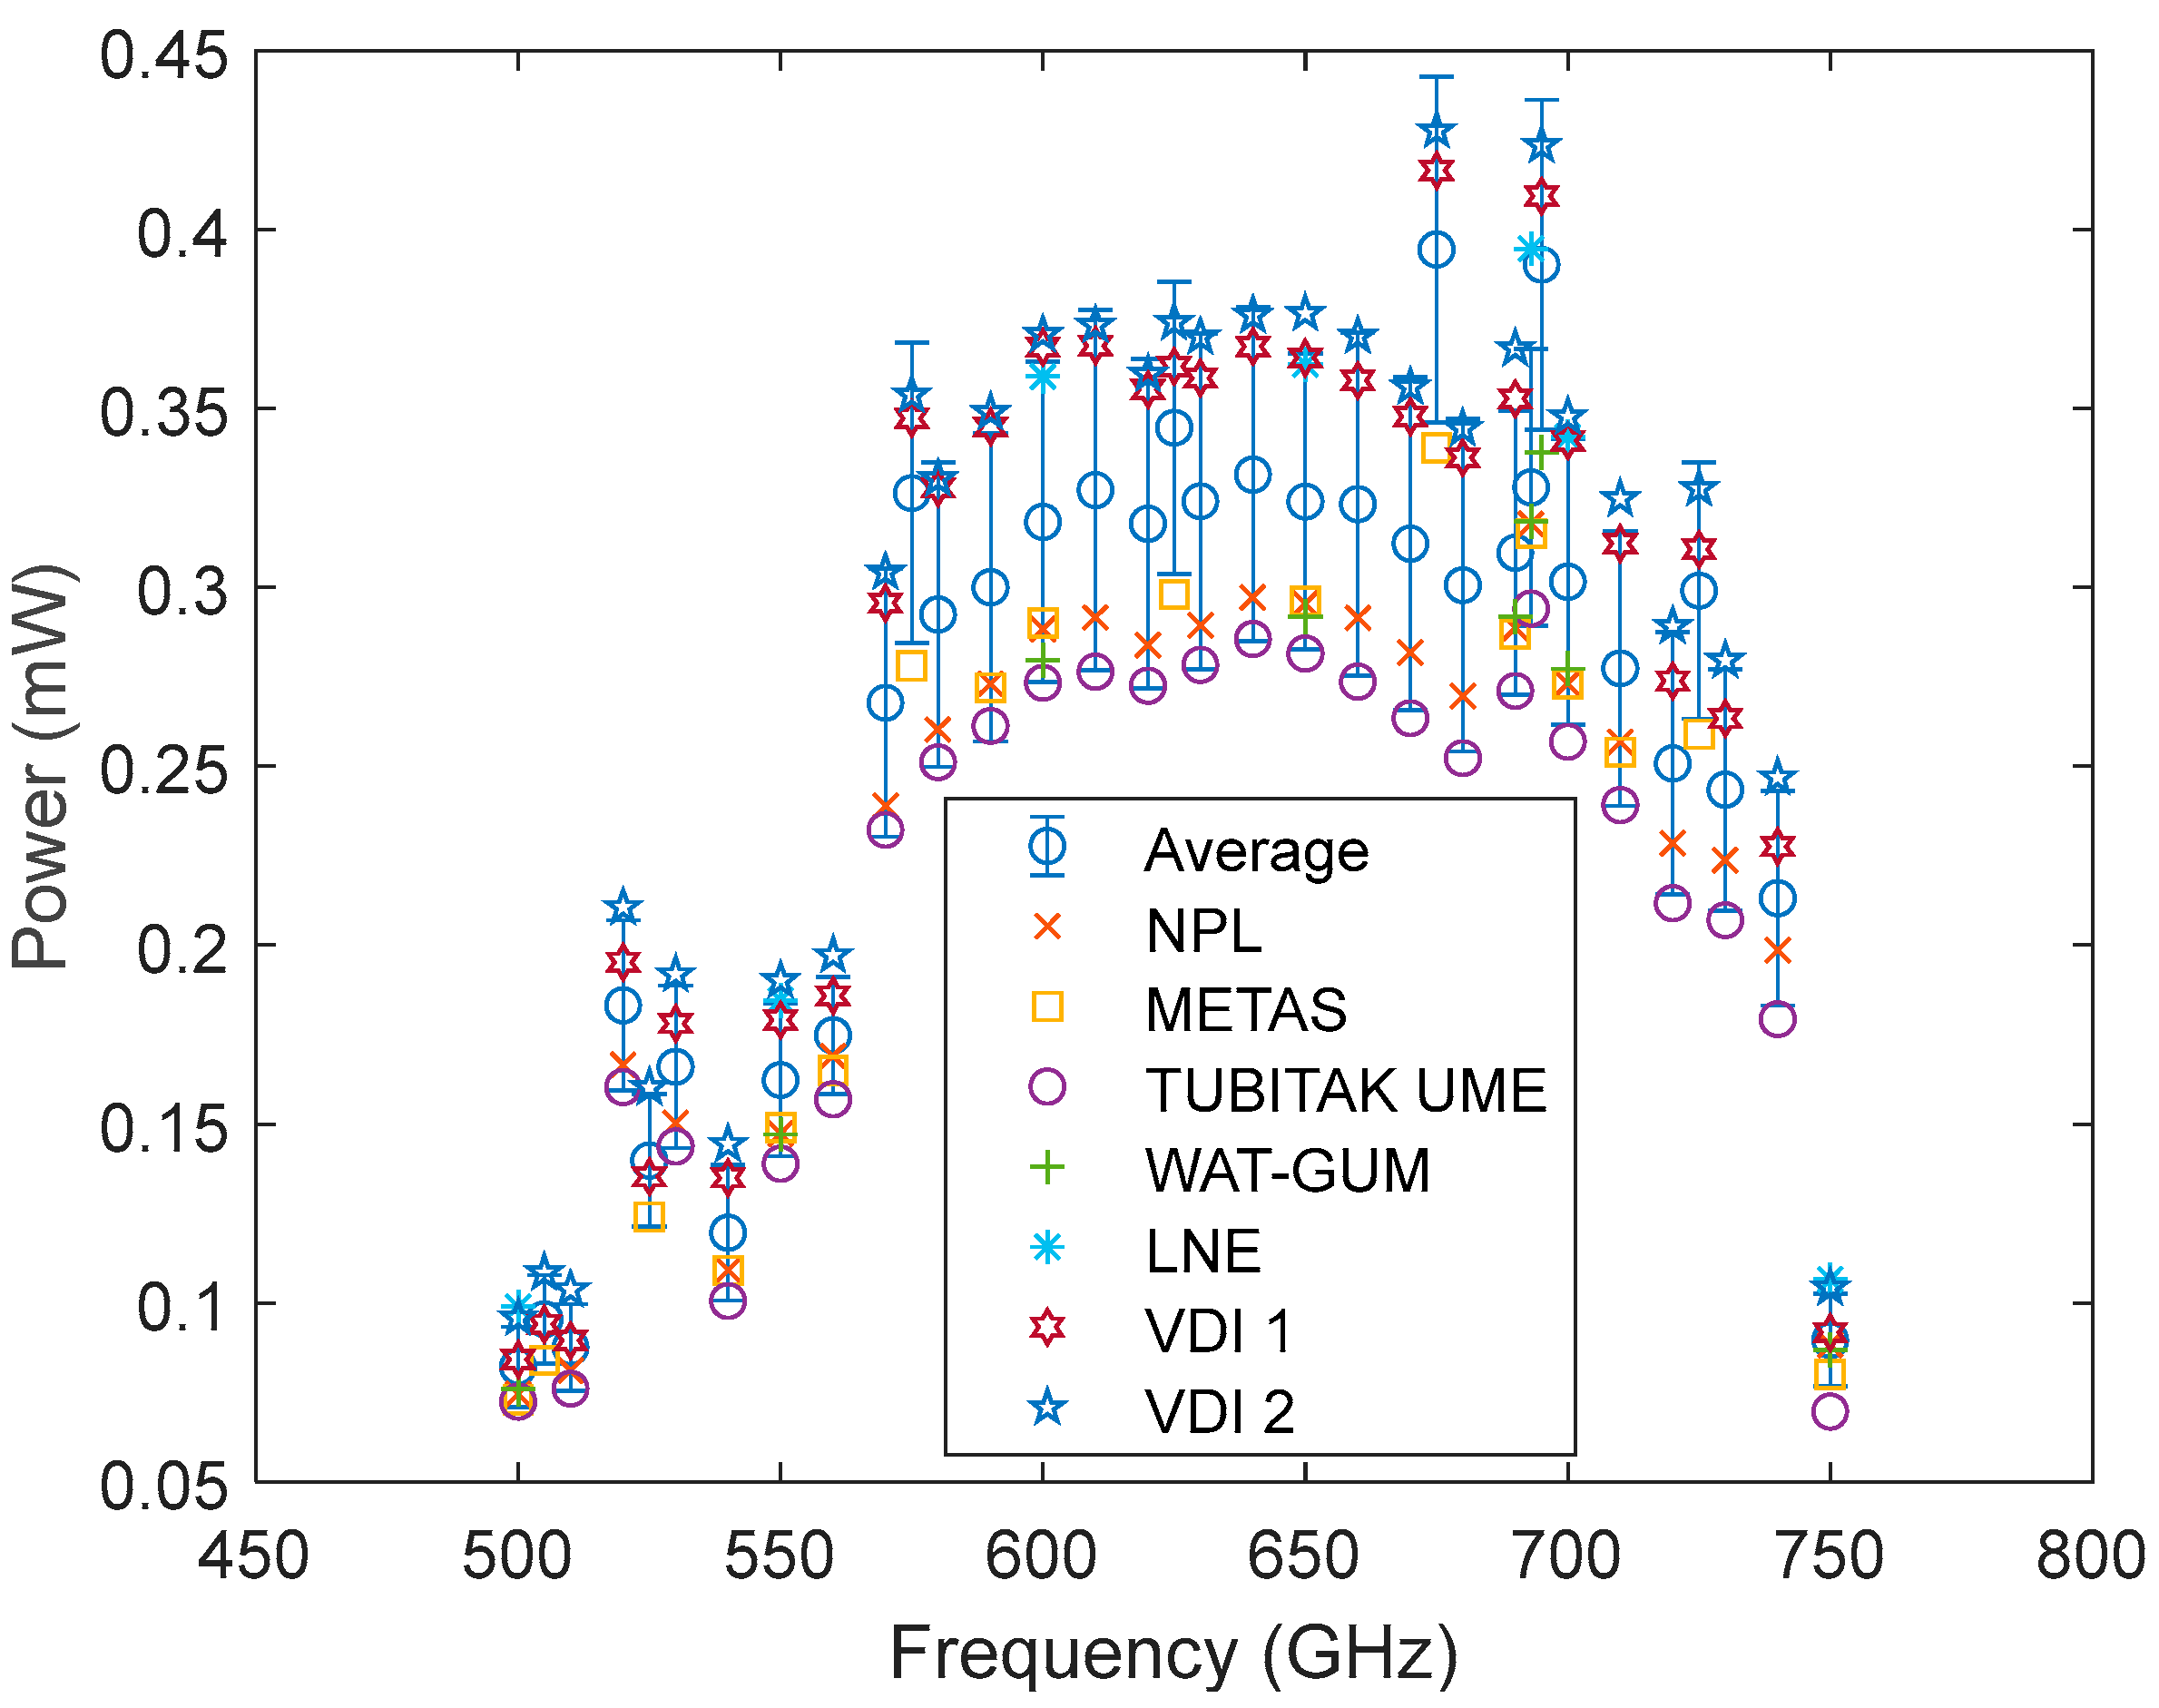
4.4. Travelling CPS Measurement Results in the WR-1.5 Band
5. Conclusions
Author Contributions
Funding
Data Availability Statement
Conflicts of Interest
References
- The BIPM Key Comparison Database (KCDB). Available online: https://www.bipm.org/kcdb/ (accessed on 8 May 2024).
- Elmika M1-25M. Available online: http://elmika.com/calorimetric_power_meter.html (accessed on 15 April 2024).
- VDI Erickson PM5. Available online: https://www.vadiodes.com/en/products/power-meters-erickson (accessed on 15 April 2024).
- EMPIR TEMMT Project. Available online: https://projects.lne.eu/jrp-temmt/ (accessed on 27 May 2022).
- EMPIR TEMMT Project. Available online: https://www.euramet.org/research-innovation/search-research-projects/details/?tx_eurametctcp_project%5Bproject%5D=1614 (accessed on 15 April 2024).
- Celep, M.; Phung, G.N.; Ziadé, F.; Stokes, D.; Rühaak, J.; Kuhlmann, K.; Allal, D. WG29/WR7 Band Thermoelectric Power Sensor Characterization using Microcalorimetry Technique. In Proceedings of the 2022 IEEE/MTT-S International Microwave Symposium—IMS 2022, Denver, CO, USA, 19–24 June 2022; pp. 876–879. [Google Scholar] [CrossRef]
- Achkar, J.; Velasco, L.; Weidman, M.P.; Clark, R.F.; Kim, J.H.; Park, J.I.; Zhang, T.; Peters, J.E.; Ruehaak, J.; Stumpe, D.; et al. International comparison of power measurements at 33 GHz (GT-RF/92-4). In IEEE Transactions on Instrumentation and Measurement; IEEE: Piscataway, NJ, USA, 1999; Volume 48, pp. 169–173. [Google Scholar] [CrossRef]
- Chow, M.W.K. Calibration Factor and Effective Efficiency on Coaxials. APMP.EM.RF-S2. 2001. Available online: https://www.bipm.org/kcdb/comparison?id=181 (accessed on 15 April 2024).
- Zhang, T.; Hall, B. Bilateral Supplementary Comparison P1-APMP.EM.RF-S4: Calibration factor of thermistor mount power sensors: In Type-N, 30 MHz–3000 MHz. Metrologia 2004, 41, 01004. [Google Scholar] [CrossRef]
- Beaumont, J.; Orford, G. CCEM.RF-K1d.W (GT-RF/97-3): Measurement techniques and results of an intercomparison for RF power in R 900 at frequencies of 75 GHz and 94 GHz. Metrologia 2003, 40, 01007. [Google Scholar] [CrossRef]
- Janik, D. Final report on EUROMET.EM.RF-K10.CL (EUROMET comparison 525 (GT-RF/99-2)): Power in the coaxial PC 3.5 mm line system. Metrologia 2007, 44, 01010. [Google Scholar] [CrossRef]
- Achkar, J.; Mellouet, B.; Velasco, L.; Swarnowski, S.; Akhiezer, A.N.; Seredniy, V.P.; Pavlenko, Y.F.; Juroshek, J.R. The GT-RF/95-1 key comparison of power measurements at 62 GHz. In IEEE Transactions on Instrumentation and Measurement; IEEE: Piscataway, NJ, USA, 2001; Volume 50, pp. 406–408. [Google Scholar] [CrossRef]
- Allen, J.W.; Ascroft, J.; Mellouet, B.; Perepelkin, V. Effective efficiency in waveguide R-400 (WR-22). Metrologia 2001, 38, 463–470. [Google Scholar] [CrossRef]
- de Vreede, J.P.; Korfage, W.; Persson, P.; Brunetti, L.; Lopez, V.; Petras, I.; Morard, P.; Hejsek, F.; Torok, A.; Ruhaak, J.; et al. International Comparison for RF Power in the Frequency Range up to 18 GHz. In IEEE Transactions on Instrumentation and Measurement; IEEE: Piscataway, NJ, USA, 2001; Volume 50. [Google Scholar]
- Kazemipour, A.; Hoffmann, J.; Stalder, D.; Wollensack, M.; Rufenacht, J.; Zeier, M. THz Detector Calibration Based on Microwave Power Standards. In Proceedings of the 2019 International Conference on Electromagnetics in Advanced Applications (ICEAA), Granada, Spain, 9–13 September 2019; pp. 0402–0403. [Google Scholar] [CrossRef]
- Guide to the Expression of Uncertainty in Measurement (GUM). BIPM Joint Committee on Guides in Metrology (JCGM), vol. 100, Sep. 2008. Available online: https://www.bipm.org/utils/common/documents/jcgm/JCGM_100_2008_E.pdf (accessed on 8 May 2024).
- Müller, R.; Gutschwager, B.; Hollandt, J.; Kehrt, M.; Monte, C.; Müller, R.; Steiger, A. Characterization of a large-area pryoelectric detector from 300 GHz to 30 THz. J. Infrared Millim. Terahertz Waves 2015, 36, 654–661. [Google Scholar] [CrossRef]
- Judaschke, R.H.; Kehrt, M.; Kuhlmann, K.; Steiger, A. Linking the Power Scales of Free-Space and Waveguide-Based Electromagnetic Waves. In IEEE Transactions on Instrumentation and Measurement; IEEE: Piscataway, NJ, USA, 2020; Volume 69, pp. 9056–9061. [Google Scholar] [CrossRef]
- VDI, “PM5 Operational Manual”, USA, 2019. Available online: https://www.vadiodes.com/images/Products/PowerMeter/PM5manual/VDI-724-PM5-Manual.pdf (accessed on 15 April 2024).


 ), NPL (
 ), WAT-GUM (
 ), LNE (
 ), TUBITAK UME (
 ) and METAS (
 ).
), NPL (), WAT-GUM (), LNE (), TUBITAK UME () and METAS ().
).
), NPL (), WAT-GUM (), LNE (), TUBITAK UME () and METAS ().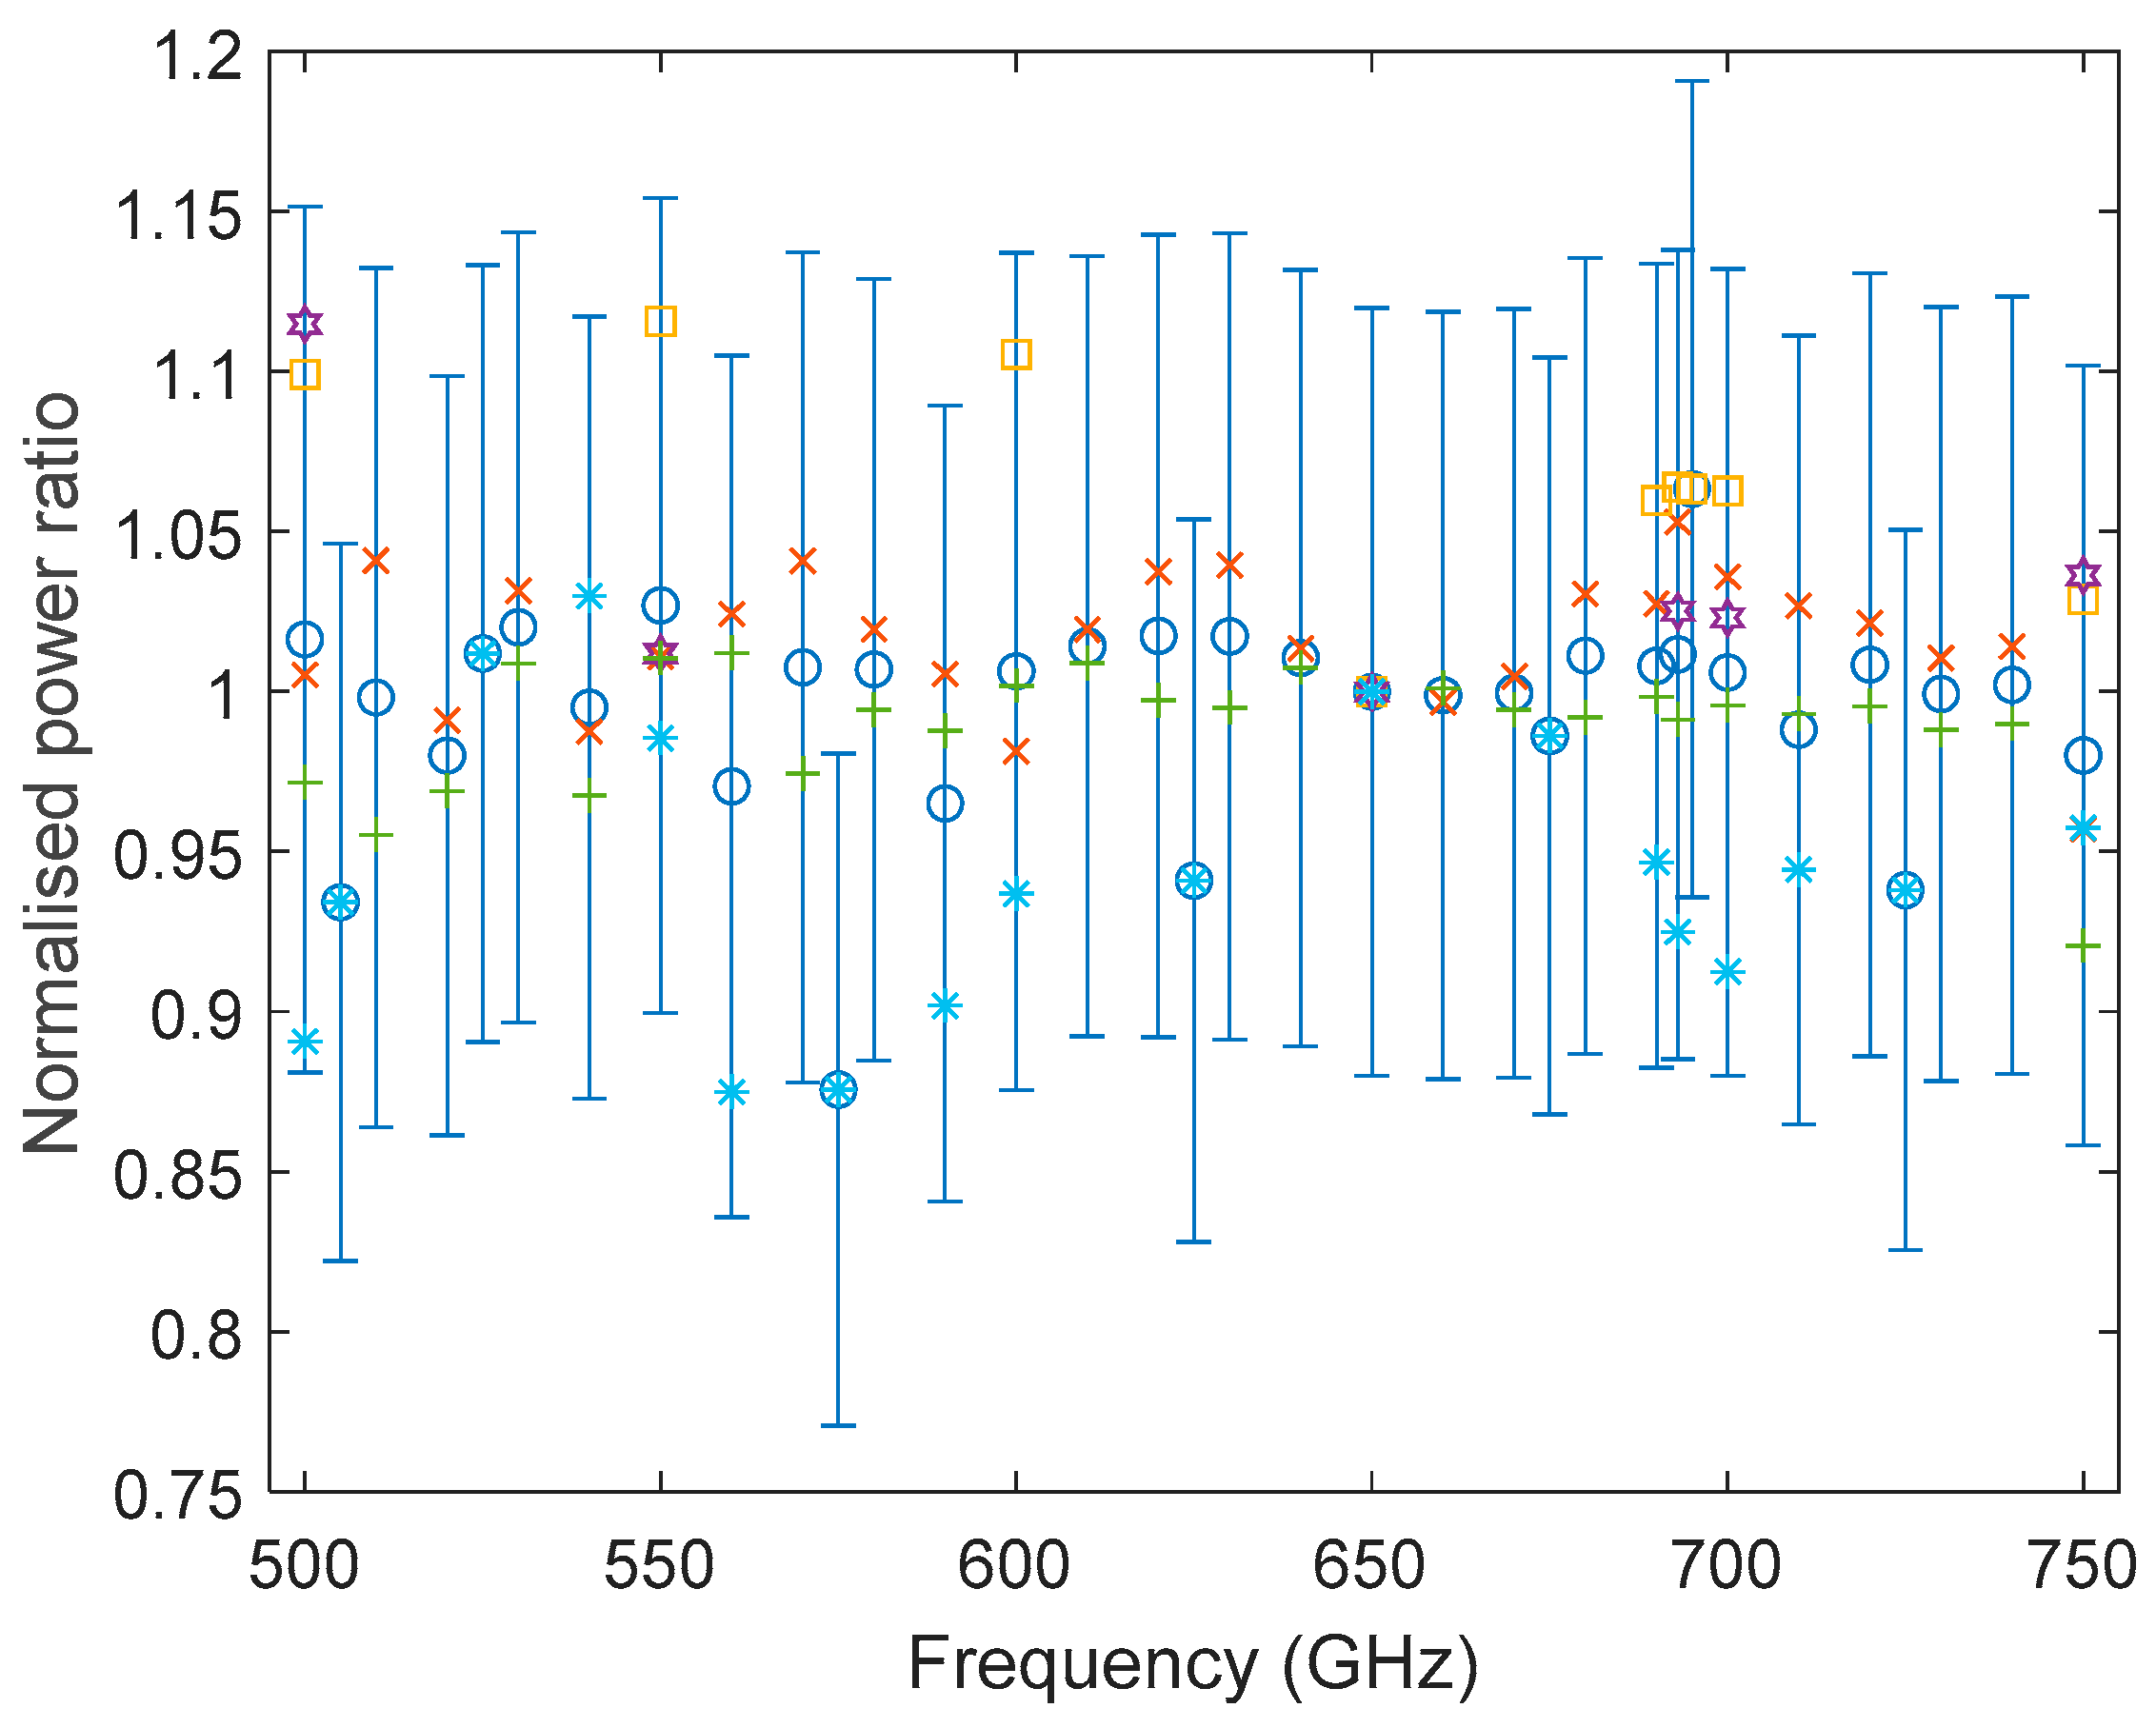

| Frequency (GHz) | PTB | NPL | TUBITAK UME |
|---|---|---|---|
| 110 | 0.08 | −0.10 | −0.94 |
| 115 | 0.17 | −0.11 | −0.53 |
| 120 | −0.11 | 0.08 | −0.47 |
| 125 | −0.04 | 0.03 | −0.68 |
| 130 | −0.05 | 0.03 | −0.83 |
| 135 | 0.07 | −0.06 | −0.63 |
| 140 | 0.08 | −0.07 | −0.65 |
| 145 | 0.03 | −0.02 | −1.15 |
| 150 | −0.04 | 0.04 | 0.00 |
| 155 | −0.16 | 0.13 | −0.47 |
| 160 | −0.30 | 0.25 | −0.80 |
| 165 | −0.39 | 0.35 | −0.80 |
| 170 | −0.02 | 0.01 | −1.50 |
Disclaimer/Publisher’s Note: The statements, opinions and data contained in all publications are solely those of the individual author(s) and contributor(s) and not of MDPI and/or the editor(s). MDPI and/or the editor(s) disclaim responsibility for any injury to people or property resulting from any ideas, methods, instructions or products referred to in the content. |
© 2024 by the authors. Licensee MDPI, Basel, Switzerland. This article is an open access article distributed under the terms and conditions of the Creative Commons Attribution (CC BY) license (https://creativecommons.org/licenses/by/4.0/).
Share and Cite
Celep, M.; Stokes, D.; Danacı, E.; Ziadé, F.; Zagrajek, P.; Wojciechowski, M.; Phung, G.N.; Kuhlmann, K.; Kazemipour, A.; Durant, S.; et al. Interlaboratory Comparison of Power Measurements at Millimetre- and Sub-Millimetre-Wave Frequencies. Metrology 2024, 4, 279-294. https://doi.org/10.3390/metrology4020017
Celep M, Stokes D, Danacı E, Ziadé F, Zagrajek P, Wojciechowski M, Phung GN, Kuhlmann K, Kazemipour A, Durant S, et al. Interlaboratory Comparison of Power Measurements at Millimetre- and Sub-Millimetre-Wave Frequencies. Metrology. 2024; 4(2):279-294. https://doi.org/10.3390/metrology4020017
Chicago/Turabian StyleCelep, Murat, Daniel Stokes, Erkan Danacı, François Ziadé, Przemysław Zagrajek, Marcin Wojciechowski, Gia Ngoc Phung, Karsten Kuhlmann, Alireza Kazemipour, Steven Durant, and et al. 2024. "Interlaboratory Comparison of Power Measurements at Millimetre- and Sub-Millimetre-Wave Frequencies" Metrology 4, no. 2: 279-294. https://doi.org/10.3390/metrology4020017
APA StyleCelep, M., Stokes, D., Danacı, E., Ziadé, F., Zagrajek, P., Wojciechowski, M., Phung, G. N., Kuhlmann, K., Kazemipour, A., Durant, S., Hesler, J., Instone, I., Sakarya, H., Allal, D., Rühaak, J., Skinner, J., & Stalder, D. (2024). Interlaboratory Comparison of Power Measurements at Millimetre- and Sub-Millimetre-Wave Frequencies. Metrology, 4(2), 279-294. https://doi.org/10.3390/metrology4020017