Article

Performance Evaluation of Instrument-Based SARS-CoV-2 Rapid Antigen Fluorescent Immunoassays for Point-of-Care Detection


1
Wits Diagnostic Innovation Hub, Faculty of Health Science, University of the Witwatersrand, Johannesburg 2050, South Africa
2
National Priority Program, National Health Laboratory Service, Johannesburg 2131, South Africa
*
Author to whom correspondence should be addressed.
COVID 2026, 6(5), 78; https://doi.org/10.3390/covid6050078
Submission received: 30 March 2026 / Revised: 16 April 2026 / Accepted: 20 April 2026 / Published: 30 April 2026
(This article belongs to the Special Issue Coronaviruses: Variants, Antivirals, and Vaccination)

Abstract

Rapid antigen tests targeting SARS-CoV-2 nucleocapsid protein were essential for decentralised testing during the COVID-19 pandemic. Independent performance evaluations are essential to support regulatory approval and inform clinical implementation, particularly in resource-limited settings. This study presents a retrospective analytical and operational evaluation of two instrument-based fluorescent immunoassays (FIAs): the PCL COVID-19 Ag Rapid FIA and LumiraDx SARS-CoV-2 Ag Test. Analytical sensitivity was determined using recombinant nucleocapsid protein and viral cultures. Clinical performance was assessed using residual clinical specimens (n = 110) with RT-PCR as a reference, stratified by cycle threshold (Ct). Operational characteristics were assessed using a structured Likert framework. Overall sensitivity was 63% (51–73) for PCL and 95% (88–99) for LumiraDx. For Ct ≤ 25, sensitivity increased to 93% and 100%. Specificity was ≥97% for both. LumiraDx maintained sensitivity (83–94%) at Ct 25–30, whereas PCL did not detect any positives in this range. The limit of detection was 39 pM (PCL) and 0.6 pM (LumiraDx). Operational usability was high for both (90% PCL, 87% LumiraDx). LumiraDx showed higher analytical sensitivity across a broader viral load range, supporting primary diagnostic use, whereas PCL was limited to high viral loads. This evaluation provides a reproducible framework for rapid diagnostic assessment during emerging outbreaks.

1. Introduction

The emergence of severe acute respiratory syndrome coronavirus 2 (SARS-CoV-2) in 2019 placed unprecedented strain on global diagnostic systems, often exceeding the capacity of centralised molecular testing platforms. Although more than 779 million cases have been confirmed through laboratory testing worldwide [1], seroprevalence studies indicate that the true level of population exposure is much higher [2,3]. This discrepancy highlights limitations in testing accessibility and capacity, especially during the early phases of the pandemic. Low- and middle-income countries experienced significant challenges in scaling up reverse transcription polymerase chain reaction (RT-PCR) testing, including limited laboratory infrastructure, supply chain disruptions, and critical global shortages [4,5]. These constraints emphasised the need for alternative diagnostic approaches that could be rapidly deployed outside of centralised laboratory settings.
Rapid antigen tests targeting the conserved nucleocapsid (N) protein emerged as a key solution for decentralised testing. These assays enabled rapid clinical decision-making, patient triage, and large-scale community screening [6,7]. The global diagnostics landscape expanded rapidly, with over 1000 antigen-based assays developed across multiple platforms [8]. In response, regulatory bodies such as the U.S. Food and Drug Administration (FDA), the European Commission, and the World Health Organization (WHO) established emergency use pathways and performance guidelines [9,10,11] to facilitate rapid deployment [12]. Minimum performance criteria typically included ≥80% sensitivity and ≥97% specificity [13], alongside operational requirements such as ease of use, short turnaround time (≤30 min), and suitability for point-of-care implementation.
The South African Health Products Regulatory Authority (SAHPRA) received numerous SARS-CoV-2 antigen rapid test applications under emergency use conditions. Among these were assays based on fluorescent immunoassay (FIA) technology, which requires instrument-based result interpretation. While conventional lateral flow immunochromatographic assays offer advantages in cost and simplicity, they are limited by subjective visual interpretation and manual data capture, increasing the risk of user-dependent variability [14,15]. In contrast, instrument-based FIAs provide automated signal detection, standardised result interpretation, and integrated data management capabilities, supporting improved accuracy and digital health integration [16].
Despite manufacturer-reported performance data, independent evaluations remain essential to verify diagnostic accuracy under local conditions and to inform regulatory decision-making. Variability in assay performance across different settings, specimen types, and viral load distributions necessitates context-specific validation.
In this study, we present a retrospective performance evaluation of two instrument-based FIAs: the PCL COVID-19 Ag Rapid FIA (PCL Inc., Seoul, Republic of Korea) and the LumiraDx SARS-CoV-2 Ag Test (LumiraDx Ltd., London, UK). We evaluated analytical sensitivity using recombinant protein and viral culture and evaluated clinical performance using residual clinical specimens stratified by RT-PCR Ct values. In addition, operational characteristics were assessed using a structured framework to determine suitability for point-of-care deployment. Key characteristics of the evaluated assays are summarised in Table 1.

2. Materials and Methods

2.1. SARS-CoV-2 Purified Recombinant Protein Panel

Purified recombinant SARS-CoV-2 wild-type N protein (419 amino acids; GenBank MN908947.3) with a C-terminal BCCP (biotin carboxyl carrier protein) tag (total molecular weight ~60.68 kDa; native untagged N protein = ~45.6 kDa) was provided by Prof. Jonathan Blackburn (University of Cape Town, South Africa). The protein was expressed in a baculovirus expression system using KREX™ functional proteomics technology (Sengenics Co Pte Ltd., Cambridge, UK; Product Code 39501P, Lot 320001). The BCCP tag adds ~15 kDa to the native N protein but does not interfere with antibody recognition of the nucleocapsid epitopes. To determine the limit of detection (LoD) for each assay, N protein concentrations ranging from 10 nM to 0.15 pM were prepared in manufacturer-specific assay buffers. Each concentration was tested in duplicate according to the respective manufacturer’s instructions. The LoD was defined as the lowest concentration producing a positive result in both replicates.

2.2. SARS-CoV-2 Viral Culture Panel

A SARS-CoV-2 wild-type viral culture (2019-nCoV strain) was obtained through collaborators in South Africa (Prof. Wolfgang Preiser, Stellenbosch University; Prof. Bavesh Kana, University of the Witwatersrand). Viral stock was semi-quantified using reference RNA material (~log 5 viral copies/µL). Two dilutions (1 × 10³ and 1 × 10⁴) were prepared, corresponding to approximately log 5.9 viral copies/mL and log 4.7 viral copies/mL, respectively, following previously described methods [17]. Each dilution was mixed 1:1 with the respective assay buffer and tested according to manufacturer instructions. Parallel RT-PCR testing was performed using the TaqPath™ COVID-19 CE-IVD RT-PCR Kit on the QuantStudio platform (ThermoFisher Scientific, Waltham, MA, USA) to obtain corresponding Ct values.

2.3. Residual Clinical Specimen Evaluation Panels

Residual nasopharyngeal clinical specimens were obtained from routine SARS-CoV-2 RT-PCR testing at the HIV Molecular Laboratory of the National Health Laboratory Service, Charlotte Maxeke Johannesburg Academic Hospital, Johannesburg, South Africa. Ethics approval for use of residual specimens was granted by the University of the Witwatersrand Human Research Ethics Committee (approval #M1911201). Swabs were received at the testing laboratory and processed in phosphate-buffered saline (PBS), saline, viral transport medium (VTM), or universal transport medium (UTM), and tested using the cobas® SARS-CoV-2 platform (Roche Molecular, Pleasanton, CA, USA). Specimens were stratified based on Ct values into high viral load (HVL; Ct ≤ 25), medium viral load (MVL; Ct 25–30), low viral load (LVL; Ct 30–35), and SARS-CoV-2 negatives. A total of 110 specimens were evaluated per assay panel. Panel composition and specimen distribution are summarised in Table 2.
Due to the use of residual clinical specimens, (received in various transport media rather than fresh swab collection), modifications to manufacturer protocols were required. Three specimen preparation methods were evaluated. Method A: Simulated swab protocol—a sterile swab (provided with test kits) was immersed in the residual specimen for approximately 1 min before processing according to manufacturer instructions; Method B: Direct 1:1 dilution of residual specimen in assay buffer prior to testing; Method C: Serial dilution of specimens (1:2–1:9) in assay buffer. For LumiraDx, a 1:7 dilution was selected based on manufacturer guidance and used for final analysis. Key procedural parameters for both assays (specimen volume, incubation time, instrument readout) are summarised in Table 1. Full step-by-step instructions are available in the manufacturer’s IFU. A detailed description of the operational workflow has been previously published [17], and a graphical overview of the specimen preparation methods and assay workflows is provided in Supplementary Figure S1.
Although the assays were evaluated using different specimen panels, both evaluations applied the same Ct range, and each assay was evaluated alongside other SARS-CoV-2 antigen assays received for evaluation (dependent on the available residual specimen volume). To verify panel integrity, consensus false-positive or false-negative results were removed from data analysis. For the PCL evaluation (tested alongside 3 other Ag assays), 3 HVL and 3 MVL specimens were excluded. For the LumiraDx evaluation (tested alongside 5 other Ag assays), 1 HVL and 3 MVL specimens were excluded from analysis. In all cases, excluded specimens were replaced with new residual clinical specimens of equivalent Ct value.

2.4. Precision Analysis

Intra-assay precision was assessed using quintuplicate testing of four residual clinical specimens (two SARS-CoV-2 positive with Ct < 30 and two negative). Each specimen was tested five times within a single day (total n = 20 per assay).

2.5. Statistical Analysis

Diagnostic performances were calculated using STATA version 14 (StataCorp LLC, College Station, TX, USA). Sensitivity (proportion of RT-PCR positives correctly identified by the antigen test) and specificity (proportion of RT-PCR negatives correctly identified) were calculated with 95% confidence intervals (CIs) using the exact binomial method. Positive predictive value (PPV) and negative predictive value (NPV) were calculated based on the observed prevalence in the specimen panel and are reported as panel-dependent estimates. Cohen’s kappa coefficient (κ) measured agreement between the antigen test and RT-PCR beyond chance and was interpreted using the Landis and Koch scale: poor (<0.2), fair (0.2–0.4), moderate (0.4–0.6), good (0.6–0.8), and very good (0.8–1.0).
Operational characteristics were evaluated using a structured 5-point Likert scale (1 = very poor/difficult; 5 = very good/easy) [18], across the following domains: (i) kit contents ready for implementation (including protective materials and consumables); (ii) biosafety requirements (safe use without specialised facilities); (iii) training complexity (standard procedure, no specialised skills); (iv) ease of use from specimen collection to result interpretation; (v) time to result (acceptable ≤ 40 min, optimal ≤ 20 min); and (vi) invalid/error rate (acceptable ≤ 5%). Scoring was performed by laboratory operators following completion of assay evaluations.

3. Results

3.1. Performance Using Reference Materials

The analytical performance of the PCL and LumiraDx SARS-CoV-2 antigen assays was first evaluated using the viral culture and purified recombinant nucleocapsid protein. Both assays successfully detected the SARS-CoV-2 viral culture at a dilution of 1 × 10³ (~log 5.9 viral copies/mL), corresponding to RT-PCR Ct values ≤ 25. Neither assay detected the lower-concentration dilution (1 × 10⁴; ~log 4.8 viral copies/mL), which corresponds to Ct values ranging from 25 to 28 (Table 3a).
Using purified recombinant N protein, the LoD differed substantially between assays. The PCL assay demonstrated an LoD of 39 pM, whereas the LumiraDx assay detected concentrations as low as 0.6 pM, indicating a higher analytical sensitivity (Table 3b).

3.2. Performance Using Residual Clinical Specimens

A total of 110 residual clinical specimens were evaluated for each assay. Compared to RT-PCR, the overall diagnostic sensitivity (95% CI) was 63% (51–73) for the PCL assay and 95% (88–99) for the LumiraDx assay (Table 4). Specificity was 100% (88–100) for PCL and 97% (83–100) for LumiraDx.
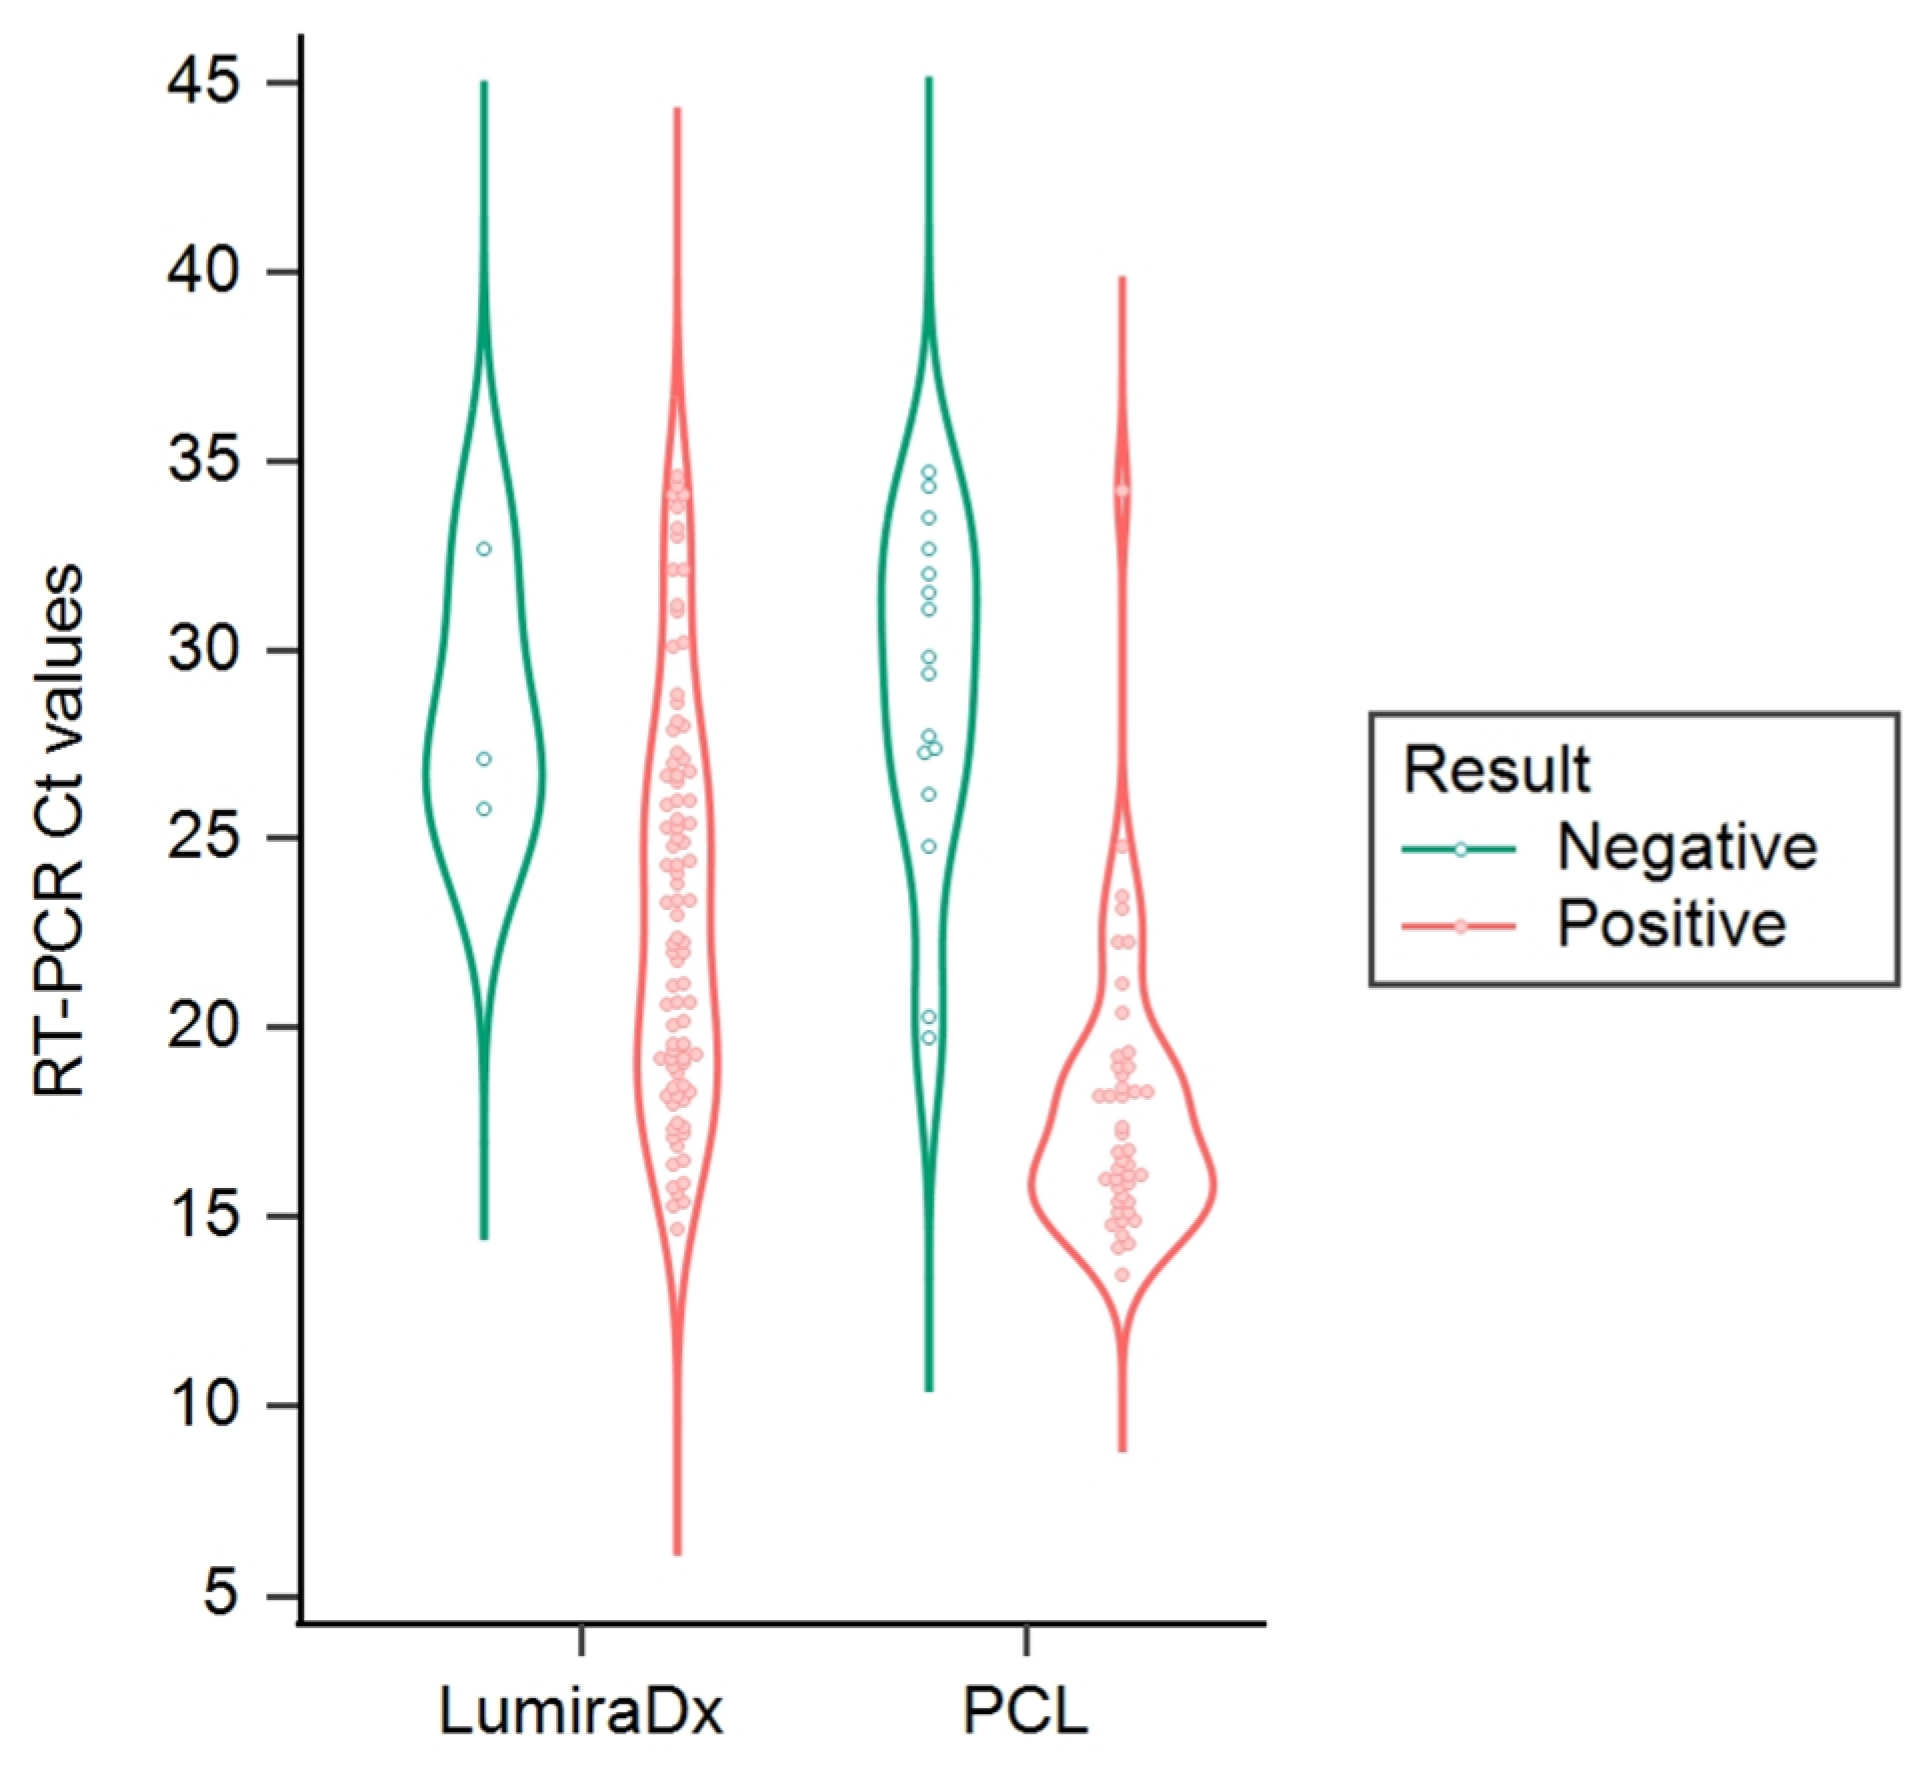
Stratification by viral load demonstrated a strong dependence of assay sensitivity on Ct values. For HVL specimens (Ct ≤ 25), sensitivity increased to 93% (82–98) for PCL (Method B) and reached 100% (92–100) for LumiraDx across both evaluated methods. In the MVL range (Ct 25–30), performance varied substantially between assays. LumiraDx maintained high sensitivity, achieving 83% using Method A and 94% using Method C, whereas the PCL assay did not detect any positive specimens within this Ct range. For LVL specimens (Ct 30–35), LumiraDx retained moderate detection capability (65–85%, depending on the method), whereas PCL performance remained limited. The distribution of antigen test results in relation to Ct values is presented in Figure 1.

3.3. Precision

Intra-assay precision was high for both assays. All positive and negative specimens (100%) were correctly classified across quintuplicate testing, demonstrating excellent repeatability. Additionally, LumiraDx quality controls and reference panel specimens (MRNDx) produced results consistent with manufacturer specifications.

3.4. Operational Performance

Operational performance, assessed using a structured Likert scale, yielded high overall scores for both assays: 90% (27/30) for PCL and 87% (26/30) for LumiraDx (Table 5). Both assays scored highly for ease of use, minimal training requirements, and rapid time to result. However, workflow limitations were noted. Instrument-based processing in single-read mode increased total turnaround time for both platforms. The LumiraDx system occasionally generated “insufficient sample volume” errors despite adequate sample application, contributing to a slightly lower score for invalid/error rate.

4. Discussion

This study presents a structured, independent evaluation of two instrument-based SARS-CoV-2 antigen tests conducted during a public health emergency. Using a standardised framework that includes analytical, clinical, and operational components, we demonstrate that while both assays meet minimum performance thresholds for HVL detection, their diagnostic utility differs substantially across viral load ranges.
Both assays achieved high sensitivity in specimens with Ct ≤ 25, which corresponds to peak viral load and the period of high infectiousness. This finding aligns with established data reporting that antigen test sensitivity is highest during early infection when viral replication is at its peak [19]. Reliable detection within this range supports the use of both assays for identifying individuals most likely to transmit infection [20,21], reinforcing their role in rapid clinical triage and outbreak response.
However, a key difference between the assays occurred at lower viral loads. The LumiraDx assay maintained high sensitivity (83–94%) in the MVL range (Ct 25–30), whereas the PCL assay failed to detect specimens within this category. This difference is clinically important, as individuals within this Ct range may still contribute to transmission, especially during the early or recovery phase [22,23]. The ability to detect these cases enhances the utility of antigen testing beyond detecting only highly infectious individuals.
The observed differences in clinical performance align with the analytical sensitivity results from this study. The approximately two-log difference in LoD between assays (0.6 pM for LumiraDx vs. 39 pM for PCL) likely explains the improved performance of the LumiraDx platform at lower antigen concentrations. This increased sensitivity can be attributed to differences in assay design. The LumiraDx system employs a microfluidic platform with controlled sample processing and enhanced signal detection, whereas the PCL assay utilises a lateral flow format, which is more prone to matrix effects [24] and reduced sensitivity at low antigen levels.
These findings are consistent with previous studies evaluating SARS-CoV-2 antigen tests. Prior evaluations of lateral flow assays have reported sensitivities ranging from approximately 50 to 90%, with performance highly dependent on viral load, and the highest sensitivity observed at Ct ≤ 25 [25,26]. In contrast, instrument-based assays, including LumiraDx, have consistently demonstrated higher sensitivity and better correlation with viral culture positivity [27]. Meta-analyses have also identified LumiraDx as being among the highest-performing antigen platforms [28], supporting the advantages of signal amplification and standardised detection.
The relationship between Ct value and antigen test positivity observed in this study further supports the use of Ct as a proxy for infectiousness [19]. The consistent detection of specimens with Ct ≤ 25 by both assays, along with the absence of detection at higher Ct values, reflects the biological relationship between viral load and antigen availability.
Beyond diagnostic accuracy, both assays demonstrated strong operational performance, confirming their suitability for decentralised testing. High scores for ease of use, minimal training needs, and quick turnaround times align with key criteria for point-of-care deployment. However, workflow limitations were noted. Both platforms operate in a single-read mode, which may limit throughput during high-demand periods. Additionally, the occurrence of “insufficient sample volume” errors with the LumiraDx system highlights the importance of operator training and system optimisation in real-world use.
An advantage of the LumiraDx platform is its ability to perform multiple tests, enabling the combination of infectious and non-communicable disease testing on a single device. This broadens its usefulness beyond just COVID-19 and encourages long-term integration into diagnostic networks, especially in resource-limited environments where platform flexibility is essential.
This study has several limitations. The lack of clinical metadata prevented analysis based on symptom duration or disease severity, which are known to impact viral dynamics and test performance. The use of multiple transport media may have influenced antigen stability and assay sensitivity. The assays were evaluated with different specimen panels, limiting direct comparison, though stratification by Ct values mitigated this constraint. Variant-specific performance was not systematically examined; however, using N protein targets decreases the chance of performance variation across variants. The use of residual clinical specimens required protocol adjustments, which might not fully reflect performance under manufacturer-recommended conditions. Lastly, limited sample sizes within stratified analyses could affect the precision of subgroup estimates.
Despite these limitations, this study offers a strong and reproducible framework for rapid diagnostic evaluation. The combined use of recombinant protein, viral culture, and clinical specimens allowed for a thorough assessment of both analytical and clinical performance. Stratification by Ct value provided clinically relevant insights into how the assay performs at different stages of infection, while a structured operational assessment highlighted practical considerations for implementation.
Importantly, these findings highlight the need for independent, context-specific evaluation within national regulatory processes. The variability in performance between assays with similar intended uses highlights the limitations of relying solely on manufacturer-reported data. Although the COVID-19 diagnostic landscape has evolved since these assays were evaluated, with the emergence of multiplex molecular and antigen tests and updated instrument platforms, the evaluation framework presented here remains directly applicable to future outbreak responses. It is platform-agnostic, scalable, and adaptable, supporting rapid assessment of diagnostic technologies during future infectious disease outbreaks.

5. Conclusions

Both evaluated SARS-CoV-2 antigen assays met the minimum performance criteria for detecting HVL infections, supporting their utility in identifying individuals at peak infectiousness. However, the LumiraDx assay showed higher sensitivity across a broader viral load range, including clinically relevant MVL specimens, supporting its use in near-patient diagnostic settings. Conversely, the PCL assay showed limited sensitivity beyond HVL specimens, indicating that its suitability may be restricted to targeted screening strategies focused on highly infectious individuals. Instrument-based antigen assays offer important advantages over traditional lateral flow tests, including standardised result interpretation, reduced operator variability, and integration with digital health systems. Additionally, the multi-analyte capability of the LumiraDx platform enhances its long-term value by enabling broader diagnostic applications beyond COVID-19. The evaluation framework described in this study provides a practical and reproducible method for rapid diagnostic validation during public health emergencies. Incorporation of such standardised evaluation strategies into regulatory pathways will support the timely implementation of fit-for-purpose diagnostic technologies in resource-limited settings.

Supplementary Materials

The following supporting information can be downloaded at https://www.mdpi.com/article/10.3390/covid6050078/s1. Figure S1: Graphical workflow of specimen preparation methods and assay procedures for PCL COVID-19 Ag Rapid FlA and LumiraDx SARS-CoV-2 Ag Test.

Author Contributions

Conceptualization, V.K. and L.S.; methodology, V.K.; software, V.K.; validation, V.K.; formal analysis, V.K.; investigation, L.S. and W.S.; resources, L.H.; data curation, V.K.; writing—original draft preparation, V.K.; writing—review and editing, L.S., L.H. and W.S.; funding acquisition, W.S. All authors have read and agreed to the published version of the manuscript.

Funding

Financial support for this study was provided by the Gates Foundation through the Innovation in Laboratory Engineered Accelerated Diagnostics investment (grant number INV-006726) and Clinical Feasibility (grant number INV-051718).

Institutional Review Board Statement

Ethical approval was granted by the University of the Witwatersrand Human Research Ethics Committee (approval #M1911201, 28 January 2020).

Informed Consent Statement

Informed consent was not required as this study used residual de-identified specimens, and the use of these specimens for research was approved by the Institutional Review Board (approval #M1911201).

Data Availability Statement

All relevant data are presented within the manuscript. No publicly archived datasets were generated or analysed during this study.

Acknowledgments

We acknowledge Annie Chan for assistance with preparing the graph for this study.

Conflicts of Interest

The authors declare no conflicts of interest.

References

  1. World Health Organization. Coronavirus Disease (COVID-19) Fact Sheet. 2023. Available online: https://www.who.int/news-room/fact-sheets/detail/coronavirus-disease-(covid-19) (accessed on 15 June 2023).
  2. Bergeri, I.; Whelan, M.G.; Ware, H.; Subissi, L.; Nardone, A.; Lewis, H.C.; Li, Z.; Ma, X.; Valenciano, M.; Cheng, B. Global SARS-CoV-2 seroprevalence from January 2020 to April 2022: A systematic review and meta-analysis of standardized population-based studies. PLoS Med. 2022, 19, e1004107. [Google Scholar]
  3. Rostami, A.; Sepidarkish, M.; Leeflang, M.M.; Riahi, S.M.; Shiadeh, M.N.; Esfandyari, S.; Mokdad, A.H.; Hotez, P.J.; Gasser, R.B. SARS-CoV-2 seroprevalence worldwide: A systematic review and meta-analysis. Clin. Microbiol. Infect. 2021, 27, 331–340. [Google Scholar] [CrossRef] [PubMed]
  4. Duroseau, B.; Kipshidze, N.; Limaye, R.J. The impact of delayed access to COVID-19 vaccines in low-and lower-middle-income countries. Front. Public Health 2023, 10, 1087138. [Google Scholar] [CrossRef] [PubMed]
  5. Patwary, M.M.; Alam, M.A.; Bardhan, M.; Disha, A.S.; Haque, M.Z.; Billah, S.M.; Kabir, M.P.; Browning, M.H.; Rahman, M.M.; Parsa, A.D. COVID-19 vaccine acceptance among low-and lower-middle-income countries: A rapid systematic review and meta-analysis. Vaccines 2022, 10, 427. [Google Scholar] [CrossRef] [PubMed]
  6. Dutta, N.K.; Mazumdar, K.; Gordy, J.T. The nucleocapsid protein of SARS-CoV-2: A target for vaccine development. J. Virol. 2020, 94, e00647-20. [Google Scholar] [PubMed]
  7. Zeng, W.; Liu, G.; Ma, H.; Zhao, D.; Yang, Y.; Liu, M.; Mohammed, A.; Zhao, C.; Yang, Y.; Xie, J. Biochemical characterization of SARS-CoV-2 nucleocapsid protein. Biochem. Biophys. Res. Commun. 2020, 527, 618–623. [Google Scholar] [CrossRef] [PubMed]
  8. FIND. SARS-CoV-2 Dx Connect Test Directory. 2023. Available online: https://finddx.shinyapps.io/testdirexplorer_beta/?_inputs_&sidebar=true&menubar=%22Explorer%22&button_outbreak=1 (accessed on 12 April 2024).
  9. Department of Health (DoH) South Africa. Guide to Antigen Testing for SARS-CoV-2 in South Africa; National Department of Health: Pretoria, South Africa, 2021.
  10. World Health Organization. SARS-CoV-2 Antigen-Detecting Rapid Diagnostic Tests: An Implementation Guide; World Health Organization: Geneva, Switzerland, 2021. [Google Scholar]
  11. Centers for Disease Control and Prevention. Guidance for Antigen Testing for SARS-CoV-2 for Healthcare Providers Testing Individuals in the Community. 2022. Available online: https://archive.cdc.gov/#/details?q=https://www.cdc.gov/coronavirus/2019-ncov/lab/resources/antigen-tests-guidelines.html&start=0&rows=10&url=https://www.cdc.gov/coronavirus/2019-ncov/lab/resources/antigen-tests-guidelines.html (accessed on 12 January 2023).
  12. In Vitro Diagnostics EUAs—Antigen Diagnostic Tests for SARS-CoV-2. 2023. Available online: https://www.fda.gov/medical-devices/coronavirus-disease-2019-covid-19-emergency-use-authorizations-medical-devices/in-vitro-diagnostics-euas-antigen-diagnostic-tests-sars-cov-2 (accessed on 12 January 2023).
  13. World Health Organization. Antigen-Detection in the Diagnosis of SARS-CoV-2 Infection Using Rapid Immunoassays; World Health Organization: Geneva, Switzerland, 2020. [Google Scholar]
  14. Kumar, V.; Ghosh, K.; Chandran, A.; Panwar, S.; Bhat, A.; Konaje, S.; Das, S.; Srikanta, S.; Jaganathan, L.; Prasad, S. Multicentric evaluation of a novel point of care electrochemical ELISA platform for SARS-CoV-2 specific IgG and IgM antibody assay. J. Virol. Methods 2021, 298, 114275. [Google Scholar] [CrossRef] [PubMed]
  15. Wong, R.; Tse, H. Lateral Flow Immunoassay; Springer Science & Business Media: New York, NY, USA, 2008. [Google Scholar]
  16. Kinnamon, D.S.; Heggestad, J.T.; Liu, J.; Chilkoti, A. Technologies for Frugal and Sensitive Point-of-Care Immunoassays. Annu. Rev. Anal. Chem. 2022, 15, 123–149. [Google Scholar] [CrossRef] [PubMed]
  17. Keshav, V.; Scott, L.; David, A.; Noble, L.; Mayne, E.; Stevens, W. Antigen-Based Point of Care Testing (POCT) for Diagnosing SARS-CoV-2: Assessing Performance. In SARS-CoV-2; Springer: Berlin/Heidelberg, Germany, 2022; pp. 45–62. [Google Scholar]
  18. Likert, R. A technique for the measurement of attitudes. Arch. Psychol. 1932, 22, 55. [Google Scholar]
  19. Puhach, O.; Meyer, B.; Eckerle, I. SARS-CoV-2 viral load and shedding kinetics. Nat. Rev. Microbiol. 2023, 21, 147–161. [Google Scholar] [PubMed]
  20. Linares, M.; Pérez-Tanoira, R.; Carrero, A.; Romanyk, J.; Pérez-García, F.; Gómez-Herruz, P.; Arroyo, T.; Cuadros, J. Panbio antigen rapid test is reliable to diagnose SARS-CoV-2 infection in the first 7 days after the onset of symptoms. J. Clin. Virol. 2020, 133, 104659. [Google Scholar] [CrossRef] [PubMed]
  21. Nordgren, J.; Sharma, S.; Olsson, H.; Jämtberg, M.; Falkeborn, T.; Svensson, L.; Hagbom, M. SARS-CoV-2 rapid antigen test: High sensitivity to detect infectious virus. J. Clin. Virol. 2021, 140, 104846. [Google Scholar] [CrossRef] [PubMed]
  22. Rabaan, A.A.; Tirupathi, R.; Sule, A.A.; Aldali, J.; Mutair, A.A.; Alhumaid, S.; Muzaheed; Gupta, N.; Koritala, T.; Adhikari, R. Viral dynamics and real-time RT-PCR Ct values correlation with disease severity in COVID-19. Diagnostics 2021, 11, 1091. [Google Scholar] [CrossRef] [PubMed]
  23. Calistri, P.; Danzetta, M.; Amato, L. Epidemiological significance of SARS-CoV-2 RNA dynamic in naso-pharyngeal swabs. Microorganisms 2021, 9, 1264. [Google Scholar] [CrossRef] [PubMed]
  24. Mayfield, J.; Hesse, P.; Ledden, D. The Impact of Universal Transport Media and Viral Transport Media Liquid Samples on a SARS-CoV-2 Rapid Antigen Test. medRxiv 2021. [Google Scholar] [CrossRef]
  25. Jääskeläinen, A.; Ahava, M.J.; Jokela, P.; Szirovicza, L.; Pohjala, S.; Vapalahti, O.; Lappalainen, M.; Hepojoki, J.; Kurkela, S. Evaluation of three rapid lateral flow antigen detection tests for the diagnosis of SARS-CoV-2 infection. J. Clin. Virol. 2021, 137, 104785. [Google Scholar] [CrossRef]
  26. Diao, B.; Wen, K.; Zhang, J.; Chen, J.; Han, C.; Chen, Y.; Wang, S.; Deng, G.; Zhou, H.; Wu, Y. Accuracy of a nucleocapsid protein antigen rapid test in the diagnosis of SARS-CoV-2 infection. Clin. Microbiol. Infect. 2021, 27, 289.e1–289.e4. [Google Scholar] [CrossRef] [PubMed]
  27. Kohmer, N.; Toptan, T.; Pallas, C.; Karaca, O.; Pfeiffer, A.; Westhaus, S.; Widera, M.; Berger, A.; Hoehl, S.; Kammel, M. The comparative clinical performance of four SARS-CoV-2 rapid antigen tests and their correlation to infectivity in vitro. J. Clin. Med. 2021, 10, 328. [Google Scholar] [CrossRef] [PubMed]
  28. Brümmer, L.E.; Katzenschlager, S.; Gaeddert, M.; Erdmann, C.; Schmitz, S.; Bota, M.; Grilli, M.; Larmann, J.; Weigand, M.A.; Pollock, N.R. Accuracy of novel antigen rapid diagnostics for SARS-CoV-2: A living systematic review and meta-analysis. PLoS Med. 2021, 18, e1003735. [Google Scholar]
Figure 1. Distribution of positive and negative rapid antigen test results by RT-PCR Ct value (violin plot with jittered data points showing the distribution of positive (red) and negative (green) rapid antigen test results for both assays in relation to corresponding RT-PCR Ct values (y-axis)).
Covid 06 00078 g001
Table 1. Key features of the SARS-CoV-2 antigen assays evaluated in this study.
CharacteristicsPCL COVID-19 Ag Rapid FIALumiraDx SARS-CoV-2 Ag Test
Regulatory certification (at time of evaluation)TGA (30 July 2021)FDA EUA (18 December 2020)
Target populationSymptomatic individualsSymptomatic and asymptomatic individuals
Specimen type(s)Nasopharyngeal/oropharyngealNasal/nasopharyngeal
Format/designImmunosandwich lateral flow assayImmunosandwich microfluidic assay
Target SARS-CoV-2 proteinUndisclosedNucleocapsid protein
Sample volume applied to test cassette4 drops1 drop (~20 µL)
Result interpretationPCLOK EZ instrument, PCL Inc., Seoul, Republic of Korea LumiraDx instrument, LumiraDx Ltd., London, UK
Time to resultStandard mode: 10 min on-board incubation; quick mode: 10 min bench incubation + instrument read12 min after test strip insertion
Additional featuresOn-board printer; barcode scanning; USB data exportAutomated quality checks; RFID calibration; cloud-based connectivity; LIS integration
Manufacturer performance data *89% sensitivity and 99% specificity98% sensitivity and 97% specificity
* Obtained using fresh clinical specimens in accordance with the IFU. FIA—fluorescent immunoassay, SAHPRA—South African Health Products Regulatory Authority, TGA—Therapeutic Goods Administration, EUA—Emergency Use Authorisation, FDA—U.S. Food and Drug Administration, RFID—Radio Frequency Identification, LIS—Laboratory Information System.
Table 2. Description of the SARS-CoV-2 challenge panel materials.
MaterialDescription
SARS-CoV-2 purified recombinant N protein10 nM, 2.5 nM, 625 pM, 39 pM, 9.75 pM, 2.4 pM, 0.6 pM and 0.15 pM concentrations tested in duplicate
SARS-CoV-2 viral cultures1 × 103 and 1 × 10⁴ dilutions tested in triplicate and compared to RT-PCR
SARS-CoV-2 residual clinical specimensPCL COVID-19 Ag Rapid FIALumiraDx SARS-CoV-2 Ag Test
Collected: October–December 2020Collected: April–June 2021
N = 110N = 110
n = 53 HVL, n = 7 MVL, n = 20 LVL, n = 30 Negn = 42 HVL, n = 18 MVL, n = 20 LVL, n = 30 neg
Panel comprising SA wave 1 * specimensPanel comprising SA wave 1 and wave 2 * specimens
Methods appliedMethod A: Simulated swab into kit buffer, Method B: 1:1 dilution of specimen with kit bufferMethod A: Simulated swab into kit buffer; Method C: 1:7 dilution of specimen with kit buffer
* South African wave 1 was associated with a mix of SARS-CoV-2 lineages, whereas wave 2 comprised predominantly beta strains (B.1.351).
Table 3. Analytical performance of SARS-CoV-2 antigen assays using (a) viral cultures and (b) purified recombinant N protein.
(a) SARS-CoV-2 Viral Cultures (SA Wild-Type)
AssayDilution factorFIA resultNSORF1ab
PCL COVID-19 Ag Rapid FlA1 × 103Positive24.124.623.9
1 × 10⁴Negative27.227.927.1
LumiraDx SARS-CoV-2 Ag Test1 × 103Positive24.5924.0923.9
1 × 10⁴Negative27.8627.2327.13
(b) SARS-CoV-2 Purified Recombinant Nucleocapsid Proteins (SA Wild-Type)
Protein Concentration10 nM2.5 nM625 pM39 pM9.75 pM2.4 pM0.6 pM0.15 pM
PCL COVID-19 Ag Rapid FlAPositivePositivePositivePositiveNegativeNegativeNegativeNegative
LumiraDx SARS-CoV-2 Ag TestPositivePositivePositivePositivePositivePositivePositiveNegative
Table 4. Analytical performance of SARS-CoV-2 antigen assays on residual clinical specimens.
AssayMethodCt RangenSensitivity (95% CI)Specificity (95% CI)PPV (95% CI)NPV (95% CI)Cohen Kappa (95% CI)Agreement Score
PCL COVID-19 Ag Rapid FIAA and BOverall performance11063% (51–73)100% (88–100)100% (93–100)50% (37–63)0.48 (0.34–0.61)Moderate
ACt ≤ 2553 pos, 30 neg91% (79–97)100% (88–100)100% (93–100)86% (70–95)0.87 (0.77–0.98)Very Good
BCt ≤ 2553 pos, 30 neg93% (82–98)100% (88–100)100% (93–100)88% (73–97)0.89 (0.80–1.00)Very Good
A, BCt 25–307 pos, 30 negNo positives detected (0%)/All negatives correctly identified (100%)
A, BCt 30–3520 pos, 30 neg
LumiraDx SARS-CoV-2 Ag TestA and COverall performance11095% (88–99)97% (83–100)99% (93–100)88% (72–97)0.89 (0.79–0.98)Very Good
ACt ≤ 2542 pos, 30 neg100% (92–100)97% (83–100)98% (88–100)100% (88–100)0.97 (0.92–1.02)Very Good
ACt 25–3018 pos, 30 neg83% (59–96)97% (83–100)94% (70–100)91% (75–98)0.97 (0.92–1.03)Very Good
ACt 30–3520 pos, 30 neg65% (41–85)97% (83–100)93% (66–100)81% (64–92)0.82 (0.65–0.99)Very Good
CCt ≤ 2542 pos, 30 neg100% (92–100)97% (83–100)98% (88–100)100% (88–100)0.91 (0.80–1.03)Very Good
CCt 25–3018 pos, 30 neg94% (73–100)97% (83–100) 94% (73–100)97% (83–100)0.65 (0.43–0.87)Good
CCt 30–3520 pos, 30 neg85% (62–97)97% (83–100)94% (73–100)91% (75–98)0.83 (0.67–0.99)Very Good
Table 5. Operational performance of SARS-CoV-2 Ag assays.
CharacteristicPCL COVID-19 Ag Rapid FlALumiraDx SARS-CoV-2 Ag Test
Kit contents ready for implementation 44
Need for biosafety44
Training required55
Ease of use from specimen collection to result interpretation 4 *4 ‡
Time to result55
Invalid (error rate)54 †
Comments. * Testing time increased with single-read mode; ‡ testing time increased with single-read cartridge; † analyser displayed “sample error—insufficient volume” despite adequate coverage.
Disclaimer/Publisher’s Note: The statements, opinions and data contained in all publications are solely those of the individual author(s) and contributor(s) and not of MDPI and/or the editor(s). MDPI and/or the editor(s) disclaim responsibility for any injury to people or property resulting from any ideas, methods, instructions or products referred to in the content.