Article

Low Systemic IFN Response and High Viral Load Are Associated with COVID-19 Disease Severity in Unvaccinated Patients in Kenya, 2022–2023


1
Department of Pathology, School of Medicine, Moi University, Eldoret 4606-20100, Kenya
2
Department of Biomedical and Clinical Sciences, Division of Molecular Medicine and Virology, Linköping University, SE-581 83 Linköping, Sweden
*
Authors to whom correspondence should be addressed.
COVID 2026, 6(3), 51; https://doi.org/10.3390/covid6030051
Submission received: 19 February 2026 / Revised: 9 March 2026 / Accepted: 13 March 2026 / Published: 17 March 2026
(This article belongs to the Section COVID Clinical Manifestations and Management)

Abstract

The clinical severity of COVID-19 is influenced by cellular and humoral immune responses, as well as the dynamics of viral replication. In line with this, the current study examined systemic and mucosal immunity responses alongside viral load in unvaccinated SARS-CoV-2-infected individuals during the period of Omicron predominance. Between 2022 and 2023, when Omicron prevalence was at its peak, 48 SARS-CoV-2-positive cases with varied severity were recruited using positive PCR testing, and 48 negative controls were recruited using negative PCR testing at Moi Teaching and Referral Hospital, Kenya. Severe patients showed higher viral loads and systemic anti-spike IgG levels compared to moderate and asymptomatic individuals. Asymptomatic individuals had higher mucosal anti-spike IgG and receptor-binding domain (RBD) levels compared to severe patients. Systemic IFN-α mRNA transcripts were higher in asymptomatic individuals compared to patients with severe COVID-19 and healthy individuals. Severe patients had significantly lower expression of IFN-γ mRNA transcript levels in both blood and mucosa, as well as significantly lower systemic IFI-16 mRNA transcript levels. These findings reflect associations observed in a cross-sectional design and should not be interpreted as causal mechanisms. Suppressed interferon responses, both mucosal and systemic, were associated with severe disease. In conclusion, high systemic IgG and viral loads and low interferon responses were closely linked to severe COVID-19 outcomes.

1. Introduction

COVID-19 is caused by severe acute respiratory syndrome coronavirus, SARS-CoV-2, which is usually characterized by a moderate form of the disease, yet severe and life-threatening forms are also frequent [1,2]. Although significant progress has been made in understanding severe COVID-19, a comprehensive and globally applicable explanation of the risk factors predisposing individuals to severe disease, particularly in Sub-Saharan Africa, remains incomplete [1,3]. Interestingly, the viral kinetics and immunological responses to infection by the SARS-CoV-2 Omicron variant in unvaccinated individuals are poorly known. SARS-CoV-2 vaccines provide strong protection against severe COVID-19 across all known viral variants, including the Omicron lineage [4]. However, substantial global populations remain unvaccinated, underscoring the importance of clarifying the determinants of severe disease following Omicron infection in these populations [5].
The development of severe COVID-19 is associated with a set of host factors, such as old age and gender, and comorbidities, such as diabetes mellitus, high blood pressure, and respiratory, renal, liver, and cardiovascular illnesses [6]. Severe COVID-19 has furthermore been associated with viral load and antiviral immune responses, such as, in particular, antibody and type I and II interferon (IFN) responses [7]. Patients developing a more severe illness often present with higher nasopharyngeal SARS-CoV-2 RNA levels than patients developing milder disease [8,9].
Rapid induction of type I interferons (IFN-α and IFN-β) and the type II interferon IFN-γ is a prerequisite to successful host defense against viral pathogens. Upon viral invasion, type I IFNs activate a wide range of interferon-stimulated genes (ISGs), including the IFI-16 [10,11], with a complex of antiviral capabilities. Notably, type I IFNs seem to be central to reducing severe cases of COVID-19 [12], suggesting similar mechanisms may influence viral control during Omicron infection. Antiviral defense is further boosted by the release of IFN-γ and other cytokines secreted by activated T cells and the NK cells [13], which increases the strength of the host against serious disease. There are immunological hallmarks that differentiate between abortive/transient and persistent infection, which were identified; early mucosal IFN response is reported in mild cases [14].
By 2024, Kenya had recorded 344,130 confirmed COVID-19 cases and 5689 deaths [15]. To further understand risk factors that come with severe Omicron-mediated COVID-19, we designed a study to estimate the viral load, antibody titers, and innate immune response in 48 unvaccinated patients with a confirmed infection of SARS-CoV-2. Stratification of participants was based on disease severity, that is, asymptomatic, moderate, or severe, and they were recruited at the Moi Teaching and Referral Hospital (MTRH) in Eldoret, Kenya, between May 2022 and February 2023. SARS-CoV-2-RNA levels, antibody responses, and gene expression of IFN-α, IFN-β, IFN-γ, and IFI-16 were analyzed in samples.

2. Materials and Methods

2.1. Study Subjects and Sampling

A cohort comprising 48 COVID-19-diagnosed individuals at the Moi Teaching and Referral Hospital (MTRH) in Eldoret, Kenya, was included in the study, based on a cross-sectional and hospital-based study. The respondents were selected among the isolation units and the general wards of the hospital, and among the travelers who tested positive for SARS-CoV-2 in the MTRH testing center. A healthy control group of 48 people without a history of COVID-19 infection was also part of the control group.
The focus groups were stratified based on the clinical severity of their disease, i.e., the participants were organized into three different groups: asymptomatic (no medical attendance needed; n = 16), moderate (hospitalization needed, but not intensive care; n = 16), and severe (intensive care needed; n = 16). The time of enrollment was May 2022 through February of 2023, during which naso-pharyngeal (NP) and oropharyngeal (OP) swabs and blood samples were ordered to be analyzed.
A purposive sampling strategy was used in the study. The hospital recruited symptomatic patients prior to their admittance to the wards and the COVID-19 Isolation Center. Recruitment at the MTRH testing facility included asymptomatic travelers who tested positive for SARS-CoV-2. After meeting the eligibility criteria, every third COVID-19-positive patient and every fifth COVID-19-negative traveller were enrolled until a total of 48 study participants was reached.

2.2. Inclusion-Exclusion Criteria

The following three (3) requirements were met by the COVID-19 cases: a positive RT-qPCR SARS-CoV-2 test, clinical symptoms confirmed by a doctor, and the capability to participate, as assessed by the ability to agree. The COVID-19-negative group also exhibited a history of underlying diseases and negative RT-qPCR SARS-CoV-2 findings. The exclusion criteria included people who received a COVID-19 vaccination, pregnant women, and people with long-term illnesses, including HIV or tuberculosis. Non-communicable diseases such as diabetes mellitus, hypertension, asthma, and cardiac, renal, and hepatic issues were also incorporated in the exclusion process.

2.3. Viral Load Quantification

Samples (NP/OP; n = 48) were collected and stored at −80 °C until analysis. RNA isolation was done using the QIAamp Viral RNA Mini Kit (Qiagen, Hilden, Germany). cDNA synthesis was followed by quantification of RNA levels of SARS-CoV-2 by qPCR based on the use of a standard curve of a serially diluted plasmid [16], followed by the use of a CFX96 Real-Time PCR system (Bio-Rad, Stockholm, Sweden). Viral RNA quantification was performed using a standard curve generated from serial dilutions of a plasmid containing the SARS-CoV-2 E gene. Viral load was expressed as RNA copies per mL of swab transport medium. All samples were processed using identical RNA extraction and qPCR protocols to ensure consistency across groups.

2.4. Quantification of Type I IFN, Type II IFN, and IFI-16 mRNA Levels

The ISOLATE II RNA Mini kit (Meridian Bioscience, Cincinnati, OH, USA) was used to extract RNA from NP/OP swabs and blood. An integrated UV+FX/FX+DS-11FX/FX+spectrophotometer (Bio-Rad, Stockholm, Sweden) was utilized in the determination of RNA concentration (DeNovix, Wilmington, DE, USA). One microgram of RNA was subjected to reverse transcription with the iScript cDNA Synthesis Kit (Bio-Rad). IFN-α, IFN-β, IFN-γ, and IFI-16 primer sets were measured using IQ SYBR Green Supermix (Bio-Rad) on the CFX96 Real-Time PCR platform for each severity group. Gene expression levels were normalized to GAPDH and calculated using the 2−ΔΔCt method.

2.5. Quantification of SARS-CoV-2 Spike, Receptor-Binding Domain, and Nucleocapsid-Specific IgGs

According to manufacturer instructions, anti-spike, anti-receptor-binding domain (RBD), and anti-nucleocapsid IgG levels in NP/OP swabs and serum were determined using the V-Plex SARS-CoV-2 Panel 2 (Meso Scale Diagnostics, Rockville, MA, USA), using ten-fold serum dilutions.

2.6. Statistical Analysis

Frequencies and percentages were used to present categorical variables. Means + standard deviations (SDs) were used to give the continuously distributed variables with normal distributions, and medians with inter-quartile ranges (IQRs) with other non-normally distributed ones. Appropriate statistical tests were used, including Chi-square, unpaired t-test, Mann–Whitney U-test, one-way ANOVA, and Kruskal–Wallis, to compare the groups. The rank correlation coefficient, which was made by Spearman, was used to determine relationships among continuous variables. The Kruskal–Wallis tests and the pairwise tests were estimated with epsilon-squared (ε2) and Cohen’s d, respectively. To adjust the p-values so that they are adjusted to multiple testing controls across the many immune markers, the p-array underwent the Benjamini–Hochberg false-discovery-rate procedure. We used exploratory multivariate logistic regression analysis to reduce possible confounding factors caused by demographic and clinical characteristics. The models were also adjusted by age, sex, and major comorbidities (diabetes mellitus, chronic kidney disease (CKD), and asthma). Adjusted odds ratios (aORs) and confidence intervals (CIs) were calculated to determine whether the relationships between immune parameters and disease severity would remain after adjustment. All analyses were performed using GraphPad Prism 9.0 (GraphPad Software, La Jolla, CA, USA). The significance level of a p-value was taken to be less than 0.05.

3. Results

The moderate and severe COVID-19 groups and the asymptomatic group were matched well in terms of age and biological sex. There were no differences in body temperature between groups; moreover, the degree of oxygen saturation was much lower in severe COVID-19 patients than in the other groups (Table A1). Comorbid conditions were more prevalent among the patients with severe COVID-19 as compared to patients with moderately symptomatic and asymptomatic forms, including diabetes (50% vs. 37.5% vs. 18.75), liver diseases (50% vs. 37.5% vs. 50), pulmonary disease (25% vs. 25% vs. 12.5), chronic kidney disease (31.25% vs. 12.5% vs. 6.25), asthma (43.75% vs. 25% vs. 6.25%), and heart disease (25%vs. 18.75% vs. 18.75%). The timing of sample collection relative to symptom onset was evaluated across severity groups. Among symptomatic participants, samples were collected at a median of 6 days (IQR 4–8) after symptom onset. Moderate COVID-19 cases were sampled at a median of 5 days (IQR 3–7), whereas severe cases were sampled at 7 days (IQR 5–9) after symptom onset. Asymptomatic individuals were sampled at the time of PCR confirmation during screening. There was no statistically significant difference in sampling time between severity groups (Kruskal–Wallis p = 0.27). These findings indicate that the observed immune differences are unlikely to be explained solely by differences in sampling time.

3.1. Patients with Severe COVID-19 Had High Systemic Anti-SARS-CoV-2 IgG Titers Early After Symptom Onset

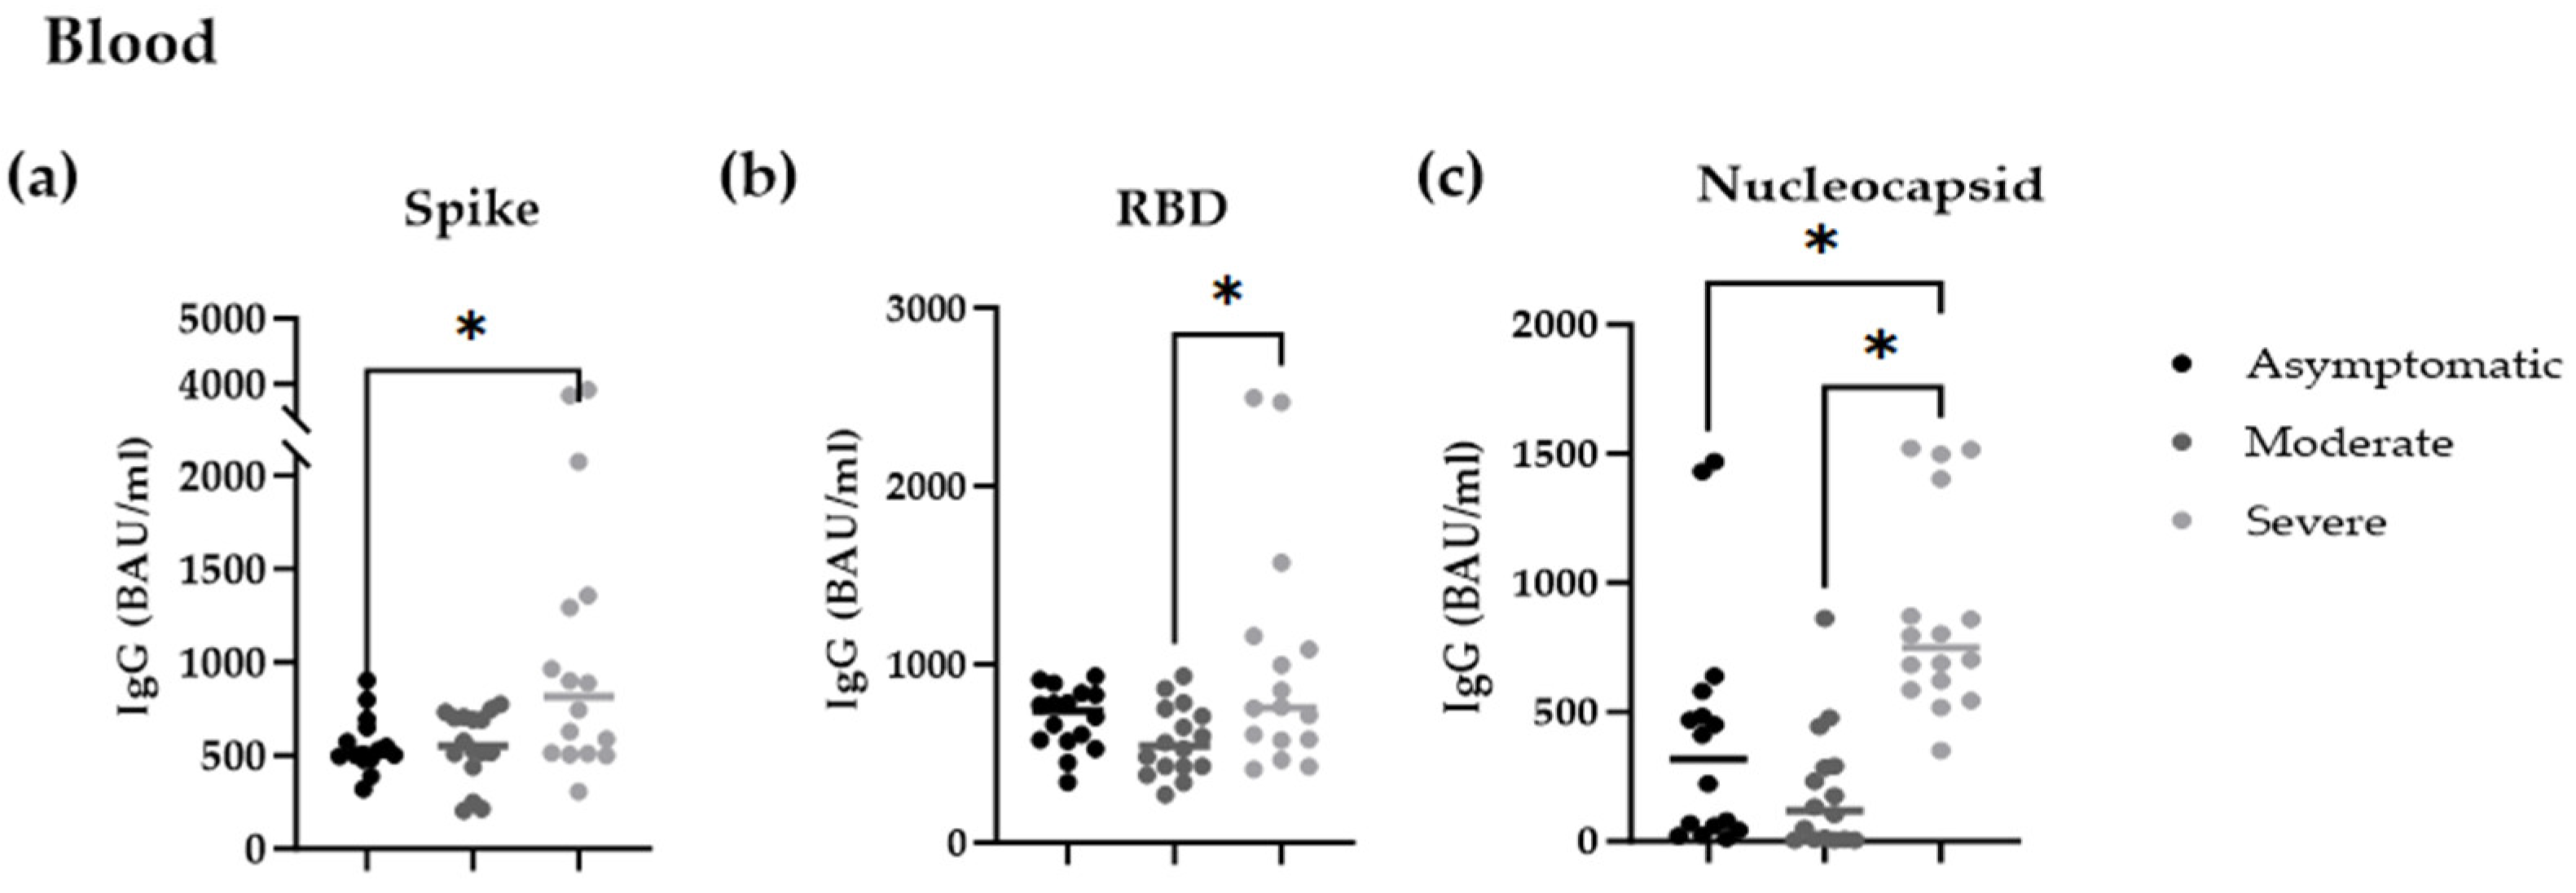
Samples were collected at the acute stage of infection: blood samples and NP/OP samples were collected; this occurred days after the onset of symptoms was noted in each subject. We measured systemic IgG responses. In general, it was determined that anti-spike, anti-RBD, and anti-N-IgG had the highest levels among patients with severe COVID-19 (Figure 1, Table A2). Anti-spike IgG levels of patients with severe COVID-19 were also significantly greater than active IgG levels of asymptomatic carriers (p = 0.02, Cohen’s d = 0.84), which showed a moderate-to-large effect (Figure 1a). By contrast, anti-RBD IgG concentration was significantly demarked between severe disease and moderate disease (p < 0.001, Cohen d = 0.51) (Figure 1b), and the level of anti-N IgG was significantly increased between severe disease and moderate disease (p < 0.0001, Cohen d = 0.49) and asymptomatic individuals (p < 0.05, Cohen d = 0.22) (Figure 1c). No anti-spike IgG anti-RBD IgG or anti-N IgG was found to occur in the healthy controls.

3.2. COVID-19 Patients Had Low Airway Mucosal Anti-Spike and Anti-RBD IgG Responses

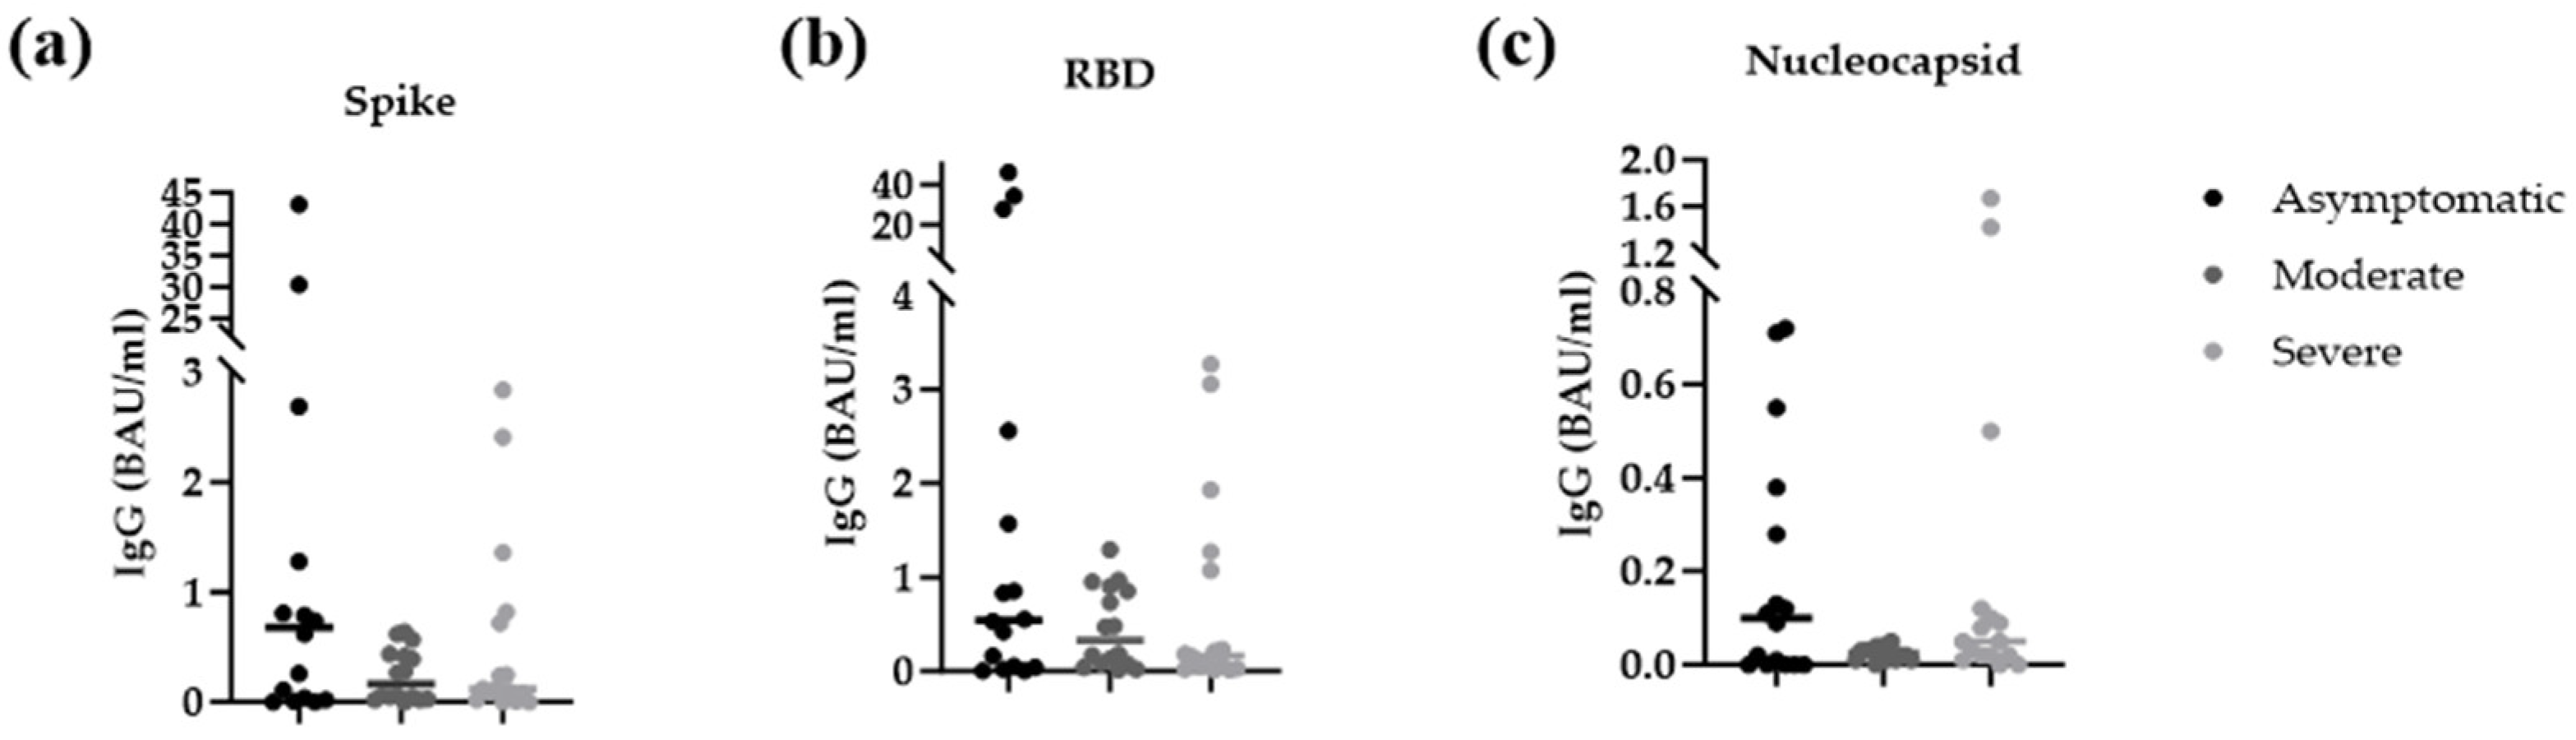
A substantial proportion of the participants were negative, both for SARS-CoV-2 spike and RBD IgG in the mucosal compartments (Table A3). Among the asymptomatically infected individuals, three (19%) were positive for mucosal (NP/OP) anti-spike IgG and anti-RBD IgG (Figure 2a–c). None of the moderate, but a subset of the severe, COVID-19 patients was positive for mucosal anti-N IgG (Table A4). In the case of asymptomatic infected patients, most of them were positive in anti-N IgG (Table A4).
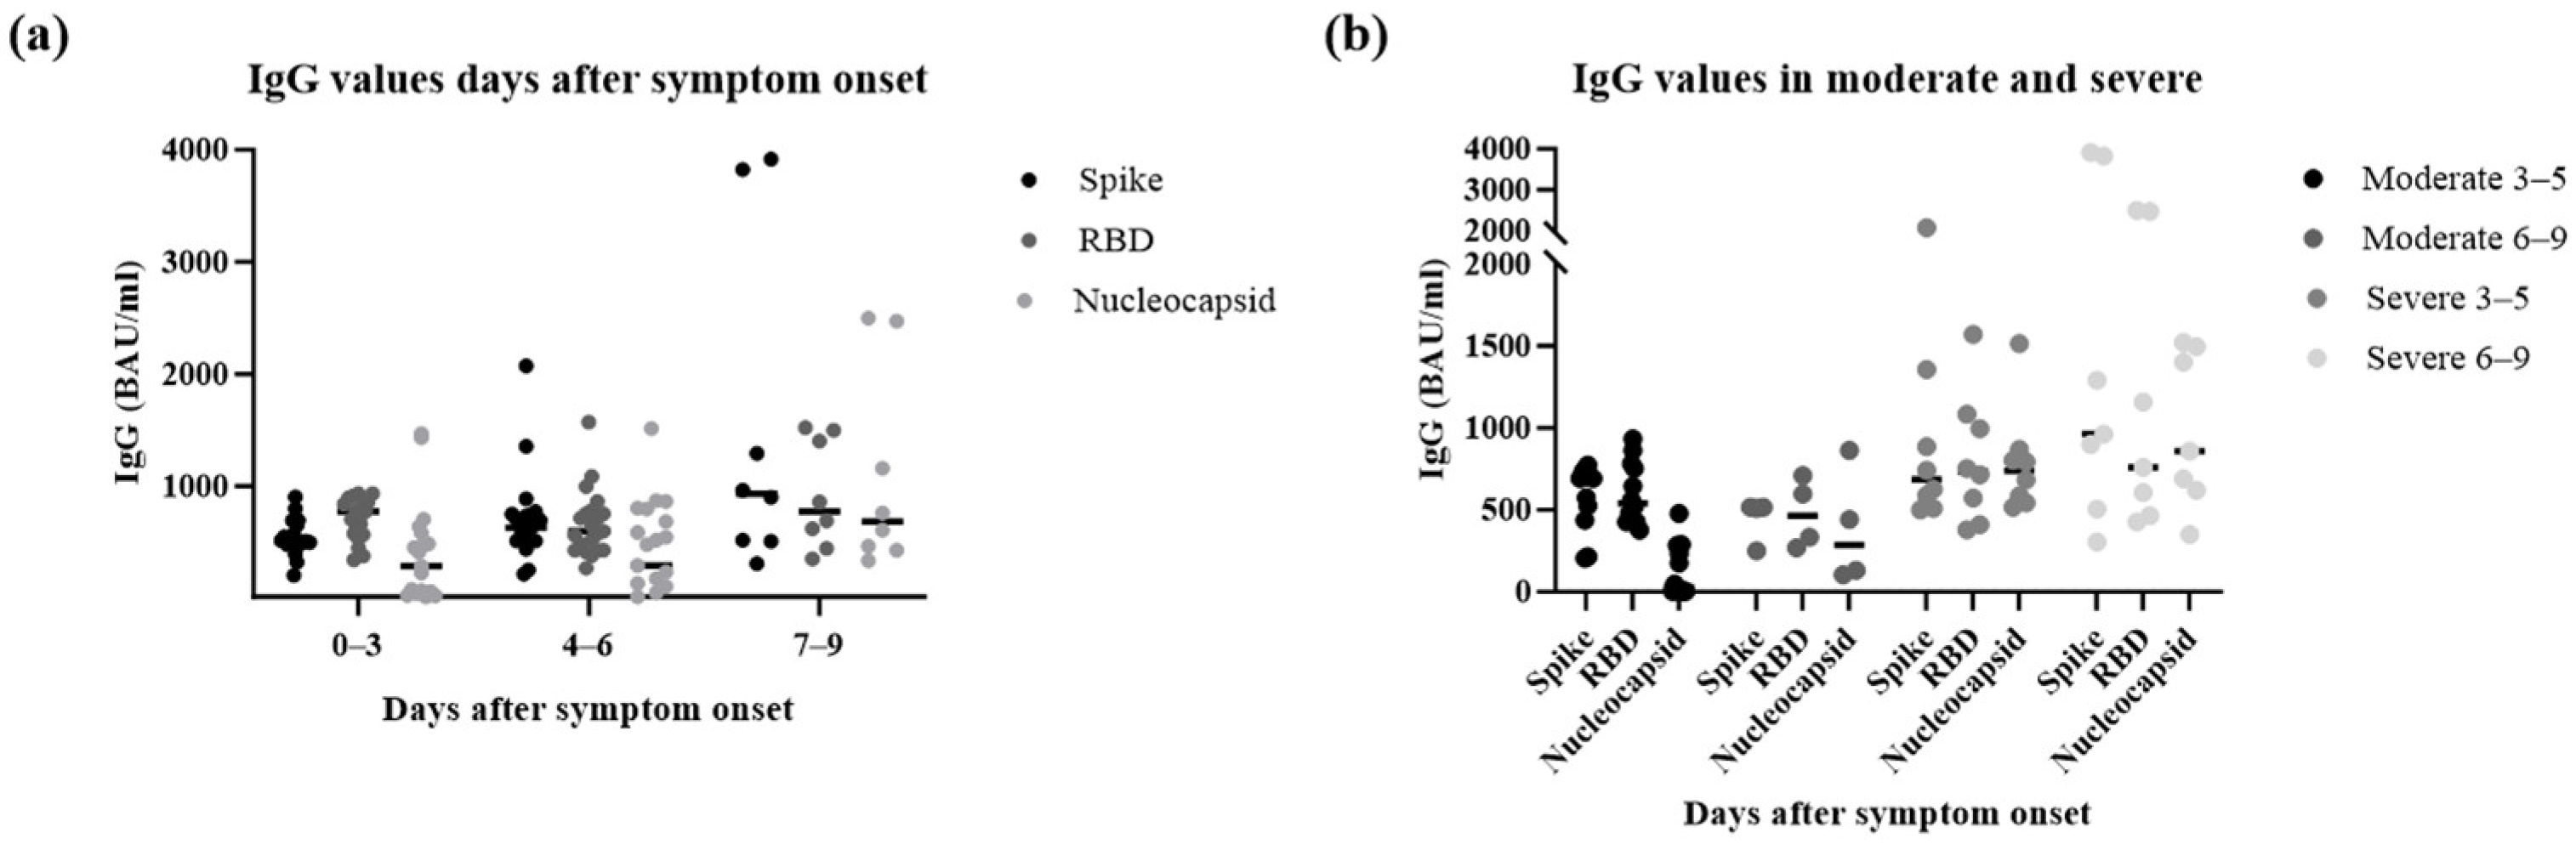
Spike, RBD, and nucleocapsid IgG systemic responses increased with time in the presence of symptoms. Within the 0–3-day window, antibody levels were low or not detected in most of the patients (Table A5). The results showed a high increment of anti-spike and anti-RBD IgG levels on days 4–6 and an additional heightened level on days 7–9. Anti-N IgG responses were later slower and weaker as compared to spike- and RBD-specific antibodies (Figure 3a). Cases of severe systemic IgG showed a high increase in titers compared to moderate cases at similar periods of time when the cases were stratified on the basis of severity. In particular, there was an increase in anti-spike and anti-RBD IgG in severe patients compared to moderate cases on day 4–6 post-symptom, as compared to a slow increase in moderate cases (Figure 3b).

3.3. Asymptomatically Infected Individuals Had Strong Mucosal and Systemic Interferon Responses

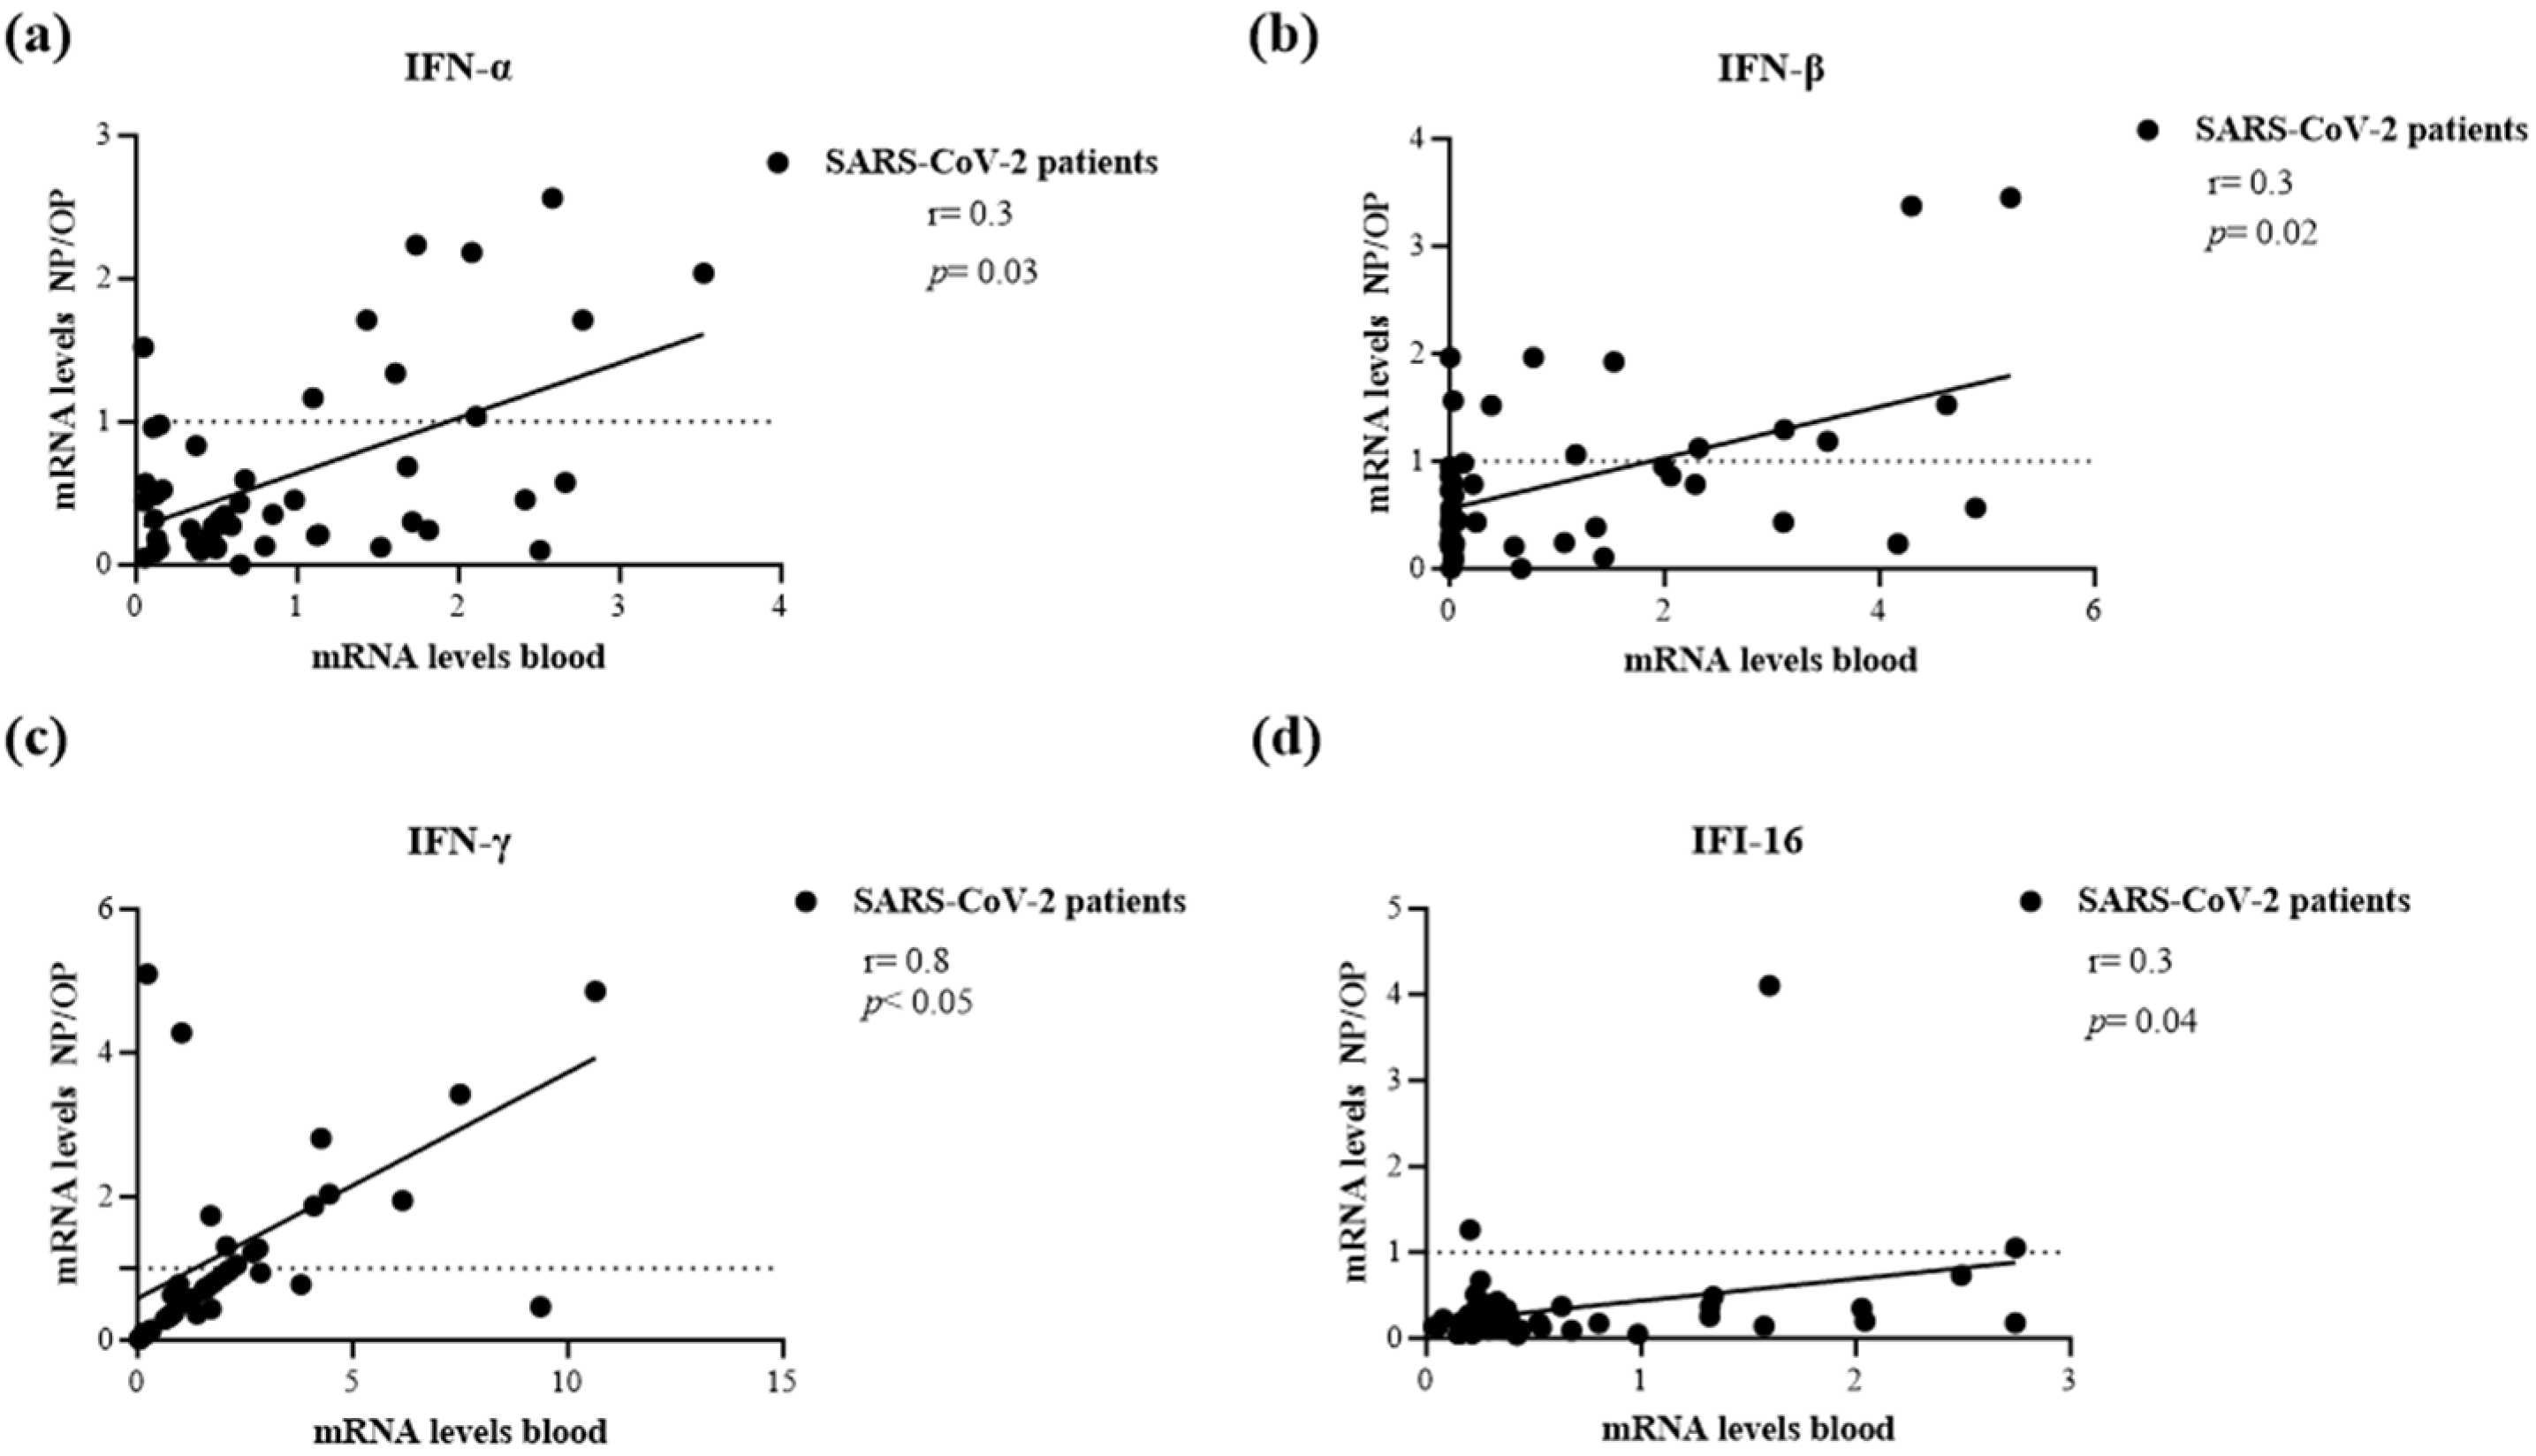
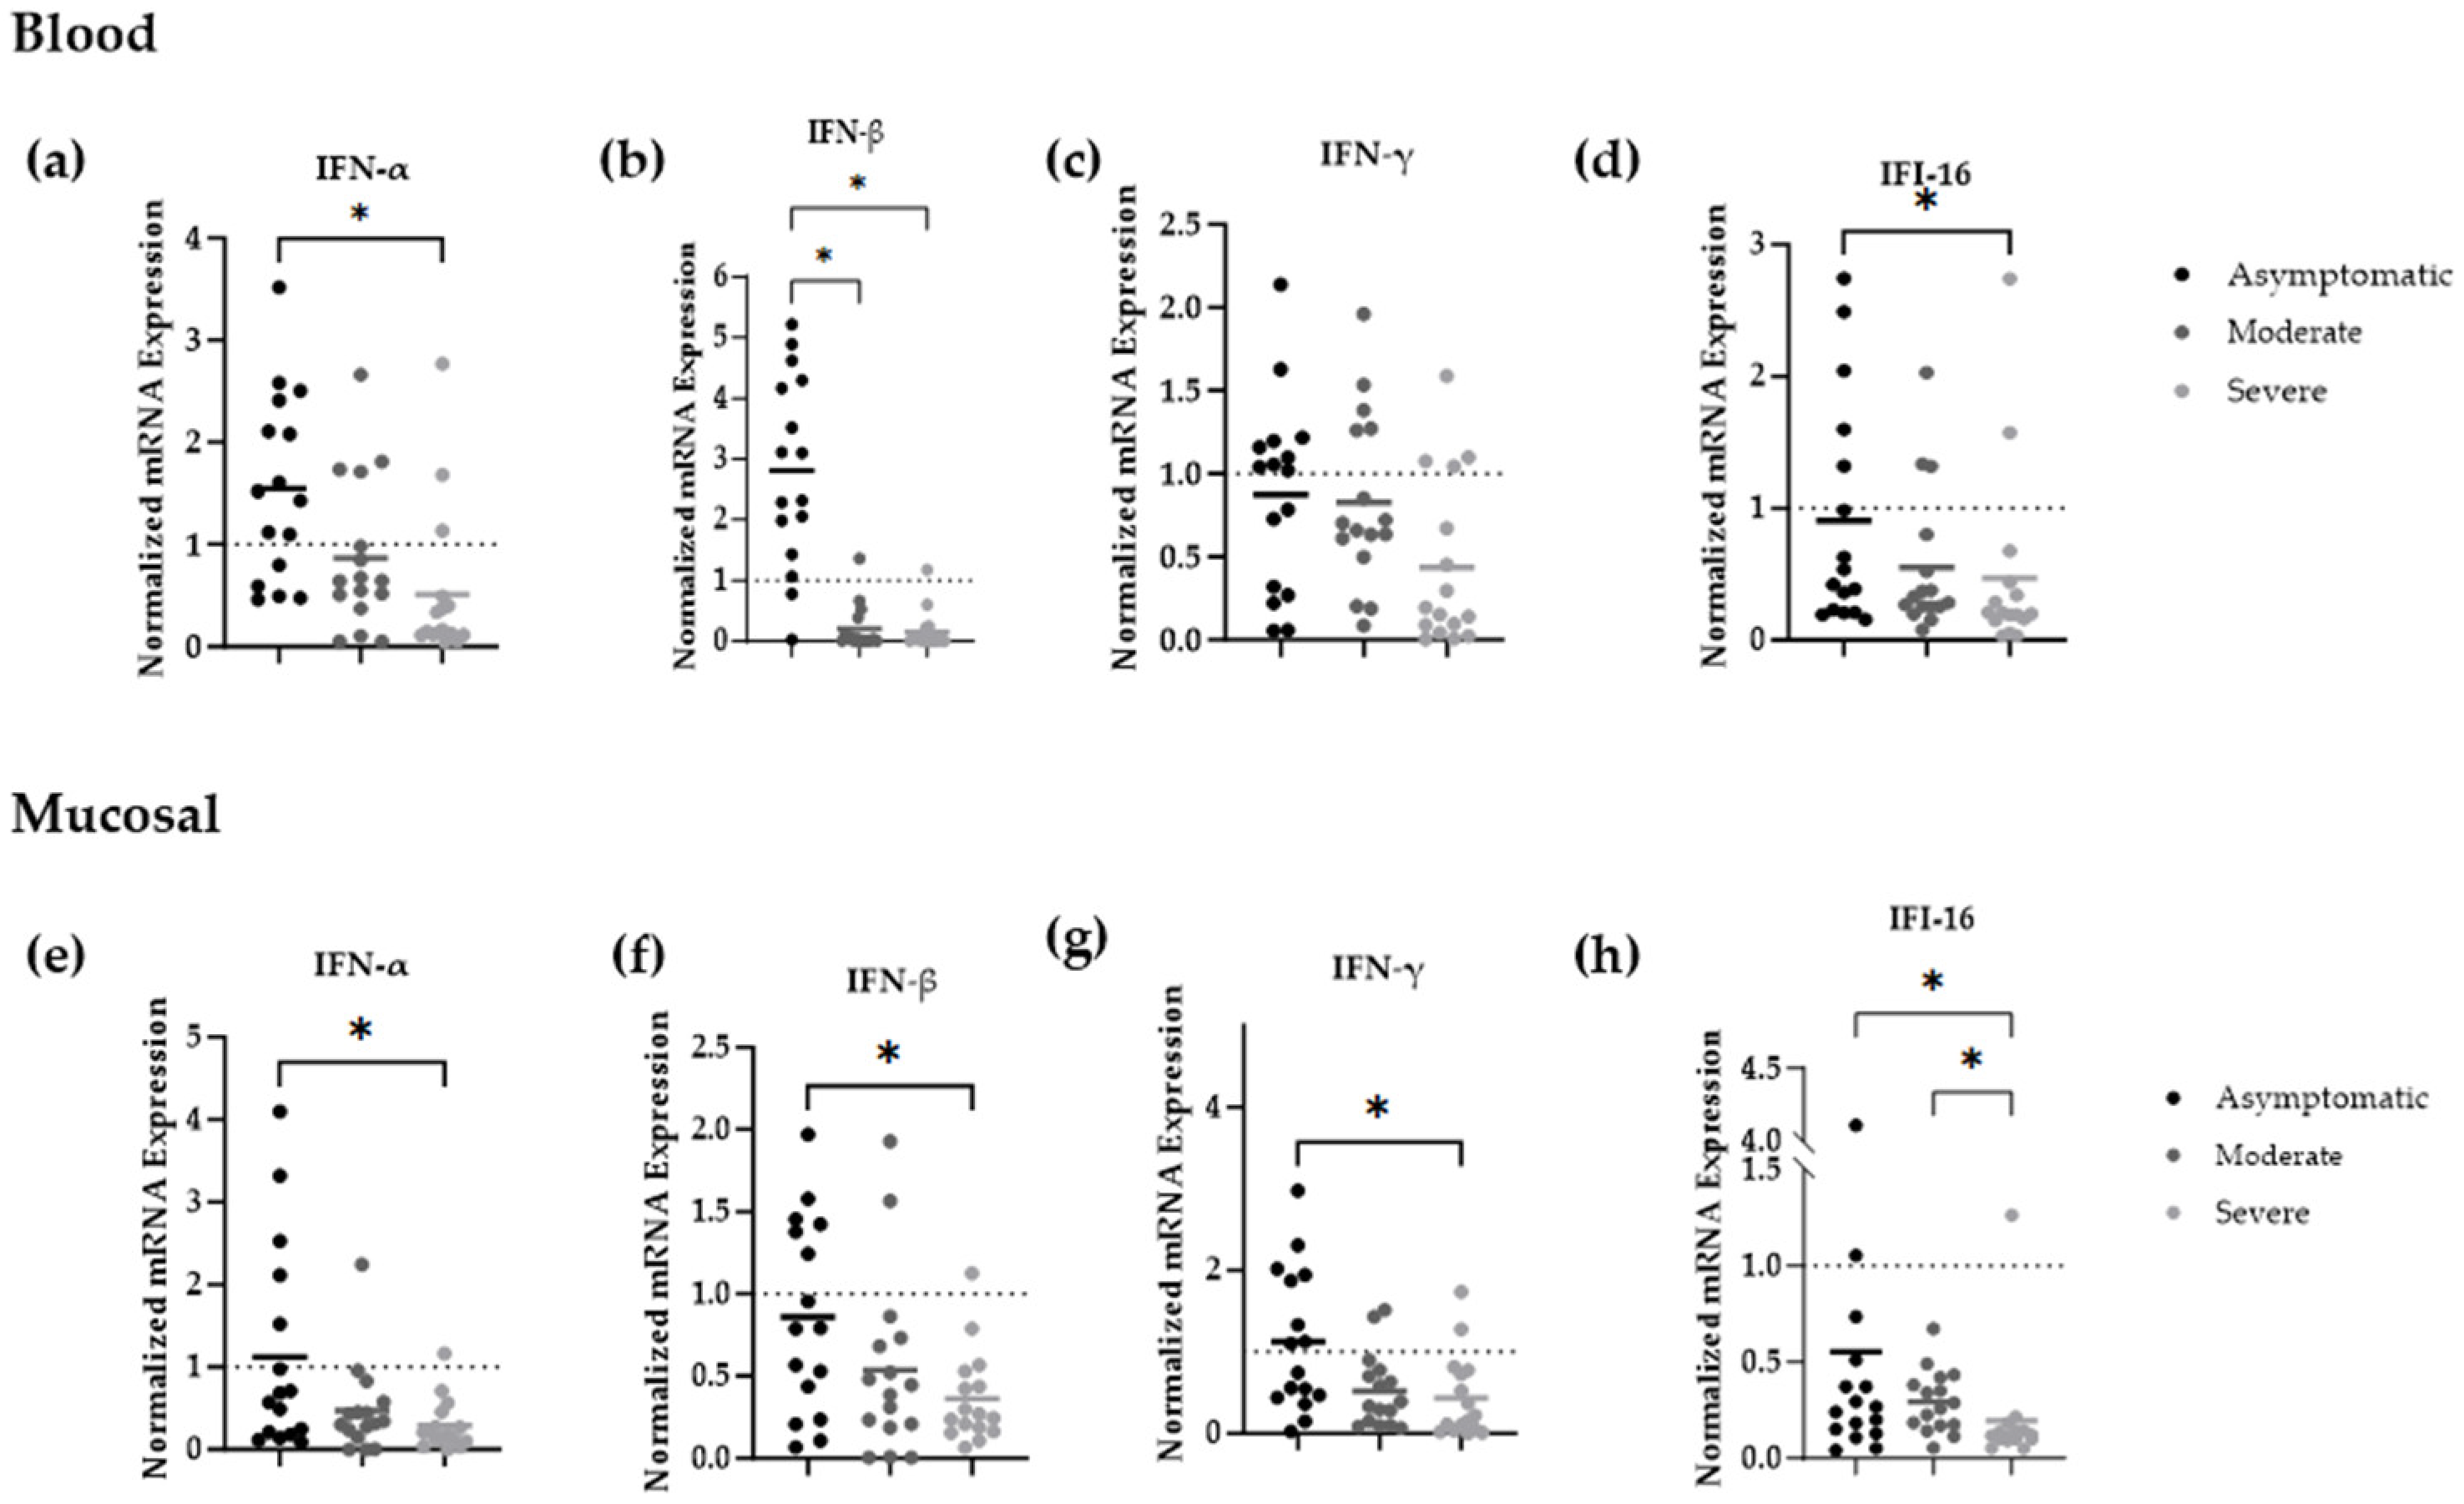
NP/OP (mucosal) and blood (systemic) IFN-α, IFN-β, IFN-γ, and IFI-16 mRNA were measured. Asymptomatically infected individuals showed significantly stronger systemic IFN-α, IFN-β, IFN-γ, and IFI-16 compared to cases with severe COVID-19 infection (p = 0.021, Cohen’s d = 0.84; p = 0.034, Cohen’s d = 0.76; and p = 0.028, Cohen’s d = 0.81, respectively) (Figure 4a–d). Mucosal IFN-α, IFN-β, IFN-γ, and IFI-16 responses were also significantly increased in asymptomatic individuals in comparison to severe COVID-19 cases (p = 0.031, Cohen d = 0.75; p = 0.028, Cohen d = 0.79; p = 0.044, Cohen d = 0.63; and p = 0.22, respectively) (Figure 4e–h). The rest of the mucosal mRNA levels of IFI-16 showed no statistically significant difference between patients with severe and moderate levels of symptoms (Figure 4h). The mRNA correlation of IFN-α, β and IFI-16 between blood and NP/OP samples was moderate (r = 0.4, p = 0.01), but IFN-γ was very high (r = 0.7, p = 0.001) (refer to Figure A1 and Figure A2).

3.4. Higher SARS-CoV-2 Viral Load in Patients with Severe Compared to Moderate and Asymptomatic COVID-19

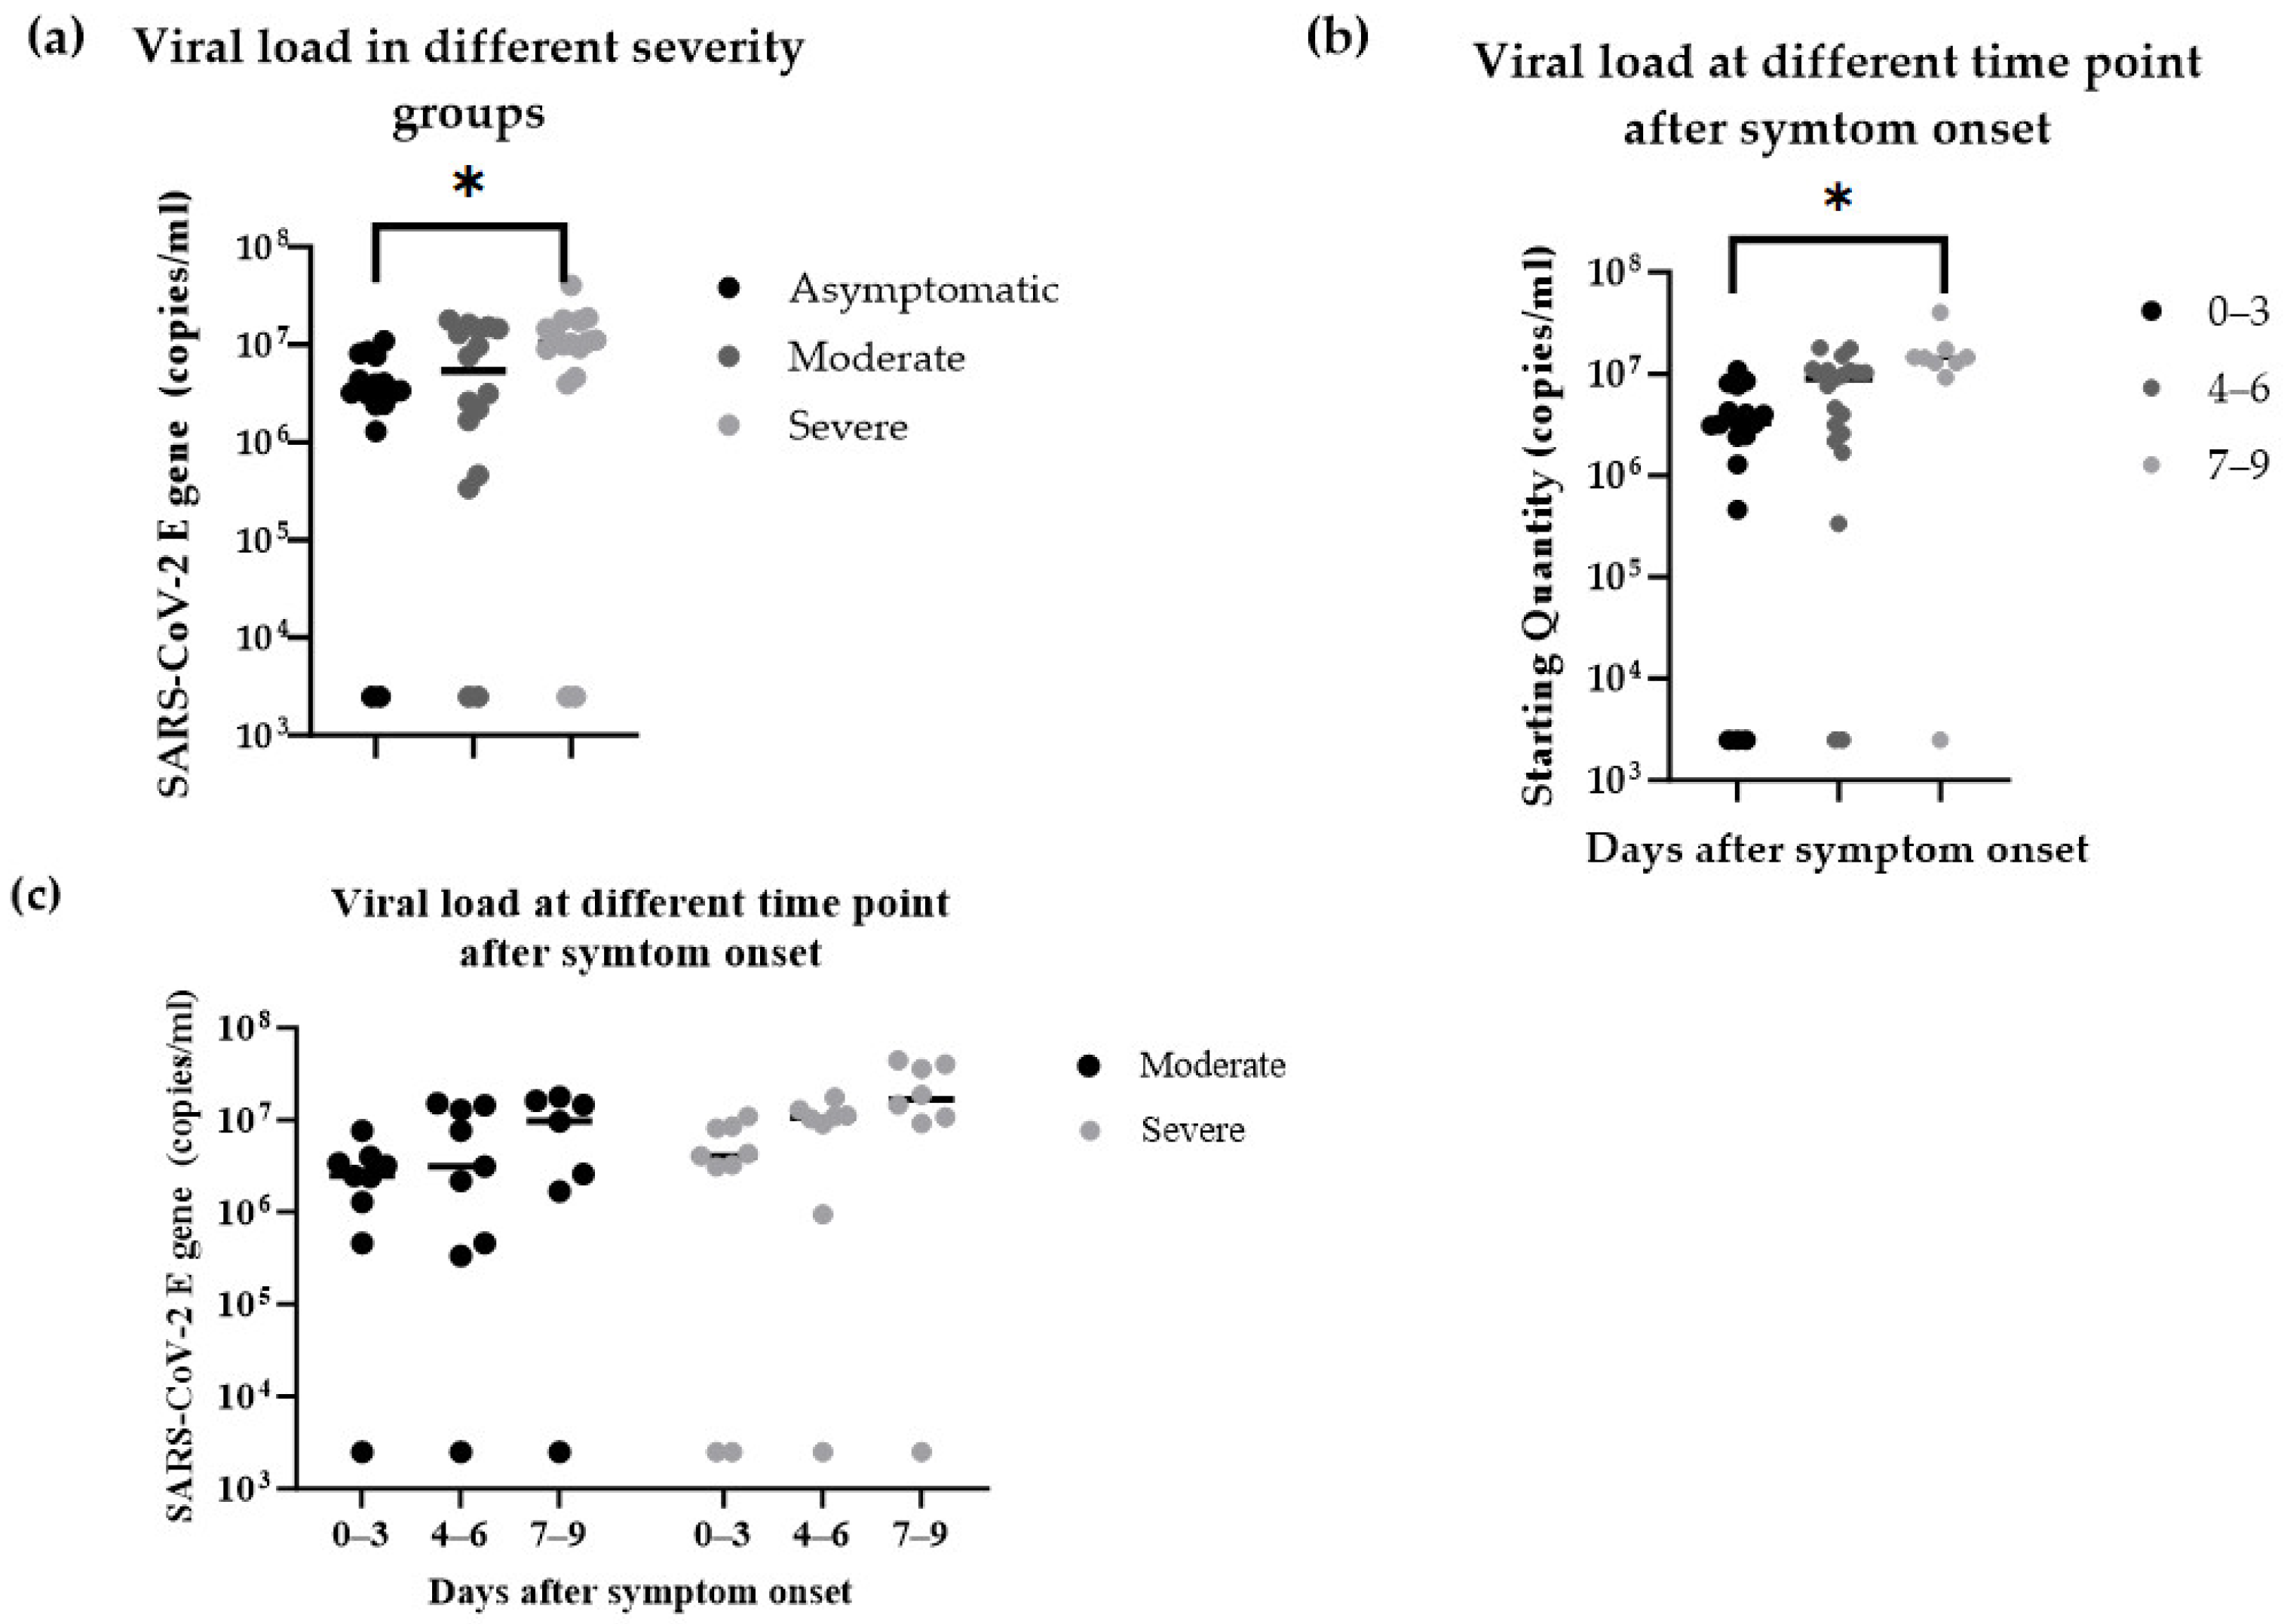
In general, a higher SARS-CoV-2 viral load was observed in severe patients compared to moderate and asymptomatic infected individuals (Figure 5a–c). Viral load was significantly higher in severe cases as compared with asymptomatic individuals (p = 0.018, Cohen’s d = 0.92), indicating a large effect size (Figure 5a). Moderate and severe cases showed significantly greater viral loads on days 7–9 relative to those on days 0–3 following symptom onset (p = 0.01) (Figure 5b).
Multivariate logistic regression, where age, sex, diabetes, CKD, and asthma were adjusted, revealed that measures of immunity were still independently related to disease severity. The increased viral load count was still independent and correlated with severe COVID-19 after the adjustment of age, sex, diabetes, CKD, and asthma (adjusted OR: 2.31, 95% CI: 1.12–4.78, and p = 0.021). Similarly, low systemic IFN-α levels of transcripts persisted significantly with serious illness following adjustment (adjusted OR = 0.58, 95% CI = −0.35–0.92, p = 0.032). On the other hand, after the adjustment of the comorbidities, mucosal anti-spike IgG and asymptomatic infection expressed a less significant relationship.

4. Discussion

This study provides one of the first comprehensive evaluations of both mucosal and systemic interferon responses and SARS-CoV-2-specific antibody profiles in unvaccinated Kenyan people who became infected during the Omicron wave of the COVID-19 outbreak. Genomic surveillance data published by Kenya’s Ministry of Health show that Omicron’s lineage has constituted approximately 85–95 percent of all cases of sequencing of SARS-CoV-2 in Kenya during the interval in question, which is 2022–2023. This study expands current knowledge by analyzing both mucosal and systemic immune responses in an unvaccinated African cohort.
The comorbid conditions among participants of this cohort are also presented in a range, with a clear presence of a correlation between preexisting health deficits and the chances of developing severe COVID-19. Compared to individuals who were either asymptomatic or had moderate disease, patients with severe disease presented with enhanced prevalence of chronic diseases, including diabetes mellitus, hepatic pathology, pulmonary ailment, chronic kidney disease (CKD), heart ailment, and asthma. For example, 50% of severe cases had diabetes, compared to moderate (37.5%) and asymptomatic individuals (18.75%). Similarly, 31.25% of severe patients had CKD, a higher rate compared to the moderate (12.5%) and asymptomatic (6.25%) groups.
These results are in line with earlier studies where patients with concomitant complications, specifically diabetes, cardiovascular diseases, and chronic respiratory illnesses, were more likely to acquire severe forms of COVID-19 [10]. The observed associations may be confounded by differences in comorbidity between severity groups, as chronic disorders like diabetes and chronic renal disease have the ability to independently influence immune responses and disrupt interferon signaling. The mechanisms underlying these associations are multifactorial. Immune dysregulation, weakened inflammatory responses, and elevated ACE2 receptor expression are common outcomes of chronic illnesses, and these factors may enhance SARS-CoV-2 infection [11,12]. Furthermore, comorbidities might worsen the cytokine storm caused by severe COVID-19, resulting in multi-organ dysfunction [13].
Higher systemic RBD-specific IgG antibodies were observed in comparison to nucleocapsids and spikes in all SARS-CoV-2 patients. Patients with severe COVID-19 had significantly higher systemic spike-, nucleocapsid-, and RBD-specific IgG levels, as compared to the moderate and asymptomatic groups. In contrast, mucosal IgG titers were higher in asymptomatic individuals and patients with moderate severity as compared to patients with severe disease. The highest systemic IgG levels were observed at days 7–9 from symptom onset, in contrast to days 0–3 for the mucosal response (NP/OP), in all SARS-CoV-2-infected individuals. The resolution of systemic symptoms, including fatigue, fever, headache, disorientation, musculoskeletal pain, and lymphadenopathy, has been associated with a strong nasal antibody response, especially anti-RBD IgG [14,15]. It is important to note that only IgG-binding antibodies were quantified in this study, but there was no neutralizing activity or IgA levels. Since IgA is the most significant mucosal isotype and it is critically involved in the neutralization of pathogens at entry points into the mucosa, future studies should involve parallel analysis of mucosal IgA responses to provide a more holistic picture of mucosal immunity. In previous research, it was reported that the percentage of patients showing viral-specific IgG increased to about 100 percent around 17–19 days after the onset of symptoms [17,18,19].
Conversely, individuals with mild SARS-CoV-2 infection showed transient, delayed, or absent spike protein-specific blood IgG production, which was followed by a late or negative S protein-specific serum IgG response [20]. Systemic titers of S protein-specific IgG are reflected in mucosal S protein-specific IgG titers [21,22]. A possible explanation for a high humoral immune response in immunological pathology has been suggested: it may enhance antigen uptake and stimulate pro-inflammatory monocytes in the lungs, according to preclinical SARS-CoV infection models and correlative evidence from the outbreak [23,24,25]. Elevated systemic IgG levels observed in severe disease may reflect higher antigen burden, prolonged viral replication, or later sampling time rather than a pathogenic or protective mechanism.
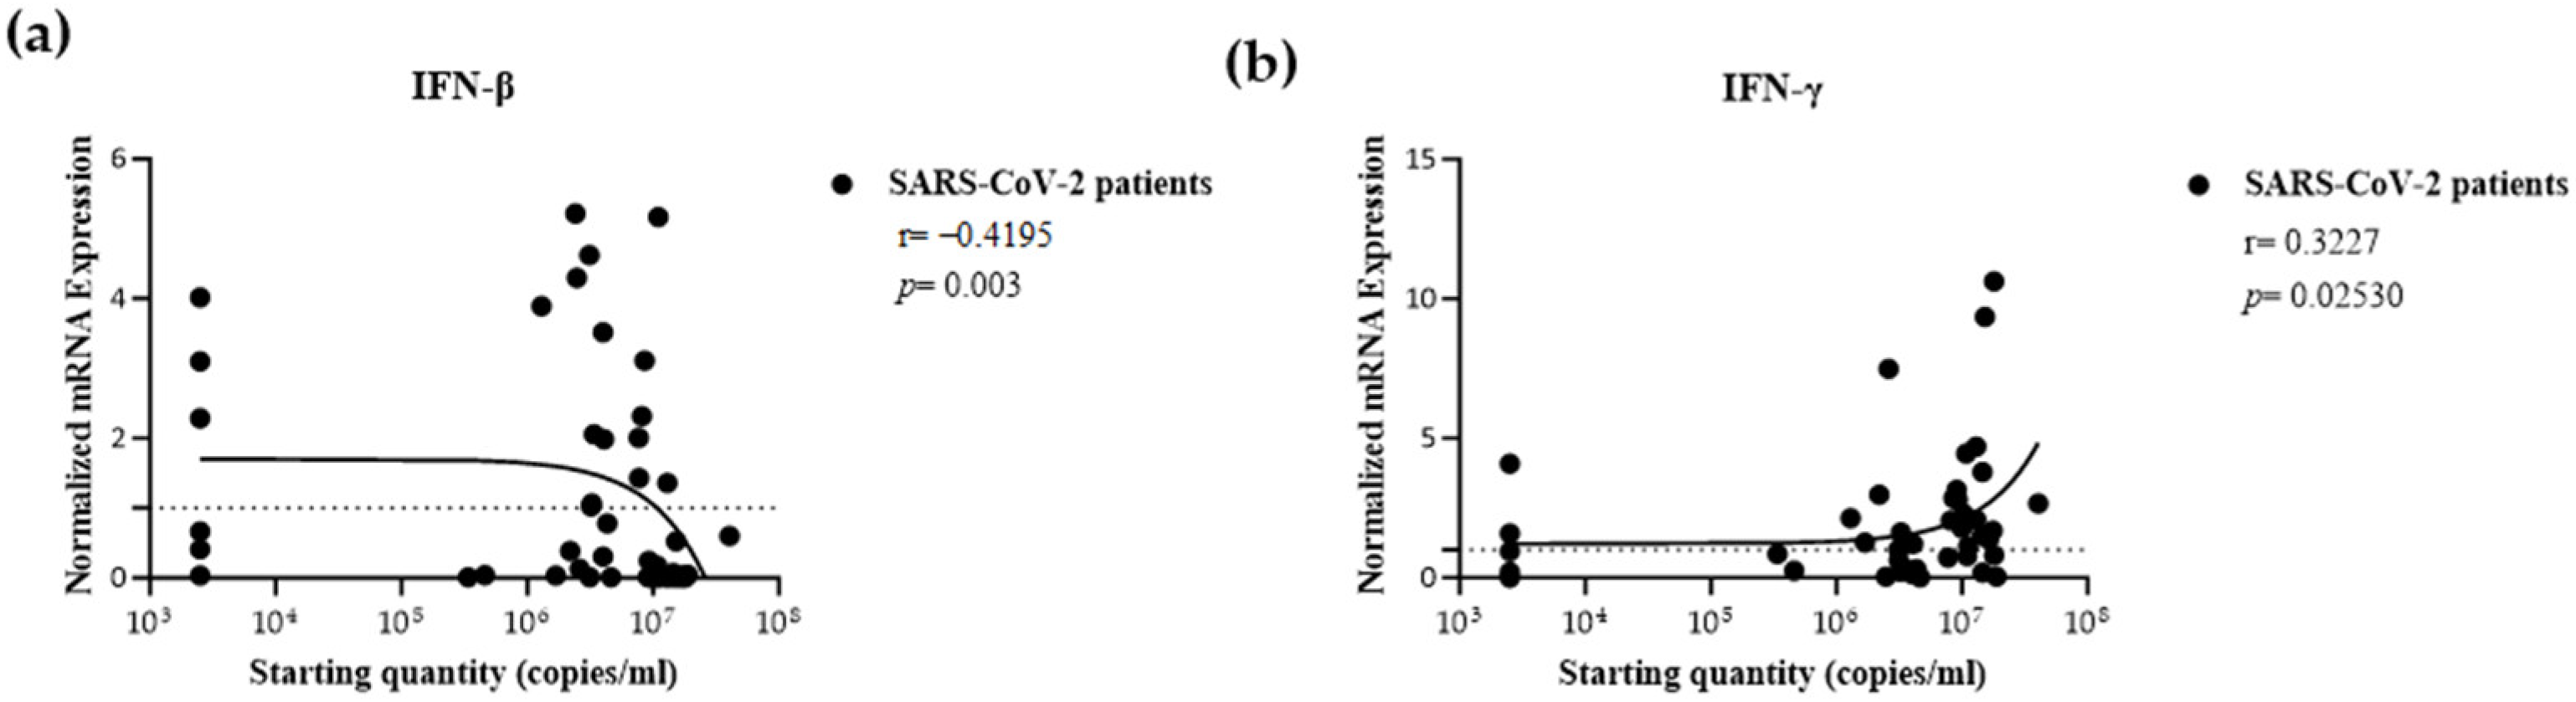
This study further investigated how various IFN-associated gene transcript levels may be utilized to understand the immune response and pathophysiology of COVID-19. Severe patients had lower systemic and mucosal IFN-α, IFN-β, IFN-γ, and IFI-16 transcript levels compared to moderate and asymptomatic patients. Systemic mRNA levels of IFN-α, IFN-γ, and IFI-16 in SARS-CoV-2 patients correlated positively with mucosal gene expression levels but showed an inverse relationship with viral load.
Consistent with these results, a previous study showed reduced IFN expression and pro-inflammatory response in the peripheral blood of critically ill COVID-19 patients [26]. Another study showed that while high levels of chemokines were present for the recruitment of immune cells, the host response to SARS-CoV-2 was unable to activate a robust IFN-I and -III response [27]. Similarly, ref. [28] found that there was no discernible variation in the levels of interferon (IFN) between the upper respiratory tracts of COVID-19 patients and healthy people. However, increased levels of pro-inflammatory cytokines (especially, type I and type III interferons, IFN-I and IFN-III) were observed in their broncho-alveolar lavage fluid. The findings of these experiments suggest that the presence of SARS-CoV-2 orchestrated the down-regulation of interferon production in the upper respiratory tract, resulting in the weakening of antiviral responses and enhancing viral persistence. On the other hand, the appearance of a hyperirritable immune response with subsequent overexpression of the deleterious interferon occurs when the pathogen enters the lower respiratory parenchyma [29].
The blunted systemic response to interferons observed in severe COVID-19 cases is likely to be the cumulative sum of the viral- and host-mediated determinants. SARS-CoV-2 carries a repertoire of accessory proteins, most prominently the NSP1, NSP6, and ORF6 proteins that directly disrupt interferon-signaling cascades, suppressing innate antiviral responses. At the same time, host-specific factors have been strongly implicated in impaired interferon signaling during advanced disease conditions in the presence of polymorphisms of interferon-relevant genes, and the development of neutralizing autoantibodies in response to type I interferons [30,31,32].
Furthermore, recent studies have demonstrated that neutralizing autoantibodies against type I interferons can contribute to severe COVID-19, independent of transcript levels [33]. We did not assess anti-IFN autoantibodies, which may represent an additional mechanism underlying impaired antiviral responses in severe cases. Moreover, comorbid conditions commonly seen in severe cases may further disrupt innate antiviral pathways. In addition, comorbidities common in extreme cases can also contribute to additional derailment of innate antiviral mechanisms. Taken together, these mechanisms are likely causes of the lower concentrations of IFN-α, IFN-β, and IFN-γ that were found in our sample population. This highlights the significance of early response of the mucosa to interferon in curbing viral multiplication, coordination of the downstream response of immunity, and finally, alleviation of pathogenesis. Lastly, the researchers contrasted viral loads between COVID-19 cases with diverse degrees of disease severity and asymptomatic carriers, the results of which showed that severe SARS-CoV-2 cases harbored the largest amounts of viral loads. Interestingly, the viral load appeared highest in samples collected between days 7 and 9 after symptom onset.
A previous study found that the viral load in the nasopharyngeal specimens of severe cases was approximately 60 times higher than that of mild cases and that there was a sustained positive correlation over the initial 12 days of infection, suggesting that higher viral loads might be associated with severe clinical outcomes. While the NP/OP virus load was comparable between groups, they also discovered elevated blood levels of SARS-CoV-2 [34].
Moreover, patients who were hospitalized at a hospital in Zhejiang province in China found that patients with severe illness had a higher viral load in their respiratory samples but not in their stool or serum samples after approximately 22 days [35]. Most previous studies [36] have found a positive correlation between COVID-19 severity and higher viral load for pre-Omicron SARS-CoV-2 variants. The results presented here are consistent with this and emphasize the importance of quantifying viral load to identify individuals more likely to develop severe diseases. A limitation of this study is the lack of sequencing data to validate the assumed SARS-CoV-2 Omicron variants in the samples collected. However, during the time of sample collection, the vast majority of SARS-CoV-2 in the region were of the Omicron variant [37]. As this study employed a cross-sectional design, temporal and causal relationships between IFN expression, antibody titers, and disease severity cannot be inferred. The data represents associations measured at a single point along the infection timeline. Furthermore, the absence of information on previous SARS-CoV-2 infections within the cohort limits interpretation, as prior exposure could have influenced the observed immune responses. Some previous cohort analyses, however, reported no significant difference in prior SARS-CoV-2 infection on the magnitude and/or quality of subsequent IgG responses at certain timepoints [38].
The comorbidity rates between the groups of disease and disease severity were also different, and diabetes, as well as CKD, showed a greater level of occurrence in severe disease. These are well known to regulate antiviral immunology, including interferon signaling and antibody production. Even though the correlation of the variables was conducted to support the age, sex, and major comorbidities, the size of the sample is limited, rendering these estimates less reliable. Greater cohorts are thus justified because they would separate the role of host comorbidities and immune dynamics in the severity of COVID-19 infection. Because prior SARS-CoV-2 infection history could not be fully verified, some participants may have had previous exposure, which could influence systemic and mucosal immune responses despite anti-nucleocapsid IgG measurement.

5. Conclusions

To conclude, we report that mucosal anti-spike and RBD IgG titers were more frequently observed in asymptomatic individuals and were associated with lower disease severity. Both mucosal and systemic interferon responses were suppressed in patients with severe disease who also exhibited higher SARS-CoV-2 virus load and higher systemic antibody levels. Taken together, these findings suggest that the outcome of SARS-CoV-2 Omicron infection of unvaccinated individuals is linked to the capacity to rapidly induce a strong mucosal and systemic innate antiviral response, likely limiting viral replication and spread, and reducing the pathogenic effects of the Omicron variant. Viral load appeared highest in samples collected between days 7 and 9, although this may reflect variability in sampling time rather than true viral kinetics. In this cross-sectional cohort of unvaccinated individuals infected during a period of Omicron predominance, severe COVID-19 was associated with higher viral loads, elevated systemic IgG titers, and reduced interferon transcript levels. Higher mucosal IgG levels were observed in asymptomatic individuals. These findings represent associations rather than causal relationships. The absence of protein-level interferon measurements, mucosal IgA quantification, neutralization assays, treatment adjustment, and anti-interferon autoantibody assessment limits mechanistic interpretation. Larger longitudinal studies incorporating functional immune assays are required. Viral sequencing was not performed in this study; therefore, variant identification was inferred from national genomic surveillance data. Although samples were collected during the acute phase, the time from symptom onset varied between participants. This variability could influence antibody levels and viral load measurements. In as much as multivariable regression models adjusting for comorbidities were performed, the relatively small sample size limited the inclusion of additional covariates such as viral load and days post symptom onset.
These results could further help in understanding COVID-19 outcomes and aid in developing personalized treatment strategies.

Author Contributions

Conceptualization, R.M.A., K.P., I.N., S.K.M., J.K., J.N. and M.L.; methodology, R.M.A., K.P., S.K.M., J.K., J.N. and M.L.; software, R.M.A. and M.L.; validation, M.L.; formal analysis, R.M.A., K.P., I.N., S.K.M., J.N. and M.L.; investigation, R.M.A., K.P., I.N., S.K.M., J.K., J.N. and M.L.; resources, J.N. and M.L.; data curation, R.M.A., K.P., I.N., S.K.M., J.N. and M.L.; writing—original draft, R.M.A. and M.L.; review and editing, R.M.A., K.P., I.N., S.K.M., J.K., J.N. and M.L.; visualization, R.M.A. and M.L.; supervision, K.P., I.N., S.K.M., J.N. and M.L.; project administration, R.M.A., K.P., I.N., S.K.M., J.K., J.N. and M.L.; funding acquisition, K.P., S.K.M. and M.L. All authors have read and agreed to the published version of the manuscript.

Funding

This study was supported by the SciLifeLab/KAW COVID-19 Research Program (J.K., M.L.), Swedish Research Council project grant 201701091 (M.L.), and the COVID-19 ALF (Linköping University Hospital Research Fund) and Genotype, Phenotype and Mental Health GAMPIK-Kenya (KP-IREC/2020/110).

Institutional Review Board Statement

This study was conducted in accordance with the ethical principles outlined in the Declaration of Helsinki. Ethical approval was obtained from the Institutional Research and Ethics Committee of the Moi University Faculty of Health Sciences (FAN 0003660, Eldoret, Kenya, 2 September 2020), and all procedures involving human participants were carried out in compliance with institutional and national research ethics guidelines. All COVID-19 patients, asymptomatically infected and healthy controls included in the study, provided written informed consent for participation.

Informed Consent Statement

Informed consent was obtained from all subjects involved in the study.

Data Availability Statement

The authors confirm that the data supporting the findings of this study are available within the article [and/or] its Appendix A and Appendix B. Additional data can be obtained upon request: Rebeccah M. Ayako (rayako@primateresearch.org).

Acknowledgments

We would like to acknowledge Teodora Aktas and Teghesti Tecleab from the Public Health Agency of Sweden for providing support in IgG quantification.

Conflicts of Interest

The authors declare no conflicts of interest.

Abbreviations

The following abbreviations are used in this manuscript:
AbbreviationFull Term
ACE2Angiotensin-Converting Enzyme 2
ANOVAAnalysis of variance
BAUBinding antibody units
cDNAComplementary deoxyribonucleic acid
CKDChronic kidney disease
COVID-19Coronavirus Disease 2019
GAMPIKGenotype, phenotype and mental health (Kenya)
GAPDHGlyceraldehyde-3-Phosphate Dehydrogenase
IFI-16Interferon gamma-inducible protein 16
IFNInterferon
ISGsInterferon-stimulated genes
mRNAMessenger ribonucleic acid
MTRHMoi Teaching and Referral Hospital
NKNatural killer (cells)
NP/OPNaso-oropharyngeal
NSPNon-structural protein
ORFOpen reading frame
RBDReceptor-binding domain
RNARibonucleic acid
RT-qPCRReverse transcription quantitative polymerase chain reaction
SARS-CoV-2Severe Acute Respiratory Syndrome Coronavirus 2

Appendix A

Figure A1. Correlation of interferon and interferon-stimulating gene responses to SARS-CoV-2 patients in blood and NP/OP. IFN-α (a), IFN-β (b), IFN-γ (c), and IFI-16 (d).
Covid 06 00051 g0a1
Figure A2. Correlation between interferon gene expression and SARS-CoV-2 viral load in unvaccinated patients. Scatter plots showing the relationship between normalized mRNA expression levels of IFN-β (a) and IFN-γ (b) in whole blood and viral RNA copy number (starting quantity, copies/mL) among SARS-CoV-2-positive patients.
Covid 06 00051 g0a2

Appendix B

Table A1. Characteristics of the study cohorts.
MeasuresAsymptomatic COVID-19Moderate COVID-19Severe COVID-19Statisticp-Value
PatientsMatched ControlsPatientsMatched
Controls
PatientsMatched Controls
n = 16n = 16n = 16n = 16n = 16n = 16
Demographics
Age—years;
median (IQR)
46
(29–56.5)
45
(29.5–55)
39
(32.5–46)
37.5
(32–45.5)
32
(27–45.5)
42
(26.5–58)
0.4202 **0.17
Female; n (%)7 (44)7 (44)8 (50)8 (50)5 (31)5 (31)1.2 *0.55
Vital signs
Body temp (°C); median (IQR)36.4
(36.3–36.8)
36.35
(36.2–36.4)
36.5
(35.35–36.8)
36.5
(36.4–36.35)
36.65
(36.4–36.8)
36.8
(36.4–36.8)
0.410.71
O2 saturation
(%); mean ± SD
94
31 ± 2.86
94
56 ± 2.52
92
51 ± 4.37
93
34 ± 4.37
79
11 ± 11.59
94
58 ± 2.26
22.91 ***<0.0001
*: Chi-square: **: H-statistic; ***: F-statistic.
Table A2. Anti-SARS-CoV-2 IgG titers in blood.
EpitopeStudy StrataMedianIQR
LowerUpper
SpikeAsymptomatic505.7481.2648.9
Moderate551.1438.1704.9
Severe815.2510.61356
RBDAsymptomatic739.0568.0839.5
Moderate541.7426.6752.3
Severe757.0574.11158
NucleocapsidAsymptomatic316.942.20580.2
Moderate118.37.700290.5
Severe748.8585.61403
Table A3. Kinetics of anti-SARS-CoV-2 IgG responses in airway mucosa.
EpitopeStudy StrataMedianIQR
LowerUpper
SpikeAsymptomatic0.68000.02002.690
Moderate0.16500.03000.4400
Severe0.12000.02000.8200
RBDAsymptomatic0.54000.04002.560
Moderate0.32500.08000.9000
Severe0.16500.03001.270
NucleocapsidAsymptomatic0.10000.0000.3800
Moderate0.025000.01000.0400
Severe0.050000.02000.1200
Table A4. Kinetics of anti-SARS-CoV-2 IgG responses in airway mucosa stratified by days post-symptom onset.
EpitopesDays Post-Symptom OnsetMedianIQR
LowerUpper
Spike0–30.27000.020001.280
4–60.18000.050000.4400
7–90.10000.020000.7200
RBD0–30.47000.040001.570
4–60.19500.080000.9500
7–90.15000.050001.070
Nucleocapsid0–30.040000.0000.2800
4–60.030000.020000.05000
7–90.020000.010000.08000
Table A5. Anti-SARS-CoV-2 IgG titers in blood stratified by days post-symptom onset.
EpitopeDays Post-Symptom OnsetMedianIQR
LowerUpper
Spike0–3508.4481.2648.9
4–6626.7510.6743.2
7–9931.5306.03919
RBD0–3773.3568.0853.6
4–6597.0428.7753.3
7–9774.1350.41521
Nucleocapsid0–3284.842.20580.2
4–6290.549.10683.3
7–9684.1335.02497

References

  1. Hu, B.; Guo, H.; Zhou, P.; Shi, Z.L. Characteristics of SARS-CoV-2 and COVID-19. Nat. Rev. Microbiol. 2020, 19, 141–154. [Google Scholar] [CrossRef] [Scilit]
  2. Cascella, M.; Rajnik, M.; Cuomo, A.; Dulebohn, S.C.; Di Napoli, R. Features, Evaluation, and Treatment of Coronavirus (COVID-19). StatPearls. 2023. Available online: https://www.ncbi.nlm.nih.gov/books/NBK554776/ (accessed on 12 March 2026).
  3. Zeberg, H.; Pääbo, S. The major genetic risk factor for severe COVID-19 is inherited from Neanderthals. Nature 2020, 587, 610–612. [Google Scholar] [CrossRef] [Scilit]
  4. da Silva, S.J.R.; Kohl, A.; Pena, L.; Pardee, K. Recent insights into SARS-CoV-2 omicron variant. Rev. Med. Virol. 2022, 33, e2373. [Google Scholar] [CrossRef] [Scilit]
  5. Chemaitelly, H.; Ayoub, H.H.; Coyle, P.; Tang, P.; Hasan, M.R.; Yassine, H.M.; Al Thani, A.A.; Al-Kanaani, Z.; Al-Kuwari, E.; Jeremijenko, A.; et al. Differential protection against SARS-CoV-2 reinfection pre- and post-Omicron. Nature 2025, 639, 1024–1031. [Google Scholar] [CrossRef] [Scilit]
  6. Ismail, M.M.; Hussein, A.D.; Najeeb, O.G.; Al-Jumaili, M.H.A. Association of hypertension and diabetes with COVID-19 severity in comparison to healthy patients. J. Circ. Biomark. 2025, 14, 39. [Google Scholar] [CrossRef] [Scilit]
  7. Bencze, D.; Fekete, T.; Pázmándi, K. Correlation between Type I Interferon Associated Factors and COVID-19 Severity. Int. J. Mol. Sci. 2022, 23, 10968. [Google Scholar] [CrossRef] [Scilit]
  8. Lamers, M.M.; Haagmans, B.L. SARS-CoV-2 pathogenesis. Nat. Rev. Microbiol. 2022, 20, 270–284. [Google Scholar] [CrossRef] [Scilit] [PubMed]
  9. Flaherty, G.T.; Hession, P.; Liew, C.H.; Lim, B.C.W.; Leong, T.K.; Lim, V.; Sulaiman, L.H. COVID-19 in adult patients with pre-existing chronic cardiac, respiratory and metabolic disease: A critical literature review with clinical recommendations. Trop. Dis. Travel Med. Vaccines 2020, 6, 16. [Google Scholar] [CrossRef] [Scilit]
  10. Veluswamy, P.; Wacker, M.; Stavridis, D.; Reichel, T.; Schmidt, H.; Scherner, M.; Wippermann, J.; Michels, G. The SARS-CoV-2/Receptor Axis in Heart and Blood Vessels: A Crisp Update on COVID-19 Disease with Cardiovascular Complications. Viruses 2021, 13, 1346. [Google Scholar] [CrossRef] [Scilit] [PubMed]
  11. Perumal, R.; Shunmugam, L.; Naidoo, K.; Wilkins, D.; Garzino-Demo, A.; Brechot, C.; Vahlne, A.; Nikolich, J. Biological mechanisms underpinning the development of long COVID. iScience 2023, 26, 106935. [Google Scholar] [CrossRef] [Scilit]
  12. Bohn, M.K.; Hall, A.; Sepiashvili, L.; Jung, B.; Steele, S.; Adeli, K. Pathophysiology of COVID-19: Mechanisms Underlying Disease Severity and Progression. Physiology 2020, 35, 288. [Google Scholar] [CrossRef] [Scilit]
  13. Akter, A.; Ahmed, T.; Tauheed, I.; Akhtar, M.; Rahman, S.I.A.; Khaton, F.; Ahmmed, F.; Ferdous, J.; Afrad, M.H.; Kawser, Z.; et al. Disease characteristics and serological responses in patients with differing severity of COVID-19 infection: A longitudinal cohort study in Dhaka, Bangladesh. PLoS Negl. Trop. Dis. 2022, 16, e0010102. [Google Scholar] [CrossRef] [Scilit]
  14. Tegeler, C.M.; Bilich, T.; Maringer, Y.; Salih, H.R.; Walz, J.S.; Nelde, A.; Heitmann, J.S. Prevalence of COVID-19-associated symptoms during acute infection in relation to SARS-CoV-2-directed humoral and cellular immune responses in a mild-diseased convalescent cohort. Int. J. Infect. Dis. 2022, 120, 187. [Google Scholar] [CrossRef] [Scilit]
  15. Sanaie, S.; Golipour, E.; Shamekh, A.; Sadaie, M.R.; Mahmoodpoor, A.; Yousefi, M. Immune response variables and viral mutations impact on COVID-19 reinfection and relapse. Int. Immunopharmacol. 2021, 100, 108108. [Google Scholar] [CrossRef] [Scilit] [PubMed]
  16. Waller, H.; Carmona-Vicente, N.; James, A.; Govender, M.; Hopkins, F.R.; Larsson, M.; Hagbom, M.; Svensson, L.; Enocsson, H.; Gustafsson, A.; et al. Viral load at hospitalization is an independent predictor of severe COVID-19. Eur. J. Clin. Investig. 2023, 53, 13882. [Google Scholar] [CrossRef] [Scilit]
  17. Dhawan, M.; Thakur, N.; Sharma, M.; Rabaan, A.A. The comprehensive insights into the B-cells-mediated immune response against COVID-19 infection amid the ongoing evolution of SARS-CoV-2. Biomed. Pharmacother. 2025, 185, 117936. [Google Scholar] [CrossRef] [Scilit]
  18. Fu, Y.; Pan, Y.; Li, Z.; Li, Y. The Utility of Specific Antibodies Against SARS-CoV-2 in Laboratory Diagnosis. Front. Microbiol. 2021, 11, 603058. [Google Scholar] [CrossRef] [Scilit]
  19. Amellal, H.; Assaid, N.; Charoute, H.; Akarid, K.; Maaroufi, A.; Ezzikouri, S.; Sarih, M. Kinetics of specific anti-SARS-CoV-2 IgM, IgA, and IgG responses during the first 12 months after SARS-CoV-2 infection: A prospective longitudinal study. PLoS ONE 2023, 18, e0288557. [Google Scholar] [CrossRef] [Scilit]
  20. Sajadi, M.M.; Myers, A.; Logue, J.; Saadat, S.; Shokatpour, N.; Quinn, J.; Newman, M.; Deming, M.; Tehrani, Z.R.; Magder, L.S.; et al. Mucosal and Systemic Responses to Severe Acute Respiratory Syndrome Coronavirus 2 Vaccination Determined by Severity of Primary Infection. mSphere 2022, 7, e0027922. [Google Scholar] [CrossRef] [Scilit] [PubMed]
  21. Serwanga, J.; Ankunda, V.; Sembera, J.; Kato, L.; Oluka, G.K.; Baine, C.; Odoch, G.; Kayiwa, J.; Auma, B.O.; Jjuuko, M.; et al. Rapid, early, and potent Spike-directed IgG, IgM, and IgA distinguish asymptomatic from mildly symptomatic COVID-19 in Uganda, with IgG persisting for 28 months. Front. Immunol. 2023, 14, 1152522. [Google Scholar] [CrossRef] [Scilit]
  22. Zhou, X.; Wu, Y.; Zhu, Z.; Lu, C.; Zhang, C.; Zeng, L.; Xie, F.; Zhang, L.; Zhou, F. Mucosal immune response in biology, disease prevention and treatment. Signal Transduct. Target. Ther. 2024, 10, 7. [Google Scholar] [CrossRef] [Scilit]
  23. Yaugel-Novoa, M.; Bourlet, T.; Paul, S. Role of the humoral immune response during COVID-19: Guilty or not guilty? Mucosal Immunol. 2022, 15, 1170. [Google Scholar] [CrossRef] [Scilit]
  24. Verbeke, R.; Hogan, M.J.; Loré, K.; Pardi, N. Innate immune mechanisms of mRNA vaccines. Immunity 2022, 55. [Google Scholar] [CrossRef] [Scilit] [PubMed]
  25. Hadjadj, J.; Yatim, N.; Barnabei, L.; Corneau, A.; Boussier, J.; Smith, N.; Péré, H.; Charbit, B.; Bondet, V.; Chenevier-Gobeaux, C.; et al. Impaired type I interferon activity and inflammatory responses in severe COVID-19 patients. Science 2020, 369, 718–724. [Google Scholar] [CrossRef] [Scilit] [PubMed]
  26. Blanco-Melo, D.; Nilsson-Payant, B.E.; Liu, W.-C.; Uhl, S.; Hoagland, D.; Møller, R.; Jordan, T.X.; Oishi, K.; Panis, M.; Sachs, D.; et al. Imbalanced Host Response to SARS-CoV-2 Drives Development of COVID-19. Cell 2020, 181, 1036. [Google Scholar] [CrossRef] [Scilit] [PubMed]
  27. Sposito, B.; Broggi, A.; Pandolfi, L.; Crotta, S.; Clementi, N.; Ferrarese, R.; Sisti, S.; Criscuolo, E.; Spreafico, R.; Long, J.M.; et al. The interferon landscape along the respiratory tract impacts the severity of COVID-19. Cell 2021, 184, 4953. [Google Scholar] [CrossRef] [Scilit]
  28. Kim, Y.M.; Shin, E.C. Type I and III interferon responses in SARS-CoV-2 infection. Exp. Mol. Med. 2021, 53, 750–760. [Google Scholar] [CrossRef] [Scilit]
  29. Setaro, A.C.; Gaglia, M.M. All hands on deck: SARS-CoV-2 proteins that block early anti-viral interferon responses. Curr. Res. Virol. Sci. 2021, 2, 100015. [Google Scholar] [CrossRef] [Scilit]
  30. Rashid, F.; Xie, Z.; Suleman, M.; Shah, A.; Khan, S.; Luo, S. Roles and functions of SARS-CoV-2 proteins in host immune evasion. Front. Immunol. 2022, 13, 940756. [Google Scholar] [CrossRef] [Scilit]
  31. Shemesh, M.; Aktepe, T.E.; Deerain, J.M.; McAuley, J.L.; Audsley, M.D.; David, C.T.; Purcell, D.F.J.; Urin, V.; Hartmann, R.; Moseley, G.W.; et al. SARS-CoV-2 suppresses IFNβ production mediated by NSP1, 5, 6, 15, ORF6 and ORF7b but does not suppress the effects of added interferon. PLoS Pathog. 2021, 17, e1009800. [Google Scholar] [CrossRef] [Scilit]
  32. Lim, X.R.; Liu, S.; Howe, H.S.; Leong, K.P.; Elangovan, E.; Huang, C.-H.; Kong, K.O.; Thong, B.Y.H.; Vasoo, S.; Leung, B.P.L. The Role of Anti-Interferon-α Autoantibodies in Severe COVID-19: Implications for Vaccination Prioritization. Vaccines 2025, 13, 742. [Google Scholar] [CrossRef] [Scilit]
  33. Liu, Y.; Yan, L.-M.; Wan, L.; Xiang, T.-X.; Le, A.; Liu, J.-M.; Peiris, M.; Poon, L.L.M.; Zhang, W. Viral dynamics in mild and severe cases of COVID-19. Lancet Infect. Dis. 2020, 20, 656–657. [Google Scholar] [CrossRef] [Scilit]
  34. Zheng, H.-Y.; Zhang, M.; Yang, C.-X.; Zhang, N.; Wang, X.-C.; Yang, X.-P.; Dong, X.-Q.; Zheng, Y.-T. Elevated exhaustion levels and reduced functional diversity of T cells in peripheral blood may predict severe progression in COVID-19 patients. Cell. Mol. Immunol. 2020, 17, 541–543. [Google Scholar] [CrossRef] [Scilit]
  35. Dadras, O.; Afsahi, A.M.; Pashaei, Z.; Mojdeganlou, H.; Karimi, A.; Habibi, P.; Barzegary, A.; Fakhfouri, A.; Mirzapour, P.; Janfaza, N.; et al. The relationship between COVID-19 viral load and disease severity: A systematic review. Immun. Inflamm. Dis. 2022, 10, e580. [Google Scholar] [CrossRef] [Scilit] [PubMed]
  36. Mwanga, M.J.; Lambisia, A.W.; Morobe, J.M.; Murunga, N.; Moraa, E.; Ndwiga, L.; Cheruiyot, R.; Musyoki, J.; Mutunga, M.; Guzman-Rincon, L.M.; et al. New SARS-CoV-2 Omicron Variant with Spike Protein Mutation Y451H, Kilifi, Kenya, March–May 2023. Emerg. Infect. Dis. 2023, 29, 2376–2379. [Google Scholar] [CrossRef] [Scilit]
  37. Hajilooi, M.; Keramat, F.; Moazenian, A.; Rastegari-Pouyani, M.; Solgi, G. The quantity and quality of anti-SARS-CoV-2 antibodies show contrariwise association with COVID-19 severity: Lessons learned from IgG avidity. Med. Microbiol. Immunol. 2023, 212, 203–220. [Google Scholar] [CrossRef] [Scilit] [PubMed]
  38. Anichini, G.; Terrosi, C.; Gandolfo, C.; Savellini, G.G.; Fabrizi, S.; Miceli, G.B.; Cusi, M.G. SARS-CoV-2 Antibody Response in Persons with Past Natural Infection. N. Engl. J. Med. 2021, 385, 90–92. [Google Scholar] [CrossRef] [Scilit] [PubMed]
Figure 1. Anti-SARS-CoV-2 IgG in the blood of SARS-CoV-2-infected patients. The spike (a), RBD (b), and nucleocapsid (c) IgG levels in blood collected during asymptomatic, moderate, and severe COVID-19 cases were compared. The horizontal line represents the median. Statistical differences among the three groups were calculated using the Kruskal–Wallis’s test with Dunn’s multiple comparisons between groups. Effect sizes were estimated using Cohen’s d. n = 16 per group. * p < 0.05.
Covid 06 00051 g001
Figure 2. The responses of airway SARS-CoV-2-specific IgG in the asymptomatic, moderate, and severe COVID-19 groups. Blood test levels of (a) spike, (b) RBD, and (c) nucleocapsid IgG binding antibody in disease-infected individuals (unvaccinated) stratified by disease severity were measured. All values are individual participants; the horizontal blocks are the median values and the inter-quartile ranges. The severe cases were significantly more characterized by systemic anti-spike, anti-RBD, and anti-N IgG levels than the moderate and asymptomatic groups (p < 0.05, Kruskal–Wallis test with Dunn correction).
Covid 06 00051 g002
Figure 3. Stratified anti-SARS-CoV-2 IgG in blood by days of symptom onset in the moderate and severe disease patients. The IgG levels of spike, RBD, and nucleocapsid were assessed in the blood (a,b) of people with moderate and severe COVID-19, and the results were split depending on days after symptom onset (a) or severity and days after symptom onset (b). The horizontal line represents the median. Statistical differences among the three groups were calculated using Kruskal–Wallis with Dunn’s multiple comparisons between groups.
Covid 06 00051 g003
Figure 4. Interferon and interferon-stimulating gene response in patients with SARS-CoV-2: The levels of mRNA of blood IFN-α (a), IFN-β (b), IFN-γ (c), and IFI-16 (d) and mucosal NP/OP IFN-α (e), IFN-β (f), IFN-γ (g), and IFI-16 (h) of individuals with asymptomatic, moderate, and severe COVID-19 were evaluated. The horizontal line represents the median. Statistical significance among the three groups was calculated using Kruskal–Wallis with Dunn’s multiple comparisons between groups. * p < 0.05.
Covid 06 00051 g004
Figure 5. SARS-CoV-2 viral load in various severity groups of COVID-19 and days post symptoms. qPCR was used to measure viral load in NP/OP samples of those with asymptomatic, moderate, and severe COVID-19. Data was divided based on severity (a), on days after symptom onset for patients with moderate and severe disease (b), and on days after symptom onset stratified within moderate and severe disease groups (c). The horizontal line represents the median. Statistical differences among the three groups were calculated using Kruskal–Wallis with Dunn’s multiple comparisons between groups. * p < 0.05.
Covid 06 00051 g005
Disclaimer/Publisher’s Note: The statements, opinions and data contained in all publications are solely those of the individual author(s) and contributor(s) and not of MDPI and/or the editor(s). MDPI and/or the editor(s) disclaim responsibility for any injury to people or property resulting from any ideas, methods, instructions or products referred to in the content.