1. Introduction
In recent decades, the European Union labour market has undergone accelerated transformation, driven by technological progress, the expansion of available data, and the growing demand for efficient and sustainable solutions to complex socio-economic challenges [
1]. These dynamics have intensified the need for policies and analytical frameworks capable of supporting inclusive and resilient economic growth.
In this context, the United Nations 2030 Agenda for Sustainable Development provides a comprehensive global framework through its 17 Sustainable Development Goals (SDGs), which represent a time-critical mandate for coordinated action by both developed and developing countries [
2]. Several of these goals are directly or indirectly connected to labour market performance, economic development and human capital formation. Among them, SDG 1—No Poverty [
3], SDG 4—Quality Education [
4], SDG 8—Decent Work and Economic Growth [
5], and SDG 9—Industry, Innovation and Infrastructure [
6] are particularly relevant.
The European labour market contributes to the pursuit of the Sustainable Development Goals in several interconnected ways, particularly through its role in promoting inclusive growth, social cohesion, and economic resilience. Empirical studies on EU countries demonstrate the relationship between productive employment and sustainable development, highlighting the role of the labour market in promoting inclusive growth [
7]. By facilitating high employment rates and stable job creation, the EU labour market directly supports SDG 8—Decent Work and Economic Growth, ensuring that economic development is accompanied by productive and gainful employment [
8,
9,
10]. SDG 8 plays a central role, as it explicitly targets the promotion of decent work, productive employment, entrepreneurship and safe working conditions, alongside sustained efforts to reduce unemployment and labour market vulnerabilities [
5]. Despite its importance, previous research highlights a relatively limited focus on the challenges of economic growth through the lens of SDG 8, which may contribute to persistent issues such as insecure employment conditions and insufficient labour rights [
11,
12].
Despite the growing body of literature addressing labour market dynamics in the European Union, there remains limited empirical evidence on how specific labour market dysfunctions interact with human capital, innovation, and economic development within the Sustainable Development Goal 8 (SDG 8) framework. Existing studies often analyse these dimensions in isolation, without providing an integrated assessment of their joint influence on employment performance at the EU level.
The research problem addressed in this study concerns the identification and quantification of the main structural and socio-economic mechanisms that shape employment outcomes in the EU, with a particular focus on youth disengagement, long-term unemployment, educational attainment, innovation intensity, and economic development. The aim of this study is to empirically assess how labour market dysfunctions, human capital, innovation and economic development jointly influence the employment rate in the EU within the framework of SDG 8—Decent Work and Economic Growth.
Accordingly, the central research question guiding this paper is the following: to what extent do labour market dysfunctions, human capital, innovation and economic development jointly influence the employment rate in the European Union in the context of SDG 8—Decent Work and Economic Growth?
To address this question, the article employs a panel data econometric framework covering the EU-27 over the period 2015–2024, allowing for a systematic empirical assessment of the relative impact of these mechanisms on employment performance.
The EU labour market serves as the engine for the European Pillar of Social Rights, yet its role in the pursuit of the 2030 Agenda remains under-theorized in terms of structural barriers. While the existing literature acknowledges the importance of employment, there is a notable research gap concerning the specific mechanisms through which social exclusion indicators (such as NEET and chronic unemployment) actively counteract the benefits of technological innovation. This study moves beyond generic descriptions of labour outcomes to provide an empirically grounded contribution to the existing conceptual debate: it identifies the ‘decoupling effect’ between GDP growth and job quality in the context of the twin transition. The aim is to map the specific routes of influence that education and R&D expenditure have on overcoming labour underutilization. By doing so, the research provides an empirical bridge between macroeconomic policy and the micro-level realities of vulnerable households, offering a novel diagnostic tool for assessing the sustainability of European employment models.
2. Literature Review
Recent scholarly debates [
13,
14,
15] emphasize that the European Union (EU) labour market is undergoing a “twin transition”—digital and green—which fundamentally redefines the parameters of sustainable employment. In the specialized literature [
16] the development of an “Green Labour Market Readiness Index (GLMRI)” as a comprehensive tool to assess and compare the adaptability of EU labour markets to the low-carbon transition, integrating multiple dimensions (skills, investment, policy, labour structures, and innovation) and providing actionable insights for policy and resource prioritization strength the idea of the necessity to adapt to the digital and green transition. According to recent studies [
17,
18] indicators such as the NEET rate (sdg_08_20) are no longer viewed merely as measures of youth inactivity, but as critical predictors of long-term economic “scarring effects” that undermine the social pillar of the Sustainable Development Goals (SDGs). Within this evolving landscape, labour market performance is shaped by a complex interaction between structural characteristics, human capital accumulation, technological change, and macroeconomic conditions. A growing strand of literature adopts an SDG-oriented perspective, highlighting employment rate indicators as central measures of progress under SDG 8—Decent Work and Economic Growth. Systematic reviews and empirical studies underline that these dynamics are sensitive to policy interventions, economic cycles, and crises, such as the COVID-19 shock, which have amplified existing disparities across Member States [
11,
12].
The employment rate indicator (EMP—sdg_08_30), utilized as the dependent variable in this study, is a well-established metric for assessing social convergence and resilience. This study aligns with the methodological framework of Lafuente et al. [
19], who employed this variable to evaluate labour market stability, while also drawing on comprehensive systematic reviews that assess the implementation of “decent jobs” within the SDG 8 framework [
12].
A critical dimension of labour market dysfunction is youth exclusion, captured by the rate of young people neither in employment, education, or training (NEET—sdg_08_20). Recent empirical analyses, such as those by Maynou et al., 2022 [
20] and Jianu, 2020 [
21] explicitly employ the NEET rate as a primary explanatory variable, highlighting its strong negative association with overall employability. Furthermore, research examining the impact of economic freedom on youth inactivity suggests that reducing NEET rates requires policies that enhance market flexibility and reduce administrative barriers [
22]. These findings are complemented by studies highlighting the correlation between NEET status and broader socio-economic and health-related factors [
23].
Structural constraints are further reflected in the long-term unemployment rate (LTU—sdg_08_40), a variable frequently included in panel data analyses of EU and OECD countries to measure labour market rigidity and hysteresis effects. Empirical evidence from the period 1990–2020 indicates that while financial development can mitigate long-term unemployment [
24], its persistence generally erodes human capital and limits aggregate growth. This structural vulnerability is closely linked to labour underutilization, captured by the share of people living in households with very low work intensity (LW_I—sdg_01_40). Following the approach of Hünefeld et al., 2025 [
25], this study integrates work intensity as a structural moderator, recognizing its strong association with material deprivation and social exclusion in the EU-27 [
26].
Beyond dysfunctions, the literature identifies human capital and innovation as the primary drivers of employment. The share of individuals aged 25–34 with tertiary education (EDU—sdg_04_20) is consistently used in panel studies to analyze the nexus between education, GDP, and economic development [
27]. Higher educational attainment is recognized as a fundamental pillar for productivity and resilience to economic shocks. Simultaneously, innovation intensity, measured by gross domestic expenditure on research and development (R&D—sdg_09_10), plays a dual role. While the traditional literature highlights its positive impact on job creation [
28,
29,
30], recent studies [
31,
32] suggest a more nuanced reality where technological intensity may lead to “jobless growth” if not matched by significant upskilling.
Real GDP per capita (GDP_c—sdg_08_10) remains a fundamental control variable in labour market models [
27,
33,
34]. Although higher economic development is generally associated with better employment outcomes, recent research [
35] points to a decoupling effect in advanced economies, where productivity gains through automation may not necessarily translate into proportional employment growth. By integrating these diverse factors—labour market dysfunctions, human capital, innovation, and economic development—into a single econometric framework, this study addresses the relative lack of integrated empirical analyses focused on the sustainability of the EU-27 labour market.
3. Research Design and Hypotheses
Based on the theoretical considerations and the empirical literature reviewed, the study formulates a set of testable hypotheses regarding the expected direction of the relationships between the employment rate and the selected explanatory variables.
Specifically, the analysis tests whether youth labour market exclusion (NEET rate), long-term unemployment and low household work intensity exert a negative influence on employment, while higher educational attainment, innovation expenditure and economic development contribute positively to employment outcomes.
Based on the theoretical framework and the specialized literature on the functioning of the labour market and its connection with the SDGs, this study formulates a set of research hypotheses aimed at the direction and significance of the relationship between the employment rate and the main socio-economic factors analyzed. The hypotheses are constructed in such a way as to allow empirical testing of the role of labour market dysfunctions, human capital, innovation and the level of economic development in achieving SDG 8 objectives at the level of the EU.
The first hypothesis assumes the existence of a negative relationship between the share of young people who are neither employed nor in education or training (NEET) and the employment rate. A high level of the NEET rate indicates persistent difficulties in integrating young people into the labour market and signals structural deficiencies in the transition from education to employment, with adverse effects on the overall performance of the labour market.
The second hypothesis targets the relationship between the long-term unemployment rate and the employment rate, anticipating a negative effect of persistent unemployment on the level of employment. Long-term unemployment is associated with skills depreciation, reduced employability and increased risk of social exclusion, which limits the capacity of the labour market to absorb the available labour force.
The third hypothesis assumes a negative relationship between the share of people living in households with very low work intensity and the employment rate. This indicator reflects forms of underutilization of labour at the household level and is closely linked to inactivity and socio-economic vulnerability, having a direct impact on the aggregate level of employment.
The fourth hypothesis refers to the role of human capital, anticipating a positive relationship between the share of people aged 25–34 who have completed tertiary education and the employment rate. A higher level of education is associated with increased productivity, greater adaptability to technological change and higher probability of integration into the labour market, including in sectors with high added value.
The fifth hypothesis assumes a positive relationship between research and development spending and employment. Investment in research and innovation is considered an essential factor in creating sustainable jobs and facilitating digital and green transitions, contributing to boosting demand for skilled labour.
The sixth hypothesis focuses on the link between the level of economic development and the employment rate, anticipating a positive effect of real gross domestic product per capita on employment. Economies with a higher level of development generally have a greater capacity to create jobs, more efficient labour market institutions and public policies better adapted to supporting employment.
The formulation of these hypotheses allows for the empirical testing of the main mechanisms through which structural and socio-economic factors influence labour market performance in the EU and contribute to the achievement of the SDGs set out in the 2030 Agenda.
The empirical analysis is conducted using panel data econometric techniques, combining cross-sectional and time-series dimensions. The baseline estimation relies on multiple linear regression applied to panel data, allowing for the identification of average relationships between employment and its determinants across EU Member States over time.
The estimation procedure is complemented by a backward stepwise selection method, based on the probability of the F-statistic for variable removal, in order to identify the most relevant explanatory variables. Diagnostic tests are conducted to ensure model validity, including multicollinearity diagnostics (Variance Inflation Factors and condition indices), residual normality tests and autocorrelation assessment using the Durbin–Watson statistic.
To ensure the reliability of our findings, the data analysis was conducted in two distinct phases. First, a descriptive and correlational analysis was performed to identify primary associations. Second, a multivariate panel regression was executed using SPSS Statistics version 20.0 (IBM Corp., Armonk, NY, USA). Unlike previous studies that often treat states as isolated units, our methodology accounts for the cross-sectional dependencies within the EU-27. Furthermore, following the recommendation to enhance methodological transparency, we moved the diagnostic tests—previously located in the results section—to this stage. These include the Durbin–Watson test for autocorrelation and the VIF analysis for multicollinearity, ensuring that the model is not only statistically significant but also structurally sound for policy forecasting.
The study uses panel data at country level, having as the unit of analysis the 27 Member States of the European Union (EU-27), for the period 2015–2024. The data are taken from the Eurostat database [
36], in particular from the set of SDG indicators and labour market statistics, ensuring methodological comparability between countries and over time. The choice of the analysis period allows capturing both the structural trends of the European labour market and the impact of recent shocks on employment.
In the empirical analysis, the variables (
Table 1) used are structured into three distinct categories: the dependent variable, the independent variables and the control variables. This delimitation allows a clear assessment of the relationship between the performance of the labour market and the socio-economic factors relevant for sustainable development in the EU.
The dependent variable of the study is the employment rate, measured using the Employment Rate Indicator (sdg_08_30). This indicator is widely used in empirical studies [
37,
38,
39] analysing labour market performance and progress toward SDG 8, as it reflects the capacity of national economies to integrate the working-age population into productive employment. Previous research focusing on the EU context has employed the employment rate as a core outcome variable when assessing the impact of labour market policies, economic development and structural change.
The rate of young people neither in employment, education or training (NEET—sdg_08_20) is included as a key independent variable capturing youth labour market exclusion and structural barriers in the school-to-work transition. The NEET indicator is widely used in empirical analyses of EU labour markets as a proxy for labour market dysfunction and social vulnerability. Previous studies examining employment outcomes and youth integration in the European Union explicitly incorporate the NEET rate as an explanatory variable, highlighting its strong and persistent negative association with employment performance and long-term employability [
40,
41]. Its inclusion is therefore justified by both theoretical considerations and extensive empirical evidence.
The long-term unemployment rate (sdg_08_40) is employed as an independent variable to capture persistent labour market rigidities and hysteresis effects. Long-term unemployment is frequently used in cross-country and panel data studies as an indicator of structural labour market imbalance, reflecting skill depreciation, reduced employability and barriers to re-entry into employment. Empirical research focusing on EU and OECD countries commonly includes the long-term unemployment rate when analysing employment dynamics, labour market resilience and macroeconomic performance [
24]. Its inclusion allows the assessment of the extent to which persistent unemployment constrains overall employment growth in the EU.
The share of people living in households with very low work intensity (sdg_01_40) is included as an independent variable reflecting labour underutilisation at the household level and the social dimension of employment. This indicator has been widely employed in EU-level studies addressing labour market vulnerability, poverty and social exclusion, as it captures situations in which available labour resources are insufficiently engaged in paid work. Previous empirical research incorporating this variable demonstrates its relevance for understanding employment sustainability and labour market attachment, particularly in comparative analyses across EU Member States [
26].
Human capital is controlled for using the share of individuals aged 25–34 who have completed tertiary education (sdg_04_20). This indicator is extensively used in empirical studies analysing the relationship between education, employment and economic development, particularly in cross-country and panel data frameworks. Previous research highlights that higher educational attainment is associated with increased employability, productivity and adaptability to technological change, leading to more resilient labour market outcomes [
27]. The inclusion of this variable allows controlling for differences in human capital endowment across EU Member States.
Gross domestic expenditure on research and development (R&D—sdg_09_10), expressed as a percentage of GDP, is included as a control variable capturing innovation intensity and technological capacity. R&D expenditure is commonly used in studies examining the relationship between innovation, labour market outcomes and structural change. Empirical evidence suggests that while R&D investment may not always have a direct effect on aggregate employment levels, it influences employment indirectly through changes in skill demand, job quality and sectoral composition [
28,
29]. Its inclusion allows assessing whether innovation-related factors contribute to employment performance in the EU context.
The level of economic development is controlled for using real gross domestic product per capita (sdg_08_10). GDP per capita is a standard macroeconomic indicator widely employed in labour market analyses to capture differences in economic development, productivity and living standards across countries. Previous empirical studies include GDP per capita as a key explanatory or control variable when analysing employment dynamics, economic growth and inclusion outcomes [
33,
34]. Its inclusion allows disentangling the effects of labour market dysfunctions and human capital from broader macroeconomic conditions.
Based on these variables, the empirical relationship is estimated by means of a linear regression model applied to panel data, with the following general specification:
where
is the employment rate in Member State i in year t,
is the rate of young people not in employment, education or training,
is the long-term unemployment rate,
is the share of people living in households with very low work intensity,
is the tertiary education attainment of the young population,
is the expenditure on research and development, and
is the real GDP per capita. The term
captures country-specific effects, which are constant over time, and
is the random error term.
This specification allows testing the formulated hypotheses and assessing the relative impact of structural, social and economic factors on the employment rate, in the context of the SDGs assumed by the EU.
The validity and robustness of the estimated regression model are supported by a series of diagnostic tests reported in the
Appendix A.1,
Appendix A.2,
Appendix A.3,
Appendix A.4,
Appendix A.5 and
Appendix A.6. Collinearity diagnostics indicate that multicollinearity does not pose a significant concern, as variance inflation factor (VIF) values remain below commonly accepted thresholds, and condition indices, although elevated for dimensions associated with the constant, do not indicate harmful collinearity among the explanatory variables (
Appendix A.2). In addition, the correlation matrices presented in
Appendix A.1 show moderate associations between explanatory variables, which do not compromise the stability of the coefficient estimates. The analysis of excluded variables (
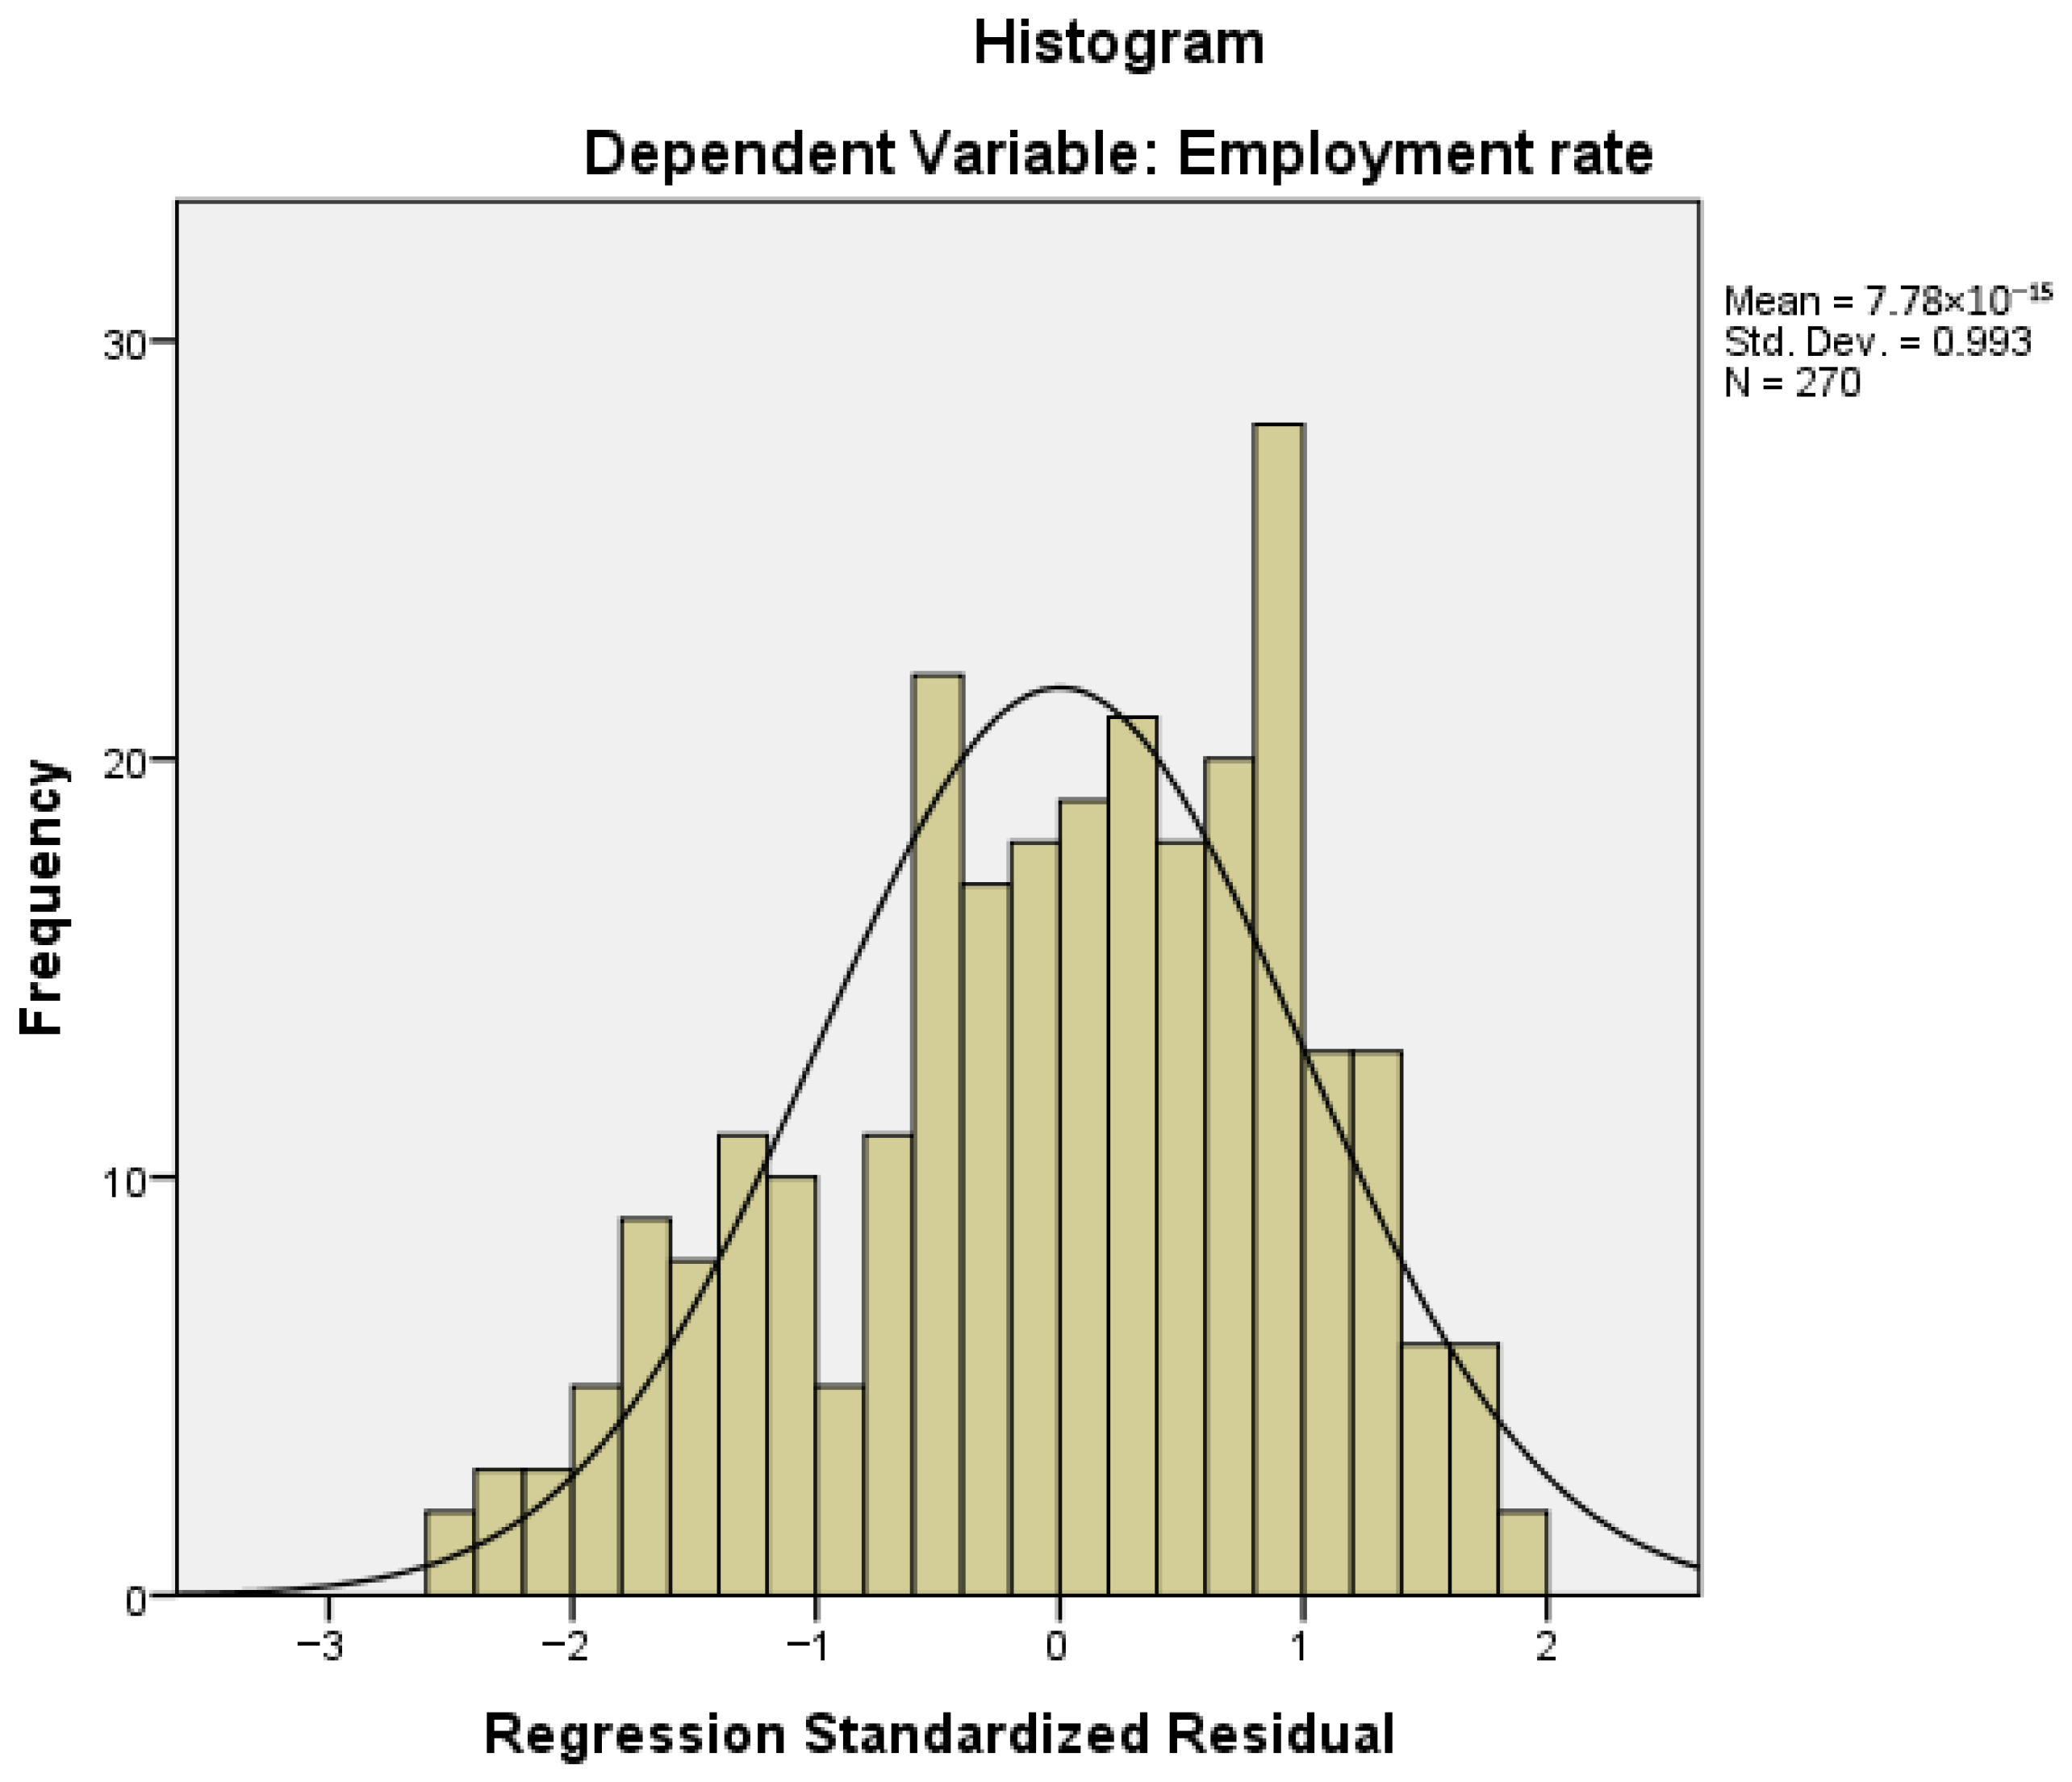
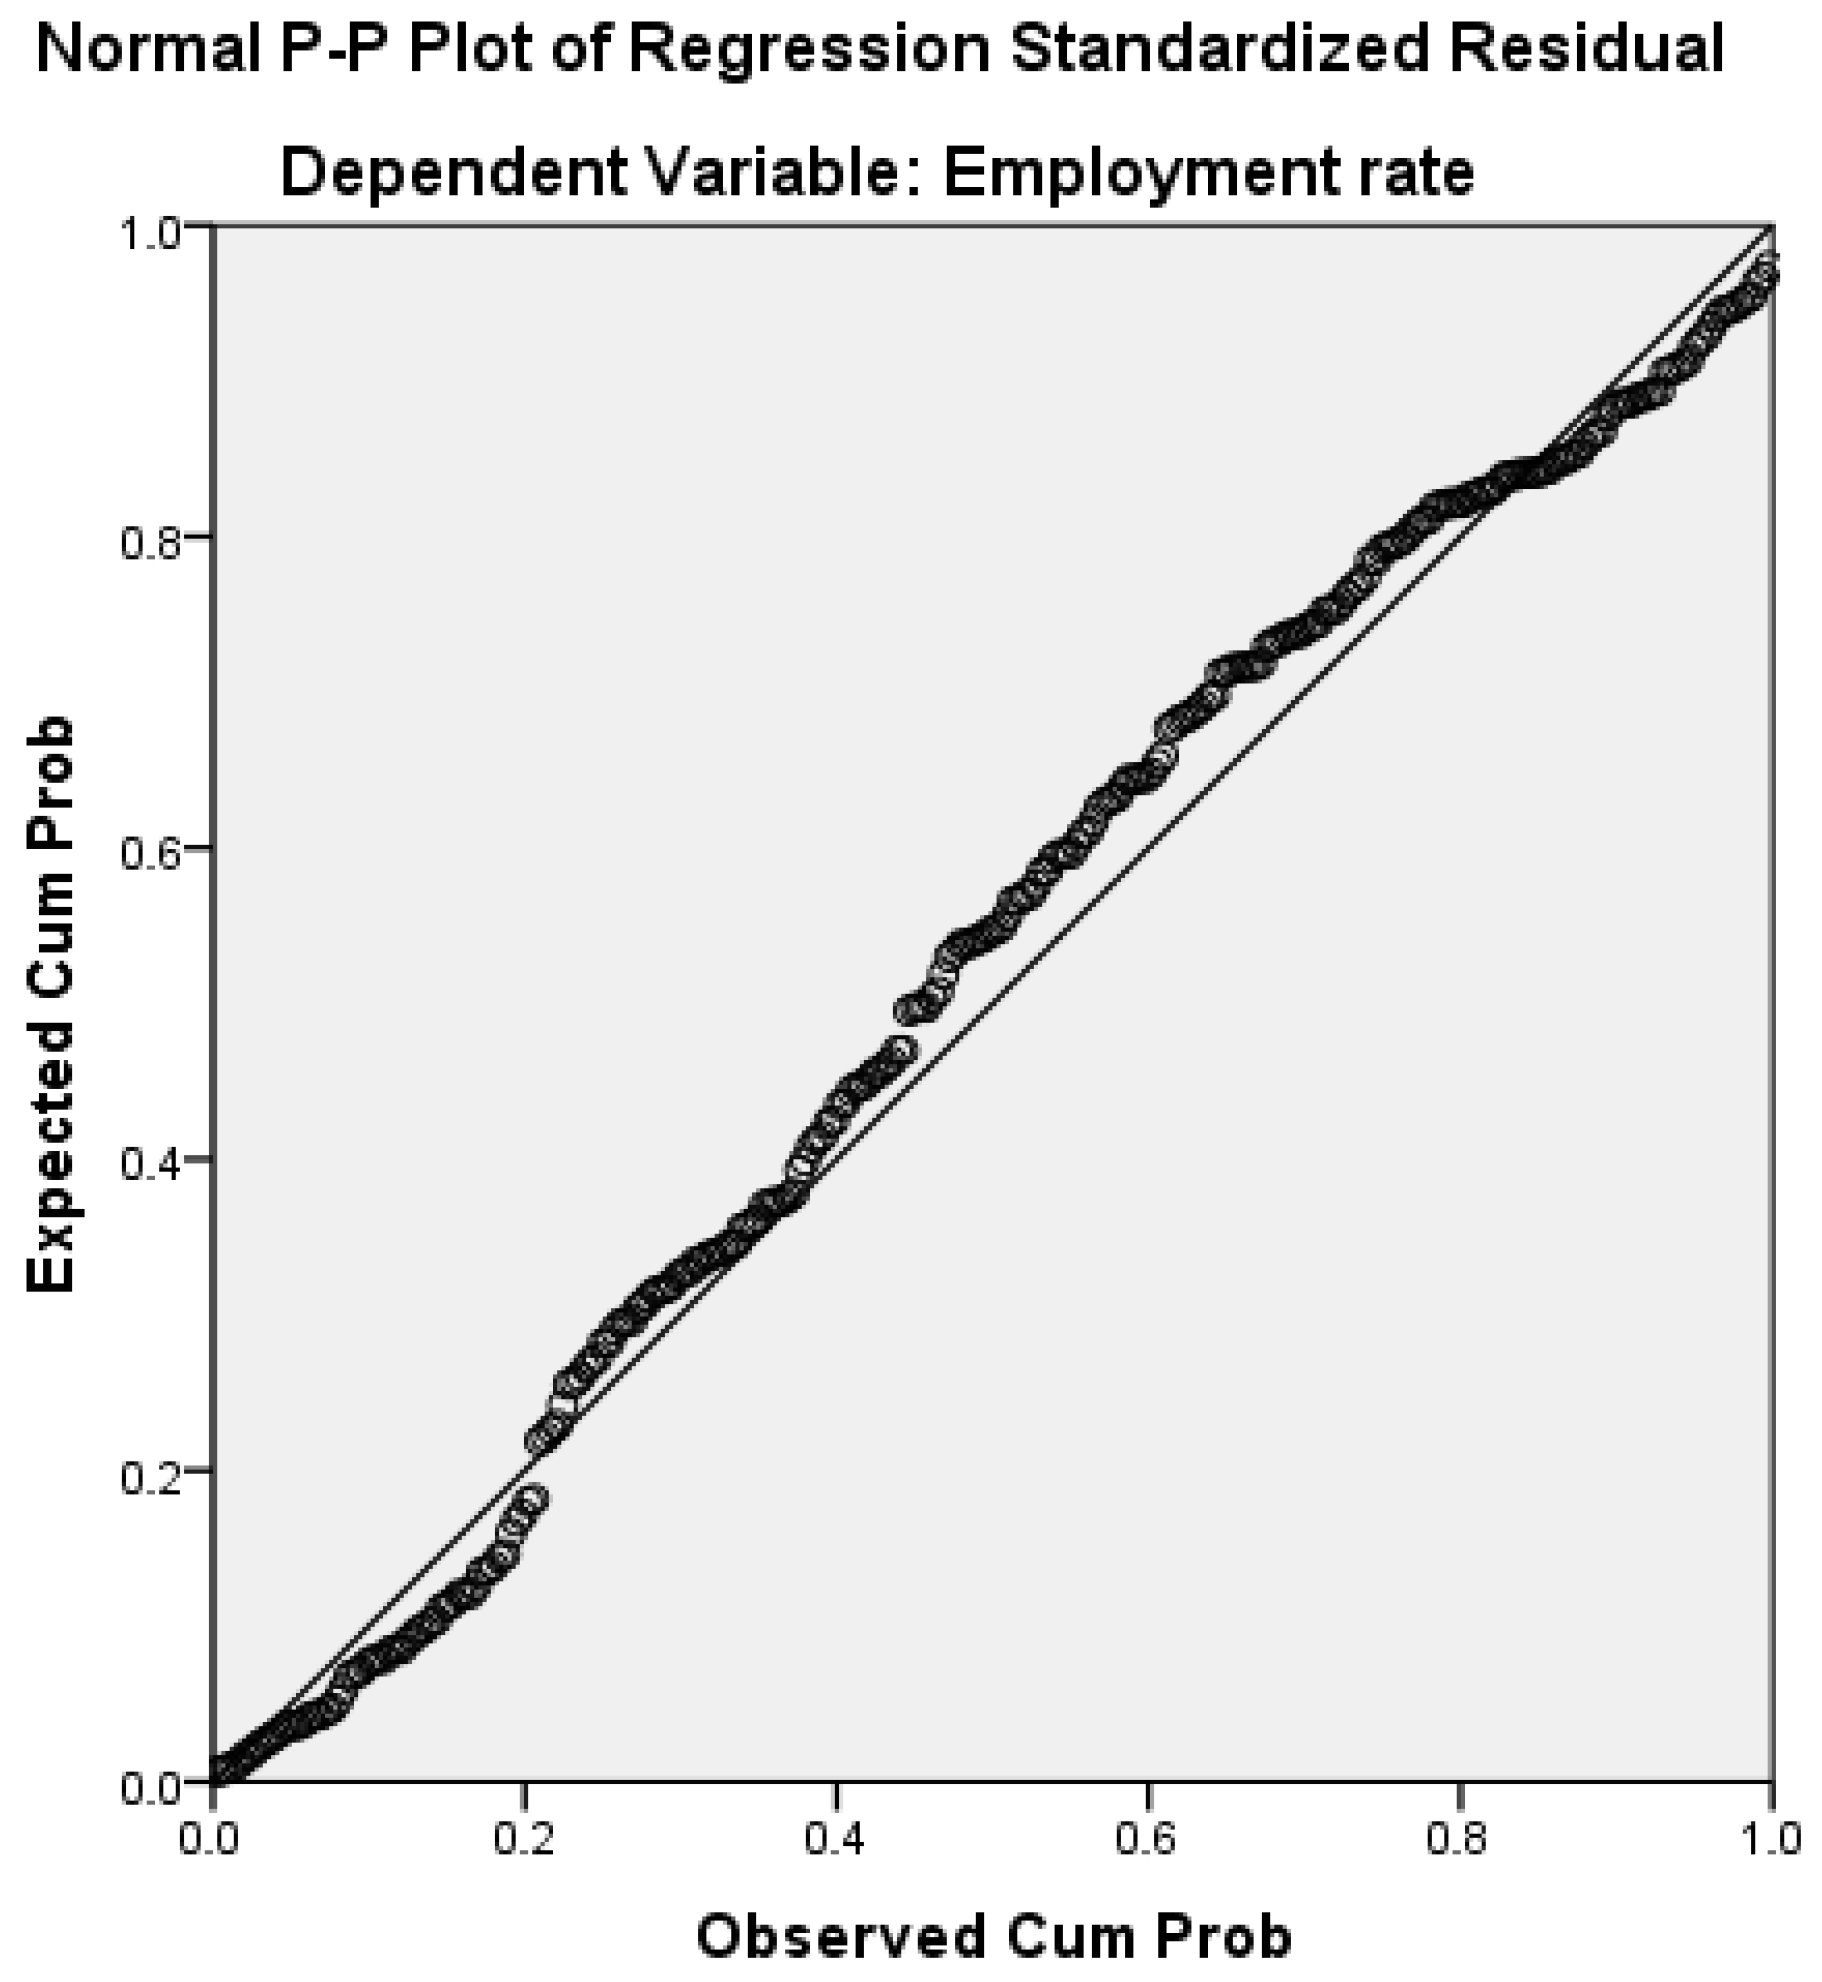
Appendix A.3) further confirms that the removal of R&D expenditure and the share of people living in households with very low work intensity is justified on statistical grounds. Residual diagnostics provide additional evidence of model adequacy: the residuals are approximately normally distributed, as illustrated by the histogram and the normal P–P plot of standardized residuals (
Appendix A.5 and
Appendix A.6), and exhibit no systematic patterns that would indicate misspecification. Taken together, these diagnostic results support the reliability of the estimated coefficients and the overall robustness of the empirical findings.
4. Results
Table 2 presents the descriptive statistics for the variables included in the empirical model, based on a total of 270 observations. The results provide an overview of the central tendency, dispersion and distributional properties of the employment rate and its main socio-economic determinants across the analysed sample.
The descriptive statistics indicate a relatively high average employment rate in the sample (mean: 73.8%), with moderate variability, suggesting that most observations are characterised by solid labour market performance. The negative skewness of the employment rate distribution shows that lower employment levels are confined to a limited number of cases, while the majority of observations cluster around higher values.
Indicators capturing labour market dysfunction display greater dispersion and asymmetric distributions. The NEET rate exhibits substantial heterogeneity, with a right-skewed distribution, indicating that although most observations record moderate levels of youth inactivity, a smaller group is affected by persistently high NEET rates. Long-term unemployment shows the most pronounced asymmetry and kurtosis, reflecting the presence of extreme values and highlighting its structural and persistent nature in certain observations rather than a widespread phenomenon.
The share of people living in households with very low work intensity also presents notable variability and positive skewness, suggesting that labour underutilisation at the household level is unevenly distributed and concentrated in more vulnerable socio-economic contexts.
Regarding the control variables, the relatively high average share of tertiary-educated individuals points to a generally strong level of human capital, although the observed dispersion reveals significant cross-observation differences. R&D expenditure remains modest on average and positively skewed, indicating that higher innovation intensity is limited to a smaller number of cases. Finally, real GDP per capita displays the highest level of dispersion and strong right skewness, underlining substantial disparities in economic development across the sample.
The descriptive evidence reveals pronounced heterogeneity across labour market outcomes, human capital, innovation and economic development. This heterogeneity supports the relevance of a multivariate econometric approach and provides preliminary descriptive support for the hypothesised relationships between employment, labour market dysfunctions and key socio-economic factors.
Building on the descriptive statistics, the analysis advances to an empirical assessment based on regression techniques in order to formally evaluate the relationships between the employment rate and its main socio-economic determinants.
The empirical analysis was carried out using the multiple linear regression method with backward stepwise selection, with the employment rate as the dependent variable. In the first stage, all six explanatory variables considered relevant based on the theoretical framework were included: the NEET rate, the long-term unemployment rate, the share of people living in households with very low work intensity, the level of tertiary education, research and development expenditure and real GDP per capita. The backward procedure allowed the successive elimination of variables that do not contribute significantly to explaining the variation in the employment rate, based on the F-probability criterion of remove.
The results of the selection process (
Table 3) indicate that, following the application of the backward method, the variables “expenditure on research and development” and “people living in households with very low work intensity” were eliminated from the model, as their coefficients were not statistically significant. The final model (Model 3) retains four explanatory variables: the NEET rate, the long-term unemployment rate, the level of tertiary education and real GDP per capita, which demonstrate a significant contribution to explaining the variation in the employment rate.
The explanatory power of the final model is high (
Table 4). The adjusted coefficient of determination (Adjusted R
2) has a value of 0.783, indicating that approximately 78.3% of the variation in the employment rate at EU-27 level in the period 2015–2024 is explained by the variables included in the model. The similar values of the R
2 and Adjusted R
2 coefficients suggest a well-specified model, without overloading with irrelevant variables. The Durbin–Watson statistics, with a value of 1.712, indicate the absence of severe autocorrelation of the residual errors, confirming the validity of the estimate.
The ANOVA test (
Table 5) confirms the overall relevance of the final model. The value of the F statistic is high (F = 243.886) and the associated significance level is below the 0.01 threshold, indicating that the model is statistically significant and that the explanatory variables, considered together, contribute significantly to explaining the employment rate.
The analysis of the estimated coefficients for the final model (
Table 6) highlights relationships consistent with the theoretical hypotheses formulated. The NEET rate has a negative and significant effect on the employment rate, the estimated coefficient indicating that a one percentage point increase in the share of NEET youth is associated, on average, with a decrease in the employment rate of approximately 0.78 percentage points. The high standardized coefficient associated with this variable suggests that the NEET rate represents one of the strongest negative determinants of employment in the EU.
The long-term unemployment rate also exerts a significant negative impact on the employment rate. The increase in this indicator is associated with a substantial reduction in employment, confirming that persistent unemployment reflects structural rigidities of the labour market and difficulties in professional reintegration, with adverse effects on the sustainability of employment.
The level of tertiary education has a positive and significant effect on the employment rate. The results indicate that a higher share of the young population with higher education contributes to employment growth, highlighting the role of human capital in adapting the labour market to technological and structural changes. Although the standardized coefficient is smaller compared to variables related to labour market dysfunctions, its effect is robust and statistically significant.
Real GDP per capita is associated with a negative and significant effect on the employment rate in the final model. This seemingly counterintuitive result can be interpreted in light of structural differences between EU economies, where higher levels of GDP are often correlated with increased productivity and automation, which can reduce the relative demand for labour, especially in certain sectors. Thus, the result suggests that the level of economic development does not automatically guarantee a higher employment rate, highlighting the importance of the quality of economic growth and active employment policies.
The analysis of collinearity diagnostics confirms the robustness of the final model. The values of the variance inflation factors (VIFs) are below the critical threshold, and the condition indices, although high for the dimensions associated with the constant, do not indicate severe multicollinearity problems between the explanatory variables. The correlations between the coefficients are moderate and do not affect the stability of the estimates.
The results obtained by applying the stepwise backward method validate most of the hypotheses formulated and highlight the central role of labour market dysfunctions, in particular the NEET rate and long-term unemployment, in explaining the variation in the employment rate in the EU. The importance of human capital is also confirmed, while the elimination of variables related to R&D and low work intensity suggests that their impact on employment is indirect or mediated by other structural factors. These results provide a solid basis for formulating public policy implications aimed at integrating young people, reducing persistent unemployment and strengthening education as a pillar of sustainable employment.
Our finding regarding the negative correlation between GDP per capita and the employment rate—though seemingly counterintuitive—aligns with the ‘productivity paradox’ discussed by Acemoglu and Restrepo, 2020 [
35]. This suggests that in highly developed EU economies, capital-intensive growth and automation may decouple from labour-intensive expansion. Furthermore, the significant impact of the NEET rate on overall employment found in our model corroborates the findings of Güzel and Aktaş [
22], reinforcing the idea that youth exclusion is the most significant structural drag on the achievement of SDG 8 in Eastern and Southern Europe.
6. Conclusions
This paper examined the determinants of employment in the European Union in the context of the Sustainable Development Goals, with a particular focus on SDG 8—Decent Work and Economic Growth. Using a panel dataset covering the EU-27 over the period 2015–2024 and a multivariate regression framework, the study provides empirical evidence on the role of labour market dysfunctions, human capital, innovation and economic development in shaping employment outcomes.
6.1. Key Findings
The empirical results highlight several robust and policy-relevant findings. First, labour market dysfunctions play a central role in explaining employment performance in the EU. Both the NEET rate and long-term unemployment exert strong, negative and statistically significant effects on the employment rate, confirming that youth exclusion and persistent unemployment represent major structural barriers to achieving decent and inclusive employment. Among these, the NEET rate emerges as one of the most influential determinants, underscoring the long-term consequences of weak school-to-work transitions.
Human capital proves to be a key positive driver of employment. The share of young people with completed tertiary education is positively and significantly associated with the employment rate, indicating that higher education enhances employability and supports labour market resilience in the context of technological and structural change.
The results show that real GDP per capita has a significant but negative association with the employment rate. This finding suggests that higher levels of economic development do not automatically translate into higher employment and may reflect productivity gains, automation and sectoral restructuring that reduce labour demand in certain economies. In contrast, variables related to R&D expenditure and very low household work intensity do not exhibit a direct and significant effect on employment, indicating that their influence is likely indirect or mediated through other structural factors.
The findings confirm that the achievement of SDG 8 in the EU depends less on aggregate economic growth alone and more on the quality of labour market integration, especially for young people, and on sustained investment in human capital.
6.2. Contributions
This study contributes to the existing literature in several ways. First, it provides an integrated empirical assessment of employment determinants explicitly framed within the SDG agenda, linking labour market outcomes to SDG-relevant indicators. Second, by combining indicators of labour market dysfunction, education, innovation and economic development in a single panel model, the analysis offers a comprehensive perspective on the structural drivers of employment in the EU. Third, the results add empirical nuance to the debate on growth and employment by showing that higher GDP per capita does not necessarily guarantee better employment outcomes, thereby reinforcing the importance of inclusive and sustainable growth strategies.
From a policy perspective, the findings support the need for targeted interventions aimed at reducing youth disengagement, preventing long-term unemployment and strengthening education systems, rather than relying exclusively on macroeconomic growth or innovation expenditure to improve employment performance.
6.3. Future Research
Despite its contributions, this study has several limitations that open avenues for future research. Further analyses could extend the econometric framework by employing dynamic panel models or non-linear approaches to better capture causal relationships and lagged effects. Future studies could also explore the indirect channels through which R&D and innovation influence employment by incorporating interaction terms or mediating variables related to skills demand and sectoral change.
Moreover, extending the analysis to a regional level would allow for a more detailed assessment of territorial disparities within EU Member States. Finally, future research could explicitly address the impact of digital, green and demographic transitions on employment dynamics, contributing to a deeper understanding of how SDG 8 can be achieved in an evolving European labour market.




 ,
,