Article

Analysis and Optimization of Laser Beam Welding Parameters for Aluminium Composite (Al-Zn-Cu Alloy) by Grey Relational Optimization

by
Nitish Kumar Singh
1,
Balaguru Sethuraman
2,* and
Manoj Gupta
3,*
1
Department of Mechanical Engineering, Lingaya’s Vidyapeeth, Faridabad 121002, India
2
School of Mechanical Engineering, VIT Bhopal University, Sehore 466114, India
3
Department of Mechanical Engineering, National University of Singapore, Singapore 117597, Singapore
*
Authors to whom correspondence should be addressed.
Micro 2024, 4(4), 641-658; https://doi.org/10.3390/micro4040039
Submission received: 19 August 2024 / Revised: 15 October 2024 / Accepted: 28 October 2024 / Published: 31 October 2024

Abstract

:
Aluminium and its composites are widely used in production to enhance the strength of lightweight objects. In this study, an AA7075/SiC composite was fabricated using a stir casting route. Multi-objective optimization and finite element analysis were performed with various process parameters on a manufactured aluminium composite (AA7075 + SiC) undergoing a laser beam welding process. Four welding parameters, i.e., pulse frequency, power, welding speed (transverse), and wire size were taken for laser welding as per the L-9 orthogonal array for experimental study. Tensile strength, deflection, temperature distribution, Rockwell hardness (fusion zone), and Rockwell hardness (heat affected zone) were taken as output parameters after welding. The standard deviation objective weighting–grey relational optimization method optimized the process parameter. ANSYS APDL 23 software was utilized to simulate the entire laser welding method with a cylindrical heat source to predict the temperature distribution in the butt-welded plates. This software uses finite element analysis and gives a deviation of only 5.85% for temperature distribution with experimental results. This study helps to understand the effect of various parameters on the welding strength of the aluminium composite.

1. Introduction

Aluminium composite sheets are widely used in the aerospace and automotive industries due to their lightweight strength, excellent resistance to corrosion, high fatigue durability, resistance to creep, and superior formability compared to traditional aluminium [1]. Aluminium composites help to reduce the weight of automobile vehicles and aeroplanes without affecting their performance, and they also improve fuel efficiency due to their low weight and high stiffness [2]. AA 7XXX series aluminium alloys can also be used for considerable mass reduction in producing super lightweight cars [3,4,5]. Aluminium alloys are joined using conventional TIG welding, but it is impossible to remove welding defects like cracks, hot tears, and porosity [6]. Laser welding is a non-contact fusion welding method in which a laser beam is directed into the cavity between two metal pieces to be welded, producing heat that melts the material from the metal piece and fills the cavity as it strikes the metal pieces [7]. The types of laser welding machines used depend on the method of laser production. Commonly used lasers are helium–neon and Nd:YAG lasers [8]. Laser welding produces a small heat-affected zone and reduces welding defects compared to conventional welding. The laser welding of thin sheets (less than 3 mm) of aluminium alloy and the yield of high-strength welded joints through the laser welding process have been validated by researchers [9]. Laser pulse welding has a minimal heat-affected zone and is less prone to thermal distortion, which reduces welding defects [10]. The weakest sections of aluminium composite material weldments are the weld bead and the heat-affected zone because welding deformation readily creates cracks due to the generation of intergranular fractures under residual tensile stress and stress concentration [11]. Accordingly, the parametric study of laser welding is essential for improving the properties of the weld. Finite element analysis (FEA) can be used for thermal analysis (temperature distribution) and for the prediction of residual stress during the welding process [12]. The temperature distribution and weld bead profile can be predicted using ANSYS [13,14], ABAQUS [15], SYSWELD [16], and simufact welding [17]. Among finite element techniques, ANSYS APDL is one of the most efficient tools. In the past, experienced technicians determined welding parameters through trial and error, a process that was both time-consuming and costly, to ensure that each new welded product met the required joint specifications. To mitigate these challenges, various researchers have employed single-quality characteristic analyses. However, the single-objective approach only simplifies the complexity of the real problem. The Nd:YAG laser welding process includes various parameters, such as pulse frequency, power, welding speed (transverse), and wire size. Each of these factors can affect the quality and properties of the weld.
Determining the optimal design of Nd:YAG laser welding process parameters is challenging when using single-objective optimization methods like ANOVA, response surface optimization [18], and the Taguchi method [19], as multiple quality characteristics are required to assess overall quality. Therefore, to enhance welding quality under optimal process conditions, it is essential to explore a multi-objective optimization approach. In these situations, links between quality attributes in the process may be subsequently established using grey relational analysis (GRA) [20,21]. The optimization of laser welding process parameters has been widely studied. However, to the best of our knowledge, no systematic research has combined the GRA-based Taguchi method with the standard deviation objective weighting technique for the multi-objective optimization of the Nd:YAG laser welding process. To address the multi-criteria optimization problem regarding Nd:YAG laser welding process parameters for the AA7075 + SiC composite, this study explored the application of the standard deviation objective weighting method, an objective weighting technique, in combination with the grey relational analysis (GRA)-based Taguchi method. A composite with improved mechanical qualities, including greater hardness, wear resistance, and perhaps longer fatigue life, is produced when SiC is added to the AA7075 matrix. Because of these enhancements, the composite is more suited for uses where traditional AA7075 would not be as effective, especially in the high-stress or high-wear settings seen in the automotive industry. During Nd:YAG laser welding, this method aids in improving mechanical properties such as tensile strength, deformation, and hardness (both in the weld zone and the heat-affected zone) with uniform quality. This study predicts the temperature distribution for the Nd:YAG laser welding process by simulating the AA7075 + SiC aluminium composite sheet butt joint using ANSYS APDL 19.0, with the results validated against experimental findings.

2. Experimental Methods

2.1. Materials

The 7075 series of aluminium alloys were selected as the matrix metal for this study due to their widespread use in various industrial sectors, including automotive, aerospace, marine, construction, and outdoor applications, as well as their suitability for aging heat treatment [22]. To make the material harder for use in high-strength structural applications, it can be aged (heat treated) [23]. Despite being lightweight structural materials with particular strength, AA7075 alloys have limited uses due to their poor weldability [24,25]. Ola et al. [24] examined the impact of laser welding process parameters on AA7075 alloys and came to the conclusion that adjusting the process parameters might improve AA7075’s weldability. The basic material for this project was an AA7075 + 3 weight percent SiC aluminium composite plate, which was created using the stir casting method. Aluminium AA7075 exhibits outstanding mechanical strength, corrosion resistance, fatigue strength, high creep resistance, and excellent formability [26,27]. The chemical composition of the matrix material was analysed using energy dispersive spectroscopy (EDS) on a scanning electron microscope (SEM), as shown in Table 1. Zinc’s interaction with magnesium produces strengthening precipitates, which contribute significantly to the strength of 7xxx series alloys. While zinc enhances mechanical qualities such as tensile strength and hardness, it can also cause corrosion resistance and weldability issues, particularly when employed at greater concentrations.

2.2. Material Synthesis

The AA7075 alloy ingot, a 1.5 kg bar obtained from Ripon Metal Pvt. Ltd. in Ahmedabad, India, was cleaned and then positioned in a top-loaded, bottom-pouring stir casting furnace (Figure 1) for melting at a temperature of 750 °C. Many authors have reported using the stir casting technique: This approach is simple to use and inexpensive for preparing composites [29,30]. Consequently, stir casting is currently being utilized in research to develop hybrid composites. To minimize temperature variations between the melt and the reinforcement particles, 25 μm SiC particles were preheated in a separate furnace at 450 °C during the addition process. After the AA7075 alloy was melted, the temperature was raised from 750 °C to 900 °C. The molten metal was stirred at 350–450 rpm with a graphite impeller to form a vortex. Preheated reinforcing particles were then added to the melt. At the same time, the melt was mechanically agitated at 750–780 rpm until the reinforcing mixture was completely blended. To achieve better dispersion, stirring continued for an additional five minutes after the reinforcement was introduced. After the melt was thoroughly mixed, it was poured into the graphite-coated cast iron die for reheating, as shown in Figure 2a. Following solidification, the cast melt was extracted from the die, as illustrated in Figure 2b.

2.3. Design of Experiment

This study focused on four process parameters for the laser welding process: pulse frequency, laser power, welding speed, and wire size. The levels of these parameters are detailed in Table 2, leading to a total of 81 possible combinations (3 × 3 × 3 × 3). However, by employing Taguchi’s L-9 orthogonal array, the number of combinations was reduced to nine, while still maintaining the same level of confidence as if all combinations had been tested individually [31]. The Taguchi orthogonal array was generated using the design of experiments (DOE) method in Minitab 19 software, as illustrated in Table 3.

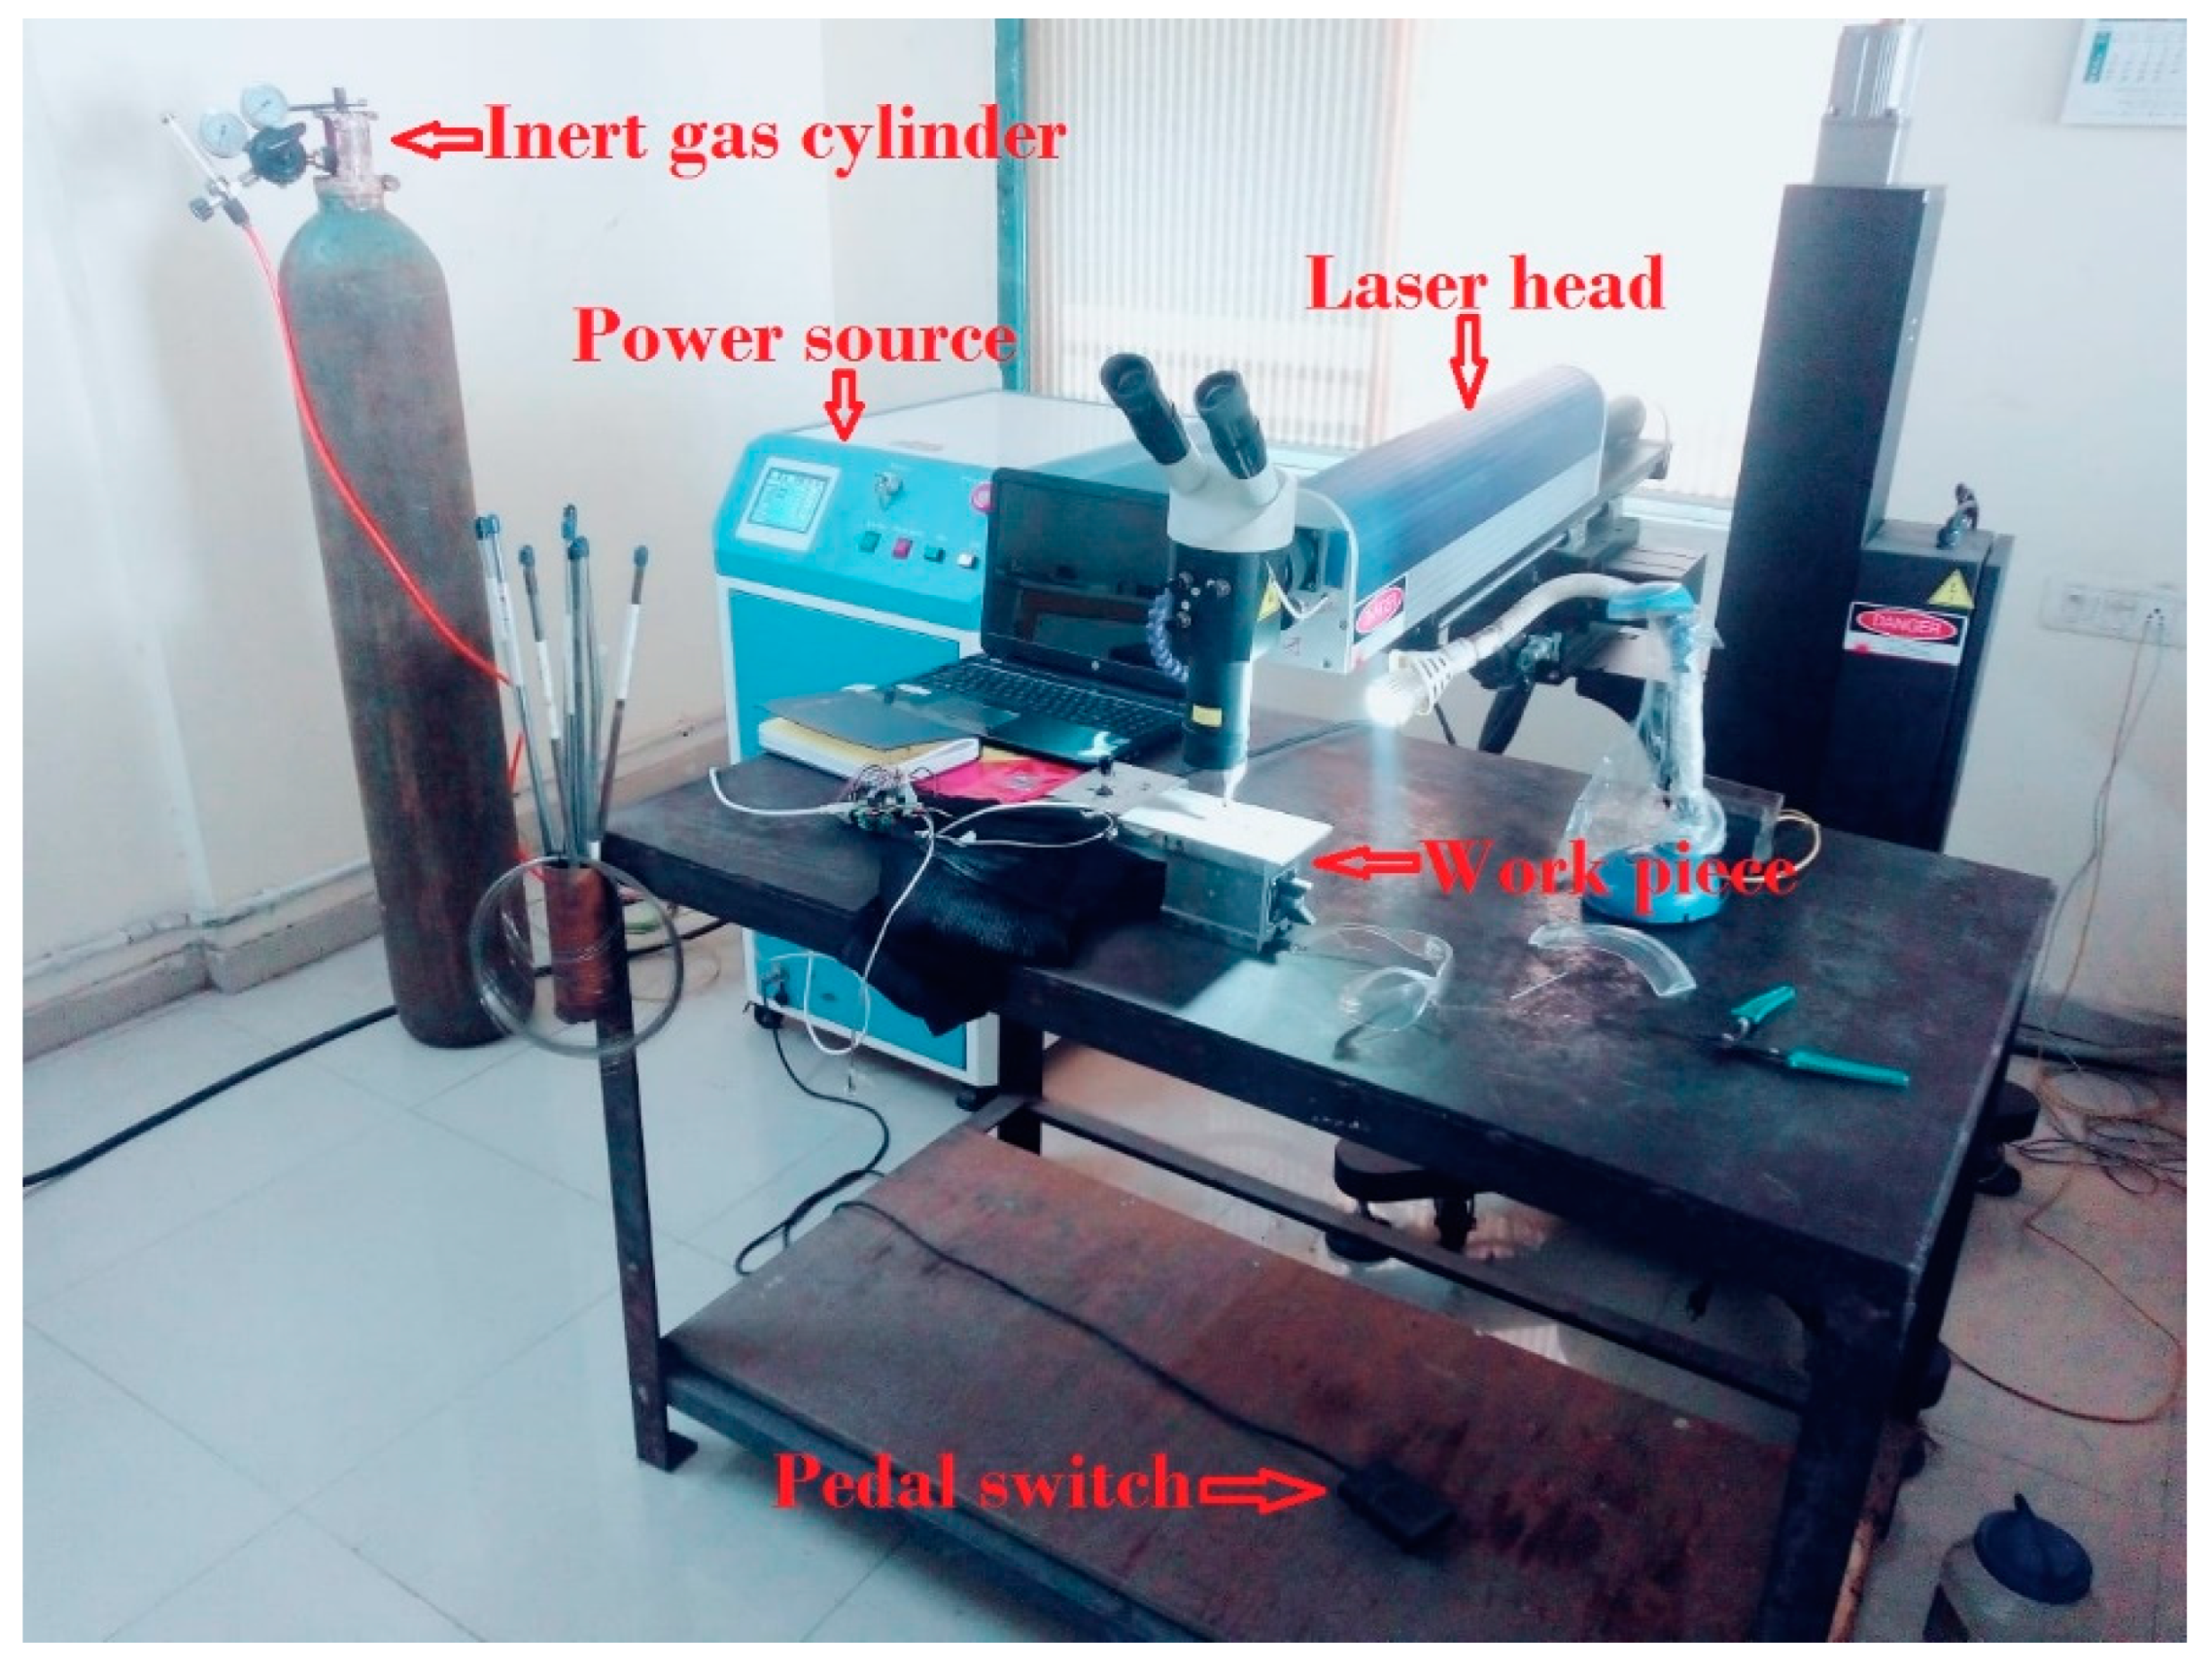
2.4. Experimental Details

The welding process was performed using a laser welding machine equipped with a 400 W pulsed Nd:YAG laser (Dhanlaxmi, average power 400 W, maximum power 6 kW, maximum wavelength 1064 nm, maximum frequency 500 Hz, with a pulse range of 0.3–20 ms), as depicted in Figure 3. This machine is available at Mascot Technocrats Ltd., Moraiya, Ahmedabad, Gujarat, India. A long rectangular aluminium AA7075 + SiC composite sheet was cut using wire EDM into 18 pieces per dimension, as provided in Table 4. For laser welding, a manual mode was set in the power source, and the welding constraints—laser power, frequency, and welding speed—were initially specified in the laser welding machine. In the welding process, ER4043 filler wire with different diameters was used according to the design of the experiment. The chemical compositions as per supplier knowledge of the filler material are presented in Table 5. After setting the welding parameters based on the L-9 Taguchi orthogonal array experimental design, the distance between the workpiece and lens was set at 90 mm on the welding machine. Prior to welding, we polished the two sheet pieces using silicon carbide sandpaper (P600) and subsequently cleaned the sample surface with acetone to remove any oxide film [32]. Argon, a shielding gas, was employed during the laser welding process. This gas envelops the welding area, displacing environmental oxygen, which in turn minimizes the likelihood of oxide formation during welding. The shielding gas creates a protective environment, which successfully prevents the formation of new oxides when the material undergoes heating [33]. Welding was initiated using the pedal switch. Temperature measurements during the laser welding process were conducted using an infrared (IR) thermometer. We carefully selected three crucial time nodes at which temperature readings were taken. These time nodes were designated as T1 = 0.3 s, T2 = 4 s, and T3 = 14 s, corresponding to specific points during the welding process at which an average temperature was taken. As seen in Figure 4, the welded sample, which had dimensions of 150 mm in length, 12 mm in gauge width, 50 mm in gauge length, and 12 mm in fillet radius, was machined using a wire EDM machine in accordance with the ASTM E8M standard for tensile testing [34]. A tensile test was performed at room temperature with a strain rate of 0.01/S using the UTE/C-400 universal testing equipment. Using a Rockwell hardness machine (FIE manufacture model IRB-250), Rockwell hardness tests were performed on all the welded samples. The welded sample’s surface was indented at the heat-affected zone and fusion zone using an indenter fitted with a 1/16 diamond ball and a 100 kgf force for the hardness test. Rockwell hardness values were taken at three locations, and average values were reported to ensure accuracy in both regions.

3. Standard Deviation Objective Weighting Method

Each criterion’s weight ( w j ) was assessed using the standard deviation objective weighting approach [35,36]. The performance-defining criteria (PDC) were determined for each response based on its weight. The first step is to build an initial decision matrix that includes nine experiments and five process parameters. Equation (1) is then used to normalize the decision matrix following the computation of the best and worst values for each process parameter:
X i j + = X i j X j w o r s t X j b e s t X j w o r s t
where X i j + denotes the ith design’s normalized value on the jth answer using the standard deviation coefficient and correlation (Minitab 19 software). The evaluation of information production was then performed using correlation and standard deviation coefficients. Equation (2) was then used to determine the weight ( ξ j ) of each criterion. The performance-defining criteria (PDC) for each response were determined based on the weight of the responses, as indicated in Table 6:
ξ j = c j k = 1 m c j
where, ξ j ≥ 0 and k = 1 m c j = 1 .

4. Hybrid Gray Relational Methodology

S/N ratio
There are three different SN (signal to noise) ratios based on characteristics: nominally better, higher better, and lower better. For tensile strength, deflection, temperature distribution, and Rockwell hardness (fusion zone) and Rockwell hardness (heat-affected zone), the greater the better in this study. The following list contains the phrases that reflect these approaches:
SN   ratio   for   larger   is   better :   S N L = 10 l o g ( 1 n i = 1 n 1 y i 2 )
SN s   ratio   for   smaller   is   better :   S N s = 10 l o g i = 1 n y i 2
SNn ratio for “nominal is better”:
S N n = 10 l o g 10 ( S q u a r e o f m e a n / v a r i a n c e )
Normalization of S/N ratio
For the “larger is better” characteristics of tensile strength, deflection, temperature distribution, Rockwell hardness (fusion zone), and Rockwell hardness (heat affected zone):
y i * ( m ) = y i m min y i m max y i m min y i m
For “smaller is better”:
y i * ( m ) max y i m y i m max y i m min y i m
For “nominal is better”:
y i * ( m ) = 1 / y i m y 0 b ( m ) / max y i m y 0 b ( m )
The data preparation and comparability arrangements are denoted by y∗(m) and yi(m). Tensile strength, deflection, temperature distribution, Rockwell hardness (fusion zone), and Rockwell hardness (heat-affected zone) are measured using m = 1, m = 2, m = 3, m = 4, and m = 5. For experiments 1 through 9, i = 1, 2, 3, 9.
Deviation sequence
One way to depict the deviation sequence is as [37]:
Δ 0 i k = y 0 * m y k * m  
Grey relational coefficient (GRC)
The relationship between the ideal and the actual normalized experimental value is represented by the grey relational coefficient (GRC) [38]:
G R C = ξ i k = Δ min + ξ Δ max Δ 0 i k + ξ Δ max
Grey relational grade
The average of the GRCs for each performance attribute is used to calculate it. Grey relational grades are used to calculate several performance metrics overall [39]:
γ i = 1 n k = 1 n ξ i k

5. Optimization Using GRA Method

According to the L-9 orthogonal array, the investigations were carried out at ambient temperature [39]. Utilizing the load–displacement data displayed in Figure 5, tensile strength was computed. The deflection, temperature distribution, and Rockwell hardness for both the fusion zone and heat-affected zone across all nine experimental sets are illustrated in Figure 5, Figure 6, Figure 7 and Figure 8 and summarized in Table 7. It is noteworthy that all the tested specimens exhibited failure at the heat-affected zone, as depicted in Figure 9. This outcome is a typical occurrence for aluminium alloys since the welding process tends to diminish the mechanical properties of the metal by vaporizing alloying elements. The strongest weld was achieved in sample 4, with a tensile strength of 60.42 MPa. This result was obtained with a pulse frequency of 172 Hz, a laser power of 3.04 kW, a welding speed of 5 m/min, and a wire size of 2 mm. The weakest weld was seen in sample 3, which had a tensile strength of 48.63 MPa. The following welding settings were used: pulse frequency of 170 Hz, laser power of 3.42 kW, speed of 6 m/min, and wire size of 2 mm. The weld with the highest strength exhibited an 18.1% reduction in the mechanical properties of the base alloy AA7075. This outcome is favourable considering that aluminium alloys often experience losses ranging from 20% to 40% during welding [40]. The highest average temperature was achieved in sample 7, with a temperature of 321.16 °C. With a wire size of 1.5 mm, a laser power of 3.04 kW, a welding speed of 6 m/min, and a pulse frequency of 174 Hz, this outcome was achieved. Conversely, sample 3 had the lowest temperature, measuring 305.08 °C, when the following welding parameters were used: 2 mm wire size, 3.42 kW laser power, 170 Hz pulse frequency, and 6 m/min welding speed. The peak temperature developed during welding does not depend on the heat input, but the other parameters also do not follow any of the particular trends that have been reported by earlier researchers [11,24]. When the peak temperature is higher, the participant metals melt in excess, resulting in the creation of undesired compounds at the interface, which accounts for sample 7’s high hardness.
Table 8 shows the S/N ratio, which was computed using Equation (3) for tensile strength, deflection, temperature, Rockwell hardness (fusion zone), and Rockwell hardness (heat-affected zone) (larger is better).
Table 9 shows the normalized S/N ratios obtained from Equation (6) for tensile strength, deflection, temperature, Rockwell hardness (fusion zone), and Rockwell hardness (heat-affected zone).
Table 10 shows the deviation sequence estimated using Equation (9) for all experimental trials.
The grey relational coefficient (GRC) was computed using Equation (10). The weight of each response ( ξ ) is collected from Table 6 and assessed using the standard deviation objective weighting approach, as indicated in Table 11.
The grey relational grade (GRG) and ranking were obtained with Equation (11) and are displayed in Table 12.
The mean grey relational coefficient (GRC) for pulse frequency at levels 1, 2, and 3 was determined by averaging the GRC values for experiments 1–3, 4–6, and 7–9, respectively. The GRA grade responses are displayed in Table 13. The significance of each factor for the grey relational grade is determined by the ranking of the process parameters, with pulse frequency being the most important, followed by laser power, wire size, and welding speed. That is to say, pulse frequency is the most dominant parameter in the whole process of laser welding performance. Figure 10 shows the main effects plot of GRG from Minitab 19: Optimal process parameters are A3B1C2D3, and pulse frequency is 174 Hz, laser power is 3.04 kW, welding speed is 5 m/min, and wire size is 2.0 mm.

6. Numerical Study

ANSYS APDL 19.0 was used for the numerical analysis on two chosen plates with a butt-welding joint arrangement. The governing equation for each element in the finite element formulation is as follows [41]:
C T T + K T T = Q T
This study requires the integration of the heat conduction equation over time. The system of equations is solved using the Crank–Nicholson/Euler theta integration technique [42]. This element type can handle three-dimensional thermal conduction. The heat input from the laser power is represented by heat flux, which is evaluated per unit surface area qqq as a function of the temperature gradient [43]
q = k δ T
where k is the thermal conductivity and ∇T indicates the temperature gradient.
The heat equation used for convection is represented below:
q = h c A d T
where q represents the heat transfer per unit time, h c is the convective heat transfer coefficient, A is the heat transfer area of the surface, and dT is the temperature difference between the surface and the bulk field. A thermal analysis along with a Gaussian heat distribution model was employed to determine the temperature distribution for the laser welding model [41].
q r = 2 P π σ 2 e 2 r 2 σ 2
where P = laser power, σ = radial distance (0.0045m), r = beam radius (0.004 m).
To obtain the global temperature, a non-linear transient thermal analysis was performed. The dimensions of the plate were the same as the experimental dimension shown in Figure 11; the elements taken were tetrahedrons. During meshing, element size two, shown in Figure 12, had element number 41075. The material properties of AA7075 + SiC are Young’s modulus of elasticity 77.7 GPa, Poisson’s ratio 0.35, thermal conductivity of 130 W/mk, and density of 2810 kg/m3. Numerical simulations are done for nine cases of different heat fluxes calculated using Equation (15) with a cylindrical heat source. The simulated temperature (K) distribution for experiment 1 is shown in Figure 13.
The validation of the simulated temperature distribution against experimental results is shown in Figure 13. Figure 14 reveals that the maximum error is 9.59 percent (sample 5), occurring in just one instance. However, the average error is 5.85 percent, which falls within the acceptable range of 4% to 12% [7]. This suggests that the simulated environment developed for laser welding can be utilized to assess the temperature distribution for other materials.

7. Conclusions

The AA7075/SiC composite was successfully fabricated using a top-loaded, bottom-pouring stir casting furnace. Nd:YAG laser welding was effectively conducted based on an orthogonal array design of experiments on the fabricated composites. The following are the key findings from the current study:
  • This study successfully employed the standard deviation objective weighting method along with the grey relational optimization method to enhance multiple responses, including tensile strength, deflection, temperature distribution, Rockwell hardness in the fusion zone, and Rockwell hardness in the heat-affected area. The optimal combination of parameters identified was A3B1C2D3.
  • A pulse frequency of 174 Hz, laser power of 3.04 kW, welding (transverse) speed of 5 m/min, and wire size of 2 mm are the ideal process parameters found for the laser welding procedure.
  • The pulse frequency plays a significant role in laser welding, followed by wire size, laser power, and welding (transverse) speed.
  • The weight fractions for tensile strength, deflection, temperature distribution, hardness (fusion zone), and hardness (HAZ) were effectively determined using the standard deviation objective weighting technique; they were 0.1930, 0.1594, 0.0.1570, 0.2670, and 0.2235, respectively.
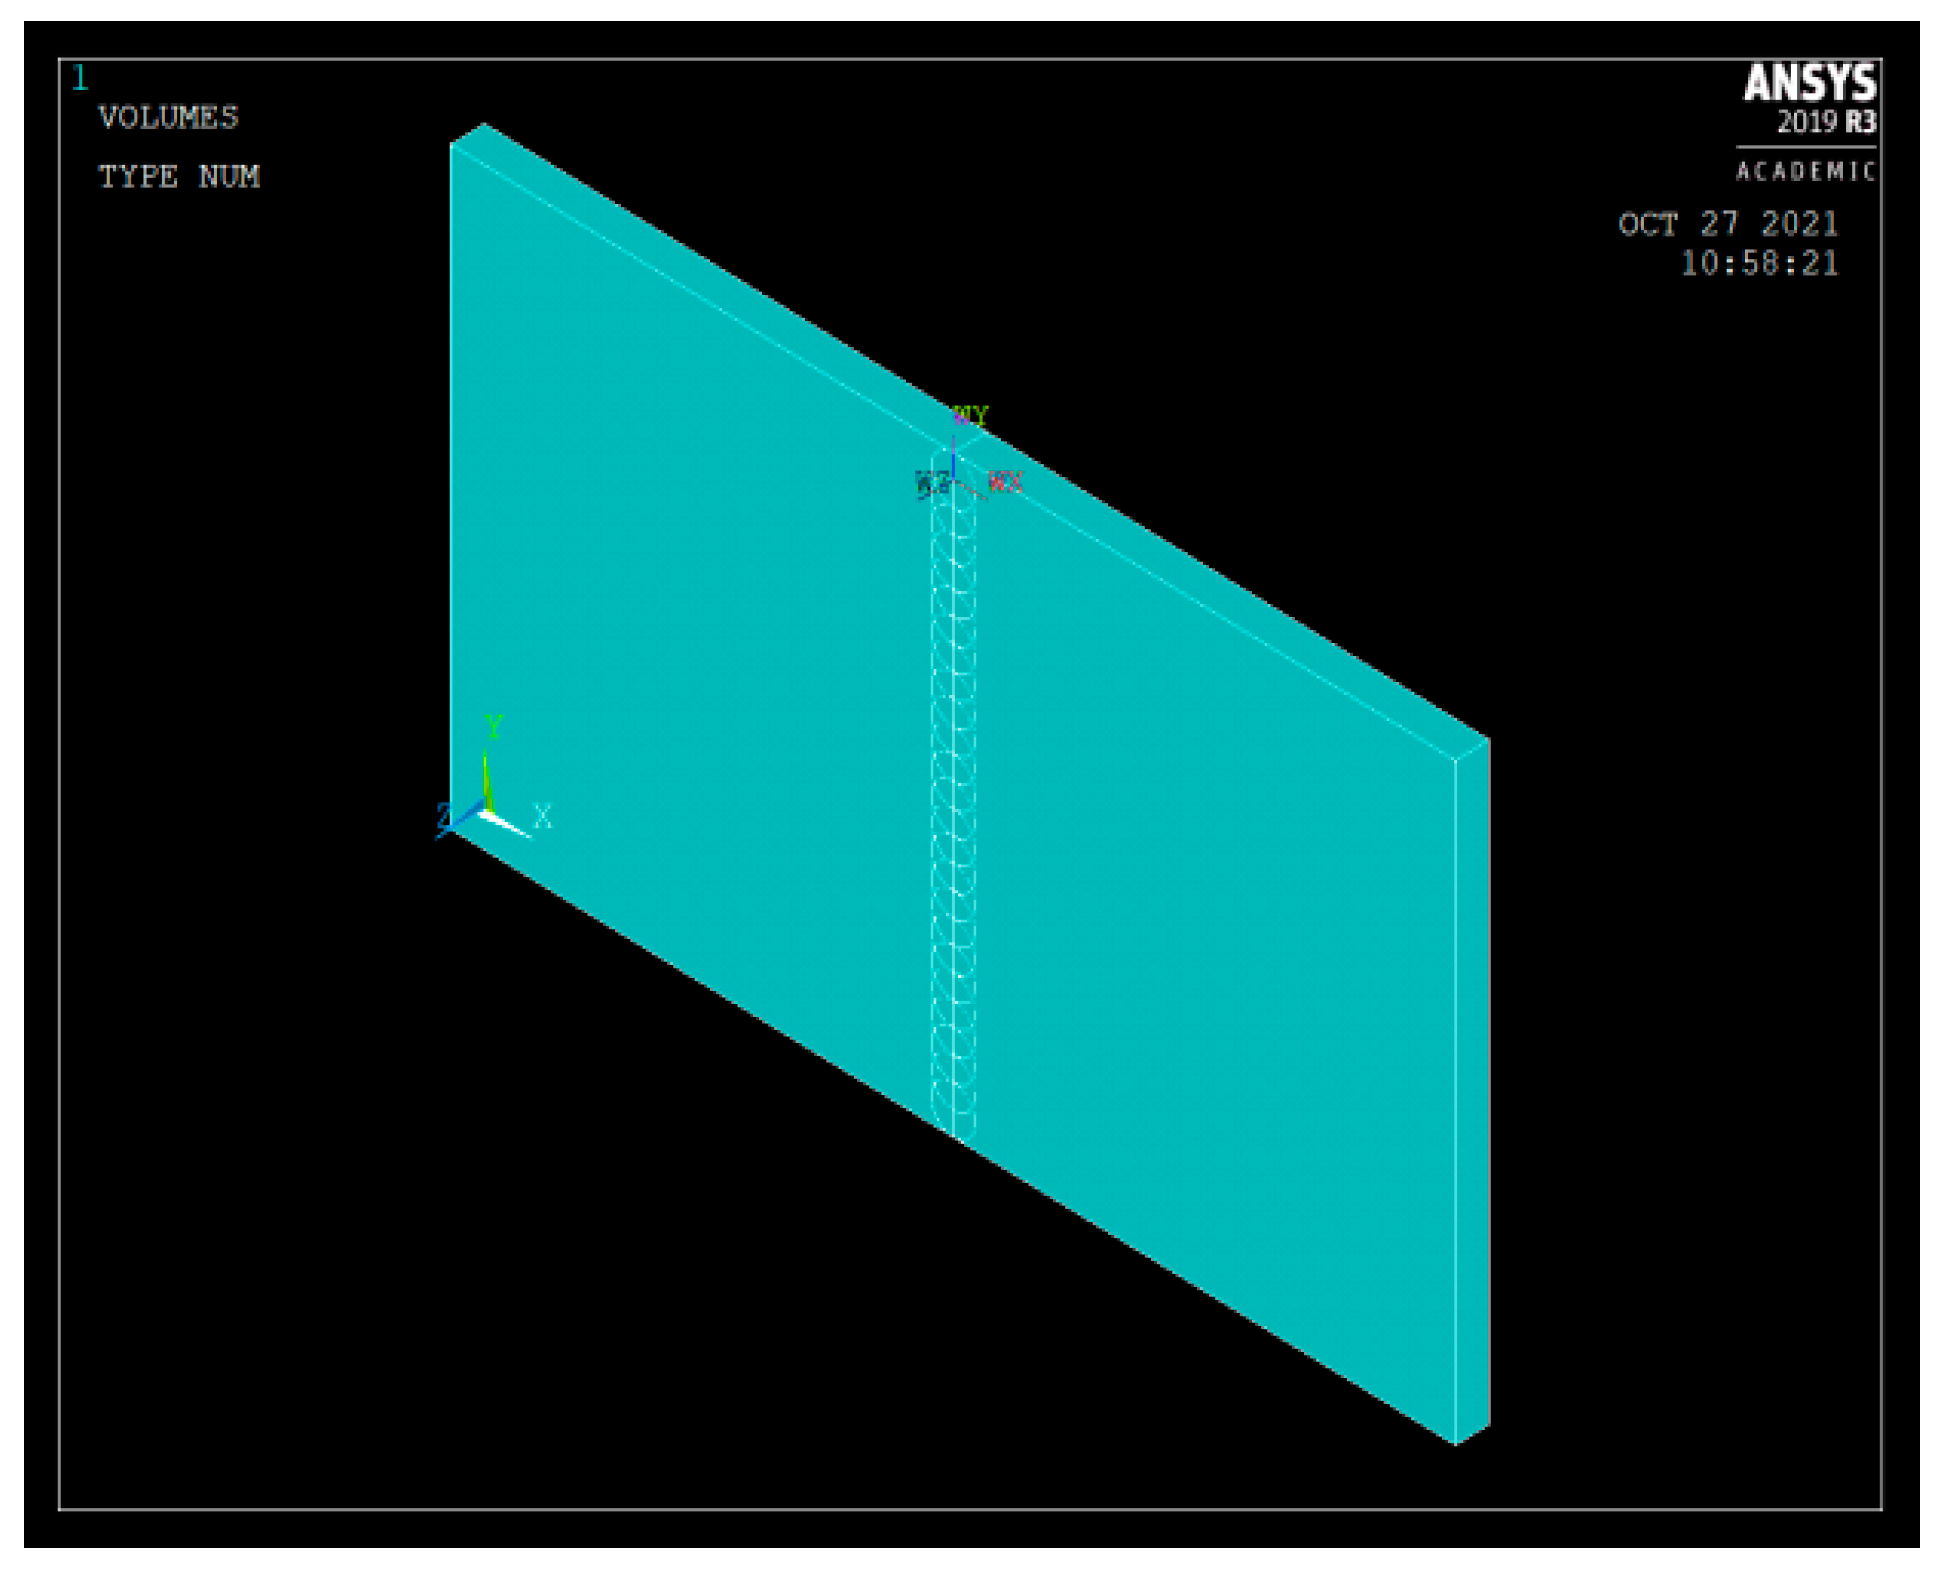
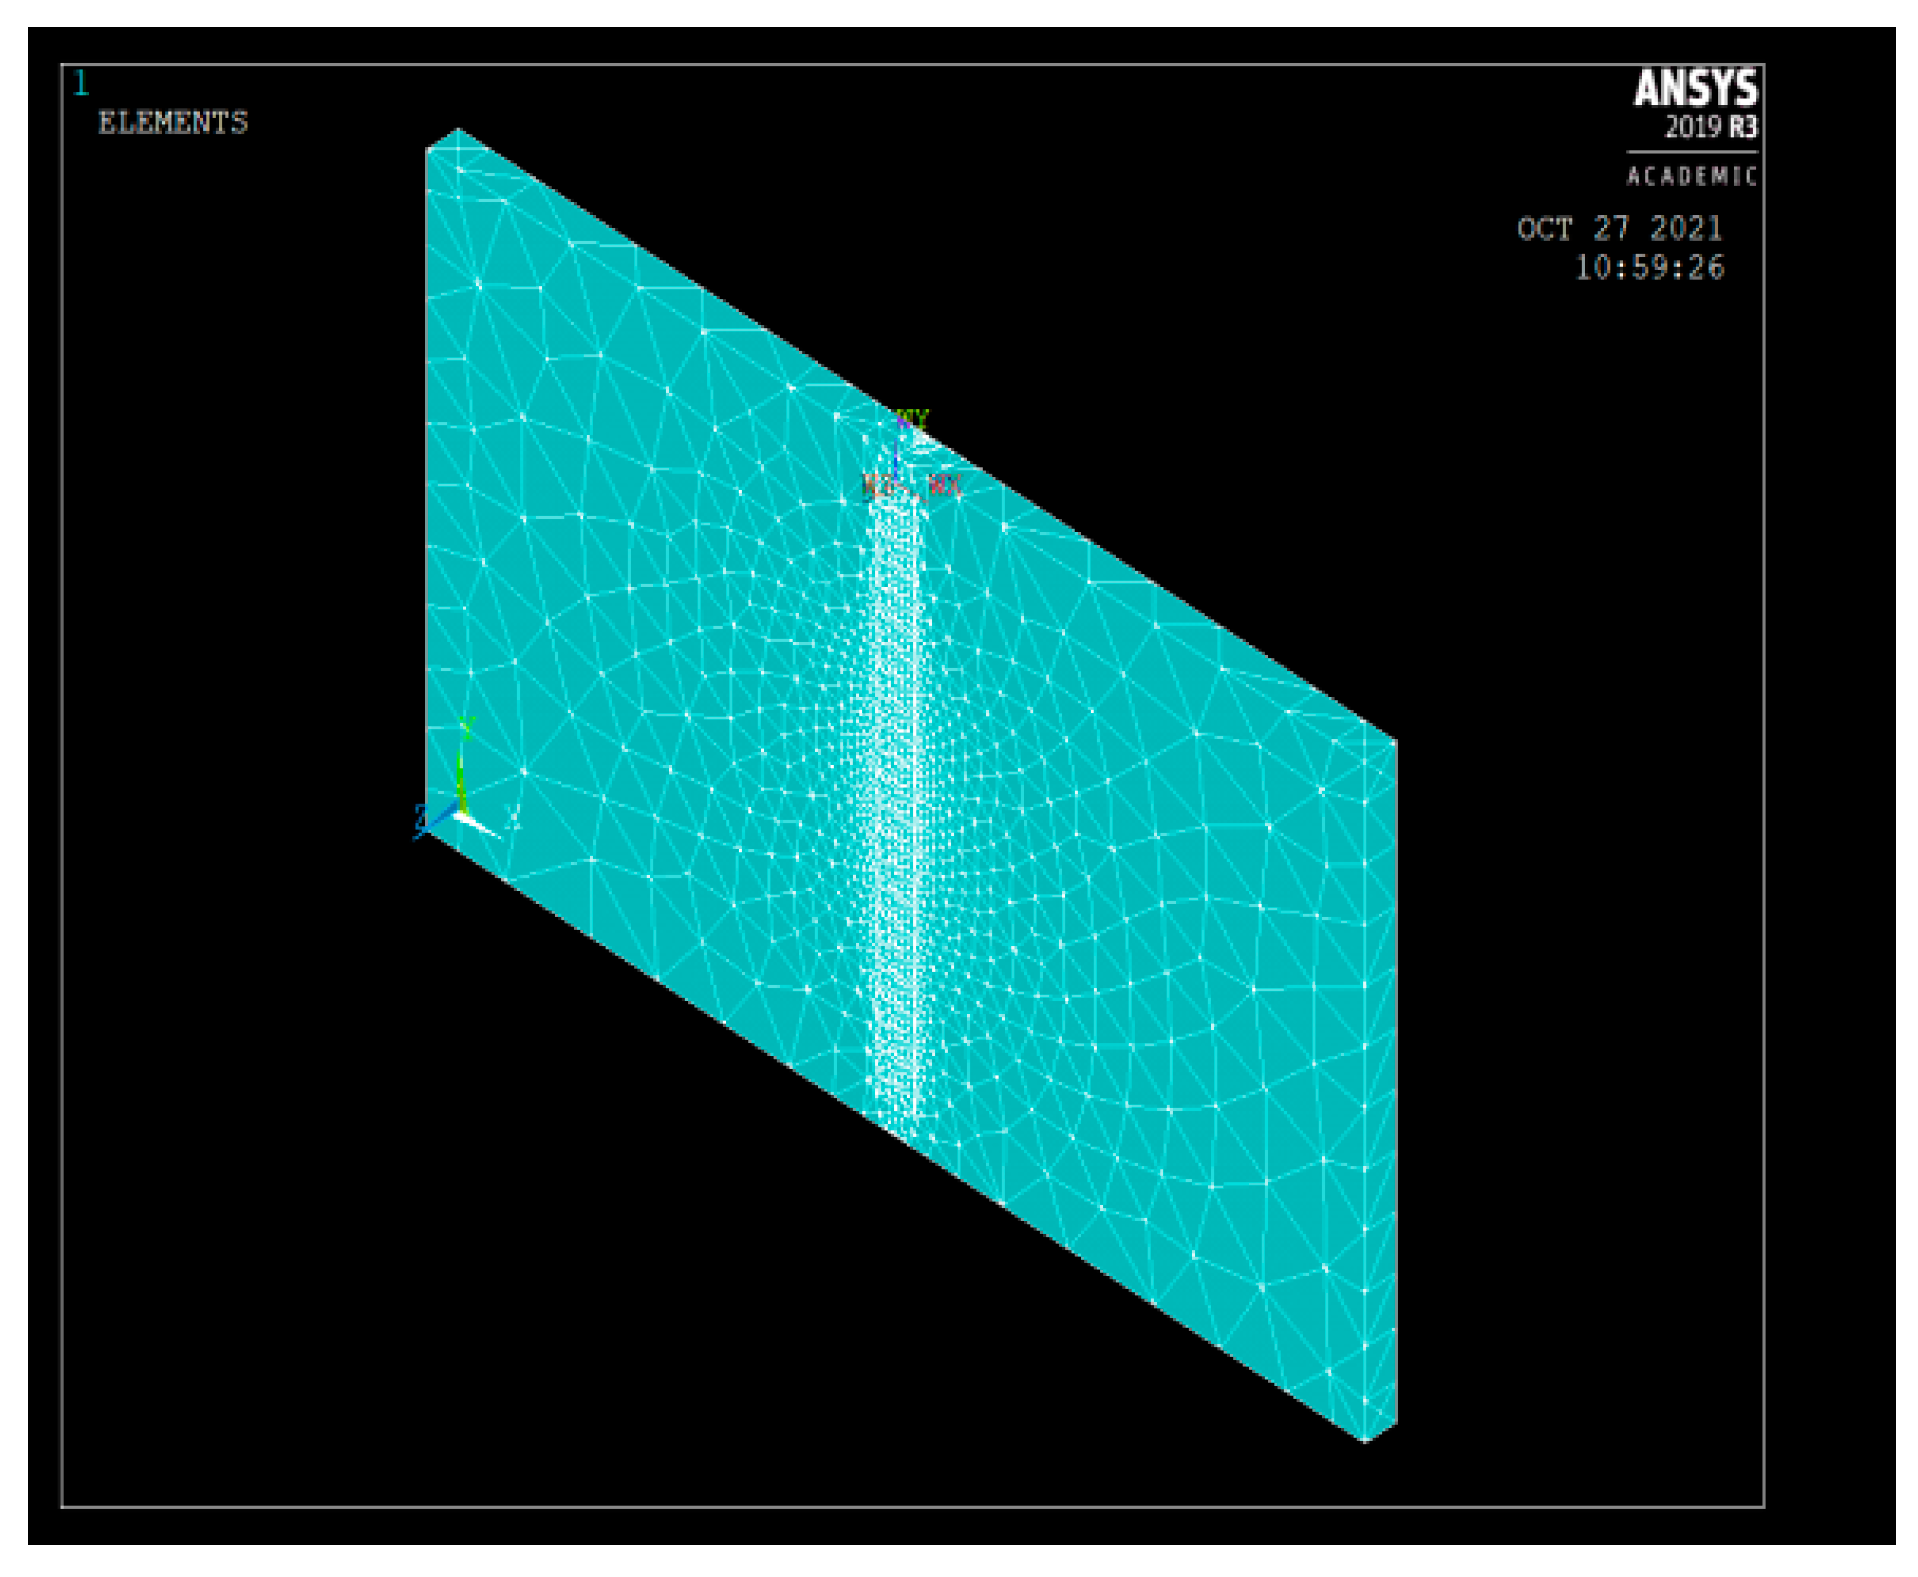
  • As the experimental measurements are costly, FEA was employed for attaining approximate outcomes. ANSYS APDL 19.0 was used for numerical analysis on two chosen plates with a butt-welding joint arrangement to predict the temperature distribution. The numerical results were compared with the experimental results, and it was noted that the average error was only 5.85%.

Author Contributions

N.K.S.: Fabrication, testing, Investigation, Resources, and Writing—original draft. B.S.: Conceptualization, Supervision, Writing—review & editing. M.G.: Supervision, Writing—review & editing. All authors have read and agreed to the published version of the manuscript.

Funding

This work was supported by VIT Bhopal University through the Support for Excellence in Academic Research (SPEAR) grant number SMG-01.

Data Availability Statement

All data sources are described in this study are directed at the author.

Acknowledgments

The authors sincerely acknowledge that this work is part of research funded by VIT Bhopal University under the Support for Excellence in Academic Research (SPEAR) grant number SMG-01.

Conflicts of Interest

The authors declare no conflicts of interest.

References

  1. Sreedhar, N.; Balaguru, S. Mechanical and tribological behaviour of al 7075 hybrid mnc’s using stir casting method. Int. J. Mech. Prod. Eng. Res. Dev. 2020, 10, 391–400. [Google Scholar] [CrossRef]
  2. Rathore, R.K.; Singh, N.K.; Xavier, J.F. Characterization of AA7075 Alloy Foam Using Calcium and Magnesium Carbonate as Foaming Agent. In Processing and Characterization of Materials: Select Proceedings of CPCM; Springer: Berlin/Heidelberg, Germany, 2021; pp. 289–297. [Google Scholar] [CrossRef]
  3. Tisza, M.; Czinege, I. Comparative study of the application of steels and aluminium in lightweight production of automotive parts. Int. J. Light. Mater. Manuf. 2018, 1, 229–238. [Google Scholar] [CrossRef]
  4. Singh, N.K.; Sethuraman, B. Development and characterization of Aluminium AA7075 hybrid composite foams (AHCFs) using SiC and TiB2 Reinforcement. Int. J. Met. 2023, 18, 212–227. [Google Scholar] [CrossRef]
  5. Singh, N.K.; Balaguru, S. Experimental Analysis of Foaming Agent Contents in AA7075/SiC Closed Cell Aluminum Composite Foam. In Recent Advances in Mechanical Engineering; Springer: Singapore, 2023; pp. 567–575. [Google Scholar]
  6. Dhanaraj, P.; Rathinasuriyan, C. Optimization of fiber laser welding parameters for high strength aluminium alloy AA7075-T6. Mater. Today Proc. 2021, 52, 283–289. [Google Scholar] [CrossRef]
  7. Chandelkar, V.; Pradhan, S.K. Numerical simulation of temperature distribution and experimentation in laser beam welding of SS317L alloy. Mater. Today Proc. 2019, 27, 2758–2762. [Google Scholar] [CrossRef]
  8. Paleocrassas, A.G.; Tu, J.F. Low-speed laser welding of aluminum alloy 7075-T6 using a 300-W, single-mode, ytterbium fiber laser. Weld. J. 2007, 86, 179–186. [Google Scholar]
  9. Dhanaraj, P.; Rathinasuriyan, C. Selection of intense energy welding process for high strength aluminum alloy using AHP. Mater. Today Proc. 2021, 46, 8254–8259. [Google Scholar] [CrossRef]
  10. Guo, J.; Gougeon, P.; Chen, X.-G. Study on laser welding of AA1100-16 vol.% B4C metal–matrix composites. Compos. Part B Eng. 2012, 43, 2400–2408. [Google Scholar] [CrossRef]
  11. Su, C.; Zhou, J.; Ye, Y.; Huang, S.; Meng, X. Study on Fiber Laser Welding of AA6061-T6 Samples through Numerical Simulation and Experiments. Procedia Eng. 2017, 174, 732–739. [Google Scholar] [CrossRef]
  12. D’ostuni, S.; Leo, P.; Casalino, G. FEM simulation of dissimilar aluminum titanium fiber laser welding using 2D and 3D Gaussian heat sources. Metals 2017, 7, 307. [Google Scholar] [CrossRef]
  13. Prasad, V.V.; Varghese, V.J.; Suresh, M.; Kumar, D.S. 3D Simulation of Residual Stress Developed During TIG Welding of Stainless Steel Pipes. Procedia Technol. 2016, 24, 364–371. [Google Scholar] [CrossRef]
  14. Casalino, G.; Mortello, M.; Contuzzi, N.; Minutolo, F. Finite element model for laser welding of titanium. Procedia CIRP 2015, 33, 434–439. [Google Scholar] [CrossRef]
  15. Guimarães, P.B.; Pedrosa, P.M.A.; Yadava, Y.P.; Barbosa, J.M.A.; Filho, A.V.S.; Ferreira, R.A.S. Determination of Residual Stresses Numerically Obtained in ASTM AH36 Steel Welded by TIG Process. Mater. Sci. Appl. 2013, 4, 268–274. [Google Scholar] [CrossRef]
  16. Saravanan, S.; Raghukandan, K.; Kumar, G.S. Comparison of numerical and experimental macrostructure in Nd: YAG laser welding of Hastelloy C-276. Optik 2018, 180, 562–568. [Google Scholar] [CrossRef]
  17. Islam, M.; Buijk, A.; Rais-Rohani, M.; Motoyama, K. Simulation-based numerical optimization of arc welding process for reduced distortion in welded structures. Finite Elements Anal. Des. 2014, 84, 54–64. [Google Scholar] [CrossRef]
  18. Koli, Y.; Yuvaraj, N.; Aravindan, S. Vipin Multi-response mathematical model for optimization of process parameters in CMT welding of dissimilar thickness AA6061-T6 and AA6082-T6 alloys using RSM-GRA coupled with PCA. Adv. Ind. Manuf. Eng. 2021, 2, 100050. [Google Scholar] [CrossRef]
  19. Pan, L.K.; Wang, C.C.; Hsiao, Y.C.; Ho, K.C. Optimization of Nd:YAG laser welding onto magnesium alloy via Taguchi analysis. Opt. Laser Technol. 2005, 37, 33–42. [Google Scholar] [CrossRef]
  20. Gosavi, S.V.; Jaybhaye, D.M. Friction stir welding process optimization of Al 7075/SiC composites using grey relational analysis. Mater. Today Proc. 2023, 72, 719–723. [Google Scholar] [CrossRef]
  21. Prabakaran, M.; Kannan, G. Optimization of laser welding process parameters in dissimilar joint of stainless steel AISI316/AISI1018 low carbon steel to attain the maximum level of mechanical properties through PWHT. Opt. Laser Technol. 2018, 112, 314–322. [Google Scholar] [CrossRef]
  22. Acharya, S.A.S.; Suresh, P. Fabrication and micro structural characterization of Al 7075 reinforced with various proportions of SiC. Mater. Today Proc. 2022, 49, 638–643. [Google Scholar] [CrossRef]
  23. Sunar, T.; Tuncay, T.; Özyürek, D.; Gürü, M. Investigation of Mechanical Properties of AA7075 Alloys Aged by Various Heat Treatments. Phys. Met. Met. 2020, 121, 1440–1446. [Google Scholar] [CrossRef]
  24. Ola, O.; Doern, F. Fusion weldability studies in aerospace AA7075-T651 using high-power continuous wave laser beam techniques. Mater. Des. 2015, 77, 50–58. [Google Scholar] [CrossRef]
  25. Singh, U.K.; Dubey, A.K. Study on the weldability and mechanical performance of dissimilar AA7075-AZ31 alloys in friction stir welding. Mater. Today Proc. 2021, 47, 2720–2725. [Google Scholar] [CrossRef]
  26. Sahu, M.K.; Sahu, R.K. Experimental Investigation, Modeling, and Optimization of Wear Parameters of B4C and Fly-Ash Reinforced Aluminum Hybrid Composite. Front. Phys. 2020, 8, 219. [Google Scholar] [CrossRef]
  27. Balaji, V.; Sateesh, N.; Hussain, M.M. Manufacture of Aluminium Metal Matrix Composite (Al7075-SiC) by Stir Casting Technique. Mater. Today Proc. 2015, 2, 3403–3408. [Google Scholar] [CrossRef]
  28. Singh, N.K.; Balaguru, S. Fabrication and Mechanical Characterization of Al-Zn-Cu Alloy /SiC/TiB2 Hybrid Reinforced Metal Matrix Composite using Top Loaded Bottom Pouring Stir Casting Method. Silicon 2023, 16, 45–59. [Google Scholar] [CrossRef]
  29. Imran, M.; Khan, A.A. Characterization of Al-7075 metal matrix composites: A review. J. Mater. Res. Technol. 2019, 8, 3347–3356. [Google Scholar] [CrossRef]
  30. Sahu, M.K.; Sahu, R.K. Synthesis, microstructure and hardness of Al 7075/B4C/Fly-ash composite using stir casting method. Mater. Today Proc. 2019, 27, 2401–2406. [Google Scholar] [CrossRef]
  31. Sathish, T.; Sevvel, P.; Sudharsan, P.; Vijayan, V. Investigation and optimization of laser welding process parameters for AA7068 aluminium alloy butt joint. Mater. Today Proc. 2020, 37, 1672–1677. [Google Scholar] [CrossRef]
  32. Saeheaw, T. Application of integrated CRITIC and GRA-based Taguchi method for multiple quality characteristics optimization in laser-welded blanks. Heliyon 2022, 8, e11349. [Google Scholar] [CrossRef]
  33. Noga, P.; Tuz, L.; Żaba, K.; Zwoliński, A. Analysis of microstructure and mechanical properties of alsi11 after chip recycling, co-extrusion, and arc welding. Materials 2021, 14, 3124. [Google Scholar] [CrossRef] [PubMed]
  34. Balaguru, S.; Murali, V.; Chellapandi, P. Effects of Different Operating Temperatures on the Tensile Properties of the Grid Plate Hardfaced with Colmonoy in a Pool Type Sodium Fast Reactor. Sci. Technol. Nucl. Install. 2017, 2017, 5926105. [Google Scholar] [CrossRef]
  35. Xu, Y.; Cai, Z. Standard deviation method for determining the weights of group multiple attribute decision making under uncertain linguistic environment. In Proceedings of the 2008 7th World Congress on Intelligent Control and Automation, Chongqing, China, 25–27 June 2008; pp. 8311–8316. [Google Scholar]
  36. Sharma, R.; Pradhan, M.; Jain, P. Optimal selection of an AA8011 reinforced nano Si3N4 composite using multi criteria decision-making method. Mater. Today Proc. 2022, 56, 1399–1405. [Google Scholar] [CrossRef]
  37. Haq, A.N.; Marimuthu, P.; Jeyapaul, R. Multi response optimization of machining parameters of drilling Al/SiC metal matrix composite using grey relational analysis in the Taguchi method. Int. J. Adv. Manuf. Technol. 2008, 37, 250–255. [Google Scholar] [CrossRef]
  38. Deng, D.; Li, T.; Huang, Z.; Jiang, H.; Yang, S.; Zhang, Y. Multi-response optimization of laser cladding for TiC particle reinforced Fe matrix composite based on Taguchi method and grey relational analysis. Opt. Laser Technol. 2022, 153, 108259. [Google Scholar] [CrossRef]
  39. Sivakumar, K.; Saravana, M.; Balaguru, S.; Sabarish, R.; Manikandan, J. Mechanical characteristics of gas metal arc welding of ASTM A516 grade 70 steel. Int. J. Appl. Eng. Res. 2015, 10, 822–828. [Google Scholar]
  40. Żaba, K.; Tuz, L.; Noga, P.; Rusz, S.; Zabystrzan, R. Effect of Multi-Variant Thermal Treatment on Microstructure Evolution and Mechanical Properties of AlSi10Mg Processed by Direct Metal Laser Sintering and Casting. Materials 2022, 15, 974. [Google Scholar] [CrossRef]
  41. Desmaison, O.; Guillemot, G.; Bellet, M.; Desmaison, O.; Guillemot, G.; Bellet, M. Numerical modelling of hybrid arc/laser welding: A coupled approach to weld bead formation and residual stresses. In Proceedings of the JOM17, International Conference on Joining Materials, Helsingor, Denmark, 5–8 May 2013. [Google Scholar]
  42. Frewin, M.R.; Scott, D.A. Finite element model of pulsed laser welding. Weld. J. 1999, 78, 15–22. [Google Scholar]
  43. Bagchi, A.; Saravanan, S.; Kumar, G.S.; Murugan, G.; Raghukandan, K. Numerical simulation and optimization in pulsed Nd: YAG laser welding of Hastelloy C-276 through Taguchi method and artificial neural network. Optik 2017, 146, 80–89. [Google Scholar] [CrossRef]
Figure 1. Top-loaded, bottom-pouring stir casting furnace (a) schematic view (b) real view [28].
Micro 04 00039 g001
Figure 2. (a) Graphite-coated cast iron die (b) Casted specimens.
Micro 04 00039 g002
Figure 3. Complete laser welding set-up.
Micro 04 00039 g003
Figure 4. Tensile test specimen.
Micro 04 00039 g004
Figure 5. Load–displacement plot for all experiments.
Micro 04 00039 g005
Figure 6. Temperature distribution for samples 1–9.
Micro 04 00039 g006
Figure 7. Rockwell hardness (fusion zone) for samples 1–9.
Micro 04 00039 g007
Figure 8. Rockwell hardness (heat-affected zone) for samples 1–9.
Micro 04 00039 g008
Figure 9. Samples after tensile test.
Micro 04 00039 g009
Figure 10. Main effects plot for GRG.
Micro 04 00039 g010
Figure 11. 3-D geometry with cylindrical heat source.
Micro 04 00039 g011
Figure 12. Meshed model for experiment 1.
Micro 04 00039 g012
Figure 13. Temperature profile after welding in experiment 1.
Micro 04 00039 g013
Figure 14. Comparative temperature distribution of experiment and simulation.
Micro 04 00039 g014
Table 1. Chemical Composition of AA7075 Alloy [28].
ElementCuMgAlSiCaMnFeZn
Weight %2.13.8186.180.750.060.820.765.52
Table 2. Process parameters and their levels.
ParametersLevel 1Level 2Level 3
Pulse frequency (Hz)170172174
Laser power (kW)3.043.233.42
Welding speed (transverse) (m/min)456
Wire size (mm)11.52
Table 3. Design of experiment according to L-9 orthogonal array.
S.No.Pulse Frequency
(Hz)
Laser Power (KW)Welding (Transverse) (m/min)Wire Size (mm)Heat Input
(J/mm)
11703.044145.6
21703.2351.538.76
31703.426234.2
41723.045236.48
51723.236132.3
61723.4241.551.3
71743.0461.530.4
81743.234248.45
91743.425141.04
Table 4. Dimensions of selected plates.
Length (mm)90
Width (mm)100
Thickness (mm)6
Numbers of plates18
Table 5. Chemical composition of filler wire.
CompositionAlSiFeCuMnMgZnCrTi
ER4043Bal.5.60.80.30.050.050.100.050.02
Table 6. Performance-defining Criteria (PDC).
SNPerformance-Defining Criteria (PDC)Impact on PDC
ResponseWeight
( ξ )
Designation
1Tensile strength (MPa)0.192996PDC-3Higher the better
2Deflection (mm)0.159433PDC-4Higher the better
3Temperature (°C)0.157066PDC-5Higher the better
4Rockwell Hardness (Fusion zone)
HRB
0.267041PDC-1Higher the better
5Rockwell Hardness (HAZ)
HRB
0.223464PDC-2Higher the better
Table 7. Experimental results.
Process ParameterResponse
S. No.Pulse Frequency
(Hz)
Laser Power (kW)Welding Speed
(Transverse) (m/min)
Wire Size (mm)Tensile Strength (MPa)Deflection (mm)Temperature (°C) Rockwell Hardness (Fusion Zone) HRBRockwell Hardness (HAZ)
HRB
11703.044150.678.1044308.9243559
21703.2351.553.758.5565307.7547054
31703.426248.637.7863305.0846373
41723.045260.428.0451310.5845774
51723.236152.638.4744314.5044975
61723.4241.550.578.9821315.6643476
71743.0461.558.839.3119321.1647176.5
81743.234255.739.9791316.9147077
91743.425153.178.7070318.3046078
Table 8. Signal-to-noise ratio of response.
Process ParameterS/N Ratio of Response
S.No.Pulse Frequency
(Hz)
Laser Power
(kW)
Welding Speed
(Transverse) (m/min)
Wire Size (mm)S/N Ratio Tensile StrengthS/N Ratio Deflection (mm)S/N Ratio TemperatureS/N
Ratio Rockwell Hardness (Fusion Zone)
S/N Ratio Rockwell Hardness (HAZ)
11703.044134.09518.17449.79730.8835.42
21703.2351.534.60718.64649.76436.9034.65
31703.426233.73817.82749.68435.9937.27
41723.045235.62418.11049.84335.1237.38
51723.236134.42518.56249.95233.8037.50
61723.4241.534.07819.06849.98430.6337.61
71743.0461.535.39219.38150.13437.0237.67
81743.234234.92219.98250.01936.9037.73
91743.425134.51318.79750.05735.5637.84
Table 9. Normalized signal-to-noise ratio of response.
Process ParameterNormalized S/N Ratio of Response
S. No.Pulse Frequency
(Hz)
Laser Power (kW)Welding Speed
(Transverse) (m/min)
Wire Size (mm)Nor. S/N Tensile StrengthNor. S/N
Deflection
Nor.
S/N
Temperature
Nor.
Rockwell Hardness (Fusion Zone)
Nor. Rockwell Hardness (HAZ)
11703.04410.18930.16100.25110.03910.2413
21703.2351.50.46070.38000.17780.98120.0000
31703.42620.00000.00000.00000.83880.8213
41723.04521.00000.13130.35330.70260.8558
51723.23610.36430.34100.24220.49600.8934
61723.4241.50.18030.57580.66670.00000.9279
71743.0461.50.87690.72111.00001.00000.9467
81743.23420.62771.00000.74440.98120.9655
91743.42510.41090.45010.82890.77151.0000
Table 10. The deviation sequences for all experiments.
Exp. No.0i (1)0i (2)0i (3)0i (4)0i (5)
10.81070.8390.74890.96090.7587
20.53930.620.82220.01881
31110.16120.1787
400.86870.64670.29740.1442
50.63570.6590.75780.5040.1066
60.81970.42420.333310.0721
70.12310.2789000.0533
80.372300.25560.01880.0345
90.58910.54990.17110.22850
ξ 0.1929958830.159433120.1570659930.2670408710.223464133
Table 11. Grey relational coefficient for the response.
Exp. No.GRC
Tensile Strength
GRC DeflectionGRC TemperatureGRC Rockwell Hardness (Fusion Zone)GRC Rockwell Hardness (HAZ)
10.1922832080.1596866640.1733706570.2174746490.227540562
20.2635719110.2045622750.1603879130.934296660.1826487
30.161774140.1375095440.1357450610.6235918260.555677016
410.1550738980.1954206930.4731575380.607793178
50.2328806840.1948188860.2797205230.3463775220.677067188
60.1905717780.2732063310.3202818290.2107594770.756058909
70.6107318770.363737286110.807441935
80.34145738210.3806538790.934296660.866318379
90.2467746750.2247698780.4786013140.5389072531
Table 12. The calculated grey relational grade and its order.
Exp. No.Pulse Frequency
(Hz)
Laser Power (KW)Welding Speed (Transverse) m/minWire Size (mm)GRGRank
11703.04410.0839659
21703.2351.50.0892448
31703.42620.143497
41723.04520.3215591
51723.23610.181996
61723.4241.50.1893265
71743.0461.50.2836352
81743.23420.2415554
91743.42510.2493553
Table 13. Responses for the GRA grade.
Sr. NoLaser Welding Process ParametersGrey Relational GradeMain Effect (Max-Min)RankMean
Level 1Level 2Level 3
1A (pulse frequency)0.1055660.2309580.2581820.15261510.19823544
2B (Laser power)0.229720.170930.1940570.0587920.19823544
3C (welding speed)0.1856420.2200530.2030380.03441140.202911
4D (wire size)0.171770.1874020.2181250.04635530.19243222
Disclaimer/Publisher’s Note: The statements, opinions and data contained in all publications are solely those of the individual author(s) and contributor(s) and not of MDPI and/or the editor(s). MDPI and/or the editor(s) disclaim responsibility for any injury to people or property resulting from any ideas, methods, instructions or products referred to in the content.

