Article

Microfluidic System for Cell Mixing and Particle Focusing Using Dean Flow Fractionation

1
Leibniz Institute of Photonic Technology (Member of Leibniz Health Technologies, Member of the Leibniz Centre for Photonics in Infection Research, LPI), 07745 Jena, Germany
2
Center for Sepsis Control and Care, Jena University Hospital, 07747 Jena, Germany
3
Institute of Physical Chemistry and Abbe Center of Photonics, Friedrich Schiller University Jena, 07743 Jena, Germany
*
Author to whom correspondence should be addressed.
Micro 2023, 3(3), 671-685; https://doi.org/10.3390/micro3030047
Submission received: 16 June 2023 / Revised: 12 July 2023 / Accepted: 19 July 2023 / Published: 31 July 2023

Abstract

:
Recent developments in the field of additive manufacturing processes have led to tremendous technological progress and opened directions for the field of microfluidics. For instance, new flexible materials for 3D printing allow the substitution of polydimethylsiloxane (PDMS) in microfluidic prototype development. Three-dimensional-printed microfluidic components open new horizons, in particular for the automated handling of biological cells (e.g., eukaryotic cells or bacteria). Here, we demonstrate how passive mixing and passive separation processes of biological cells can be realized using 3D printing concepts for rapid prototyping. This technique facilitates low-cost experimental setups that are easy to modify and adopt for specific detection and diagnostic purposes. In particular, printing technologies based on fused deposition modeling and stereolithography are used and their realization is discussed. Additive technologies enable the fabrication of multiplication mixers, which overcome shortcomings of current pillar or curve-based techniques and enable efficient mixing, also of biological cells without affecting viability. Using standard microfluidic components and state-of-the art 3D printing technologies, we realize a separation system based on Dean flow fragmentation without the use of PDMS. In particular, we describe the use of a 3D-printed helix for winding a capillary for particle flow and a new chip design for particle separation at the outlet. We demonstrate the functionality of the system by successful isolation of ~12 µm-sized particles from a particle mixture containing large (~12 µm, typical size of eukaryotic cells) and small (~2 µm, typical size of bacteria or small yeasts) particles. Using this setup to separate eukaryotic cells from bacteria, we could prove that cell viability is not affected by passage through the microfluidic systems.

1. Introduction

Microfluidic systems are suitable tools for the separation and sorting of cells and particles [1]. They require only small sample volume and offer fast sample processing, high sensitivity and spatial resolution, low instrument cost, and increased portability [2]. Differentiation and fractionation are possible in a label-free manner, making microfluidic approaches increasingly important in cell biology research and in many diagnostic and therapeutic procedures [3]. For exploratory research, many microfluidic systems were first fabricated using polydimethylsiloxane (PDMS) [4]. This material features desired physicochemical properties such as optical transparency, biological compatibility, and chemical inertness. Furthermore, the implementation of microfluidic structures such as channels follows well-established protocols and low-cost manufacturing is possible, at least in small series [5]. The main drawbacks of PDMS are its hydrophobicity [6] and problems with reliable reproducible production processes. Well-known problems include the occurrence of trapped air bubbles and the variance in the mixing ratio of the silicone part and the curing agent.
The rapid development in the sector of additive technologies is now paving the way for new alternatives as potential replacements for PDMS-based microfluidic systems [7,8,9,10]. Various current 3D printing approaches have been reviewed [11,12,13,14]. During the last years, important advances have been achieved with 3D printing of microfluidics [8,10,15,16,17]. Three-dimensional printing enables rapid prototyping and is, therefore, of particular interest for the research sector [18,19]. Many applications, including in the life sciences, require the mixing, separation, and focusing of microparticles. Such microparticles can also be different cells and stimuli. Therefore, several microfluidic systems with different active and passive particle separation methods have been published in recent years [1,3,20]. In particular, passive methods are promising approaches for low-power devices as they do not require an external power supply; they also have the potential to be parallelized for high-throughput applications [21]. Passive separation relies on the interference of specific geometric arrangements of microfluidic channels with the flow of the particles. Employed geometries are, e.g., obstacles, pinched flow, and hydrodynamic and inertial focusing, e.g., in a curved channel such as Dean helices [1,22,23]. Inertial microfluidics in particular benefit from the application of 3D printing technology [24]. Based on the principle of lateral migration due to inertial lift forces, it enables the manipulation of microparticles [25,26,27]. Utilizing hydrodynamic forces and rotational Dean drag in a curvilinear microchannel, visible high-throughput separation of red blood cells from diluted whole blood has already been reported [28].
Particle kinetics in inertial microfluidic devices depend on multiple factors, such as the channel geometry/channel walls, curvature, and medium properties, including flow and particle properties [29]. Dean flow fractionation is based on the creation of two counter-rotating streams, the so-called Dean vortexes in the secondary rotational flow in curved channels. The inertial lift forces caused by the shear gradient of microparticles inside a curved microchannel with pressure driven flow of a fluid will drive the particles towards the wall. Additional lift forces will cause repulsion of the particles from the walls of the microchannel. In stable conditions, equilibrium between these two forces evokes counter-rotating flow vortices orthogonal to the main flow direction. Inside these Dean vortexes, the particles will occupy certain positions depending on their size [27,30].
The dimensionless Dean number De characterizes the strength of Dean vortexes, with p as the density of the fluid, D h as the diameter of the microfluidic channel, v f as the mean fluid velocity, n f as the dynamic viscosity, and r as the curvature radius of the microchannel [31].
D e = p v f D h n f D h 2 r = R e D h 2 r
The Dean number is therefore the product of the Reynolds number Re (based on axial flow νf through a pipe of diameter Dh) and the square root of the ratio of the channel diameter and the curvature radius r. The smallest possible separable particle size depends on the particle diameter ap and the microfluidic channel dimensions such as channel diameter Dh and curvature radius r. As a rule of thumb, the following inequality should be satisfied [32]:
a p 2 r D h   >   0.04
Additionally, the flow rate determines whether visible separation can be achieved at the channel outlets. Here, enhanced Dean flow is achieved when Re is increased [23]. For rectangular channels, a particle Reynolds number Rep of >0.05 is suggested to achieve enough particle migration and equilibration at low Re flows [33]:
R e p = R e a p D h 2 > 0.05
Effect of flow rate, device curvature, and medium viscosity on the particle lateral migration have been discussed previously [34,35].
In this contribution, we describe the easy construction of microfluidic mixing systems and particle separation based on Dean flow fragmentation with the aid of low-cost 3D printing technologies. Such setups may be used in biomedical research applications such as defined cell–bacteria interaction studies and separation of bacteria or fungi from eukaryotic cells for further analysis.

2. Materials and Methods

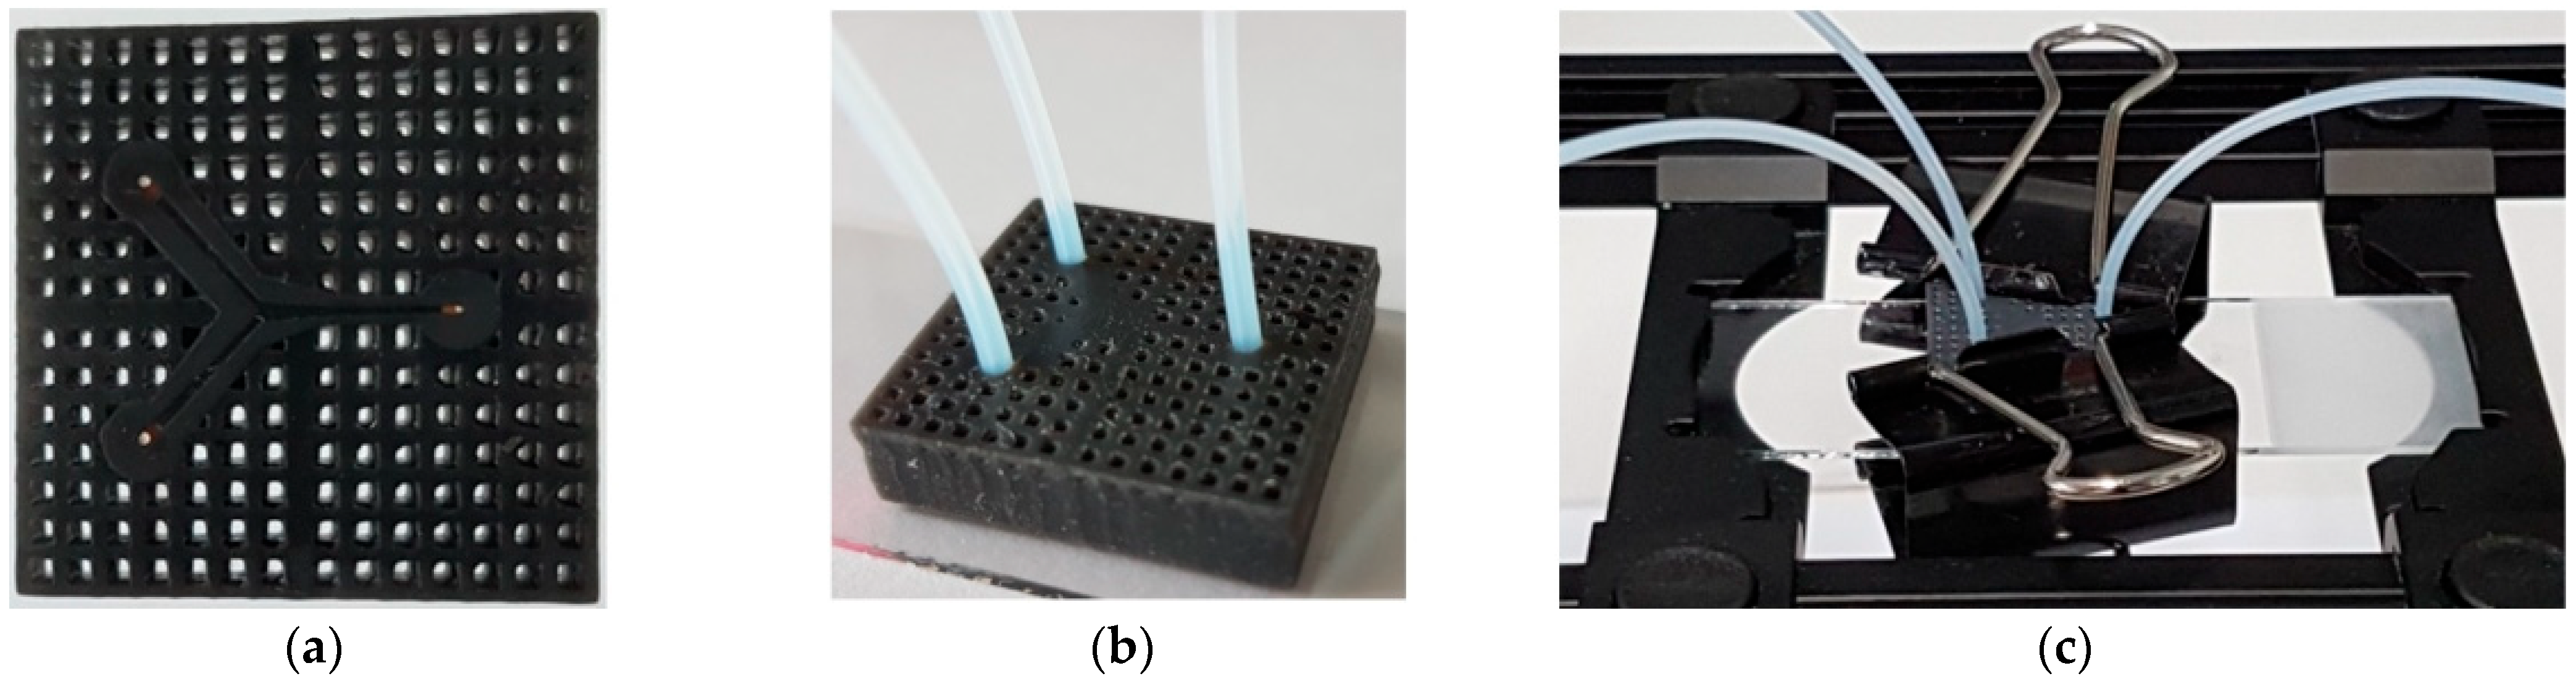
2.1. Microfluidic Component Printing and Assembly

All 3D-printed structures (chip, mixer, helix) were designed using CAD-Software Autodesk Inventor. The resulting STL file was exported to print the structures. Microfluidic structures, such as the mixer and the chip structures, were fabricated with the digital light processing (DLP) stereolithography printer Ember 3D from Autodesk, which can produce high-resolution (50 µm in xy) structures.
Two different resins were utilized: PR48 from Colorado Photopolymer Solutions (used to print the mixer) and the FLFLGR02 acquired from Formlabs (used to print the Y-shaped separation chip). FLFLGR02 has high elasticity and was used when the chip was sealed by means of a mechanical force. PR48 creates a rigid inelastic body where this would not be possible. Here, the capillaries were glued in place. The advantage of PR48 over FLFLGR02 is the transparency of the material, which allows observation during chip operation.
The filament-based Ultimaker 2 (supplier Ultimaker, Utrecht, Netherlands) was used for fabricating holders, such as the support structures of the Dean’s helix and the cap. Here, polylactide (PLA) obtained from Ultimaker was used as the material.
Three different bonding protocols were tested to close the open-printed channels, i.e., to attach the 3D-printed channels (made of FLFLGR02) to a glass surface, which also enabled optical read-out: (1) thermal bonding following protocols by Au et al. [7]. Au et al. developed the protocols to bond PDMS to a glass slide made of borosilicate glass. Based on similar mechanical properties of PDMS and the resin FLFLGR02, we adopted those protocols for our material (the chemical identity of the resin was not disclosed by the company). Prior to heating, the glass slide was cleaned with standard isopropanol and the glass and the 3D-printed chip structure were either cured with the help of a plasma stripper (200-G Plasma System from the Technics Plasma GmbH, Bavaria, Germany) or treated with the UV Ozone Cleaner UVC-1014 for 60 min (Nano Bio Analytics, Bürgel, Germany ). Subsequently, they were heated in an oven for 30 min at 70 °C. (2) Chemical bonding: After cleaning the slide with acetone and isopropanol in the ultrasonic cleaner for 15 min, the chip and slide were put into the plasma stripper for 30 s with the intent to activate the surface. Afterwards, both chip and slide were placed into an argon-filled closed chamber. Methacrylate was added, which was later vaporized inside the chamber by heating in an oven for 12 h at 80 °C. (3) Mechanical bonding using standard binder clips.

2.2. Cell Culture, Fluorescence Labeling, and Live–Dead Staining

THP-1 cells (ATCC® TIB-202™) were cultured in RPMI 1640 GlutaMAX™ (ThermoFisher Scientific, Darmstadt, Germany) supplemented with 10% inactivated fetal calf serum (Merck Millipore, Darmstadt, Germany) and 1 × penicillin/streptomycin (Sigma Aldrich, Hamburg, Germany). Cell nuclei were labeled with 8.1 µM Hoechst 33342 (ThermoFisher Scientific) for 10 min at 37 °C in culture medium, washed once in Dulbecco’s phosphate buffered saline (PBS, ThermoFisher Scientific), and resuspended in culture medium without antibiotics to a cell density of about 5 × 10⁴/mL. After passage through the chips, cell viability was probed by co-staining for 20 min at room temperature with 15 µM propidium iodide (PI, AAT Bioquest, Sunnyvale, CA, USA), which can only enter dead cells.

2.3. Bacterial Culture

Staphylococcus aureus, strain 6850 genetically modified to express GFP (6850-GFP) [36], was cultured overnight in tryptic soy broth (Carl Roth GmbH, Karlsruhe, Germany) at 37 °C while shaking with 160 rpm under ambient air conditions. Bacterial cell density was determined by measuring the optical density of a 1:10 dilution of this overnight culture in TSB in duplicate using the cuvette port of a microplate reader Spark® 20M (Tecan, Männedorf, Switzerland). S. aureus 6850-GFP was washed twice in PBS and resuspended in PBS to a final concentration of about 8 × 10⁶/mL.

2.4. Fluorescence Microscopy

All experiments were performed using an Axio Observer 7 (Zeiss, Jena, Germany) equipped with a Plan Apo 10 × /0.45 DICII objective and a Colibri 7 LED light source. Hoechst 33342 (cell nuclei) was excited at 385 nm and detected using a 432/36 emission filter, while GFP (bacteria) was excited at 475 nm and detected using a 525/50 bandpass emission filter. PI was excited at 511 nm and detected using a triple band emission filter (TBP 467/24 + 555/25 + 687/145). Microparticles were excited using the 555 nm source and emission was detected using a quadruple emission filter (QBT 425/30 + 514/30 + 592/30 + 709/100).

2.5. Mixing and Separation Particles of Cells with Bacteria

To prepare for usage with the biological material, the mixer and the Dean helix separation chip were flushed with a solution of 2% bovine serum albumin (Carl Roth GmbH, Karlsruhe, Germany) in PBS to cover the channel walls and to make the chip biocompatible. The properties of the mixer are discussed in the Results section. The two inlets of the mixer were filled with THP-1 cells and S. aureus 6850-GFP bacteria, respectively, and the output was analyzed by fluorescence microscopy. The sample was pushed into the mixer using an Ismatic Reglo ICC peristaltic pump (IDEX Corporation, Lake Forest, IL, USA), with a flow rate of 100 µL/min per inlet.
Teflon capillaries with an outer diameter of 1/16″ and an inner diameter of 0.25 mm from Jasco were used for the separation helix. Fluorescent microbeads with diameters of 11.95 µm (MF-RhB-B626) and 1.95 µm (Ps-Rh6G-KM258) from microparticles GmbH were used for primary validation of the separation system. The original 3.5%-suspensions were further diluted 1:100 with distilled water. From the diluted samples, 2000 µL was filled into vials for automated loading using a peristaltic pump type Ismatec Reglo ICC, with a flow rate of 100 µL/min pulling on both outlets. Both microparticles had an absorption maximum at 530 nm and an emission maximum at 556 nm. All experiments were performed at room temperature (~20 °C).
The particle stream was visualized using fluorescence microscopy. The acquisition time for the fluorescence images was fixed to 200 ms. The fluorescence images contained the weak traces of the moving particles along with an intense signal from stationary particles that attached to the channel walls over a long period of time. In order to analyze only the moving particle, effective signal images (Ies) were defined as the absolute value of their sequential subtraction: Ies(x,y,tn) = abs(Image(x,y,tn) − Image(x,y,tn−1). In such a way, only the flow of moving particles was visible. The accumulated flow AF(tn), a quantity proportional to the number of particles flowing into a specific channel, was defined as the sum of Ies(x,y,tn) over an area of a port and over the time from t = 0 to t = tn AF(tn) = Σ(x,y⊂port)Σ(0<tn<t)Ies(x,y,tn). The ports were defined as bars crossing the end of the channels and possessed the same area (see Section 3.3.2). This image processing was implemented with ImageJ environment and Python programming language.
After validation with microparticles, the helix was used to separate Hoechst 33342-labeled THP-1 cells from S. aureus GFP-6850 bacteria. The mixture (ratio 1:160 for THP-1 to S. aureus) was filled into a vial and loaded using a peristaltic pump as described above. Fluorescence images of the cell stream (Hoechst 33342) were recorded using fluorescence microscopy.

3. Results

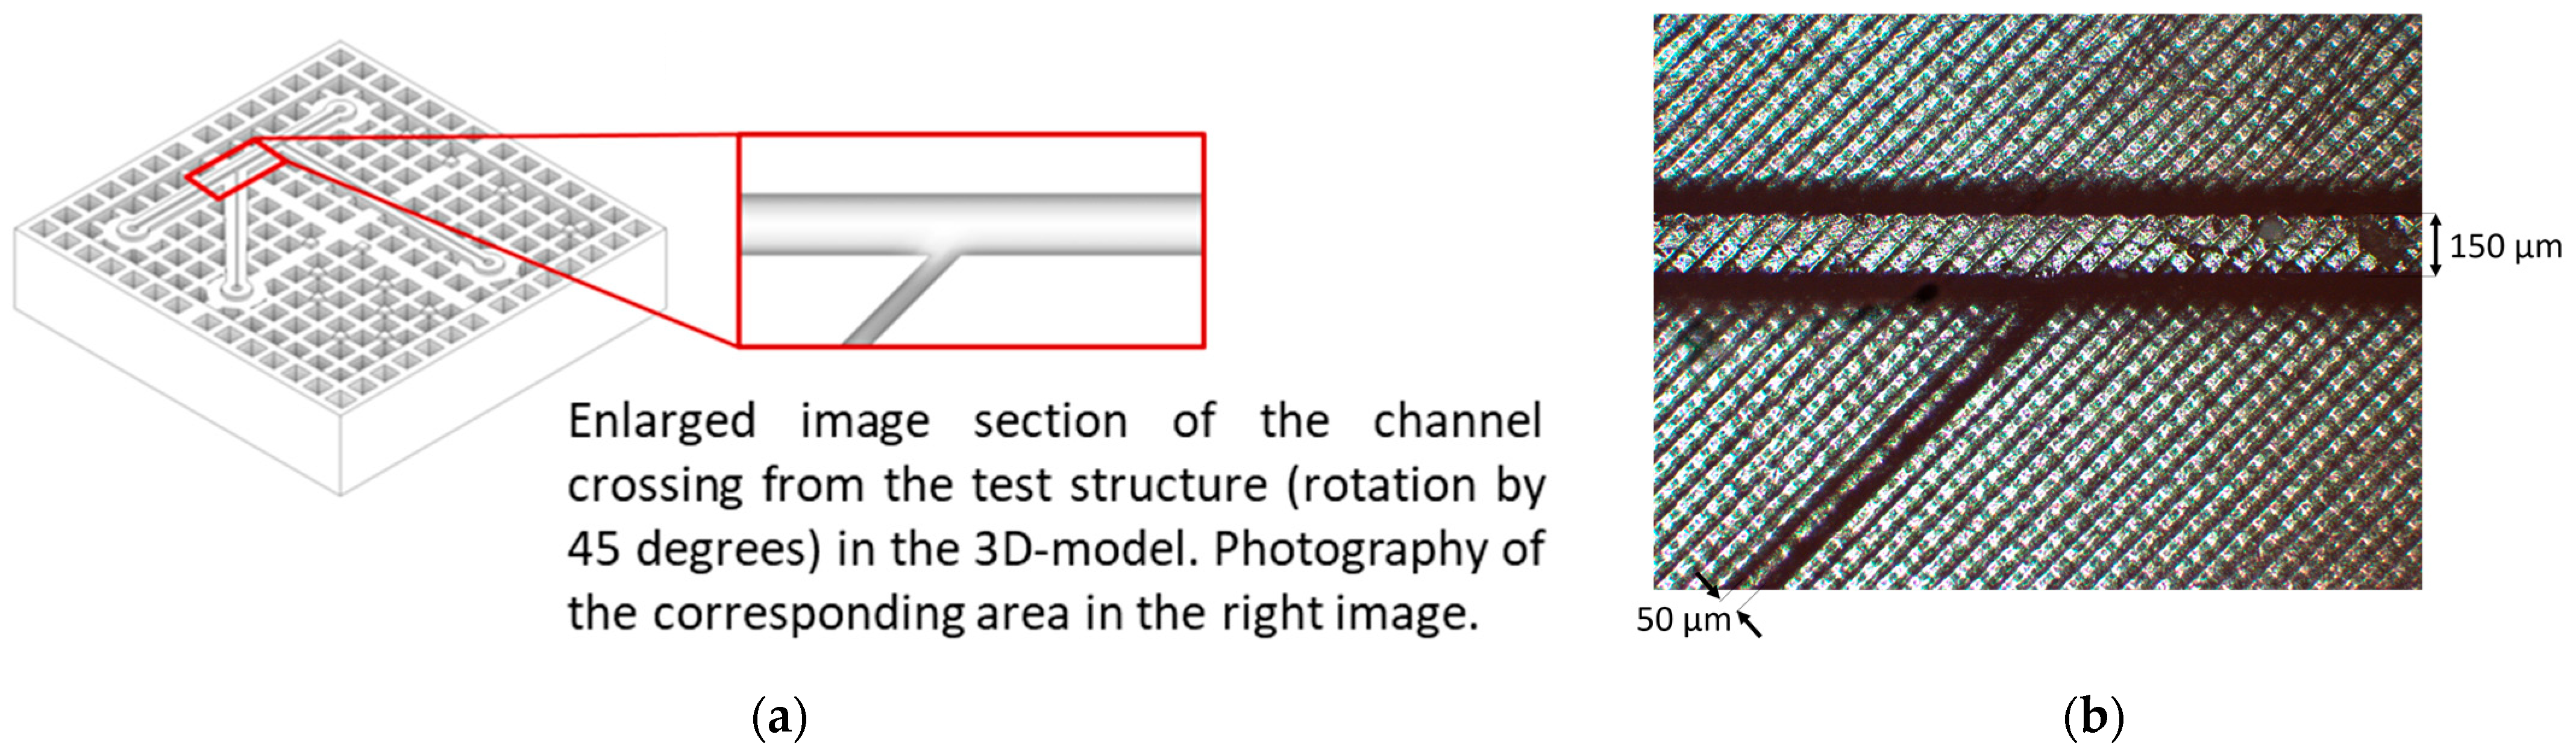
3.1. Microfluidic Channels
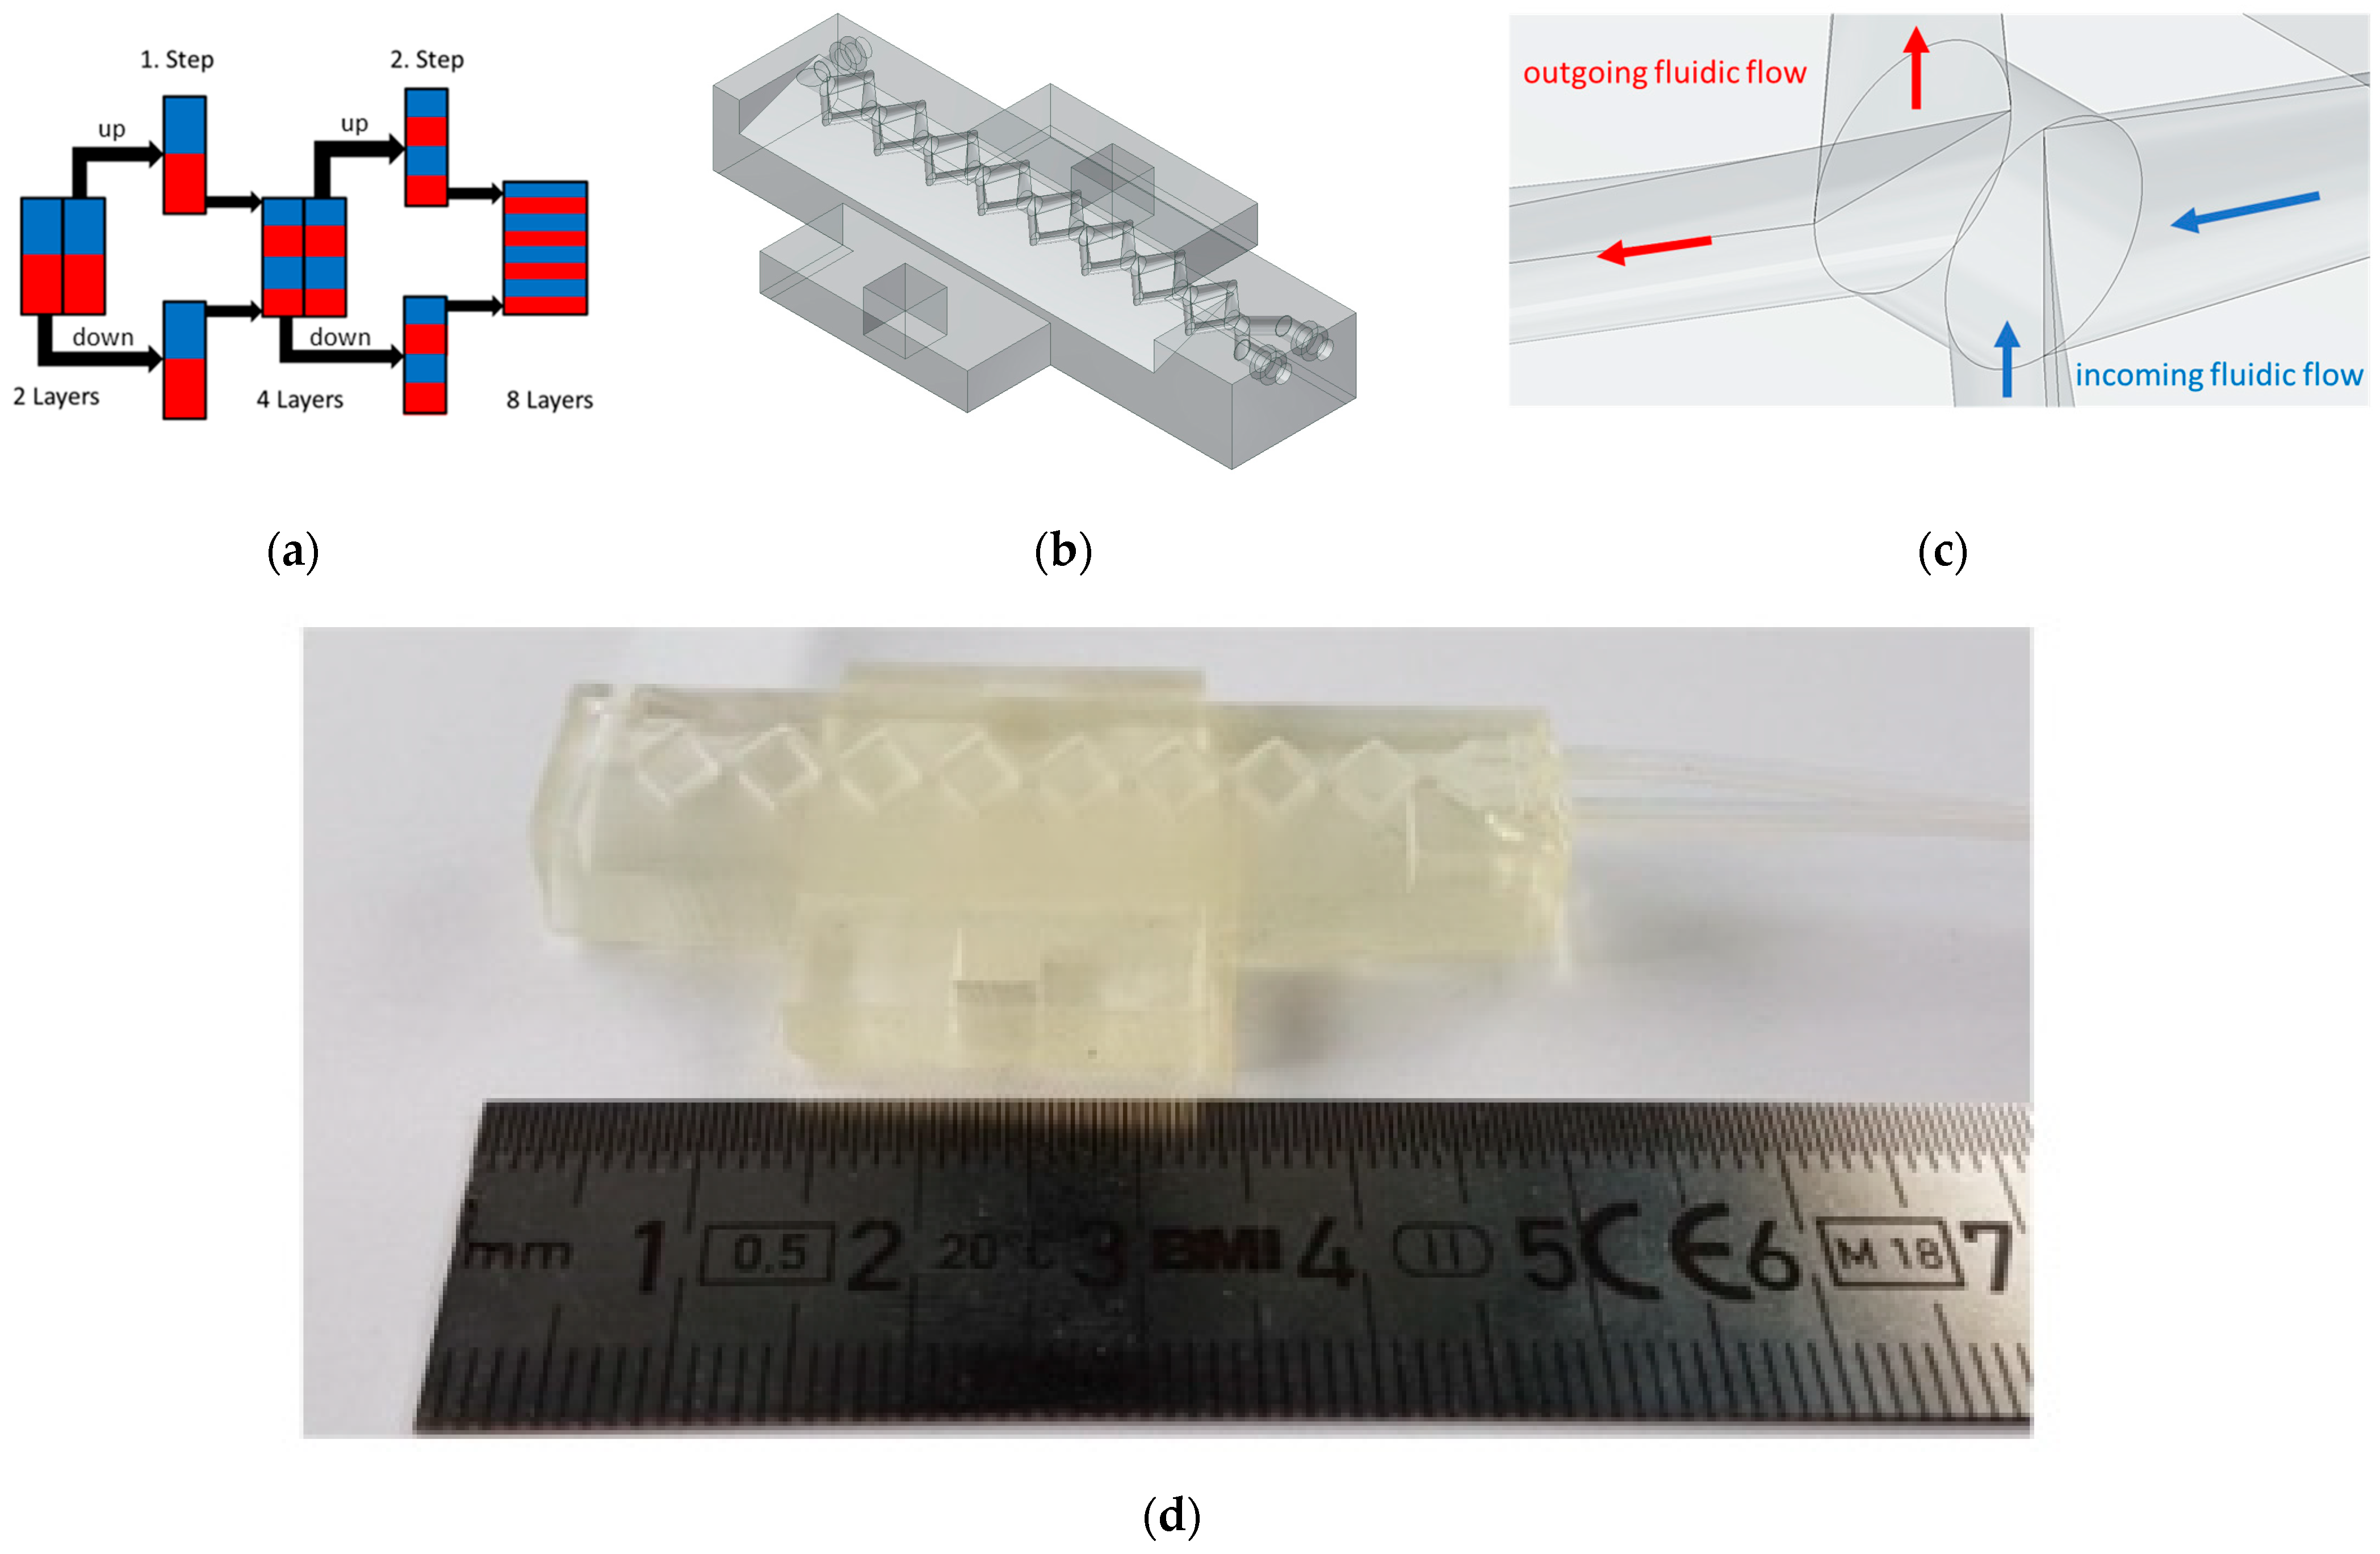
There are two ways to design printed microfluidic channels. The first is to print closed channels in the solid material surrounded on all sides by the cured resin. The second is to print open channels that are closed at the top by other means. The minimum channel (open diameter) is not only defined by the resolution of the printer but is limited by the layer principle of the printer. With each additional top layer, the lower layers receive an additional dose of UV radiation. The uncured resin enclosed in the channels is additionally hardened so that its viscosity increases. The absorption of the UV radiation by the different layers is defined by the Beer–Lambert law [37]. If the degree of curing of the enclosed resin is too high, evacuation of the resin, for example with compressed air, is no longer possible. Whether the enclosed resin can be rinsed out depends on the cumulated total resistance. This resistance depends on the channel length, the size of the channel, and the viscosity of the resin. Using the Autodesk Ember and PR-48, the minimum possible diameter for closed channels was 500 µm for a channel length of 20 mm. The problem of trapped resin and its evacuation can be avoided with open channels. Therefore, we created open channels with a minimum possible channel width of 50 µm in this study. This channel width was determined by the resolution of the printer. Figure 1 shows a test pattern.
When using open channels, the sealing of their upper side has to be implemented. If optical or spectroscopic investigations are envisioned, sealing with a glass or quartz slide is a common approach [38]. Here, we tested three different approaches to bond the 3D-printed channel with a glass cover for subsequent optical investigation: (1) thermal, (2) chemical, and (3) mechanical bonding. The major criterion for evaluating the bonding protocols was the tightness of the channels in continuous fluidic operation. We obtained the best results for the mechanical bonding using clamps (Figure 2). This proved to be straightforward and reliable, since the 3D printing resin had elastic mechanical properties comparable to rubber. A further advantage of mechanical bonding was its reversibility. It was possible to take the glass slide off to clean the chip. This feature allowed multiple re-use of the chip and therefore a reduction in the research costs (especially if the chip or slide have been previously functionalized, e.g., with electrodes).
Sealing of the 3D-printed channel structure with a borosilicate glass slide resulted in two different materials surrounding the flow in the channel. With regard to the material properties, the glass substrate was characterized on the one hand by low surface roughness, which meant that no turbulence could occur that could interrupt the laminar flow in the fluidic channel. Secondly, similar to the 3D-printed material, the borosilicate glass was neither particularly hydrophilic nor hydrophobic, so that no interruption of the laminar flow was to be expected through the use of two different materials. Other primary parameters such as velocity and viscosity (which influenced the consequent Reynolds number and consequently the laminar fluidic flow as well as the shear stress) were independent from surrounding materials.
For the particle separation using Dean’s flow fractionation, a microfluidic chip with one inlet and two outlet channels was designed. Due to their versatile applications, such Y-junctions have already been used extensively [16]. Figure 2a shows the Y-junction that was realized in this work: Behind the channel inlet, a 250 µm wide and 200 µm deep channel joined in. An expansion zone where the channel was widened to 500 µm was followed by the Y-junction, where the channel was split into two smaller channels leading to the outlets.
The coupling between the capillaries and the inlet and outlet channels of the chip was realized using plug connections (Figure 2b). The openings for the capillaries had a diameter of 1.65 mm, while the outer diameter of the capillaries was 1.68 mm. Thereby, a transition fit between capillaries and chip was implemented, which worked at the same time as a sealing and a mechanical bracket between both pieces.
An additional feature of the chip was the mesh grid structure of the chip body (Figure 2a). This mesh design facilitated the fabrication process and additionally held potential for increased biocompatibility in the end. Three-dimensional-printed pieces from the stereolithography printer needed a post-curing step after the actual printing process in which UV-light was used to complete the polymerization process. The black material of the chip body (Figure 2) absorbed the light and, thus, prevented high penetration depths. The grid structure created additional holes and a several-times higher surface area, guaranteeing a complete polymerization in the material interior. Complete polymerization is important to prevent leakage of either unreacted monomers or residual photoinitiator from the final device. Since photoinitiators and radicals may be cytotoxic [39] and should be avoided within microfluidic chips for life cell analysis, this is an important aspect for biocompatibility.

3.2. Mixer

One application of closed channels is a microfluidic mixer. Extensive reviews on active and passive microfluidic mixers have been published [40,41]. The standard way to mingle media of different types or with different particles in a passive microfluidic element would be to interrupt the laminar flow and enhance the diffusion or chaotic advection inside the medium. This can be achieved by introducing flow obstacles such as sharp curves, sudden variations in channel width, rough surfaces, or obstructions such as micropillars [42]. It is possible to print such a mixer with the mentioned STL-Printer and PR-48 as the resin. However, this design bears several weaknesses. First, air bubbles can attach to the micropillars, reducing the intended abrupt volume change in the channel and, thus, reducing the total efficiency of the mixer. Second, particles often deposit at the sharp curves and the pillars, which results in a loss of sample and additionally introduces the risk of clogging and the reduction of the mixing efficiency.
Three-dimensional printing enables creating new types of microfluidic mixers without these disadvantages [40]. As channels do not have to be constricted to the same plane, critical elements such as sharp curves or micropillars can be omitted. Figure 3a shows the principle of a mixer utilizing different planes. It relies on splitting and recombining in 3D, i.e., the round channel was split in an upper and lower half. Both channels were later reconnected and shaped the left and right half of a new channel (Figure 3a). For example, after eight such repeating steps, initially 2 layers of media were split into 512 layers of alternating input. The number of layers multiplied with every step in the potency to the number of initial layers. A mixer utilizing this principle was realized according to the technical drawing shown in the Supplementary Information (Figure S1). For sealing the inlets and the outlets of this multiplication mixer, the resin of the building material was additionally used as glue. By applying it at the spots where the capillaries were plugged, it sealed the openings between both components. In order to prevent the resin from being sucked into the chip by the capillary effect and clogging it, a small chamber was implemented to interrupt the capillary effect (see Figure 3b,c). An additional characteristic of structures printed with the PR-48 resin is that they shrink during the post-curing process. This feature can be used to gain a mechanical solid connection between chip and capillary by means of an interference fit. The reduction of lengths and diameters by 2.5% can be used to achieve tight fits by inserting the capillary into the hole before starting the post-curing. Here, the capillary should have the same diameter as the programmed hole. Utilizing the shrinking during the post-curing process, an interference fit is achieved. The right choice of the diameters of hole and capillary is essential. A sealing step after the post-curing due to the surface roughness of the printed piece is still necessary to avoid leakage and can be achieved by attaching and curing an additional drop of the resin to the capillary hole connections. The split and recombine mixing principle was first realized with 3D printing technology by Shallan et al., for mixing fluorophore solutions [42]. Here, we demonstrated its potential for mixing biological cells, in particular immune cells (here, THP-1 monocytes) and bacteria (here, Staphylococcus aureus). Such interaction studies are relevant to unravel immune cell function upon stimulation by pathogens. During blood stream infections, this interaction between pathogens and immune cells happens in flowing fluid. In our presented example, successful mixing was achieved, as illustrated in Figure 3d. In a simple approximation, cells in 3–4 fields of view (FOV) with an area of 1.77 mm2 were counted. In the inlet channel, 13 ± 6 THP-1 monocytes and 585 ± 143 S. aureus were found per FOV. In the output channel, the mixed sample contained 13 ± 5 THP-1 monocytes and 906 ± 370 S. aureus per FOV. From the mixing ratio, it was expected that there were 160 times as many S. aureus as THP-1 cells. We noted that the number of S. aureus was underestimated by our very simple and not fully quantitative analysis method, in which only one focal plane was analyzed; therefore, particles out of the focus plane were not recognized. This would affect the smaller particles (Ø 1 µm) such as S. aureus to a much greater extent than the bigger particles, which would be mainly found at the bottom of the slide where the measurement was performed. From the mixing principle, it was expected that the concentration in the output would be reduced to half. For the large (Ø ~15 µm) THP-1 cells, this was within experimental error. Such mixing experiments could be of relevance when studying pathogen–host interactions. Interaction time could be defined by channel length.
Gentle mixing and biocompatibility of the presented split and combine mixer was proven with cell viability staining using PI to highlight dead cells. The red fluorescent PI can only enter non-viable cells and bind to their DNA. As shown in Figure 4, no reduction of cell viability could be detected after passage through the mixer. Estimated from 4 to 6 FOV with an area of 1.77 mm2, the total viability was about 92% before passage through the mixer and still 92% in the outlet. We did not find any non-viable bacteria in the mixed output.

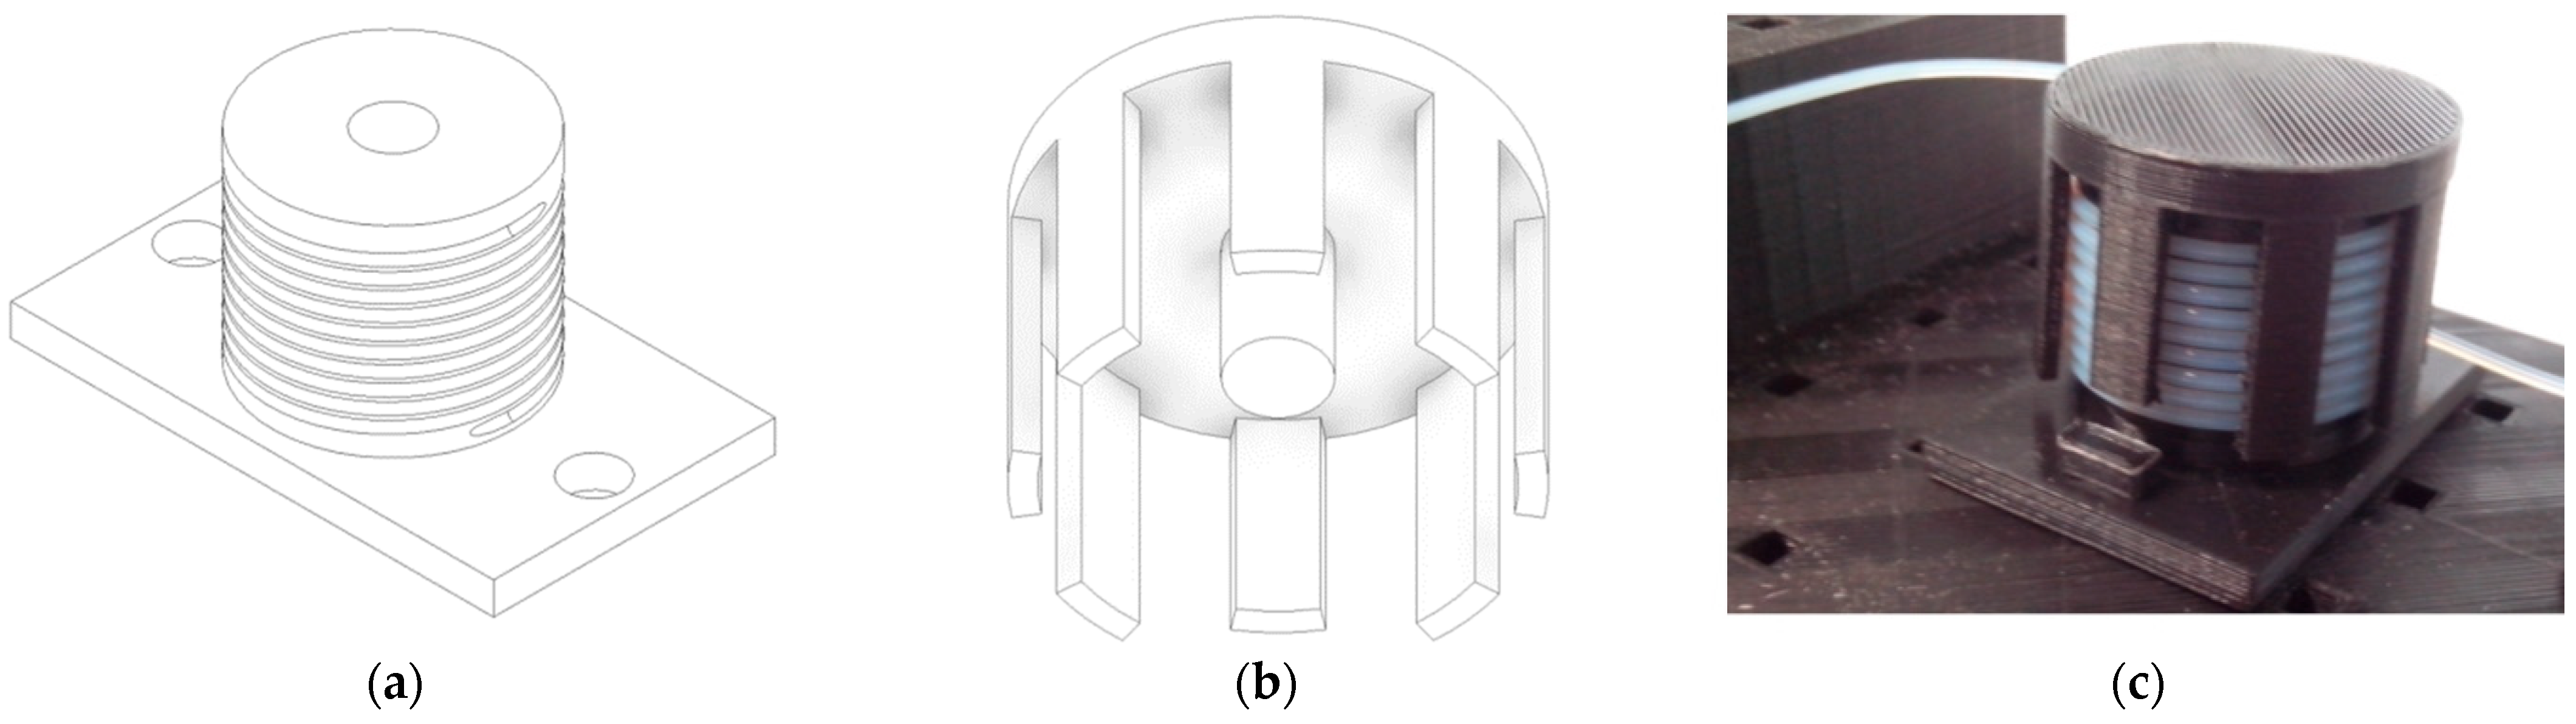
3.3. Dean Flow Helix

3.3.1. Establishment of Microfluidic Components

Conventional designs for Dean flow fractionation all share the following basic construction: Starting from the inlet, the channel runs in several convolutions with steadily increasing curvature radius. This non-constant curvature has a negative effect on the focusing of the microparticles (see Equation (1) for dependence on curvature radius). Three-dimensional printing can be used to implement a spiral shape with regular helix in which the curvature is constant, assuring constant Dean vortexes. This can be realized by either directly using 3D printing to create a regular helical structure with closed channels within a solid body [22], to use 3D printing to create a hollow cylinder that contains the guideway for the capillary on the inner side, or to use 3D printing to create a cylinder with grooves on the outer surface to guide a capillary [23]. In our hands, the latter concept worked best and was successfully replicated using the Ultimaker 2, with polylactide (PLA) as material. Using a ready capillary as a microfluidic channel assures a uniform smooth inner surface that is not always easily achieved when closed; helix-shaped channels are produced by 3D printing. Relevant parameters are the inner diameter of the capillary, the diameter of the printed holder (defining the curvature of the helix), and the number of turns. We used a capillary with an outer diameter of 1/16” and an inner diameter of 250 µm and wrapped it in 10 turns around the 3D-printed cylinder with a diameter of 30 mm, as depicted in Figure 5. Two additional improvements for better handling during the coiling of the capillaries around the cylinder were introduced: Firstly, a floating bearing at one side was introduced for additional support of the capillaries during the coiling (Figure 5a). Secondly, we inserted a cap after the coiling on the cylinder to avoid the unscrewing of the capillary (Figure 5b).

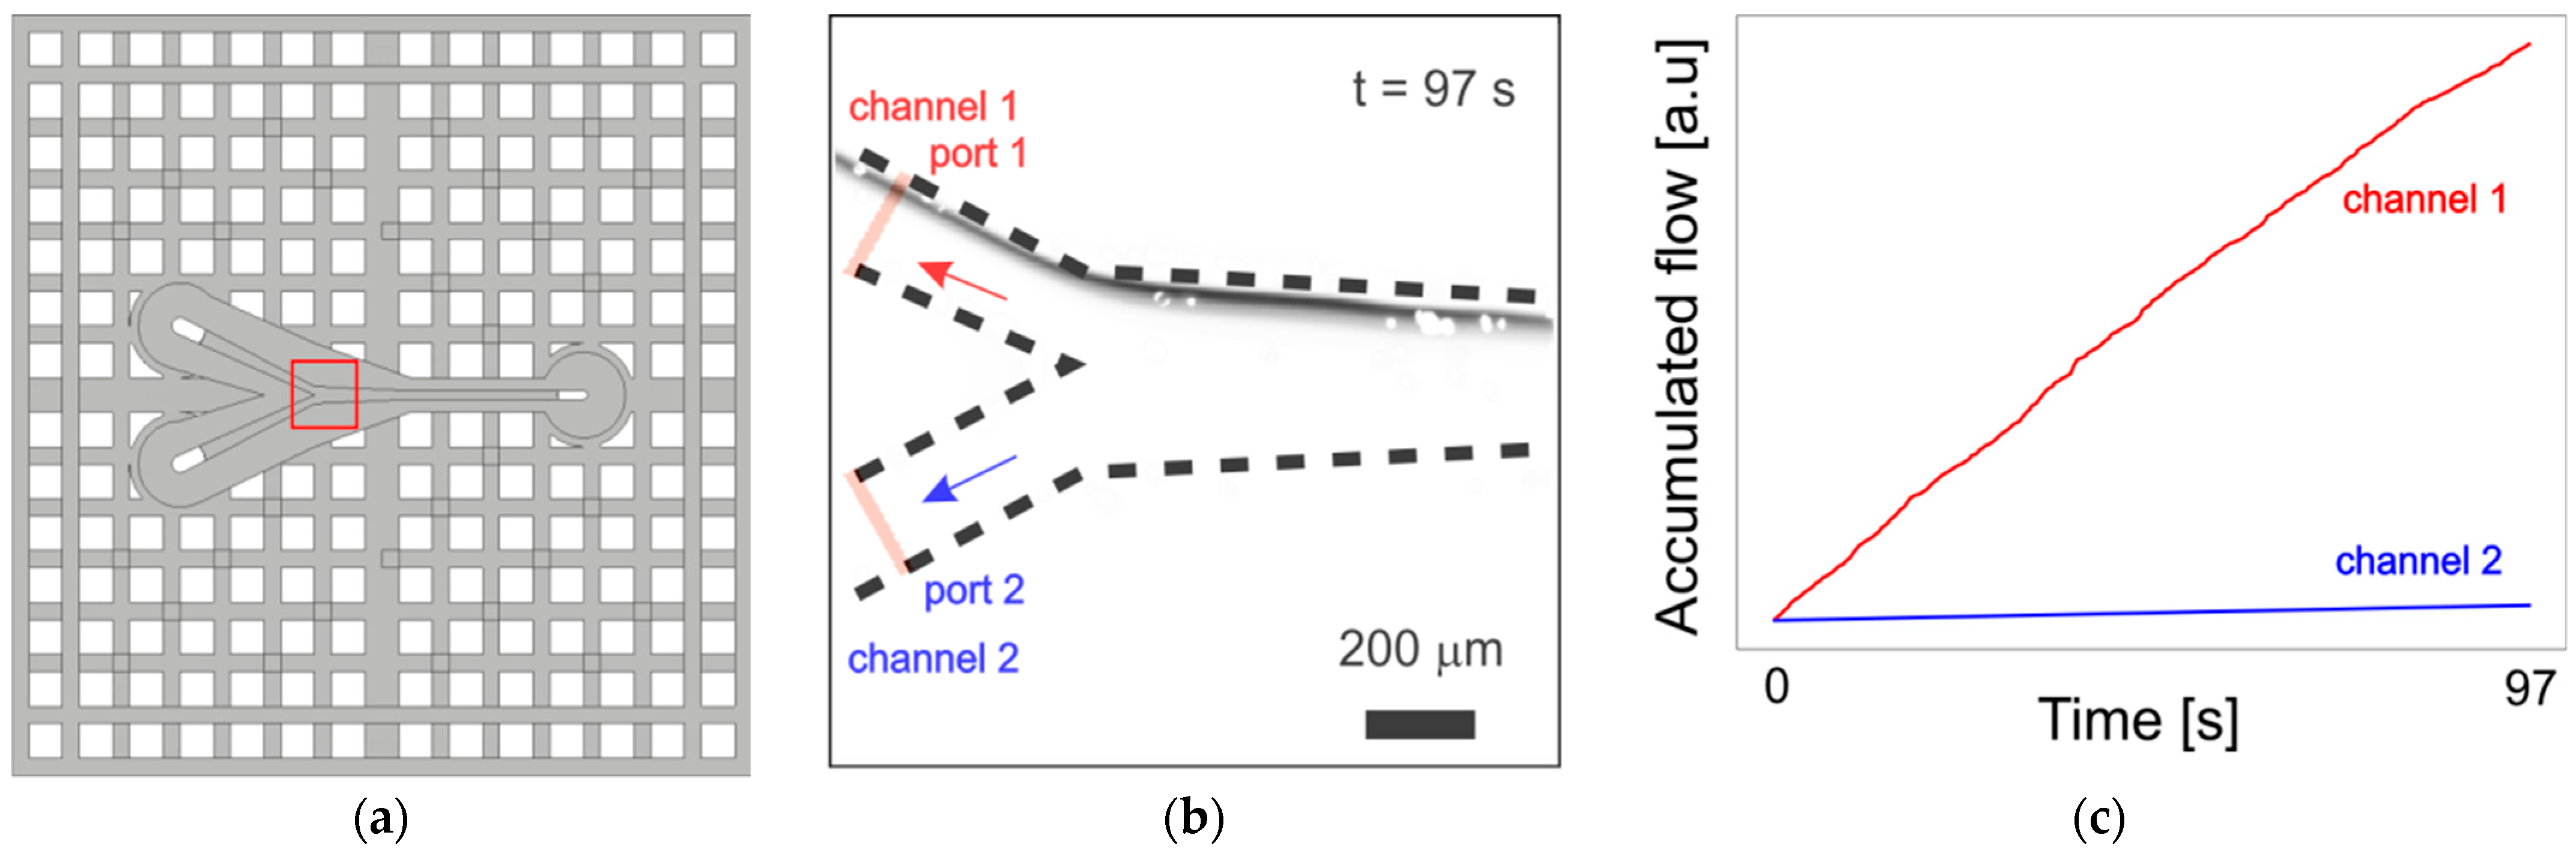
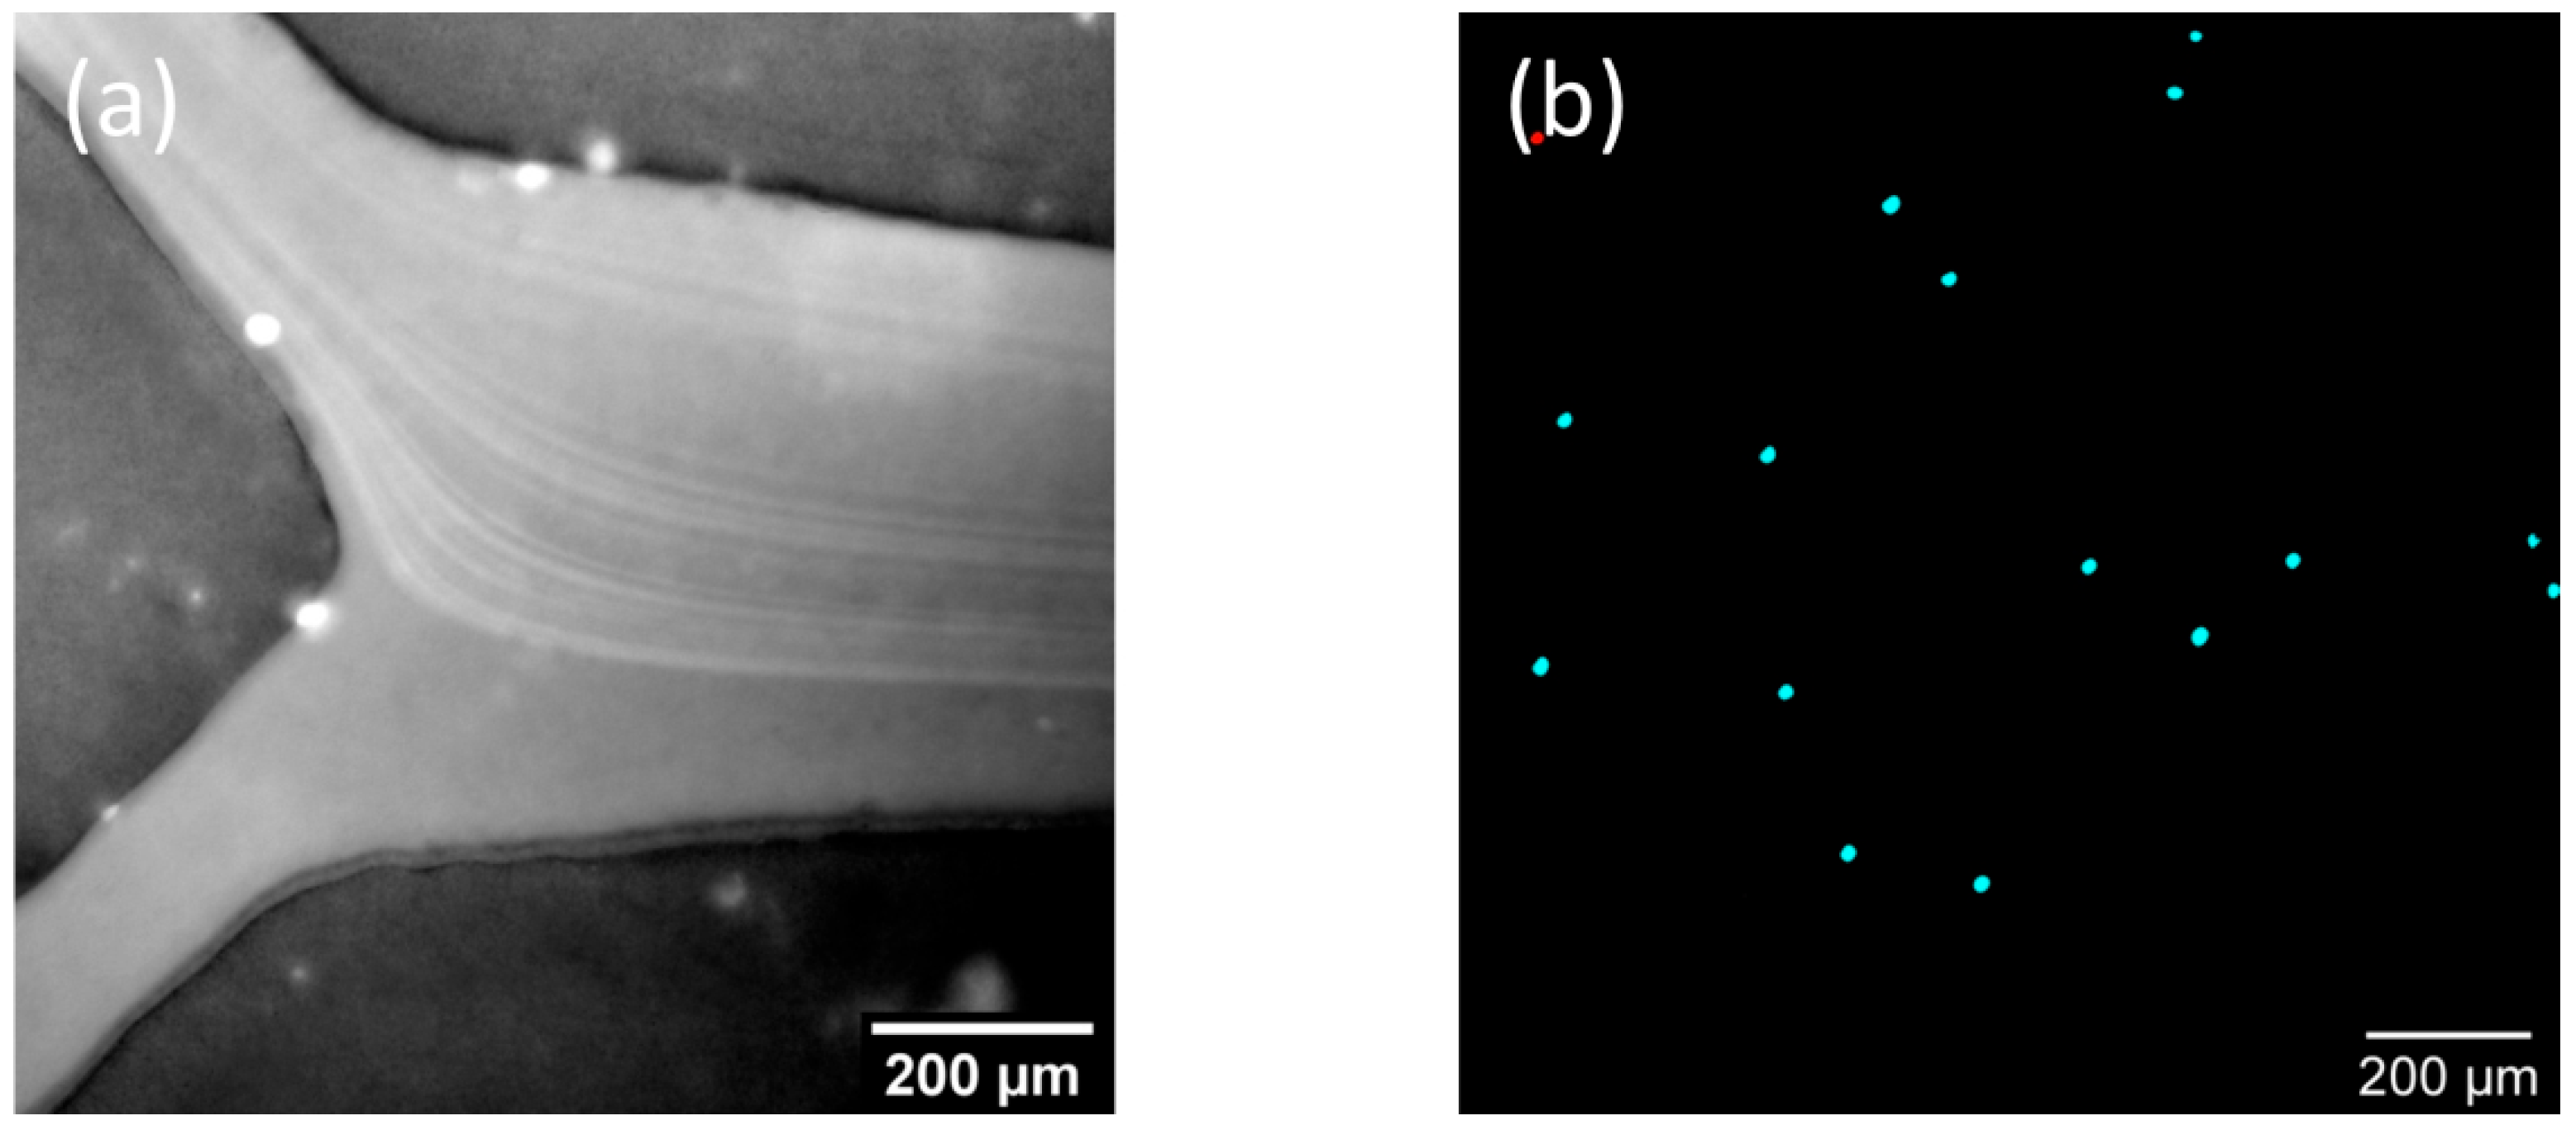
3.3.2. Application Examples: Separating Small and Large Particles in Dean’s Flow Helix

For demonstrating the strengths and limitations of the Dean’s flow helix for particle separation, in a first approach, a mixed sample with microparticles with diameters of 11.95 µm and 1.95 µm was chosen. The large particles (Ø 11.95 µm) were of comparable size to eukaryotic cells, such as immune cells or cancer cells. The small particles (Ø 1.95 µm) were in the size range of bacteria and the lower size limit of microconidia. Using the rule of thumb given in Equation (2) for our experimental parameters (microchannel diameter Dh = 250 µm and radius of curvature of 15 mm), we received for the large particles (ap = 11.95 µm) a value of 0.14 > 0.04 and for the small particles (ap = 1.95 µm) a value of 0.0036 < 0.04. Thus, it was possible to adjust fluid conditions to focus the large particles, while it was not possible to focus the small particles.
The mixed sample was pumped from the tubes into the helix. The helix was placed on a printed breadboard and attached with snap fits. This allowed more flexibility on the experimental layout. From the helix, the capillary was plugged into the chip, which was mounted under the fluorescence microscope to monitor the particle stream at the separating edge, where the channel from the inlet was split into the two outlet channels.
With the peristaltic pump, three different flow rates were tested: 50 µL/min, 100 µL/min, and 200 µL/min. Table 1 summarizes the calculated parameters and experimental findings. As outlined in Equation (1), increased flow rates resulted in increased Reynolds numbers. For the large particles (Ø 11.95 µm) and the highest flow rate (200 µL/min), a particle Reynolds number of 0.039 was calculated. This was very close to the recommended value of >0.05 for rectangular channels given in Equation (3).
The successful separation of the 11.95 µm particles at high flow rates of 200 µL/min is displayed in Figure 6. The grey scale image in Figure 6b represents the accumulated traces of the particles over the duration of the measurement (97 s), i.e., a total sum of such image sequences. It can be seen that the particles were squeezed in the top part of the inlet channel on the right by Dean’s flow helix and then they flowed only in channel 1 at the Y-junction of the chip. The time-resolved separation of the beads into the channels, i.e., the integrated signal from the area of each channel from the beginning of the measurement to the given time, is presented in Figure 6c. The lines in the graphs represent the accumulated flow of the particles for each channel. This confirmed the steady flow of the particles into channel 1 and the virtual no flow of the large particles into channel 2. The 11.95 µm particles flowed completely into one outlet, while the 1.95 µm particles were equally distributed over both outlets (in agreement with the calculation using Equation (2)). This was due to the lack of the focusing effect resulting from the lower particle size.
Having established the particle separation system using the Dean’s helix, we sought to separate a mixture of THP-1 cells labeled with Hoechst 33342 and bacteria S. aureus 6850 expressing GFP. To increase the biocompatibility, the whole system was flushed with a 2% BSA solution before usage. As shown in Figure 7a, Hoechst 33342 labeled cells were separated into one single channel, similar to particles of 11.95 µm size (see above). Cell viability was not affected by passage through the chip, as indicated by dead cell staining using PI (Figure 7b).
It was noted that—despite its efficient cell separation—relatively high sample dilution was necessary to achieve cell good separation [43]. Thus, a relatively low concentration of THP-1 cells was used, which resulted in a rather low overall throughput.

4. Discussion

In this contribution, we demonstrate how the application of additive technologies can be used to create tailored microfluidic components for the purpose of particle mixing, separation, and observation. This includes the development of a simple plugin connection for the capillaries. Three-dimensional printing provides an alternative to PDMS-based microfluidics. An easy-to-construct concept for microfluidic mixers, which can be replicated by means of 3D printing and operates without the use of component parts disrupting the laminar stream, is presented.
Different bonding approaches have been reported in the literature, in particular thermal, chemical, and mechanical bonding. In our hands, mechanical bonding yielded the best results. Thermal bonding (both after plasma stripping or with mentioned UV Ozone cleaning) resulted in a mechanically stable connection between glass and resin. However, this type of bonding proved not to be resistant to aqueous media. Hydrolysis destroyed the adhesive bonds between the inorganic glass and the organic polymer. To prevent this physical detachment, a coupling agent such a silane is needed. Chemical bonding using 3-methacryloxy-propyl-trimethoxy-silane did not achieve a stable connection with glass for our chips, despite the fact that it was reported to be a suitable reagent to bond unsaturated polyesters, acrylics, and others [44].
Three-dimensional printing enabled a low-cost experimental layout for Dean’s flow fractionation, which could be easily modified for specific application purposes. We evaluated different existing technical designs and encountered shortcomings for two of them. If the Dean’s helix is aimed to be created directly by 3D printing the closed channels in the course of a helix within a solid body as described previously [22], specialized stereolithography printers have to be used. With the Autodesk Ember and the Resin PR-48, this design could not be reproduced. The probable reason was the limited achievable minimum channel size (see also Section 3.1). Another potential problem was the surface roughness of the inner surfaces of the channels. With the Autodesk Ember, the printing process proceeded in layers of an adjustable thickness between 10 and 50 µm. Thus, when printing layers inside a curved surface (as would be the helix channel), small steps with this height would remain from successive printing. Such a surface roughness could perturb the laminar flow and secondary streaming profile. A second approach was tested, where the helix was formed by a ready-made capillary. The capillary was coiled inside a 3D-printed hollow cylinder that contained the guideway for the capillary on the inner side. This caused too high frictional resistance between capillary and guideway and was not pursued further. By contrast, the final attempt using a 3D-printed cylinder with a capillary guide on the outer surface was easy to manufacture and gave satisfactory separation results. Using this Dean’s flow helix, it was demonstrated that focusing of the particle flow was possible for 11.95 µm large particles, while smaller 1.95 µm particles did not achieve a focused stream and were found in equal quantities in both channels. If the smaller particles (which could be, e.g., bacteria in an application example) were of interest for further use, the channel without the large particles could be used and the outlet channel with larger particles was redirected to the system before the Dean’s flow helix. In this way, the small particles went to the outlet and the large particles (>11.95 µm) stayed in the microfluidic system. The system could be easily optimized to separate particles of different sizes (but with similar dimensions) by changing the capillary diameter using commercially available tubes (not yet determined in this contribution). A limiting factor for the use of a capillary was possibly the minimal inner diameter up to which the capillary could be wound around the helix. Finer capillaries tend to have stiffer material, resulting from manufacturing-related reasons. For good separation, the connection of the capillary leading from the helix to a chip with a separating edge was also of importance and the alignment between these two components was performed with care.
By employing microfluidic systems for mixing cells with bacteria and subsequently separating the bacteria from the cells, we could show that whole systems are compatible for biological applications, at least in the time span of the experiment. We could not detect any reduction of cell viability after passage through both chip systems. The mixer, in combination with a later separation loop through the Dean’s helix, might, thus, provide the basis for a whole biological system for incubating cells with bacteria (or other material) for a defined period of time and separating them again to study the influence of different material on biological samples in one single microfluidic chip solution.

Supplementary Materials

The following supporting information can be downloaded at: https://www.mdpi.com/article/10.3390/micro3030047/s1, Supplementary Figure S1: Technical drawings for the Y-junction chip shown in Figure 2; Supplementary Figure S2 Technical drawings for the mixer shown in Figure 3; Supplementary Figure S3: Detailed sketches of the mixer design from Figure 3b.

Author Contributions

Conceptualization: A.W., O.S. and U.N.; validation: A.W., O.S. and A.T.; investigation: A.W., O.S. and A.T.; visualization: O.S.; resources: O.S. and U.N.; writing—original draft preparation: A.W., O.S., A.T. and U.N.; writing—review and editing: A.W., O.S., A.T. and U.N.; supervision: U.N.; project administration: U.N. All authors have read and agreed to the published version of the manuscript.

Funding

We acknowledge support from the Leibniz Institute of Photonic Technology, the German Federal Ministry of Education and Research (BMBF) via the Center for Sepsis Control and Care (CSCC, FKZ 01EO1502) and the funding program Photonics Research Germany (FKZ: Leibniz-IPHT 13N15713, 13N15717, and 13N15704), from the Leibniz Association via the Leibniz ScienceCampus InfectoOptics (W8/2018), from the Deutsche Forschungsgemeinschaft (DFG, German Research Foundation) under Germany’s Excellence Strategy—EXC 2051—Project-ID 390713860 (Cluster of Excellence Balance of the Microverse), as well as from the European Union via EFRE funds within the “Thüringer Innovationszentrum für Medizintechnik-Lösungen (ThIMEDOP) (FKZ IZN 2018 0002)”.

Data Availability Statement

Data are available upon request.

Acknowledgments

We would like to thank W. Fritzsche and his department for access to the research infrastructure and donating the microbead samples. We thank L. Tuchscherr for providing the S. aureus strain.

Conflicts of Interest

The authors declare no conflict of interest.

References

  1. Lenshof, A.; Laurell, T. Continuous separation of cells and particles in microfluidic systems. Chem. Soc. Rev. 2010, 39, 1203–1217. [Google Scholar] [CrossRef]
  2. Bhagat, A.A.; Bow, H.; Hou, H.W.; Tan, S.J.; Han, J.; Lim, C.T. Microfluidics for cell separation. Med. Biol. Eng. Comput. 2010, 48, 999–1014. [Google Scholar] [CrossRef]
  3. Gossett, D.R.; Weaver, W.M.; Mach, A.J.; Hur, S.C.; Tse, H.T.K.; Lee, W.; Amini, H.; Di Carlo, D. Label-free cell separation and sorting in microfluidic systems. Anal. Bioanal. Chem. 2010, 397, 3249–3267. [Google Scholar] [CrossRef]
  4. Whitesides, G.M. The origins and the future of microfluidics. Nature 2006, 442, 368–373. [Google Scholar] [CrossRef]
  5. Zhou, J.; Ellis, A.V.; Voelcker, N.H. Recent developments in PDMS surface modification for microfluidic devices. Electrophoresis 2010, 31, 2–16. [Google Scholar] [CrossRef]
  6. Eddings, M.A.; Johnson, M.A.; Gale, B.K. Determining the optimal PDMS-PDMS bonding technique for microfluidic devices. J. Micromechanics Microeng. 2008, 18, 67001. [Google Scholar] [CrossRef]
  7. Au, A.K.; Bhattacharjee, N.; Horowitz, L.F.; Chang, T.C.; Folch, A. 3D-printed microfluidic automation. Lab Chip 2015, 15, 1934–1941. [Google Scholar] [CrossRef]
  8. Bhattacharjee, N.; Urrios, A.; Kang, S.; Folch, A. The upcoming 3D-printing revolution in microfluidics. Lab Chip 2016, 16, 1720–1742. [Google Scholar] [CrossRef]
  9. Nielsen, A.V.; Beauchamp, M.J.; Nordin, G.P.; Woolley, A.T. 3D Printed Microfluidics. Annu. Rev. Anal. Chem. 2020, 13, 45–65. [Google Scholar] [CrossRef]
  10. Au, A.K.; Huynh, W.; Horowitz, L.F.; Folch, A. 3D-Printed Microfluidics. Angew. Chem. Int. Ed. 2016, 55, 3862–3881. [Google Scholar] [CrossRef]
  11. Waheed, S.; Cabot, J.M.; Macdonald, N.P.; Lewis, T.; Guijt, R.M.; Paull, B.; Breadmore, M.C. 3D printed microfluidic devices: Enablers and barriers. Lab Chip 2016, 16, 1993–2013. [Google Scholar] [CrossRef] [PubMed]
  12. Su, R.; Wang, F.; McAlpine, M.C. 3D printed microfluidics: Advances in strategies, integration, and applications. Lab Chip 2023, 23, 1279–1299. [Google Scholar] [CrossRef] [PubMed]
  13. Monia Kabandana, G.K.; Zhang, T.; Chen, C. Emerging 3D printing technologies and methodologies for microfluidic development. Anal. Methods 2022, 14, 2885–2906. [Google Scholar] [CrossRef] [PubMed]
  14. Balakrishnan, H.K.; Badar, F.; Doeven, E.H.; Novak, J.I.; Merenda, A.; Dumée, L.F.; Loy, J.; Guijt, R.M. 3D Printing: An Alternative Microfabrication Approach with Unprecedented Opportunities in Design. Anal. Chem. 2021, 93, 350–366. [Google Scholar] [CrossRef]
  15. Ho, C.M.B.; Ng, S.H.; Li, K.H.H.; Yoon, Y.J. 3D printed microfluidics for biological applications. Lab Chip 2015, 15, 3627–3637. [Google Scholar] [CrossRef]
  16. Macdonald, N.P.; Cabot, J.M.; Smejkal, P.; Guijt, R.M.; Paull, B.; Breadmore, M.C. Comparing Microfluidic Performance of Three-Dimensional (3D) Printing Platforms. Anal. Chem. 2017, 89, 3858–3866. [Google Scholar] [CrossRef]
  17. Gonzalez, G.; Roppolo, I.; Pirri, C.F.; Chiappone, A. Current and emerging trends in polymeric 3D printed microfluidic devices. Addit. Manuf. 2022, 55, 102867. [Google Scholar] [CrossRef]
  18. Do, J.; Zhang, J.Y.; Klapperich, C.M. Maskless writing of microfluidics: Rapid prototyping of 3D microfluidics using scratch on a polymer substrate. Robot. Comput. Integr. Manuf. 2011, 27, 245–248. [Google Scholar] [CrossRef]
  19. Del Rosario, M.; Heil, H.S.; Mendes, A.; Saggiomo, V.; Henriques, R. The Field Guide to 3D Printing in Optical Microscopy for Life Sciences. Adv. Biol. 2022, 6, 2100994. [Google Scholar] [CrossRef]
  20. Dalili, A.; Samiei, E.; Hoorfar, M. A review of sorting, separation and isolation of cells and microbeads for biomedical applications: Microfluidic approaches. Analyst 2019, 144, 87–113. [Google Scholar] [CrossRef]
  21. Bayareh, M. An updated review on particle separation in passive microfluidic devices. Chem. Eng. Process. Process Intensif. 2020, 153, 107984. [Google Scholar] [CrossRef]
  22. Lee, W.; Kwon, D.; Choi, W.; Jung, G.Y.; Au, A.K.; Folch, A.; Jeon, S. 3D-Printed Microfluidic Device for the Detection of Pathogenic Bacteria Using Size-based Separation in Helical Channel with Trapezoid Cross-Section. Sci. Rep. 2015, 5, 7717. [Google Scholar] [CrossRef]
  23. Hahn, Y.K.; Hong, D.; Kang, J.H.; Choi, S. A Reconfigurable Microfluidics Platform for Microparticle Separation and Fluid Mixing. Micromachines 2016, 7, 139. [Google Scholar] [CrossRef] [PubMed]
  24. Razavi Bazaz, S.; Rouhi, O.; Raoufi, M.A.; Ejeian, F.; Asadnia, M.; Jin, D.; Ebrahimi Warkiani, M. 3D Printing of Inertial Microfluidic Devices. Sci. Rep. 2020, 10, 5929. [Google Scholar] [CrossRef] [PubMed]
  25. Russom, A.; Gupta, A.K.; Nagrath, S.; Di Carlo, D.; Edd, J.F.; Toner, M. Differential inertial focusing of particles in curved low-aspect-ratio microchannels. New J. Phys. 2009, 11, 75025. [Google Scholar] [CrossRef] [PubMed]
  26. Kuntaegowdanahalli, S.S.; Bhagat, A.A.S.; Kumar, G.; Papautsky, I. Inertial microfluidics for continuous particle separation in spiral microchannels. Lab Chip 2009, 9, 2973–2980. [Google Scholar] [CrossRef] [PubMed]
  27. Johnston, I.D.; McDonnell, M.B.; Tan, C.K.L.; McCluskey, D.K.; Davies, M.J.; Tracey, M.C. Dean flow focusing and separation of small microspheres within a narrow size range. Microfluid. Nanofluid 2014, 17, 509–518. [Google Scholar] [CrossRef]
  28. Nivedita, N.; Papautsky, I. Continuous separation of blood cells in spiral microfluidic devices. Biomicrofluidics 2013, 7, 054101. [Google Scholar] [CrossRef]
  29. Zhang, J.; Yan, S.; Yuan, D.; Alici, G.; Nguyen, N.-T.; Ebrahimi Warkiani, M.; Li, W. Fundamentals and applications of inertial microfluidics: A review. Lab Chip 2016, 16, 10–34. [Google Scholar] [CrossRef]
  30. Di Carlo, D.; Irimia, D.; Tompkins, R.G.; Toner, M. Continuous inertial focusing, ordering, and separation of particles in microchannels. Proc. Natl. Acad. Sci. USA 2007, 104, 18892–18897. [Google Scholar] [CrossRef]
  31. Dutz, S.; Hayden, M.E.; Schaap, A.; Stoeber, B.; Hafeli, U.O. A microfluidic spiral for size-dependent fractionation of magnetic microspheres. J. Magn. Magn. Mater. 2012, 324, 3791–3798. [Google Scholar] [CrossRef]
  32. Di Carlo, D. Inertial microfluidics. Lab Chip 2009, 9, 3038–3046. [Google Scholar] [CrossRef] [PubMed]
  33. Bhagat, A.A.S.; Kuntaegowdanahalli, S.S.; Papautsky, I. Inertial microfluidics for continuous particle filtration and extraction. Microfluid. Nanofluid. 2009, 7, 217–226. [Google Scholar] [CrossRef]
  34. Gao, H.; Zhou, J.; Naderi, M.M.; Peng, Z.; Papautsky, I. Evolution of focused streams for viscoelastic flow in spiral microchannels. Microsyst. Nanoeng. 2023, 9, 73. [Google Scholar] [CrossRef]
  35. Martel, J.M.; Toner, M. Particle Focusing in Curved Microfluidic Channels. Sci. Rep. 2013, 3, 3340. [Google Scholar] [CrossRef]
  36. Tuchscherr, L.; Heitmann, V.; Hussain, M.; Viemann, D.; Roth, J.; von Eiff, C.; Peters, G.; Becker, K.; Loffler, B. Staphylococcus aureus Small-Colony Variants Are Adapted Phenotypes for Intracellular Persistence. J. Infect. Dis. 2010, 202, 1031–1040. [Google Scholar] [CrossRef]
  37. Gong, H.; Beauchamp, M.; Perry, S.; Woolley, A.T.; Nordin, G.P. Optical approach to resin formulation for 3D printed microfluidics. RSC Adv. 2015, 5, 106621–106632. [Google Scholar] [CrossRef]
  38. Takenaga, S.; Schneider, B.; Erbay, E.; Biselli, M.; Schnitzler, T.; Schöning, M.J.; Wagner, T. Fabrication of biocompatible lab-on-chip devices for biomedical applications by means of a 3D-printing process. Phys. Status Solidi (A) 2015, 212, 1347–1352. [Google Scholar] [CrossRef]
  39. Chia, H.N.; Wu, B.M. Recent advances in 3D printing of biomaterials. J. Biol. Eng. 2015, 9, 4. [Google Scholar] [CrossRef]
  40. Cai, G.Z.; Xue, L.; Zhang, H.L.; Lin, J.H. A Review on Micromixers. Micromachines 2017, 8, 27. [Google Scholar] [CrossRef]
  41. Bayareh, M.; Ashani, M.N.; Usefian, A. Active and passive micromixers: A comprehensive review. Chem. Eng. Process. Process Intensif. 2020, 147, 107771. [Google Scholar] [CrossRef]
  42. Shallan, A.I.; Smejkal, P.; Corban, M.; Guijt, R.M.; Breadmore, M.C. Cost-Effective Three-Dimensional Printing of Visibly Transparent Microchips within Minutes. Anal. Chem. 2014, 86, 3124–3130. [Google Scholar] [CrossRef] [PubMed]
  43. Bhagat, A.A.S.; Hou, H.W.; Li, L.D.; Lim, C.T.; Han, J. Pinched flow coupled shear-modulated inertial microfluidics for high-throughput rare blood cell separation. Lab Chip 2011, 11, 1870–1878. [Google Scholar] [CrossRef] [PubMed]
  44. Ebnesajjad, S. Chapter 12—Adhesion Promoters. In Surface Treatment of Materials for Adhesive Bonding, 2nd ed.; Ebnesajjad, S., Ed.; William Andrew Publishing: Oxford, UK, 2014; pp. 301–329. [Google Scholar]
Figure 1. Design and image of a test pattern, where a 50 µm wide channel opens in a 45-degree angle into a 150 µm wide channel. (a) Drawing of the entire chip design. The red box marks the area enlarged on the right side, with top view of the channel geometry. (b) Bright field image of the realized test pattern. The open channels are marked with arrows next to the image (right side and bottom). The dark black lines are shadows originating from the side walls of the deeper channels. The pixel structure of the LED matrix is clearly visible, including the typical 45-degree angle, resulting from the orientation of the printing platform to the LED matrix. The pixel matrix causes a tiled surface structure, both on the channel bottom and on adjacent surfaces. This is caused by the uneven UV radiation of the pixels. There are gaps between the individual pixels without UV radiation. The flexible resin FLFLGR02 is used as material.
Micro 03 00047 g001
Figure 2. Bonding and connecting microfluidic channels in a Y-junction chip. (a) Picture of the 3D-printed chip with top view on the open channel structures with the Y junction. (b) Picture of the 3D-printed chip from the back side. The channel structure from (a) is now facing downwards. All 3 ports from the Y-junction are connected via plugin connections with capillaries. The tight fluidic connection of capillaries and chip is achieved by means of a press fit. The hole has a diameter of 1.65 mm, while the capillary is 1.68 mm thick. The elastic material allows the insertion of the stiffer capillary. (c) Picture of the mechanically bonded chip mounted on a microscope slide in a standard microscope mounting frame (for observation in an inverted microscope). (Technical drawings with detailed dimensions are provided in Supplementary Figure S1.)
Micro 03 00047 g002
Figure 3. Design and application of a mixer. (a) Working principle, (b) design of the whole mixer, (c) enlarged section from (b) with the recombination of the channels noted below, and (d) image of a 3D multiplication mixer. Channel diameter is 1.00–1.50 mm, including 8 mixing units. The entire chip is 50 mm × 28 mm × 7.6 mm (width × depth × height). (e) Mixing of biological cells with two inlets: eukaryotic THP-1 monocytes are shown in cyan (Hoechst 33342) and S. aureus bacteria are shown in green (GFP) and the mixed output. A technical drawing of the mixer is shown in Supplementary Figure S2 and further zoom-in images in Supplementary Figure S3.
Micro 03 00047 g003aMicro 03 00047 g003b
Figure 4. Live–dead staining of cells before and after passage through the mixer. THP-1 cell nuclei are stained with Hoechst 33342 (cyan fluorescence) and PI (red fluorescence, visible when it binds to DNA after entering a dead cell). Therefore, living THP-1 cells appear cyan, while dead cells appear red. In the output channel, also GFP-labeled bacteria are visible in green. Dead bacteria would also be stained red; however, no red bacteria are detected, indicating maximal bacterial viability. It is noted that in panel (b) less cells are shown, thus, the single dead (red) cell in panel (a) might not be in the field of view. However, in analysis of larger areas, for both input and output channels, overall viability is found to be 92% in both cases.
Micro 03 00047 g004
Figure 5. Design and image of Dean’s flow helix. (a) Sketches of the 3D-printed floating bearing (diameter 30 mm), (b) the cover, (c) image of the final assembled Dean’s flow helix. A 1/16″-cappilary is coiled around the floating bearing (depicted in (a)) and is held by a cover (depicted in (b)). The helix is attached to a breadboard by means of two snap fits.
Micro 03 00047 g005
Figure 6. (a) Design of the chip used at the outlet of the Dean’s helix to visualize particle separation (connection of capillaries from the back is shown in Figure 2b). The particle stream is coming from the inlet on the right and separating to the two outlets on the left. The red square marks the area depicted in part b. (b) The greyscale image represents the accumulated traces of the particles during the 97 s of measurement (∑ (0 < tn < 97s)Ies(x,y,tn)) at the Y-junction (indicated by the dotted line). The traces are detected by fluorescence from the particles. The stream of 11.95 µm particles is focused in the upper part of the channel and is directed completely into channel 1 on the left side. (c) A graph of the accumulated flow (AF) for the two channels over time, which is a measure of the number of particles passing through each channel. The signal in channel 1 is steadily increasing, whereas the signal in channel 2 is virtually constant. This confirms the steady separation of the particles (details on the definition of Ies and AF are given in Section 2).
Micro 03 00047 g006
Figure 7. (a) Fluorescence image of a stream of Hoechst33342-labeled THP-1 cells separating into channel 1 after passage through the Dean helix. The bright lines within the chip highlight the flow traces of the THP-1 cells, which almost exclusively separate into the top channel. It was noted that, due to the high flow rate together with a relative low fluorescence signal, longer acquisition times had to be chosen on the fluorescence microscope. Thus, it was not possible to visualize single particles in the fluidic flow, but rather the added sum from all fluorescent particles flowing through the chip during the integration time of the sensor during the image recording, which resulted in the bright lines. (b) No reduced viability of THP-1 cells after passage through the helix and the separation chip was detected, as indicated by staining the outlet sample additionally with PI (red fluorescence), while nuclei of living THP-1 cells are shown in cyan (total cell viability in 7 FOV about 92%).
Micro 03 00047 g007
Table 1. Summary of calculated and observed results for the Dean flow separation experiment with small (Ø 1.95 µm) and large (Ø 11.95 µm) nanoparticles at three different flow rates.
Flow rate in µL/min50100200
Flow velocity in m/s0.0170.0340.068
Reynolds number4.28.516.9
Deans number (Equation (1))0.390.771.54
Particle Reynolds number (Ø 1.95 µm)0.00030.00050.0010
Particle Reynolds number (Ø 11.95 µm)0.00960.01930.0386
Focusing of large particles achievedNoNoYes
Disclaimer/Publisher’s Note: The statements, opinions and data contained in all publications are solely those of the individual author(s) and contributor(s) and not of MDPI and/or the editor(s). MDPI and/or the editor(s) disclaim responsibility for any injury to people or property resulting from any ideas, methods, instructions or products referred to in the content.

