Abstract
Carbon-red mud foam/paraffin hybrid materials were prepared and studied for their thermal energy storage and electromagnetic interference (EMI) shielding properties. The host matrices were prepared utilizing the polymeric foam replication method, with a polyurethane sponge as a template, resin as a carbon source, and red mud as a filler. The paraffins, n-octadecane (OD) and the commercial RT18HC, were used as organic encapsulant phase change materials (PCMs) into the open pore structure of the foams. The foams’ morphological and structural study revealed a highly porous structure (bulk density, apparent porosity P > 65%), which exhibits elliptical and spherical pores, sized from 50 up to 500 μm, and cell walls composed of partially graphitized carbon and various oxide phases. The hybrid foams showed a remarkable encapsulation efficiency as shape stabilizers for paraffins: 48.8% (OD), 37.8% (RT18HC), while their melting enthalpies (ΔHm) were found to be 126.9 J/g and 115.5 J/g, respectively. The investigated hybrids showed efficient electromagnetic shielding performance in frequency range of 3.5–9.0 GHz reaching the entry-level value of ~20 dB required for commercial applications, when filled with PCMs. Their excellent thermal and EMI shielding performance places the as-prepared samples as promising candidates for use in thermal management and EMI shielding of electronic devices as well.
1. Introduction
The phase change materials (PCMs) have attracted increasing attention over the last decades as the most important factor for the development of Latent Heat Thermal Energy Storage Systems (LHTESS) [1,2]. PCMs are actually substances with high latent heat, capable of storing and releasing large amounts of energy at a certain temperature. These materials are exhibiting great potential in various technological applications such as in textiles [3], electronics [4], and in the building sector [5], where high latent heat is needed.
Currently, one of the main challenges in the construction industry is the buildings’ reduction of cooling and heating requirements, especially when considering the climate change. PCMs could enhance buildings’ thermal performance when introduced into building components (e.g., impregnating concrete, gypsum, ceramic masonry [6]). Their incorporation into these materials could prevent rapid changes on the indoor temperature, reducing the losses of large amounts of energy, throughout the reduction of heating and/or cooling demands, while maintaining the same comfort level.
Generally, PCMs used in building construction components can be organic and inorganic materials, as well as eutectics [7,8,9,10,11,12]. The organic PCMs are mainly paraffins and fatty acids, whereas the inorganic ones are usually salt hydrates. The eutectics are mixtures of two or more organic and/or inorganic PCMs, whose melting temperature covers some specific applications [13]. Among these materials, organic PCMs have several assets when compared to the other ones (inorganic, eutectics), such as the absence of subcooling effects, non-toxic nature, great stability upon cycling, and transformation without phase separation [14,15,16]. However, it should be noted that paraffins are quite flammable and exhibit low thermal conductivity, which combined with high volume variation during the phase transition and high leakage in the melting state could cause serious failures when utilized in thermal systems [17]. The most expedient method to prevent paraffin leakage during solid–liquid phase transition, and to reduce down the corrosion level of structural materials, is the use of a shape stabilizer (ss) supporting matrix, which encapsulates the PCM that allows it to sustain its molten form stationary at elevated temperatures [7,18].
One promising route to enhance the thermal conductivity of the final hybrid product (building component + PCM + ss) is the dispersion of high thermal conductivity additives into the PCM, such as (i) expanded graphite, (ii) carbon nanotubes (CNTs) or nanofibers, (iii) metal, and (iv) ceramic nanoparticles [19,20,21,22]. One other way to achieve the desirable reinforcement of the hybrids is to select a highly conductive ss matrix, such as metal foams and/or ceramic porous/foam structures [23,24,25]. In order to find an ideal combination of materials, a large number of porous matrices have been investigated so far as thermally conductive as candidates for PCMs, including activated carbons and other carbon-based porous nanomaterials, zeolites, silicate mesoporous materials, porous/foams ceramics, polymers, metal-organic frameworks, metallic foams, and other various types of composites, i.e., the supporting materials are more than one [24,26,27,28].
Carbon-based porous materials are considered as shape stabilizers for PCMs, due to their higher thermal conductivities (up to 2.1 W/(m·K)) [29] when compared to the polymers (<0.05 W/(m·K) or ceramic analogues (~0.1 W/(m·K). On the other hand, even though the metal foams exhibit high thermal conductivities (>10 W/(m·K), [30] they must possess an optimal porosity, depending on the PCMs thermal and geometrical specifications, in order to favor efficient heat transfer. Thus, a large number of research studies have reported the development of carbon-based foams, aerogels, or graphene PCMs-composites, synthesized by using biomass, polysaccharides, and synthetic polymers as raw materials and templates [31,32,33,34,35,36].
Additionally, lightweight carbon foams have also been considered as the most promising candidates for providing excellent electromagnetic interference (EMI) shielding properties, since they possess a three-dimensional (3D) network structure that enhances the multiple reflections of incident electromagnetic waves and improves the microwave absorption [37,38,39]. Generally, metals show good shielding performance, but their composites suffer from several drawbacks, including high densities, high reflection, easy corrosion, and processing difficulties. However carbon-based foams have many other advantages such as low density, good stability, resistivity against chemical corrosion, operational thermal conductivity, high porosity, and the ability to suppress EMI from electronic devices and reduce the risk of electromagnetic fields (EMFs) exposure of people in their houses and workplaces [37,39,40,41].
So far, some studies reported the fabrication of carbon foams utilizing recycled industrial wastes [41,42]. For instance, carbon foam hybrids were synthesized as lightweight EMI shielding materials, using as raw materials a mixture of dried Red Mud (RM), which is a solid containing metallic oxide impurities that is a waste product of bauxite refinement [41]. The prepared hybrid foam showed excellent EMI SE in the 8.2–12.4 GHz region (51.4 dB at 8.2 GHz) and excellent fire-resistant performance, due to the thermal insulating nature of metal oxides present in red mud. In another study, phenolic foam composites reinforced with red mud microparticles were prepared using a thermal foaming method [43]. The composite foams reinforced with 15 wt% of modified red mud microparticles showed improvement on their tensile and impact strength by ~82%, along with enhancement of their flame retardant properties. However, it should be noted that none of these studies investigated carbon foams incorporating organic PCMs, and hence did not evaluate the electromagnetic interference shielding effectiveness of these materials in conjunction with their capability for efficient thermal management, including shape stabilization, heat absorption, and thermal conductivity.
In this present work, hybrids derived of shape-stabilized organic PCMs into carbon-red mud hybrids were fabricated and studied for the first time, concerning their thermal and EMI shielding properties. It should be noted that as shape stabilizers, carbon foams were prepared according to already published research works [40,41]. However, our pioneer hybrids, which incorporated organic PCMs into the carbon foam matrices, presented multifunctional properties such as: shape-stabilization of PCMs, latent heat thermal energy storage, good mechanical behavior, light weight, and EMI shielding properties. All these properties mentioned before are of high importance in construction section, where the building components (i.e., gypsum or cement boards) should possess enhanced thermal energy storage and EMI shielding efficiency.
2. Materials and Methods
2.1. Preparation of Carbon-Red Mud Foams (CRMFoams)
Carbon red mud foams (CRMFoams) were synthesized based on experimental routes found in published research [40,41] with some modifications, using commercially available polyurethane (PU) foams (Scotch-Brite™ 2-In-1 Sponge the yellow part). Initially, a liquid phenolic resin black (C8H6O2) by “MATHIOS refractories S.A.” and an acetone (C3H6O) mixture was fabricated (C8H6O2:C3H6O = 50:50 ratio), which was stirred for 1 h. Subsequently, a second mixture consisting of RM (thermophysical properties are given in [44]) and acetone was prepared and placed into a sonication bath for 1 h to achieve more efficient dispersion of the RM (Ultrasonic cleaner WUC-A 1, 2–22). It should be noted that prior to the dispersion procedure, the RM was pulverized in a planetary mill (Fritsch Planetary mill, Pulverisette 5 05.6020.00) for five hours, resulting in a thin powder. Afterwards, the thin powder was passed through a 70 μm mesh sieve to retain the large agglomerates. After the dispersion, the thin RM powder was added to the initial phenolic resin mixture (C8H6O2:RM = 5 or 2.5) and stirred for 1 h under continuous magnetic stirring. The resulted polyurethane foam pieces were cut in cylindrical shapes (d = 3 cm, h = 2 cm) and dipped into the homogenous slurry. Then, the impregnated pieces were dried at 80 °C for 24 h, followed by 10 h curing at 220 °C in an air atmosphere, while the carbonization took place in the presence of an inert atmosphere up to 1100 °C for 1 h (hereafter named CRMFoam-x, where x = 5 and 2.5 the ratio C8H6O2:RM).
2.2. Preparation of Hybrid Foams, ss-CRMFoam@PCMs
Prior to the infiltration process, the CRMFoams were dried at 150 °C for at least two hours to remove any remaining water. Then, the CRMFoams were dipped into melted paraffins (pure paraffin wax—industrial RT18HC of Rubitherm Technologies and n-octadecane (OD) of Sigma Aldrich (thermophysical properties are presented in Table 1), heated until 90 °C) for almost five minutes in order to stop the bubbles’ extraction from the porous medium (hereafter named ss-CRMFoam-x@OD and ss-CRMFoam-x@RT18, where x = 5 and 2.5 is the ratio C8H6O2:RM). After the removal of the foams from the melted paraffins, the samples were placed onto filter papers to release the excess paraffin that was not supported from the foam’s pores or from the foam’s surface. The successful encapsulation of the paraffins into the foams was tested by weighting the samples prior to and after the experimental procedure. Additionally, the possible release of the paraffin from the ss-CRMFoams@PCMs was examined via leaching tests, according to published standards [45].

Table 1.
Thermophysical properties of the organic paraffins.
2.3. Leaching Tests
Leaching tests were performed to examine the ability of the foams to entrap the paraffin. First, the weight of the ss-CRMFoams@PCMs was measured, and then they were placed onto filter papers at 30 °C for 8 h and afterwards sequentially at 80 °C for 72 h. Afterwards, the weight was measured once more in both cases.
2.4. Porosity and Density Measurements
Porosity and density measurements were performed using Archimedes’ immersion method according to the ASTM C20–00 standard [48]. The determination procedure of the apparent porosity, water absorption, apparent specific gravity, and bulk density of the CRMFoams involved: (a) the drying of the specimens to constant weight and the determination of their dry weight (D), (b) the immersion of the specimen into distilled water and its boiling for two hours, followed by cooling to room temperature, (c) determination of the weight, S, of each test specimen after boiling and while suspended in water, (d) Determination of the saturated weight, W (after determination the suspended weight, all drops of water from the surfaces were removed by means of a cotton cloth). Then, the calculation of Exterior Volume (V), Apparent Porosity (P), Water Absorption (A), Apparent Specific Gravity (T) and Bulk Density (B) of the specimens, was obtained by the following equations:
V (cm3) = W − S
P(%) = [(W − D)/V]/100
A(%) = [(W − D)/D]/100
T = D/D − S
B(cm3) = D/V
2.5. X-ray Diffraction Measurements
The X-ray powder diffraction patterns of the materials were collected on a D8 Advance Bruker diffractometer using Cu Ka (40 kV, 40 mA, λ = 1.541 78 Å) radiation and a secondary beam graphite monochromator (measurement conditions: 2θ = 10–70 degrees, in steps of 0.02 degrees and 2 s counting time per step).
2.6. Vibrational Spectroscopy
Raman spectra were recorded with a micro-Raman system RM 1000 Renishaw using a laser excitation line at 532 nm (Nd-YAG) in the range of 500–2000 cm−1. Laser power ~10 mW was used with 2 μm focus spot.
Infrared (FT-IR) spectroscopy was performed on powdered samples dispersed in KBr pellets with a JASCO FT/IR-6000, Fourier transform spectrometer. The spectra were obtained as the average of 32 scans at 4 cm−1 resolution and were measured in the wavenumber range of 400–4000 cm−1.
2.7. Thermogravimetric Analysis (TGA)
TGA measurements were performed using a Setsys Evolution-Setaram TG-DTA analyzer. The experimental procedure involved the introduction of approximately 30 mg of the sample in a platinum crucible, setting the heating and gas (N2) flow rates, and then performing the test. For all experiments, heating and N2 flow rates were kept constant at 5 °C min−1 and 25 mL min−1, respectively, in the temperature range from ambient to 700 °C.
2.8. Scanning Electron Microscopy (SEM)
SEM was utilized to observe the morphology of the CRMFoams. Images were taken with a JEOL JSM-5600 system, which is equipped with an energy dispersive spectrometry (EDS) by Oxford Instruments company. The sample was gold sputtered prior to the measurements, to achieve easier high-resolution imaging.
2.9. Thermal Properties
The thermal properties of the fabricated samples were measured by Differential Scanning Calorimeter (DSC) at a heating rate of 10 °K/min under N2 atmosphere. In addition, the thermal conductivity λ of the CRMFoams was determined on a thermal conductivity analyzer (TCi Thermal Conductivity Analyzer, C-Therm Technologies), according to ASTM D7984-16 [49], using the Modified Transient Plane Source technique. Cylindrical samples with nominal diameters of 40 mm (thickness) and height of ~30 mm were tested, and the final value of λ was calculated using the average of 10 individual measurements.
2.10. Mechanical Properties
The mechanical properties were evaluated by measuring the compressive deformation behavior of foams, by means of a universal testing machine Shimadzu Autograph AG 25 TA, 0.5 mm/min displacement; the results are the average of measurements made on, at least, 5 specimens.
2.11. Electromagnetic Interference (EMI) Shielding Properties
The EMI shielding effectiveness properties were evaluated using a P9372A Keysight Streamline Vector Network Analyzer (Keysight, Santa Rosa, CA, USA) and two sets of microwave standard 15 dB gain waveguides (WR 187 and WR 147, respectively, obtained from Advanced Technical Materials Inc. (ATM), Patchogue, NY, USA) covering a broad C frequency band in the range of 3.5–9.0 GHz, which is typical for wireless communications, such as satellite communications, Wi-Fi devices, cordless telephones, weather radar systems, etc. In particular, every sample was placed in the middle of each set of waveguides, and its scattering parameters (S-parameters; S11, S12, S22, S21) were recorded.
3. Results and Discussion
3.1. Characterization and Properties of CRMFoams
3.1.1. Optical and SEM Images
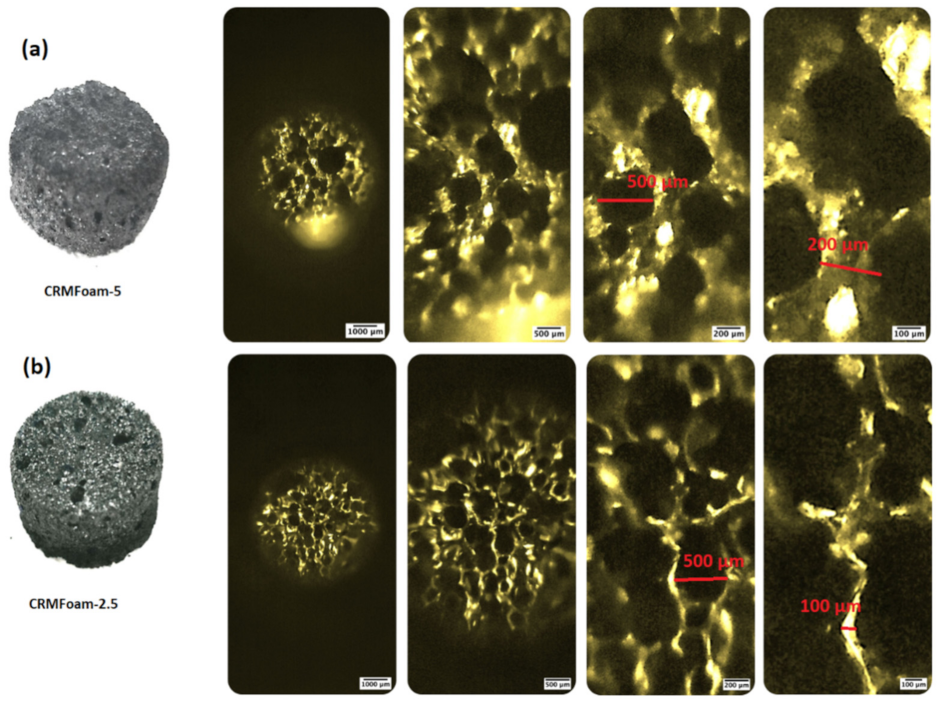
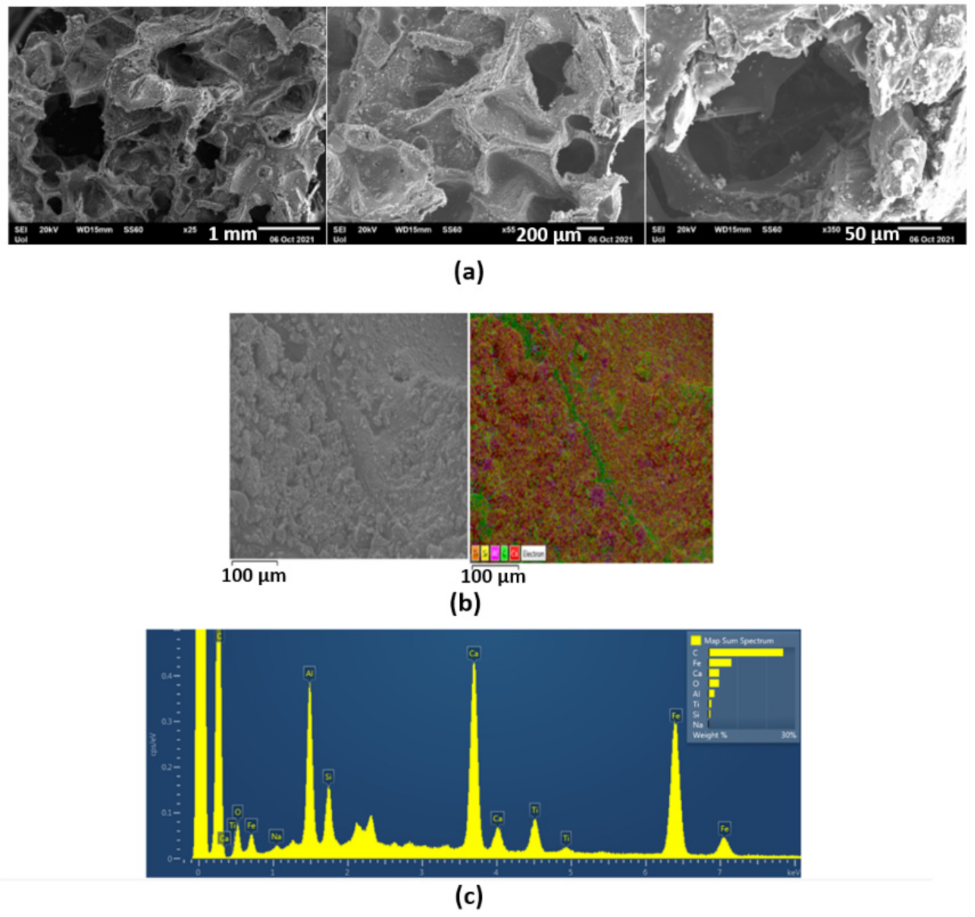
Figure 1a,b shows the optical images of CRMFoam-5 and CRMFoam-2.5 at different magnifications. The images of both carbon foams reveal highly porous bodies with more or less elliptical and spherical pores with sizes ranging from 50 up to 500 μm. It should be noted that the CRMFoam-25 sample, showed smaller wall thickness than that of CRMFoam-5 sample. A possible reason for this last fact is the higher employed temperature for the pyrolysis of CRMFoam-2.5 sample (1100 °C) than that for CRMFoam-5 (1000 °C) sample, which favors greater sintering of red-mud constituted oxides. The SEM images of the same carbon foams are depicted in Figure 2 as well the elemental color mapping at the microstructural level using EDS analysis. As shown in this figure, the carbon foams exhibit submicro-sized porous and a dense wall structure on which the various elements of red-mud are uniformly dispersed.

Figure 1.
Optical images of CRMFoam-5 (a) and CRMFoam-2.5 (b) samples at different magnifications.
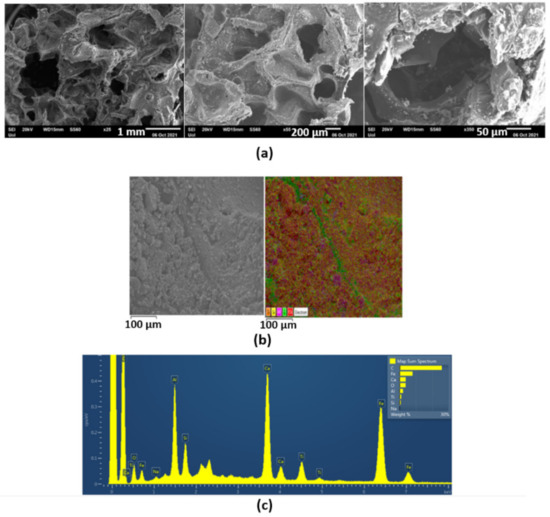
Figure 2.
SEM images of CRMFoam-2.5 sample at different magnifications (a). Elemental color mapping at the microstructural level (b) and EDS spectrum (c) showing the distribution of elements and the composition of the foam.
3.1.2. X-ray Diffraction Patterns and Raman Spectra
The carbon foams CRMFoam-5 and CRMFoam-2.5 were prepared using red mud as raw material, that was collected from the alumina refining plant Aluminium of Greece MYTILINEOS. Red mud is the main filtered bauxite residue (BR known as ferroalumina), generated during the extraction of alumina from bauxite ore using Bayer process. Chemical analysis of the Greek filtered bauxite residue revealed the following composition for the solid content of BR: 43.59 wt% Fe2O3, 22.78 wt% Al2O3, 8.44 wt% CaO, 6.35 wt% SiO2, 5.88 wt% TiO2, 1.93 wt% Na2O, 0.56 wt% MgO (LOI 9.30 wt%) [50].
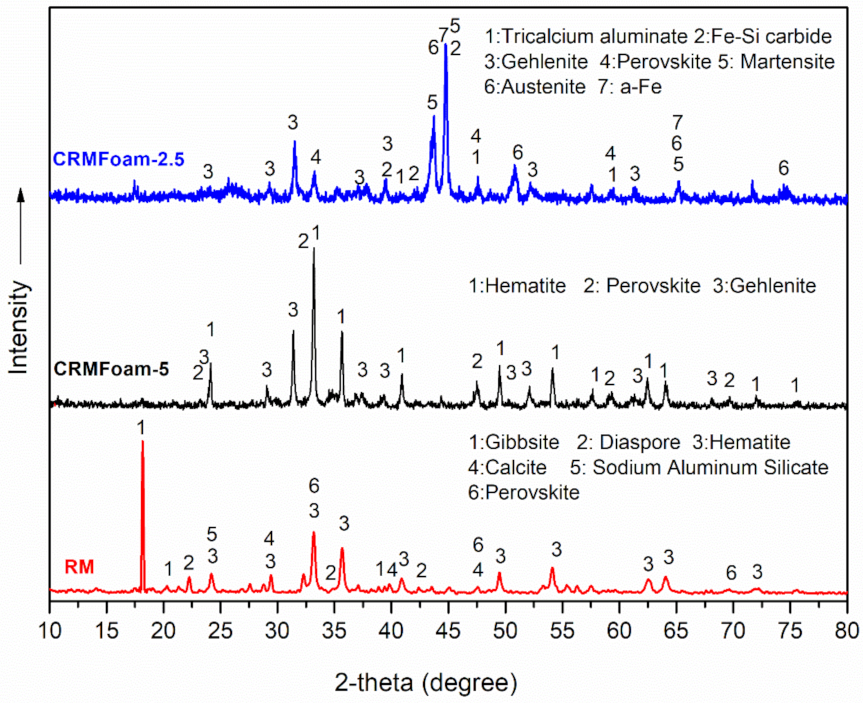
The XRD patterns of the red mud and the CRMFoams, CRMFoam-2.5 (40 wt% in RM), and CRMFoam-5 (20 wt% in RM) are presented in Figure 3. The pattern of RM exhibits a number of sharp diffractions peaks, which can be attributed to crystalline phases of hematite (Fe2O3- main peaks at 32.2°, 35.7°, JCPD file no.: 33-0664), gibbsite (Al(OH)3- main peak at 18.2°, JCPD file no.: 70-2038), diaspore (α-AlO(OH)- main peak at 22.3°, JCPD file no.: 79-178138), calcite (CaCO3- main peak at 29.4°, JCPD file no.: 83-0577), sodium aluminum silicate (NaAlSiO4- main peak at 24.1°, JCPD file no.: 02-0339), perovskite (CaTiO3- main peaks at 33.0°, 47.2°, JCPD file no.: 82-0239).
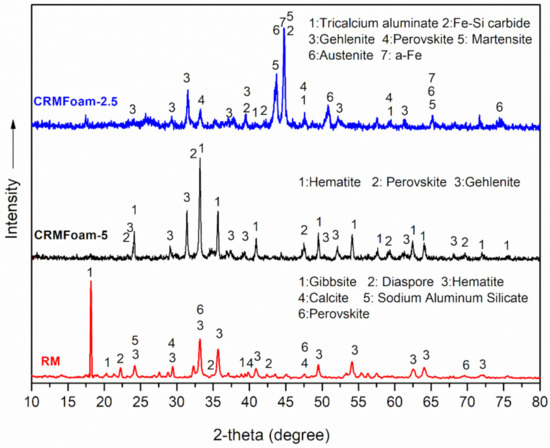
Figure 3.
X-ray patterns of red mud (RM) and the CRMFoams, CRMFoam-2.5 (40 wt% in RM) and CRMFoam-5 (20 wt% in RM). No.: 44-1292, austenite (C,Fe-JCPD file no.: 23-0298) and alpha-Fe (Fe, JCPD files no.98-0064). In addition, the phases of gehlenite (Ca2Al[AlSiO7]—main peak at 31.4°, JCPD file no.: 79-2421), iron silicon carbide (C0.17 Fe0.81 Si0.02)—main peak at 39.5°, 44.7°, JCPD file no.: 19-20628), tricalcium aluminate (Ca3Al2O6—main peak at 33.1°, 47.6°, JCPD file no.: 38-1429) and perovskite (CaTiO3—main peaks at 33.0°, 47.2°, JCPD file no.: 82-0239) are easily identified as well.
The pattern of carbon foam CRMFoam-5, is found to be a complex mixture of phases mainly comprised of hematite (Fe2O3-(main peaks at 32.2°, 35.7°, JCPD file no.: 33-0664), perovskite (CaTiO3- main peaks at 33.0°, 47.2°, JCPD file no.: 82-0239) and Gehlenite (Ca2Al[AlSiO7]- main peak at 31.4°, JCPD file no.: 79-2421). These phases are formed during thermal treatment at 1000 °C of the preform foams of polyurethane sponge, resin, and RM.
On the other hand, the pattern of carbon foam CRMFoam-2.5, prepared at 1100 °C, is mainly characterized by sharp and intense diffraction peaks at 2θ, 44.8°, 43.6° and 33.5° and several weaker peaks derived from the crystalline phase of martensite (C,Fe-JCPD file.
It is clear, from the comparison of X-ray patterns of CRMFoam-5 and CRMFoam-2.5 samples, that the difference in RM content and heating temperature, between the foams leading to the formation of different crystalline phases (i.e., tricalcium aluminate, martensite, austenite, a-Fe, Fe-Si carbide). Most of the above phases in the pattern of CRMFoam-2.5, constitute evidence of reduction of hematite by carbon. Ferrite (α-Fe) is the stable form of Fe at room temperature and may contain traces of C dissolved in interstitial sites of its BCC lattice (<0.022 wt%). Austenite (γ-Fe) is stable at temperatures higher than 727 °C and can dissolve carbon (<2.14 wt%) in interstitial sites of its FCC lattice. Its presence at room temperature can be attributed to rapid cooling that inhibited the transformation of austenite to ferrite. Even, air cooling can suppress the transformation of austenite to ferrite, under the high presence of alloying elements (as in the present case) that inhibit the diffusion of carbon from the austenite lattice to form ferrite and cementite. In the cases where austenite contained high contents of carbon (higher than ~0.4 wt%), rapid cooling led to its transformation to distorted α-Fe, namely martensite, a metastable form of Fe, supersaturated in carbon atoms [51].
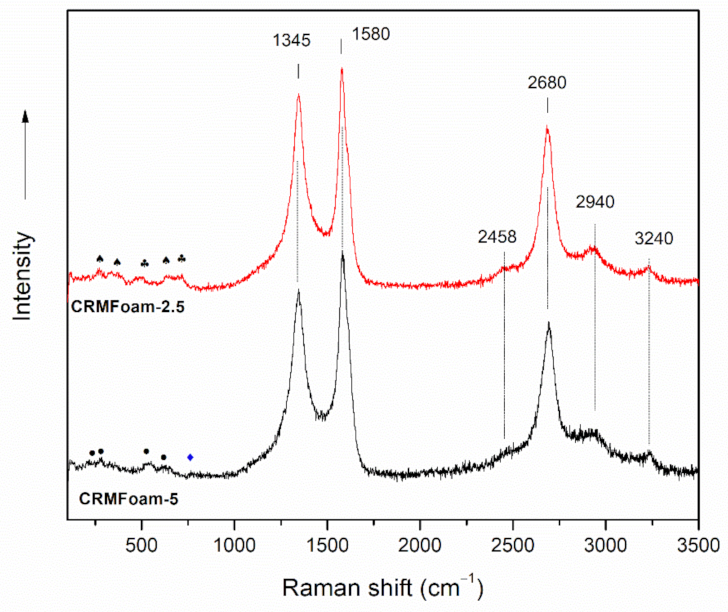
In order to investigate the graphitization degree of carbon foams, their Raman spectra were recorded and analyzed. Figure 4 shows the Raman spectra of CRMFoam-2.5 and CRMFoam-5 materials. Both samples showed similar spectral features, which can be mainly attributed to carbon vibrations. Specifically, the spectra of CRMFoams exhibit all the main Raman peaks corresponding to the graphitized carbon materials: (a) The graphite band (G-band), centered at ~1580 cm−1, which is due to the in-plane motion of sp2 carbon atoms in carbonaceous materials with high degree of symmetry and order (i.e., graphene, graphite, SWNTs) [52,53]. It is extremely sensitive to strain effects and is also a good indicator of the number of graphene layers. [54] (b) The defect activated band (D-band), centered at ~1345 cm−1, which is related to lattice motion away from the center of the Brillouin zone and is usually attributed to disordered carbon (sp3 hybridized carbon), exhibits high sensitivity to the disordered structures. (c) The second order D-band (2D), 2680 cm−1 (exhibits a strong frequency dependence on the excitation laser frequency), which is a second-order two-phonon process Raman signature of sp2 carbons. It is used for the determination of the number of graphene layers, although its behavior is more complex than the frequency shift observed for the G band. (d) The Raman band D + G, at about 2940 cm−1, which is associated with a D + G combination mode that it is also induced by disorder of carbon structure and the two weak bands at 2458 and 3240 cm−1, which are assigned to the combination D + D” and to the harmonic 2D’, respectively (D” corresponds to a phonon belonging to the in-plane longitudinal acoustic branch close to the K point) [52,53]. As it is also observed in Figure 2, the peak positions of the 2D and G bands, together with their intensity ratio (ID/IG ≈ 0.84), for both spectra are well correlated with partially graphitized carbon. In addition, the 2D band profile could provide an indication of the graphitic layers’ number [55]. The symmetric shape of the 2D band suggests the presence of graphitized nanosheets on the surface of CRMFoams. On the other hand, in the low frequency range of the spectra (200–800 cm−1), a number of weak bands are observed, which can be correlated with the vibrations of crystalline oxide and/or iron phases obtained upon pyrolysis of foam preforms, at high temperatures.
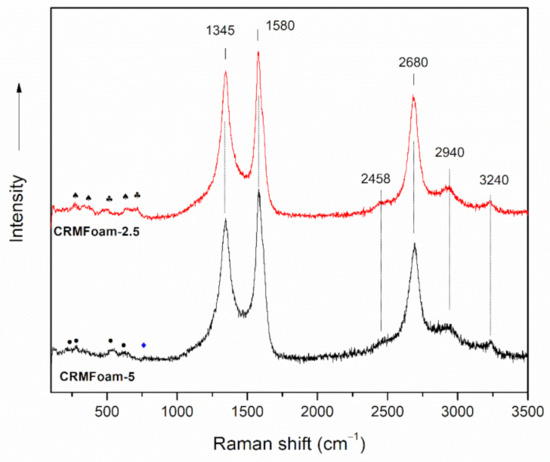
Figure 4.
Raman spectra of CRMFoam-2.5 and CRMFoam-5 samples. (•: hematite, ♦: perovskite, ♣: tricalcium aluminate ♠: FeO2).
3.1.3. Porosity and Thermal Properties
The experimental results of the density, porosity, water absorption, and thermal conductivity measured from the CRMFoams are presented in Table 2. In general, both foams showed low bulk density (B < 0.55 g/cm3) and high porosity (P > 65%) values. Their water absorption (A) was calculated at 179.2% for the CRMFoam-5 sample and 121.7% for CRMFoam-2.5, whereas the specific gravity (T) was 1.76 and 1.55, respectively. These differences can be explained by the fact that the initial resin/RM suspension used for the preparation of CRMFoam-2.5 was more viscous and concentrated due to the higher solid loading of RM (40 wt%) in comparison to that of CRMFoam-5 (20 wt%). Thermal conductivity experiments were carried out using two different pieces from each kind of sample (i.e., four pieces). Five independent measurements were performed to each piece, i.e., ten measurements to each kind of sample. Experimental data were treated using the IBM SPSS ver. 26 software, and the results are reported in Table 2. The equality of mean values was tested via the t-test method and no equality found for a confidence interval of 95%.
Table 2.
Properties of CRMFoams.
3.1.4. Mechanical Properties
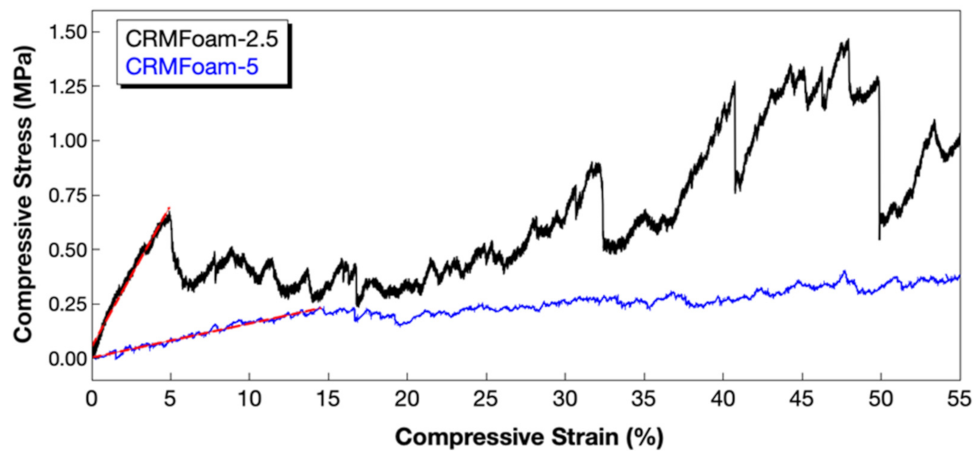
The mechanical performance of the fabricated carbon-red mud foams (CRMFoam-2.5 and CRMFoam-5) was assessed by performing compression strength tests according to ASTM C 1424–99 [56]. Stress-strain curves were plotted (Figure 5) to calculate the compressive strength of foams with different red mud contents (CRMFoam-2.5 contains 40 wt% and CRMFoam-5 contains 20 wt% of RM), and the results are shown in Table 2. It should be noted that both samples were tested at 55% compressive strain, and the compressive strength as well as the modulus of elasticity of all samples were calculated from the linear region (red dotted lines) of the profiles. For better understanding of the RM content-density–compressive strength relationship triangle, the values of foams’ bulk density along with their RM content and compressive strength are being quoted in Table 2.
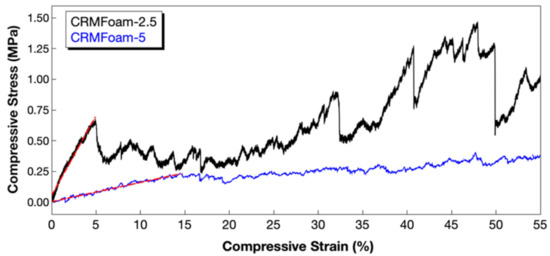
Figure 5.
Representative compressive stress-strain curves of CRMFoam-2.5 and CRMFoam-5.
The CRMFoam-2.5 sample exhibited the best compressive strength with 0.66 MPa, whereas CRMFoam-5 sample showed compressive strength of 0.22 MPa. Regarding the behavior of the elastic modulus, it can be observed that the sample with less apparent porosity (CRMFoam-2.5, 65.2%), exhibited higher value of modulus (12.9 MPa), whereas the CRMFoam-5 (75.1% porosity) a value of 1.56 MPa, confirming the literature reports regarding the relationship between porosity and elastic modulus for ceramic foam materials [57]. Generally, the compressive performance of foam materials varies on several factors such as density, microstructure, and reinforcing agents. The RM presents higher density than the other constituents of the hybrid foams, and therefore by increasing the RM content, the bulk density of the foams increased, leading to enhanced compressive strength of them, and more stiff structure.
3.2. Characterization and Properties of Hybrid Foams ss-CRMFoams@PCMs
3.2.1. Leaching Tests and Thermal Properties
Leaching tests were performed for the CRMFoam-2.5 according to the procedure explained previously. However, only the leaching test results from the CRMFoam-2.5 sample are presented representatively, since CRMFoam-5 showed similar behavior. Table 3 provides a clearer insight about the successful paraffin entrapment, especially after the leaching tests, where no significant quantity of paraffin onto the filter papers was observed. The weight increase constituted a first indication that both RT18HC and octadecane were encapsulated into the porous framework of the foams, while the slight weight loss after leaching tests confirmed the successful paraffin penetration, even at 80 °C, which is much higher than the melting point of both paraffins. Furthermore, the paraffin loading results were in good agreement with the TGA results, indicating that the CRMFoams were able to adsorb and retain large paraffin amounts. In fact, the TGA curves of ss-CRMFoam-2.5@OD and ss-CRMFoam-2.5@RT18 revealed the PCMs’ loading level of paraffins in the stabilizer matrix of CRMFoam-2.5 and how the encapsulation process affected their thermal stability. According to TGA curves of octadecane and RT18HC, these PCMs appeared a one-step thermal decomposition, with onset and endset decomposition temperatures in the range of 170–190 °C and 200–240 °C, due to the volatilizations of paraffins [58,59,60].
Table 3.
Summary of the CRMFoam-2.5 sample’s weight before and after leaching tests and PCM loading.
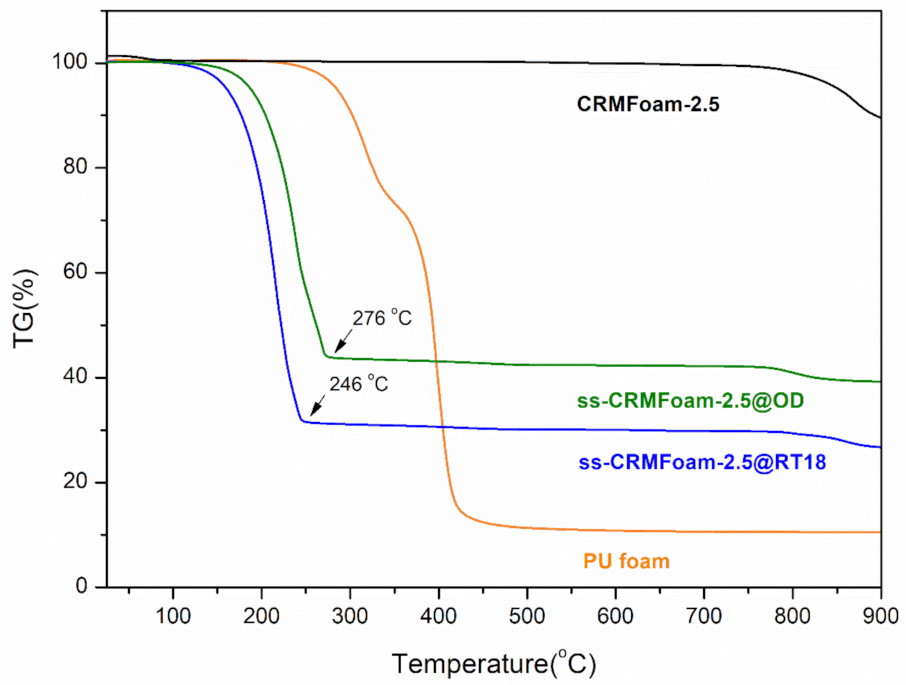
Based on these findings, Figure 6 presents the TGA thermograms for the PU template foam and the CRMFoam-2.5, before (CRMFoam-2.5) and after paraffin entrapment with organic PCMs, n-octadecane, and RT18HC (ss-CRMFoam-2.5@OD, ss-CRMFoam-2.5@RT18). As can be seen from the image, the TG curve of the commercial polyurethane foam showed a first thermal degradation at 343 °C and a second at 420 °C, where it lost almost all of its weight. The successful carbonization is obvious by the TG curve of the CRMFoam-2.5, in which no weight loss is present until 800 °C, pinpointing the excellent thermal stability of the sample. With paraffin incorporation, the temperature of the carbon foam rose compared to pure paraffins, to 276 °C for octadecane and 246 °C for RT18HC, respectively, indicating that strong connecting bonds to the matrix were accomplished. Additionally, the temperature shifts demonstrate that the paraffin was successfully encapsulated into the carbon foam’s pores in both samples and thermal stability was substantially improved.
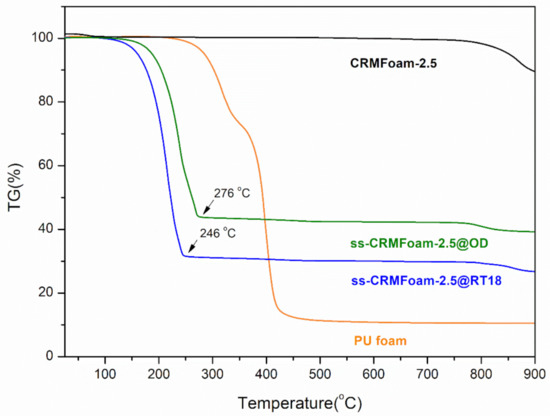
Figure 6.
Thermogravimetric analysis (TGA) curves of PU foam CRMFoam-2.5, and ss-CRMFoam-2.5@OD ss-CRMFoam-2.5@RT18 hybrids (OD: Octadecane, RT18: RT18HC).
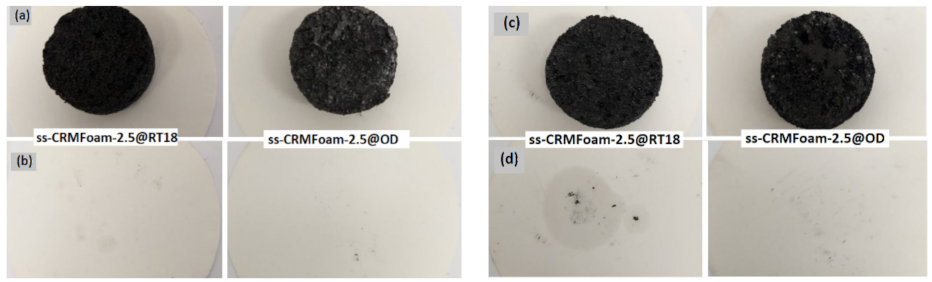
In Figure 7, the results of the leaching tests after 8 h at 30 °C and after 72 h at 80 °C are presented. For the first case (30 °C for 8 h) the ability of the pores to hold the PCMs during the melting process was examined. As seen from the image in Figure 7b, no oily marks are apparent onto the filter paper. For the second one (80 °C for 72 h), the ability of the pores to maintain the encapsulated PCMs in a temperature above the melting point of the paraffins was determined. The results in this case indicated that the sample immersed in octadecane showed no leakage onto the filter paper (Figure 7d-right), while a small quantity of RT18HC bleached from the porous matrix (Figure 7d-left). Against this background, the paraffin was effectively entrapped into the porous matrices, displaying an efficient material for thermal energy storage and EMI shielding applications.
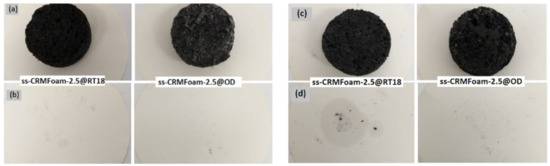
Figure 7.
Leaching tests of the produced hybrids. (a) ss-CRMFoam-2.5@PCMs before the remain at 30 °C for 8 h and (b) after the leaching test, (c) ss-CRMFoam-2.5@PCMs before the remain at 80 °C for 72 h and (d) after the leaching test (OD: Octadecane, RT18: RT18HC).
Figure 8 shows the mid-IR spectra of ss-CRMFoam@RT18, ss-CRMFoam@OD, and that of CRMFoam-2.5. The infrared spectrum of CRMFoam-2.5 exhibited several bands, which can be attributed to vibrations of metal-oxygen bonds of crystalline phases of gehlenite, tricalcium aluminate and CaTiO3 perovskite. Specifically, the absorption band at 560 cm−1 can be assigned to Ti–O stretching and the band at 435 cm−1 to the Ti-O-Ti bending vibrations, respectively [61,62]. Furthermore, absorption bands centered at 1017 cm−1, 975 cm−1 could be assigned to the asymmetric stretching vibrations of Si-O-Si and Si-O-Al groups of gehlenite (Ca2Al[AlSiO7]) [63]. The absorption peaks observed in the frequency range 920–800 cm−1 and below 500 cm−1 can be attributed to AlO4 tetrahedral and AlO6 octahedral groups of tricalcium aluminate (3CaO Al2O3 or C3A) [64,65]. On the other hand, the absorption maximum near 650 cm−1 could be assigned to oxidized iron carbide phases, whereas the broad absorption is around at 3450 cm−1 and the weak band at 1630 cm−1, due to vibrations of adsorbed water molecules on KBr or the sample.
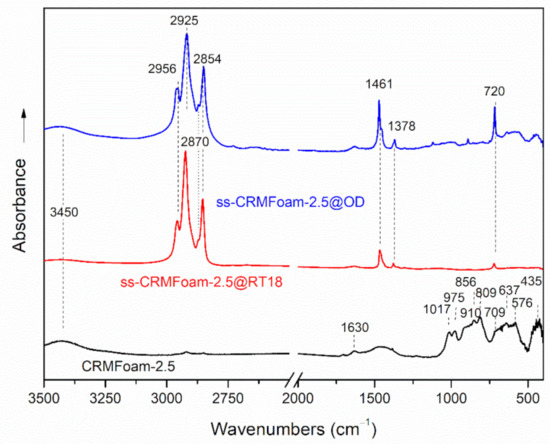
Figure 8.
FT-IR spectra of CRMFoam-2.5 and ss-CRMFoam-2.5@OD, ss-CRMFoam-2.5@RT18 hybrids.
The incorporation of PCMs into the open cell structure of CRMFoam-2.5 dramatically changed its infrared spectrum. More specifically, the spectra of ss-CRMFoam@RT18, ss-CRMFoam were dominated by the very strong C-H absorption bands of organic PCMs (octadecane and RTH18HC), which absorbs near 2900 cm−1, 1460 cm−1 and 720 cm−1. Peaks observed at 2957 cm−1 and at 2870 cm−1 were attributed to the asymmetric and symmetric stretching vibrations of methyl (CH3) functional groups, whereas these at 2926 cm−1 and 2851 cm−1 were attributed to the asymmetric and symmetric stretching vibrations of methylene (CH2) groups, respectively [66]. In addition, the absorption peak centered at 1471 cm−1 was attributed to the deformation vibration of methyl and methylene groups, and the peak at 720 cm−1 to rocking vibration of methylene groups as well. The absorption bands of CRMFoam-2.5 were not observed, since they are covered by the strong absorption peaks of PCMs. On the other hand, the non-existence of any features in the infrared spectra of ss-CRMFoam@RT18 and ss-CRMFoam@OD samples, indicated that PCMs are physically stable into the porous of the CRMFoams and no chemical bonds between PCMs and foam matrices were formed.
The phase transition properties of PCMs, n-octadecane, and RT18HC were studied using their DSC thermographs. Figure 9 shows the melting-freezing temperatures (Tm, Ts) and the corresponding enthalpies (ΔHm, ΔHs) for the two PCMs. As shown in that figure, the pure n-octadecane melts at 20.7 °C and freezes at 28.9 °C, while RTH18HC melts at 22.2 °C and freezes at 11.5 °C. Both the exothermic and endothermic peaks of two PCMs, were asymmetric, implying the existence of more than one crystalline phase. According to previous studies, the n-octadecane crystals consist of two crystalline phases α- and β, which exhibit very close melting temperatures overlapping each other [67]. The similar asymmetric appearance of DSC peaks of RT18HC, could be explained based on its structure, which seems according to the Rubitherm data sheet [68], to be composed of more than one hydrocarbon (the main phase should be the hexadecane, C16H34). The areas of exothermic (melting) and endothermic (solidification) transition peaks of DSC curves were used for the calculation of enthalpies of n-octadecane and RT18HC, which were found to be 261.2 J/g (ΔHm), −254.2 J/g (ΔHs) and 305.0 J/g (ΔHm), −298.0 J/g (ΔHs), respectively.
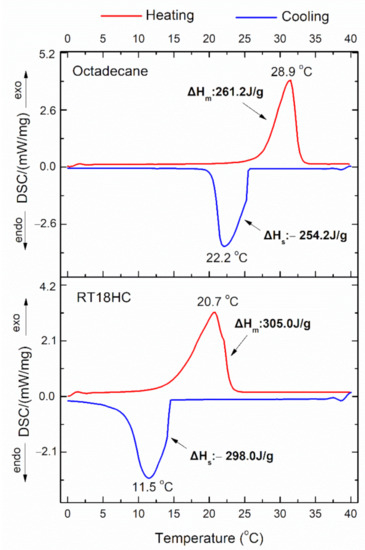
Figure 9.
DSC curves of pure n-octadecane and RT18HC paraffin.
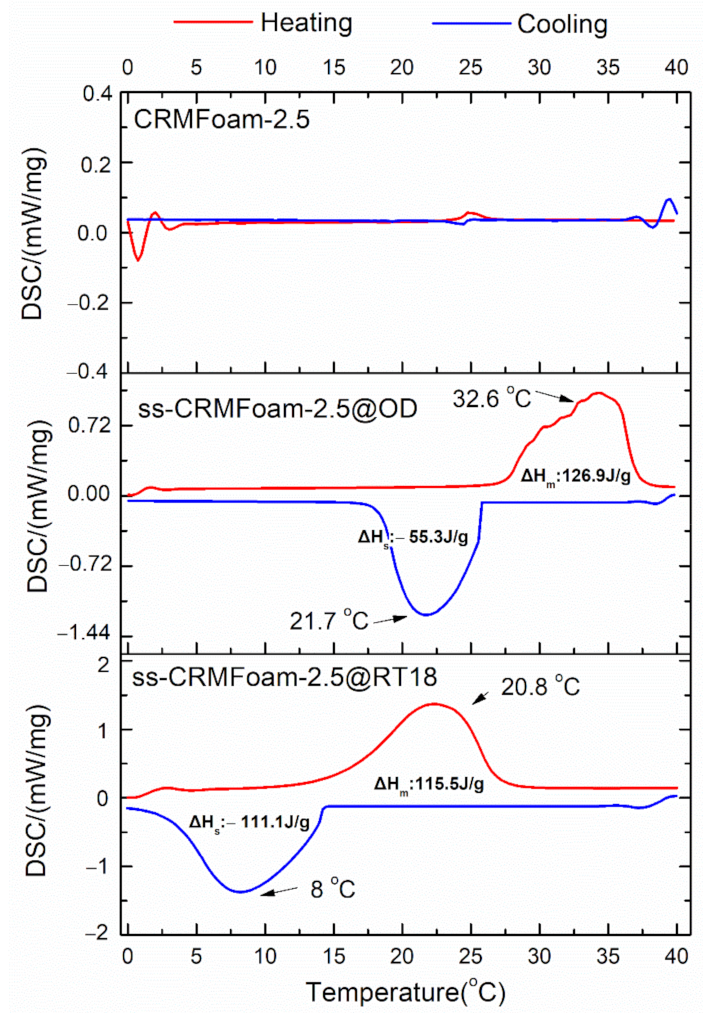
Moreover, Figure 10 shows the melting and freezing temperatures (Tm, Ts) as well as the corresponding enthalpies (ΔHm, ΔHs) of the two PCMs stabilized into CRMFoam-2.5. As shown in that figure, the melting temperature (Tm) of octadecane (OD) increases (+3.7 °C, curve of ss-CRMFoam-2.5@OD), while the solidification temperature (Ts) of RT18HC decreases (−3.5 °C, curve of ss-CRMFoam-2.5@RTH18). The DSC thermograph of CRMFoam-2.5, which is also illustrated in Figure 10, did not show exothermic or endothermic peaks.
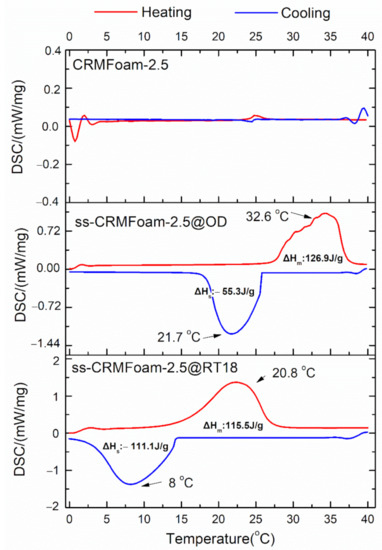
Figure 10.
DSC curves of CRMFoam-2.5 and ss-CRMFoam-2.5@OD, ss-CRMFoam-2.5@RT18 hybrids.
Furthermore, the theoretical melting enthalpies of ss-CRMFoam-2.5@OD and ss-CRMFoam-2.5@RTH18 hybrids were calculated using the following equation [69]:
where and are the theoretical melting enthalpy of ss-CRMFoam-2.5@PCM hybrids and the measured melting enthalpy of PCM, respectively, and φ% is the weight fraction of CRMFoam-2.5 sample. Using the above equation, the theoretical melting enthalpies of ss-CRMFoam-2.5@OD and ss-CRMFoam-2.5@RTH18 hybrids were found to be 126.1 J/g and 183.5 J/g, respectively. The value of octadecane (126.1 J/g), seems consistent with the measured value (126.9 J/g) using DSC. In contrast, the value of RT18HC (183.5 J/g) was found to differ significantly from the experimental value (115.5 J/g). A possible explanation for this disagreement could be attributed to the nonhomogenous encapsulation of RT18HC, which in conjunction with the small weight of the sample (30 mg), significantly affected the accuracy of the DSC measurement. In addition, the encapsulation efficiency of n-octadecane and RT18HC in the ss-CRMFoam-2.5 was calculated based on enthalpies of pure octadecane and RT18HC after leaching tests, utilizing the following equation:
where ΔHm is the enthalpy of melting for the PCM encapsulated into ss-CRMFoam-2.5 (J/g) and ΔHPCM is the enthalpy of melting for pure octadecane or RT18HC (J/g). Thus, the latent heat storages of ss-CRMFoam-2.5@OD and ss-CRMFoam-2.5@RTH18 were calculated using Equation (6) and found to be 48.8% and 37.8% for octadecane and RT18HC, respectively.
PCM content in ss-CRMFoam-2.5 (wt%) = (ΔHm/ΔHPCM) × 100
3.2.2. EMI Shielding Effectiveness
The shielding performance of the developed samples was examined in terms of EMI shielding effectiveness (SE) in the 3.2–9.0 GHz frequency range. SET can be expressed as the sum of reflection from the surface (SER), absorption (SEA) and multiple-reflection (SEM) as follows:
SET(dB) = SER(dB) + SEA(dB) + SEM(dB)
Multiple-reflection at internal interfaces inside the material can be excluded if SE > 10 dB [70] and thus:
where
SER, SEA refer to the reflection and absorption SE, respectively.
The higher the SE the better the shielding. The SE (also denoted as SET, with A, T, R indicating the absorption, transmission, and reflection, respectively) is usually quantified in terms of the logarithm of the incident power Pinc over the transmitted power Ptrn [71,72,73,74,75] and thus expressed in decibels (dB).
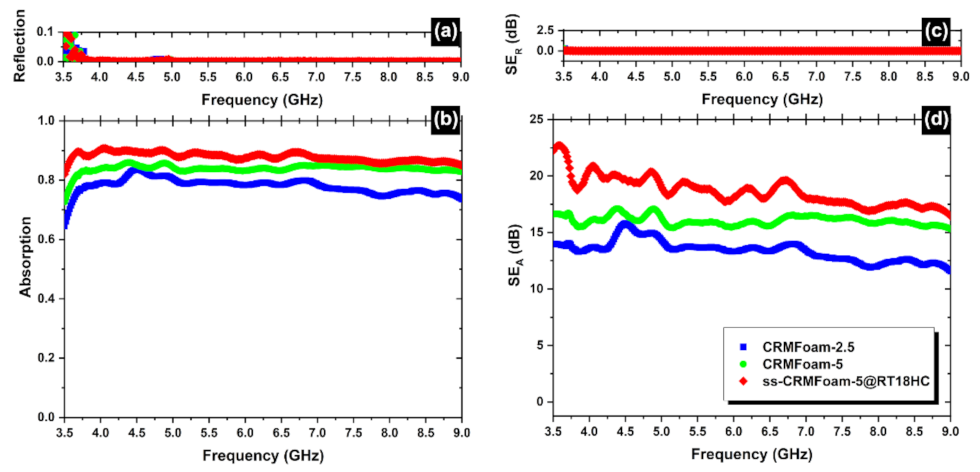
Figure 11 shows the reflection (Figure 11a) and the absorption (Figure 11b) spectra of the CRMFoams, in the frequency range 3.5–9.0 GHz. Figure 11a clearly illustrates that the reflection of the CRMFoams is almost negligible indicating that the dominant shielding mechanism is absorption giving a total SE: SET = SEA (see Equation (9)). Moreover, as one can notice from Figure 11d, the absorption levels increase as the porosity increases (sample CRMFoam-2.5 to CRMFoam-5) indicating that indeed enhanced porosity improves the microwave absorption [76,77,78,79].
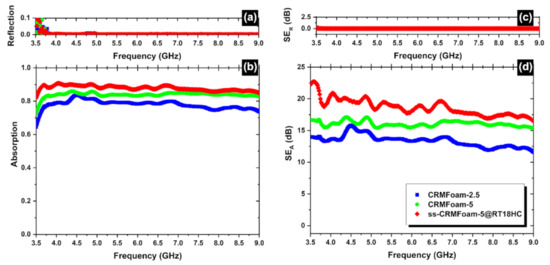
Figure 11.
Reflection (a) and absorption (b) spectra from 3.5 to 9.0 GHz (C-band) for different CRMFoams. The electromagnetic interference shielding effect (SE) due to reflection (SER; c), and absorption (SEA; d) can also be seen in the frequency range 3.5–9.0 GHz.
It is worth noticing that the encapsulation of the paraffins into the foams increased the EMI efficiency to almost 20 bB reaching the entry-level value required for commercial applications [80] following the literature’s findings that the existence of phase change Materials (PCMs) enhances the electromagnetic interference shielding effectiveness [81].
4. Conclusions
Carbon red mud foams (CRMFoams) were successfully synthesized, with two different phenolic resin to red mud ratios (5 or 2.5), from commercially available polyurethane foams. The morphological and structural study of the foams revealed a highly porous structure (bulk density < 0.55 g/cm3, apparent porosity P > 65%), which exhibited elliptical and spherical pores, sized from 50 up to 500 μm, while their pore cell walls composed of partially graphitized carbon and various oxide and iron phases. The foams showed remarkable encapsulation efficiency as shape stabilizers for the n-octadecane (OD) and RT18HC. Due to the enhanced porosity and the multiple reflections within the formed micropores, all of the as-prepared CRMFoams showed excellent EMI shielding performance in frequency of 3.5–9.0 GHz, making them promising candidates for use in thermal management and EMI shielding for electronic devices. Finally, the usage of alternate sized red mud and/with additives as well at different loading ratios could further enhance specific properties of the reported materials as for example the formed micropores whose geometry and connectivity determine the EMI and mechanical properties altogether.
Author Contributions
Conceptualization, M.A.K. and G.K.; Methodology, M.A.K., G.K. and C.E.S.; Formal Analysis, M.A.K., G.K. and C.G.; Investigation, C.G., G.A., A.K., M.B. and Z.V.; Resources, M.A.K.; Writing—Original Draft Preparation, M.A.K. and G.K.; Writing—Review and Editing, M.A.K. and G.K.; Visualization, M.A.K., G.K., C.G. and C.E.S.; Supervision, M.A.K. and G.K.; Project Administration, M.A.K.; Funding Acquisition, M.A.K. All authors have read and agreed to the published version of the manuscript.
Funding
This work was co-financed by the European Union and Greek national funds through the Operational Program Competitiveness, Entrepreneurship, and Innovation, under the call RESEARCH—CREATE—INNOVATE (acronym: SEMI-WEB; project code: T2EDK-02073).
Institutional Review Board Statement
Not applicable.
Data Availability Statement
The data presented in this study are available on request from the corresponding author.
Acknowledgments
The authors greatly acknowledge Ch. Papachristodoulou for the XRD measurements, Apostolos Avgeropoulos and Dimitrios Moschovas for the SEM measurements as well as the use of the XRD and SEM Laboratory Network Units of the University of Ioannina. Helpful and stimulating discussion with A. Lekatou and I.B. Koutselas are gratefully acknowledged. We would also like to acknowledge Ioanni Villi for his contribution in the experimental part.
Conflicts of Interest
The authors declare no conflict of interest.
References
- Zalba, B.; Marín, J.M.; Cabeza, L.F.; Mehling, H. Review on thermal energy storage with phase change: Materials, heat transfer analysis and applications. Appl. Therm. Eng. 2003, 23, 251–283. [Google Scholar] [CrossRef]
- Oró, E.; de Gracia, A.; Castell, A.; Farid, M.M.; Cabeza, L.F. Review on phase change materials (PCMs) for cold thermal energy storage applications. Appl. Energy 2012, 99, 513–533. [Google Scholar] [CrossRef] [Green Version]
- Keyan, K.; Ramachandran, T.; Shamugasundaram, O.L.; Balasubramaniam, M.; Ragavendra, T. Microencapsulation of PCMs in Textiles: A Review. J. Text. Appar. Technol. Manag. 2012, 7, 3. [Google Scholar]
- Ling, Z.; Zhang, Z.; Shi, G.; Fang, X.; Wang, L.; Gao, X.; Fang, Y.; Xu, T.; Wang, S.; Liu, X. Review on thermal management systems using phase change materials for electronic components, Li-ion batteries and photovoltaic modules. Renew. Sustain. Energy Rev. 2014, 31, 427–438. [Google Scholar] [CrossRef] [Green Version]
- Zhou, D.; Zhao, C.Y.; Tian, Y. Review on thermal energy storage with phase change materials (PCMs) in building applications. Appl. Energy 2012, 92, 593–605. [Google Scholar] [CrossRef] [Green Version]
- Kasaeian, A.; Pourfayaz, F.; Khodabandeh, E.; Yan, W.-M. Experimental studies on the applications of PCMs and nano-PCMs in buildings: A critical review. Energy Build. 2017, 154, 96–112. [Google Scholar] [CrossRef]
- Rathore, P.K.S.; Shukla, S.K. Enhanced thermophysical properties of organic PCM through shape stabilization for thermal energy storage in buildings: A state of the art review. Energy Build. 2021, 236, 110799. [Google Scholar] [CrossRef]
- Al-Yasiri, Q.; Szabó, M. Incorporation of phase change materials into building envelope for thermal comfort and energy saving: A comprehensive analysis. J. Build. Eng. 2021, 36, 102122. [Google Scholar] [CrossRef]
- Atinafu, D.G.; Ok, Y.S.; Kua, H.W.; Kim, S. Thermal properties of composite organic phase change materials (PCMs): A critical review on their engineering chemistry. Appl. Therm. Eng. 2020, 181, 115960. [Google Scholar] [CrossRef]
- Frigione, M.; Lettieri, M.; Sarcinella, A. Phase Change Materials for Energy Efficiency in Buildings and Their Use in Mortars. Materials 2019, 12, 1260. [Google Scholar] [CrossRef] [Green Version]
- Hazami, M.; Mehdaoui, F.; Taghouti, H.; Noro, M.; Lazzarin, R.; Guizani, A. Energy Storage in PCM Wall Used in Buildings’ Application: Opportunity and Perspective. In Thermodynamics and Energy Engineering; Vizureanu, P., Ed.; IntechOpen: Rijeka, Croatia, 2020. [Google Scholar]
- Sivanathan, A.; Dou, Q.; Wang, Y.; Li, Y.; Corker, J.; Zhou, Y.; Fan, M. Phase change materials for building construction: An overview of nano-/micro-encapsulation. Nanotechnol. Rev. 2020, 9, 896–921. [Google Scholar] [CrossRef]
- Singh, P.; Sharma, R.K.; Ansu, A.K.; Goyal, R.; Sarı, A.; Tyagi, V.V. A comprehensive review on development of eutectic organic phase change materials and their composites for low and medium range thermal energy storage applications. Sol. Energy Mater. Sol. Cells 2021, 223, 110955. [Google Scholar] [CrossRef]
- Singh, S.P.; Bhat, V. Applications of organic phase change materials for thermal comfort in buildings. Rev. Chem. Eng. 2014, 30, 521–538. [Google Scholar] [CrossRef]
- Al-Ahmed, A.; Sarı, A.; Mazumder, M.A.J.; Hekimoğlu, G.; Al-Sulaiman, F.A. Thermal energy storage and thermal conductivity properties of Octadecanol-MWCNT composite PCMs as promising organic heat storage materials. Sci. Rep. 2020, 10, 9168. [Google Scholar] [CrossRef]
- Kahwaji, S.; White, M.A. Organic Phase Change Materials for Thermal Energy Storage: Influence of Molecular Structure on Properties. Molecules 2021, 26, 6635. [Google Scholar] [CrossRef]
- Khyad, A.; Samrani, H.; Bargach, M.N. State of the art review of thermal energy storage systems using PCM operating with small temperature differences: Focus on Paraffin. J. Mater. Environ. Sci. 2016, 7, 1184–1192. [Google Scholar]
- Abdeali, G.; Bahramian, A.R.; Abdollahi, M. Review on Nanostructure Supporting Material Strategies in Shape-stabilized Phase Change Materials. J. Energy Storage 2020, 29, 101299. [Google Scholar] [CrossRef]
- Zhang, B.; Tian, Y.; Jin, X.; Lo, T.Y.; Cui, H. Thermal and Mechanical Properties of Expanded Graphite/Paraffin Gypsum-Based Composite Material Reinforced by Carbon Fiber. Materials 2018, 11, 2205. [Google Scholar] [CrossRef] [Green Version]
- Bake, M.; Shukla, A.; Liu, S. Development of gypsum plasterboard embodied with microencapsulated phase change material for energy efficient buildings. Mater. Sci. Energy Technol. 2021, 4, 166–176. [Google Scholar] [CrossRef]
- Fei, H.; Wang, L.; He, Q.; Du, W.; Gu, Q.; Pan, Y. Preparation and Properties of a Composite Phase Change Energy Storage Gypsum Board Based on Capric Acid-Paraffin/Expanded Graphite. ACS Omega 2021, 6, 6144–6152. [Google Scholar] [CrossRef]
- Nematpour Keshteli, A.; Sheikholeslami, M. Nanoparticle enhanced PCM applications for intensification of thermal performance in building: A review. J. Mol. Liq. 2019, 274, 516–533. [Google Scholar] [CrossRef]
- Chen, J.; Yang, D.; Jiang, J.; Ma, A.; Song, D. Research Progress of Phase Change Materials (PCMs) Embedded with Metal Foam (a Review). Procedia Mater. Sci. 2014, 4, 389–394. [Google Scholar] [CrossRef] [Green Version]
- Liu, S.; Yang, H. Porous ceramic stabilized phase change materials for thermal energy storage. RSC Adv. 2016, 6, 48033–48042. [Google Scholar] [CrossRef]
- Gong, S.; Cheng, X.; Li, Y.; Shi, D.; Wang, X.; Zhong, H. Enhancement of ceramic foam modified hierarchical Al2O3@expanded graphite on thermal properties of 1-octadecanol phase change materials. J. Energy Storage 2019, 26, 101025. [Google Scholar] [CrossRef]
- Huang, X.; Chen, X.; Li, A.; Atinafu, D.; Gao, H.; Dong, W.; Wang, G. Shape-stabilized phase change materials based on porous supports for thermal energy storage applications. Chem. Eng. J. 2019, 356, 641–661. [Google Scholar] [CrossRef]
- Zhou, D.; Zhao, C.Y. Experimental investigations on heat transfer in phase change materials (PCMs) embedded in porous materials. Appl. Therm. Eng. 2011, 31, 970–977. [Google Scholar] [CrossRef]
- Zhang, S.; Feng, D.; Shi, L.; Wang, L.; Jin, Y.; Tian, L.; Li, Z.; Wang, G.; Zhao, L.; Yan, Y. A review of phase change heat transfer in shape-stabilized phase change materials (ss-PCMs) based on porous supports for thermal energy storage. Renew. Sustain. Energy Rev. 2021, 135, 110127. [Google Scholar] [CrossRef]
- Kutuzov, S.V.; Vasil’chenko, G.N.; Chirka, T.V.; Panov, E.N. Thermal conductivity of carbon-based materials. Refract. Ind. Ceram. 2013, 54, 39–43. [Google Scholar] [CrossRef]
- Tritt, T.M. Thermal Conductivity. Theory, Properties and Applications; Kluwer Academic/Plenum Publishers: New York, NY, USA, 2004. [Google Scholar]
- Liu, X.; Yang, F.; Li, M.; Sun, C.; Wu, Y. Development of cost-effective PCM-carbon foam composites for thermal energy storage. Energy Rep. 2022, 8, 1696–1703. [Google Scholar] [CrossRef]
- Song, S.; Ai, H.; Zhu, W.; Lv, L.; Feng, R.; Dong, L. Carbon aerogel based composite phase change material derived from kapok fiber: Exceptional microwave absorbility and efficient solar/magnetic to thermal energy storage performance. Compos. Part B Eng. 2021, 226, 109330. [Google Scholar] [CrossRef]
- Tao, W.; Kong, X.; Bao, A.; Fan, C.; Zhang, Y. Preparation and Phase Change Performance of Graphene Oxide and Silica Composite Na2SO4·10H2O Phase Change Materials (PCMs) as Thermal Energy Storage Materials. Materials 2020, 13, 5186. [Google Scholar] [CrossRef] [PubMed]
- Li, A.; Dong, C.; Dong, W.; Atinafu, D.G.; Gao, H.; Chen, X.; Wang, G. Hierarchical 3D Reduced Graphene Porous-Carbon-Based PCMs for Superior Thermal Energy Storage Performance. ACS Appl. Mater. Interfaces 2018, 10, 32093–32101. [Google Scholar] [CrossRef] [PubMed]
- Ola, O.; Chen, Y.; Niu, Q.; Xia, Y.; Mallick, T.; Zhu, Y. Ultralight three-dimensional, carbon-based nanocomposites for thermal energy storage. J. Mater. Sci. Technol. 2020, 36, 70–78. [Google Scholar] [CrossRef]
- Wang, Z.; Zhang, X.; Xu, Y.; Chen, G.; Lin, F.; Ding, H. Preparation and thermal properties of shape-stabilized composite phase change materials based on paraffin wax and carbon foam. Polymer 2021, 237, 124361. [Google Scholar] [CrossRef]
- Li, J.; Ding, Y.; Yu, N.; Gao, Q.; Fan, X.; Wei, X.; Zhang, G.; Ma, Z.; He, X. Lightweight and stiff carbon foams derived from rigid thermosetting polyimide foam with superior electromagnetic interference shielding performance. Carbon 2020, 158, 45–54. [Google Scholar] [CrossRef]
- Chung, D.D.L. Electromagnetic interference shielding effectiveness of carbon materials. Carbon 2001, 39, 279–285. [Google Scholar] [CrossRef]
- Chung, D.D.L. Materials for electromagnetic interference shielding. Mater. Chem. Phys. 2020, 255, 123587. [Google Scholar] [CrossRef]
- Kumar, R.; Mondal, D.P.; Chaudhary, A.; Shafeeq, M.; Kumari, S. Excellent EMI shielding performance and thermal insulating properties in lightweight, multifunctional carbon-cenosphere composite foams. Compos. Part A Appl. Sci. Manuf. 2018, 112, 475–484. [Google Scholar] [CrossRef]
- Kumar, R.; Sharma, A.; Pandey, A.; Chaudhary, A.; Dwivedi, N.; Shafeeq, M.M.; Mondal, D.P.; Srivastava, A.K. Lightweight carbon-red mud hybrid foam toward fire-resistant and efficient shield against electromagnetic interference. Sci. Rep. 2020, 10, 9913. [Google Scholar] [CrossRef]
- Liu, X.; Wang, Y.; Zhan, L. Carbon foams prepared from coal tar pitch for building thermal insulation material with low cost. Chin. J. Chem. Eng. 2018, 26, 415–420. [Google Scholar] [CrossRef]
- Liu, J.; Li, X.; Zhou, C. Mechanical and thermal properties of modified red mud-reinforced phenolic foams. Polym. Int. 2018, 67, 528–534. [Google Scholar] [CrossRef]
- Vaggelatos, I. Utilization of Red Mud in Cement Industries. Ph.D. Thesis, University of Patras in Greece, Patras, Greece, 2008. [Google Scholar]
- Khadiran, T.; Hussein, M.Z.; Zainal, Z.; Rusli, R. Shape-stabilised n-octadecane/activated carbon nanocomposite phase change material for thermal energy storage. J. Taiwan Inst. Chem. Eng. 2015, 55, 189–197. [Google Scholar] [CrossRef]
- Rubitherm. Data Sheet RT18HC; Rubitherm: Berlin, Germany, 2020. [Google Scholar]
- Faden, M.; Höhlein, S.; Wanner, J.; König-Haagen, A.; Brüggemann, D. Review of Thermophysical Property Data of Octadecane for Phase-Change Studies. Materials 2019, 12, 2974. [Google Scholar] [CrossRef] [PubMed] [Green Version]
- ASTM International. Standard Test Methods for Apparent Porosity, Water Absorption, Apparent Specific Gravity, and Bulk Density of Burned Refractory Brick and Shapes by Boiling Water; ASTM International: West Conshohocken, PA, USA, 2010. [Google Scholar]
- ASTM International. Standard Test Method for Measurement of Thermal Effusivity of Fabrics Using a Modified Transient Plane Source (MTPS) Instrument; ASTM International: West Conshohocken, PA, USA, 2016. [Google Scholar]
- Lazou, A.; Van Der Eijk, C.; Tang, K.; Balomenos, E.; Kolbeinsen, L.; Safarian, J. The Utilization of Bauxite Residue with a Calcite-Rich Bauxite Ore in the Pedersen Process for Iron and Alumina Extraction. Metall. Mater. Trans. B 2021, 52, 1255–1266. [Google Scholar] [CrossRef]
- William, D.; Callister, D.G.R., Jr. Materials Science and Engineering, 10th ed.; Global edition; Wiley: New York, NY, USA, 2019. [Google Scholar]
- Pimenta, M.A.; Dresselhaus, G.; Dresselhaus, M.S.; Cancado, L.G.; Jorio, A.; Saito, R. Studying disorder in graphite-based systems by Raman spectroscopy. Phys. Chem. Chem. Phys. 2007, 9, 1276–1291. [Google Scholar] [CrossRef]
- Bokobza, L.; Bruneel, J.-L.; Couzi, M. Raman Spectra of Carbon-Based Materials (from Graphite to Carbon Black) and of Some Silicone Composites. C J. Carbon Res. 2015, 1, 77–94. [Google Scholar] [CrossRef] [Green Version]
- Kumar, V.; Kumar, A.; Lee, D.-J.; Park, S.-S. Estimation of Number of Graphene Layers Using Different Methods: A Focused Review. Materials 2021, 14, 4590. [Google Scholar] [CrossRef]
- Wu, J.-B.; Lin, M.-L.; Cong, X.; Liu, H.-N.; Tan, P.-H. Raman spectroscopy of graphene-based materials and its applications in related devices. Chem. Soc. Rev. 2018, 47, 1822–1873. [Google Scholar] [CrossRef] [Green Version]
- American Society for Testing and Materials. Standard Test Method for Monotonic Compressive Strength of Advanced Ceramics at Ambient Temperature; ASTM International: West Conshohocken, PA, USA, 1999; p. 1424. [Google Scholar]
- Baino, F.; Fiume, E. Elastic Mechanical Properties of 45S5-Based Bioactive Glass–Ceramic Scaffolds. Materials 2019, 12, 3244. [Google Scholar] [CrossRef] [Green Version]
- Li, J.; Jia, L.; Li, L.; Huang, Z.; Chen, Y. Hybrid Microencapsulated Phase-Change Material and Carbon Nanotube Suspensions toward Solar Energy Conversion and Storage. Energies 2020, 13, 4401. [Google Scholar] [CrossRef]
- Wang, X.; Zhao, T. Effects of parameters of the shell formation process on the performance of microencapsulated phase change materials based on melamine-formaldehyde. Text. Res. J. 2016, 87, 1848–1859. [Google Scholar] [CrossRef]
- Woo, H.Y.; Lee, D.W.; Yoon, T.Y.; Kim, J.B.; Chae, J.-Y.; Paik, T. Sub-100-nm Nearly Monodisperse n-Paraffin/PMMA Phase Change Nanobeads. Nanomaterials 2021, 11, 204. [Google Scholar] [CrossRef] [PubMed]
- Stoyanova, D.; Stambolova, I.; Blaskov, V.; Zaharieva, K.; Avramova, I.; Dimitrov, O.; Vassilev, S.; Eliyas, A.; Nedyalkov, N. Mechanical milling of hydrothermally obtained CaTiO3 powders—morphology and photocatalytic activity. Nano-Struct. Nano-Objects 2019, 18, 100301. [Google Scholar] [CrossRef]
- Portia, S.A.U.; Srinivasan, R.; Elaiyappillai, E.; Johnson, P.M.; Ramamoorthy, K. Facile synthesis of Eu-doped CaTiO3 and their enhanced supercapacitive performance. Ionics 2020, 26, 3543–3554. [Google Scholar] [CrossRef]
- Loy, C.W.; Matori, K.A.; Zainuddin, N.; Whitten, A.E.; de Campo, L.; Nasir, N.I.M.; Pallan, N.F.B.; Zaid, M.H.M.; Zarifah, N.A.; Schmid, S. Small Angle Neutron Scattering Study of a Gehlenite-Based Ceramic Fabricated from Industrial Waste. Solid State Phenom. 2019, 290, 22–28. [Google Scholar] [CrossRef]
- Mishra, R.K.; Fernández-Carrasco, L.; Flatt, R.J.; Heinz, H. A force field for tricalcium aluminate to characterize surface properties, initial hydration, and organically modified interfaces in atomic resolution. Dalton Trans. 2014, 43, 10602–10616. [Google Scholar] [CrossRef] [Green Version]
- Perná, I.; Šupová, M.; Hanzlíček, T. Gehlenite and anorthite formation from fluid fly ash. J. Mol. Struct. 2018, 1157, 476–481. [Google Scholar] [CrossRef]
- Lu, R.; Gan, W.; Wu, B.-h.; Zhang, Z.; Guo, Y.; Wang, H.-F. C−H Stretching Vibrations of Methyl, Methylene and Methine Groups at the Vapor/Alcohol (n = 1–8) Interfaces. J. Phys. Chem. B 2005, 109, 14118–14129. [Google Scholar] [CrossRef]
- Nguyen, G.T.; Hwang, H.S.; Lee, J.; Cha, D.A.; Park, I. n-Octadecane/Fumed Silica Phase Change Composite as Building Envelope for High Energy Efficiency. Nanomaterials 2021, 11, 566. [Google Scholar] [CrossRef]
- RT GmbH. RT18HC; RT GmbH: Giessen, Germany, 2020. [Google Scholar]
- Kim, D.; Jung, J.; Kim, Y.; Lee, M.; Seo, J.; Khan, S.B. Structure and thermal properties of octadecane/expanded graphite composites as shape-stabilized phase change materials. Int. J. Heat Mass Transf. 2016, 95, 735–741. [Google Scholar] [CrossRef]
- Verma, M.; Singh, A.P.; Sambyal, P.; Singh, B.P.; Dhawan, S.K.; Choudhary, V. Barium ferrite decorated reduced graphene oxide nanocomposite for effective electromagnetic interference shielding. Phys. Chem. Chem. Phys. 2015, 17, 1610–1618. [Google Scholar] [CrossRef] [PubMed] [Green Version]
- Al-Saleh, M.H.; Gelves, G.A.; Sundararaj, U. Copper nanowire/polystyrene nanocomposites: Lower percolation threshold and higher EMI shielding. Compos. Part A Appl. Sci. Manuf. 2011, 42, 92–97. [Google Scholar] [CrossRef]
- Al-Saleh, M.H.; Saadeh, W.H.; Sundararaj, U. EMI shielding effectiveness of carbon based nanostructured polymeric materials: A comparative study. Carbon 2013, 60, 146–156. [Google Scholar] [CrossRef]
- Ameli, A.; Jung, P.U.; Park, C.B. Electrical properties and electromagnetic interference shielding effectiveness of polypropylene/carbon fiber composite foams. Carbon 2013, 60, 379–391. [Google Scholar] [CrossRef]
- Suchea, M.; Tudose, I.V.; Tzagkarakis, G.; Kenanakis, G.; Katharakis, M.; Drakakis, E.; Koudoumas, E. Nanostructured composite layers for electromagnetic shielding in the GHz frequency range. Appl. Surf. Sci. 2015, 352, 151–154. [Google Scholar] [CrossRef]
- Viskadourakis, Z.; Vasilopoulos, K.C.; Economou, E.N.; Soukoulis, C.M.; Kenanakis, G. Electromagnetic shielding effectiveness of 3D printed polymer composites. Appl. Phys. A 2017, 123, 736. [Google Scholar] [CrossRef] [Green Version]
- Qu, Z.; Wang, Y.; Yang, P.; Zheng, W.; Li, N.; Bai, J.; Zhang, Y.; Li, K.; Wang, D.; Liu, Z.; et al. Enhanced Electromagnetic Wave Absorption Properties of Ultrathin MnO2 Nanosheet-Decorated Spherical Flower-Shaped Carbonyl Iron Powder. Molecules 2022, 27, 135. [Google Scholar] [CrossRef]
- He, G.; Duan, Y.; Pang, H.; Zhang, X. Rational design of mesoporous MnO2 microwave absorber with tunable microwave frequency response. Appl. Surf. Sci. 2019, 490, 372–382. [Google Scholar] [CrossRef]
- Ye, X.; Chen, Z.; Ai, S.; Hou, B.; Zhang, J.; Liang, X.; Zhou, Q.; Liu, H.; Cui, S. Porous SiC/melamine-derived carbon foam frameworks with excellent electromagnetic wave absorbing capacity. J. Adv. Ceram. 2019, 8, 479–488. [Google Scholar] [CrossRef] [Green Version]
- Lin, Y.; Dong, J.; Zong, H.; Wen, B.; Yang, H. Synthesis, Characterization, and Electromagnetic Wave Absorption Properties of Composites of Reduced Graphene Oxide with Porous LiFe5O8 Microspheres. ACS Sustain. Chem. Eng. 2018, 6, 10011–10020. [Google Scholar] [CrossRef]
- Zhao, S.; Yan, Y.; Gao, A.; Zhao, S.; Cui, J.; Zhang, G. Flexible Polydimethylsilane Nanocomposites Enhanced with a Three-Dimensional Graphene/Carbon Nanotube Bicontinuous Framework for High-Performance Electromagnetic Interference Shielding. ACS Appl. Mater. Interfaces 2018, 10, 26723–26732. [Google Scholar] [CrossRef] [PubMed]
- Liang, Y.; Tong, Y.; Tao, Z.; Guo, Q.; Hao, B.; Liu, Z. Multifunctional Shape-Stabilized Phase Change Materials with Enhanced Thermal Conductivity and Electromagnetic Interference Shielding Effectiveness for Electronic Devices. Macromol. Mater. Eng. 2021, 306, 2100055. [Google Scholar] [CrossRef]


Publisher’s Note: MDPI stays neutral with regard to jurisdictional claims in published maps and institutional affiliations. |
© 2022 by the authors. Licensee MDPI, Basel, Switzerland. This article is an open access article distributed under the terms and conditions of the Creative Commons Attribution (CC BY) license (https://creativecommons.org/licenses/by/4.0/).