1. Introduction
Biofouling in the marine environment can be defined as the undesirable adhesion, formation, growth, and agglomeration of composite layers consisting of microorganisms, algae, and animals on solid artificial surfaces in contact with seawater [
1,
2]. The process begins the moment the surface is immersed in sea water and consists of four distinct stages [
2,
3,
4];
Stage 1: From the first minute they are submerged in water, reefs accumulate organic matter and pre-existing molecules in the water, such as polysaccharides, proteins, and proteoglicans. A continuous film of chemical compounds is formed through natural adhesion of the organic particles. This stage begins seconds after immersion, is stabilized within a few minutes, and prepares the surface for the next stages, as it increases the free energy of the surface and increases its wettability by organic elements of microfouling (primary colonization),
Stage 2: Microscopic organisms, such as bacteria and microalgae (mainly diatoms), are adsorbed on the surface, secreting organic matter (mainly polysaccharides) and creating a sticky layer (biofilm). Essentially, physical forces such as electrostatic interactions, Brownian movement, and Van der Walls forces lead to instantaneous attraction of planktonic cells to the metal surface,
Stage 3: The sticky texture of the biofilm and the roughness of the surface due to the existence of the microbial community facilitate the attachment of other, more complex organisms, such as fungi and protozoa. The transition from biofilm to a more complex biocommunity initiates secondary colonization,
Stage 4: Tertiary colonization involves the settlement of larger marine invertebrates such as mussels, barnacles, and macroalgae, which forms macrofouling. The formation of this film takes about 2–3 weeks and happens due to the presence of the biofilm and the roughness produced by the irregular microbial colonies.
This natural phenomenon constitutes a huge economic problem for marine industries, as it raises the costs related to materials’ maintenance, repair, and cleaning [
5,
6,
7]. During recent years, numerous attempts have been made to develop efficient antifouling coatings, combining developments in materials science and recent information regarding marine chemistry and biology. Thus, the development of innovative low-drag antifouling coatings for the hulls of ships, vessels, and speed crafts is essential [
8,
9,
10,
11,
12].
Biofouling of the ship’s reefs is directly related to the roughness of its reefs. It has been calculated that for each increase in reef roughness by 10–20 μm, the friction resistance increases by 0.5% for ships at high speeds. In general, the surface roughness of the reefs is increased by mechanical detachments or structural defects and is affected by improper surface preparation or the improper application of antifouling coating. The increase in surface roughness results in 3–4% higher fuel consumption [
13,
14].
In addition to surface roughness, seawater parameters affect the ability of microorganisms, algae, and plants to adhere and settle on a surface. The salinity of seawater, the temperature, and pH fluctuations are critical parameters in the design of an efficient coating [
14,
15,
16]. It has been observed that small changes in the alkaline behavior of seawater, either due to hydrosulfide production (decrease of pH) or due to a decrease in CO
2 by the presence of algae (increase of pH), cause variations in the behavior of the coatings, both in terms of the solubility of biocides and the rate of corrosion of the coating [
6]. Annual fluctuations and seasonal changes in temperature significantly affect the reproductive cycles of the microorganisms, and consequently the species of the growing microorganisms, their sequence on the ship’s reefs, and the extent of the biofouling. At high temperatures, the rate of chemical and enzymatic reactions increases, thereby enhancing the gradual stages of cell growth, the rate of corrosion, and the rate of crystallization of the polymeric coating, thus limiting the effect of antifouling reef paint. At low temperatures, although the rate of reactions is limited, the biological deposits of the microorganisms solidify, making it difficult to deal with the biofouling using common coatings [
14,
17]. Thus, further research is necessary to evaluate and optimize the efficiency of preventive systems [
18].
To protect immersed structures against biofouling and avoid related corrosion issues, several strategies for surface protection were adopted, including non-toxic materials development [
19] and coating procedures commercialization [
20]. Traditionally, chemical biocides have been widely used as the standard approach to controlling marine biofouling. Compounds such as tributyltin oxide (C
24H
54OSn
2) and tributyltin fluoride (C
12H
27FSn) are mixed with polymeric binders and applied to the ships’ and vessels’ hull. However, through years of study, researchers have found that tributyltin (TBT) is harmful to aquatic ecosystems around the globe. TBT-based antifouling coatings were then restricted in most European countries and finally banned worldwide in 2008 [
21,
22], leading to the urgency of developing alternative materials and find new strategies for antifouling coatings. The application of antifouling paint containing copper oxide is recommended by the Environment Protection Agents (EPA) as the replacement of TBT. Copper Oxide (Cu
2O) in the water will be bound with other substances; therefore, its toxicity is reduced. According to the new and strict environmental and health restrictions, the materials for marine applications may be divided in two main approaches: nonbiocide-release-based antifouling coatings and biocide-release-based coatings [
23].
Besides their chemical composition, the efficiency of the commercial paints depends on several factors, including the nature of the substrate surface, the coating deposition technique, and their behavior in the corresponding marine environments that mainly differ in water salinity and mean temperature. In addition, the recent literature lacks detailed data depicting the behavior of commercial shipbuilding anti-biofouling coatings in sea environments. There is an urgent need for comparative evaluation that will determine their performance under real conditions, which might directly benefit the key players of the marine transport industry. Thus, in this study, high strength naval steel panels were coated with five commercial antifouling paints. The coated panels were characterized electrochemically to evaluate the paints’ anticorrosion properties under controlled laboratory conditions. Additionally, in order to control the influence of factors such as temperature, salinity, and latitude in static port conditions, thirteen different harbors (in the Mediterranean Sea and in the Atlantic Ocean) were chosen, and another set of coated panels was immersed for nine months in each of them.
2. Materials and Methods
Commercial sheets of AH36 steel (Lloyd’s Register of Shipping, Athens, Greece) were utilized as the substrate material. This high-strength steel is a standard type of alloy used in the shipbuilding industry. The elemental composition was examined using the XRF technique, and the results are summarized in
Table 1.
The microstructural characterization of the steel substrate was performed using scanning electron microscopy (SEM). The use of the electron microscope instead of the optical microscope was necessary due to the need for a higher resolution and appropriate field depth. The metallographic characterization was performed with a JEOL 6380LV scanning electron microscope (high vacuum; accelerating voltage of e−: 20 kV). Firstly, orthogonal samples from the normal, as well as the longitudinal and transverse direction of the initial alloyed steel were cut from the initial sample using waterjet cutting. After proper preparation, they were placed in a metal sample carrier. These samples constituted the surface of the substrate and its longitudinal and cross-section. Then, using conductive graphite plasticine, the surface of the resin was attached to the metal part of the sample carrier and placed inside the electron microscope chamber. Through the secondary electrons imaging (SEI mode) and the use of artificial topographic relief, the morphology and distribution of the grains were determined, both on the surface of the samples and in their vertical section. Through backscattered electrons imaging (BES mode), the individual phases and microstructural components that characterized the substrate were identified. The SEM micrographs were embedded in a 3D reconstruction in order to quickly retrieve information on the variation of the materials’ density, as the set of images is obtained simultaneously. The microscope was equipped with a Noran TS 5500 microanalyzer, enabling the simultaneous performance of chemical microanalyses using the EDS system (emission current: high; measurement time: 20 s) to find the percentage of alloying elements.
In order to study the anticorrosive properties in static port conditions, panels of alloyed naval steel (40 cm
L × 35 cm
W × 5 mm
T) were coated by spraying on their surfaces with five different types of commercial antifouling coatings available on the Greek market (named as A, B, C, D and E), as shown in
Table 2.
These antifouling coatings were selected based on their availability in the Greek market and were chosen as representative study coatings for comparison reasons. Thus, A and B paints were classified as hard antifouling coatings with biocide contents ranging from 6 to 12 wt%, respectively. C was a self-polishing copolymer antifouling coating for controlling both the release of biocides and the ablative level of the paint. Finally, D and E coatings were characterized as soft antifouling paints; thus, they present erosion of the upper level of the coating when submerged in the sea water. According to the paints’ product data sheets, no booster biocides were presented in any of the coatings. Steel panels were previously degreased with acetone, polished with sandpaper (grain size #150), rinsed with deionized water, and degreased again. After surface preparation, one side of each panel was painted with one layer of anticorrosive primer. No primer coating was applied. The commercial antifouling coatings were applied on one side of the panels and their edges. All panels were painted with an airless sprayer (SATA MINITET 4400B HVLP) and an airless compressor (4 hp). According to the local restrictions, the applicator must have the proper protection appearance (mask, gloves, wear). The antifouling paints were not diluted, as they do not clog the nozzle. Prior to the final application of the coatings to the panels, several tests were made in order to adjust the pressure value (~2 bar) to the lowest setting with a good spray pattern. Thus, a controlled thickness and a proper coverage of the paint were achieved.
Two sets of panels were prepared: one set for corrosion evaluation in laboratory conditions and one set for in situ determination of antifouling efficiency. For the first set of panels, five coated samples and one non-coated were prepared and subjected to electrochemical tests. Electrochemical measurements were performed using a Gamry potentiostat (Model 3000) using a three-electrode set-up, where the steel samples constituted the working electrode (exposed surface was 0.2 cm
2), an Ag/AgCl electrode was utilized as the reference electrode, and a graphite rod was used as the counter electrode. The electrochemical tests were performed in a 0.6 M NaCl solution under ambient conditions and the open-circuit potential (OCP) was monitored for 30 min to ensure that the steady state was reached before the next measurements. Electrochemical impedance spectroscopy (EIS) measurements were measured with reference to the OCP by applying a sinusoidal voltage ±10 mV and obtaining impedance responses in a frequency range between 100 mHz and 10 kHz. Likewise, linear polarization resistance (LPR) was measured over a polarized voltage range (±0.025 V) at a scan rate of 0. 125 mV/s. The potential dynamic polarization test (PDP) was performed by polarizing the system with a scan rate of 0.5 mV/s at a potential of −0.25 V downstream and 0.5 V upstream, relative to the OCP. The corrosion rate (
CR) in mm per year was calculated using Faraday’s law according to the G102 ASTM standard:
in which
Icorr is the density of the corrosion current in μA/cm
2,
EW is the equivalent weight in g/µA cm yr, and
ρ is the density in g/cm
3. After PDP measurement, an atomic force microscope (AFM, MFP-3D Origin, Oxford Instruments) was used to characterize the exposed surfaces of the coated samples.
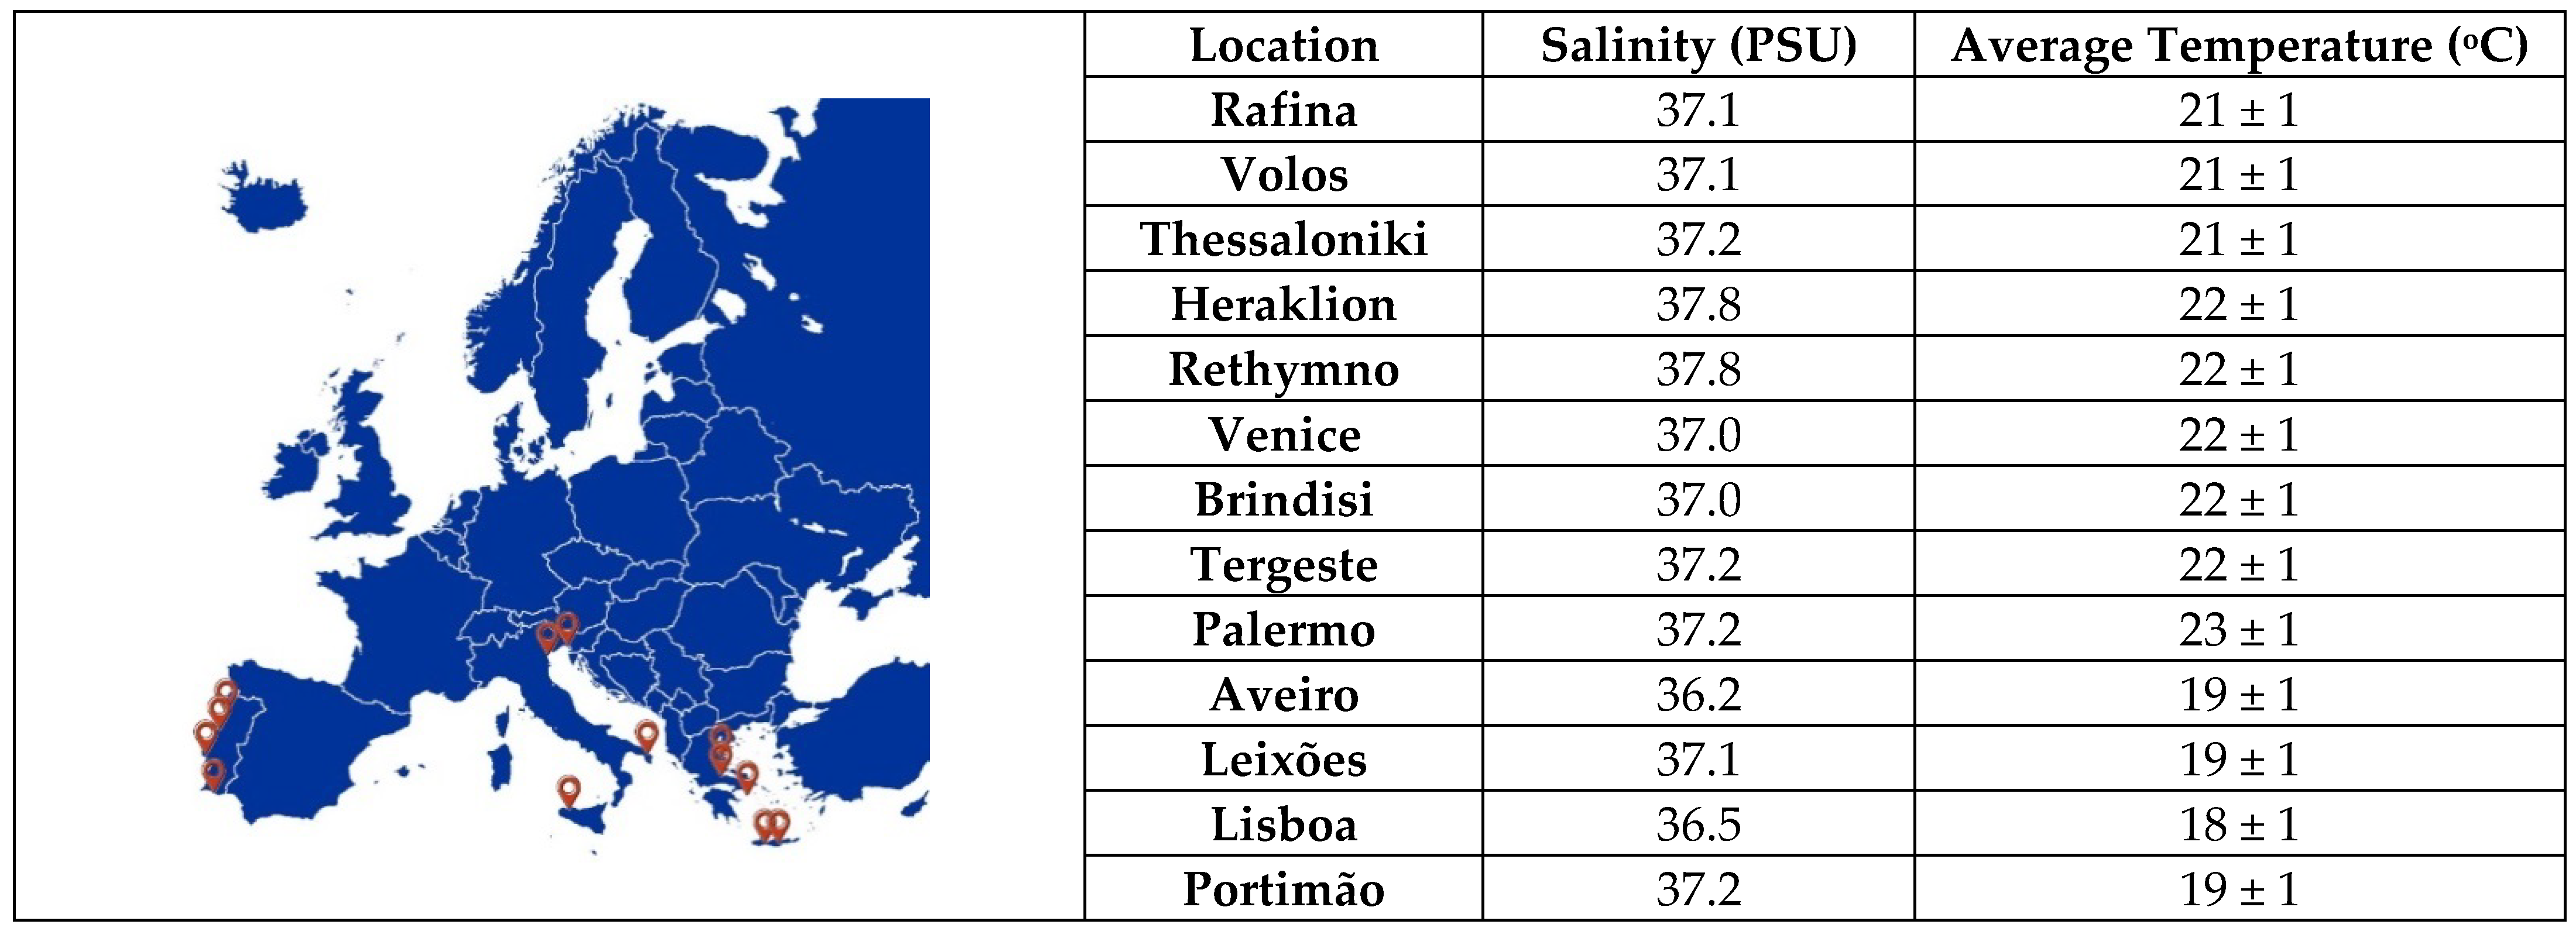
In the spring of 2021, the second set of coated sheets was immersed statically at ~1 m depth in the sea for 9 months near the coasts of 13 European cities (in the Mediterranean Sea and Atlantic Ocean): Rafina, Thessaloniki, Volos, Heraklion, Rethymno, Venice, Brindisi, Tergeste, Palermo, Aveiro, Leixões, Lisboa, and Portimão (
Figure 1). Five coated samples and one non-coated sample were sunk on each shore; thus, 78 samples were obtained. In order to monitor the seawater temperature for the duration of this study, a digital temperature data logger model (HOBO Pendant
® Temperature data logger) was submerged into every study port. According to the manufacture, this model is suitable for underwater applications. The immersed loggers recorded temperature at one-minute intervals. These thermometer’s readings were recorded, and following their analysis, the average temperature was extracted as the mean value of these records.
The resulting substrates with micro biofoulings were recovered from the marine environment and placed in the laboratory at room temperature for 5 days. The name of the samples was derived from the serial letter of the coating and the first three letters of the shore (for example, APor is the sample on the coast of Portimão with coating A). The surface of the captured panels was subjected to both visual inspections and morphology examination of their existing fouling level.
3. Results and Discussion
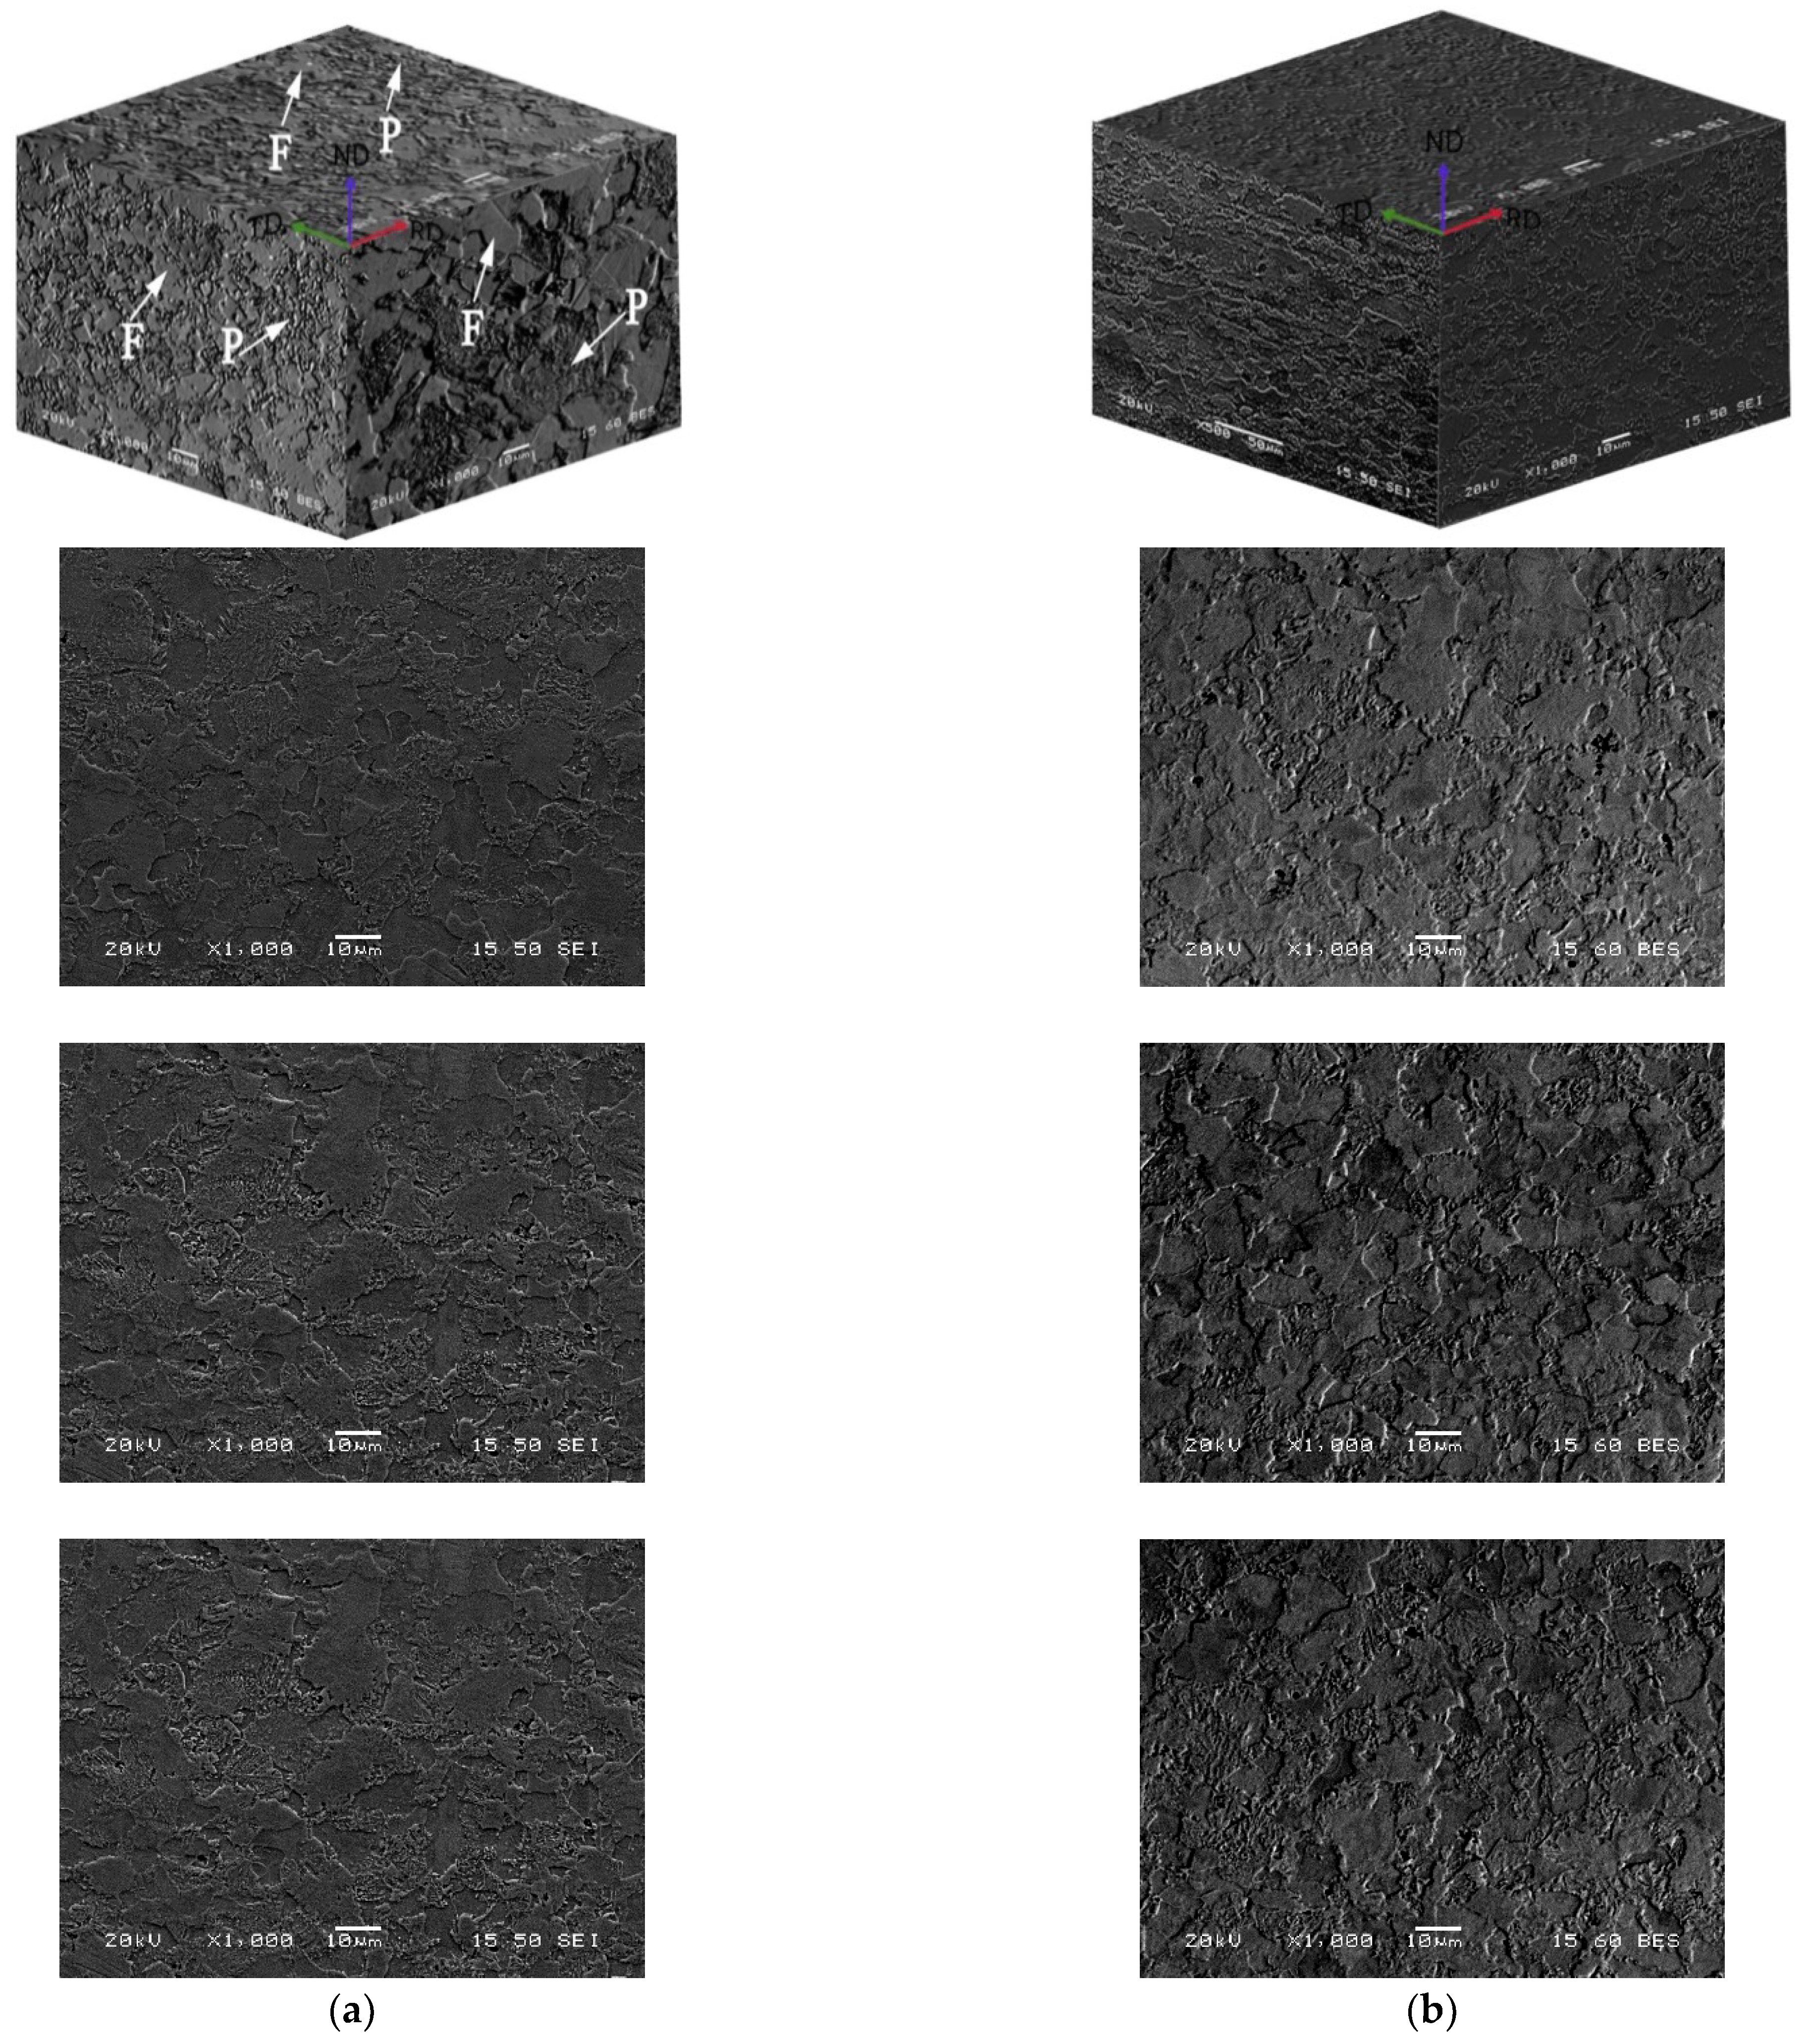
The results of the microstructural characterization of the as-received steel alloy through backscattered electrons imaging using field contrast are demonstrated in
Figure 2a. The 3D reconstruction of the SEM images, as well as the corresponding 2D images from the normal (ND), longitudinal (LD), and Transverse (TD) direction were also presented. A biphasic matrix was observed, characterized by the presence of pro-eutectoid ferrite grains (F) and eutectoid perlite (P). The image analyzer software was used to indirectly estimate the volume fraction of the two components. The results showed that the pro-eutectoid ferrite was the predominant phase, about 89% on the surface of the sample, while the eutectoid perlite participated with a percentage of only 11%.
The imaging using secondary electrons (
Figure 2b) proved that the substrate consisted of isaxonal polygonal grains of pro-eutectoid ferrite, as well as homogeneously arranged perlite grains, which appeared to have a characteristic stacking of eutectoid ferrite and cementite tiles. Nevertheless, morphological inhomogeneity of the grains and no orientation of the tiles were observed between different perlite grains. The inhomogeneity was evident in the distribution of their mean growth size, which was determined at 54 ± 7 μm for the ferrite grains and at 35 ± 8 μm for the perlite grains. The secondary electron imaging was also used to examine the cross-section of the coated steel samples. The coating–substrate interface is shown in
Figure 3.
The coating thickness was measured with SEM analysis. Measurements were repeated eight times in different areas of the sample and the mean and standard deviation were calculated. The average thickness of the commercial, A, B, C, D, and E antifouling coatings are summarized in
Table 3. In all the samples, the coating (about 18–19 μm in thickness) presents excellent cohesion with the substrate and a satisfying mechanical adhesion to it. No internal porosity, cracking, or detachment of the coating was observed in any of the samples tested. The coating layer is relatively uniform, as it is not characterized by discontinuities; however, its surface is wavy, which is reflected in the recording of increased surface roughness in three-dimensional AFM measurements (
Figure 4).
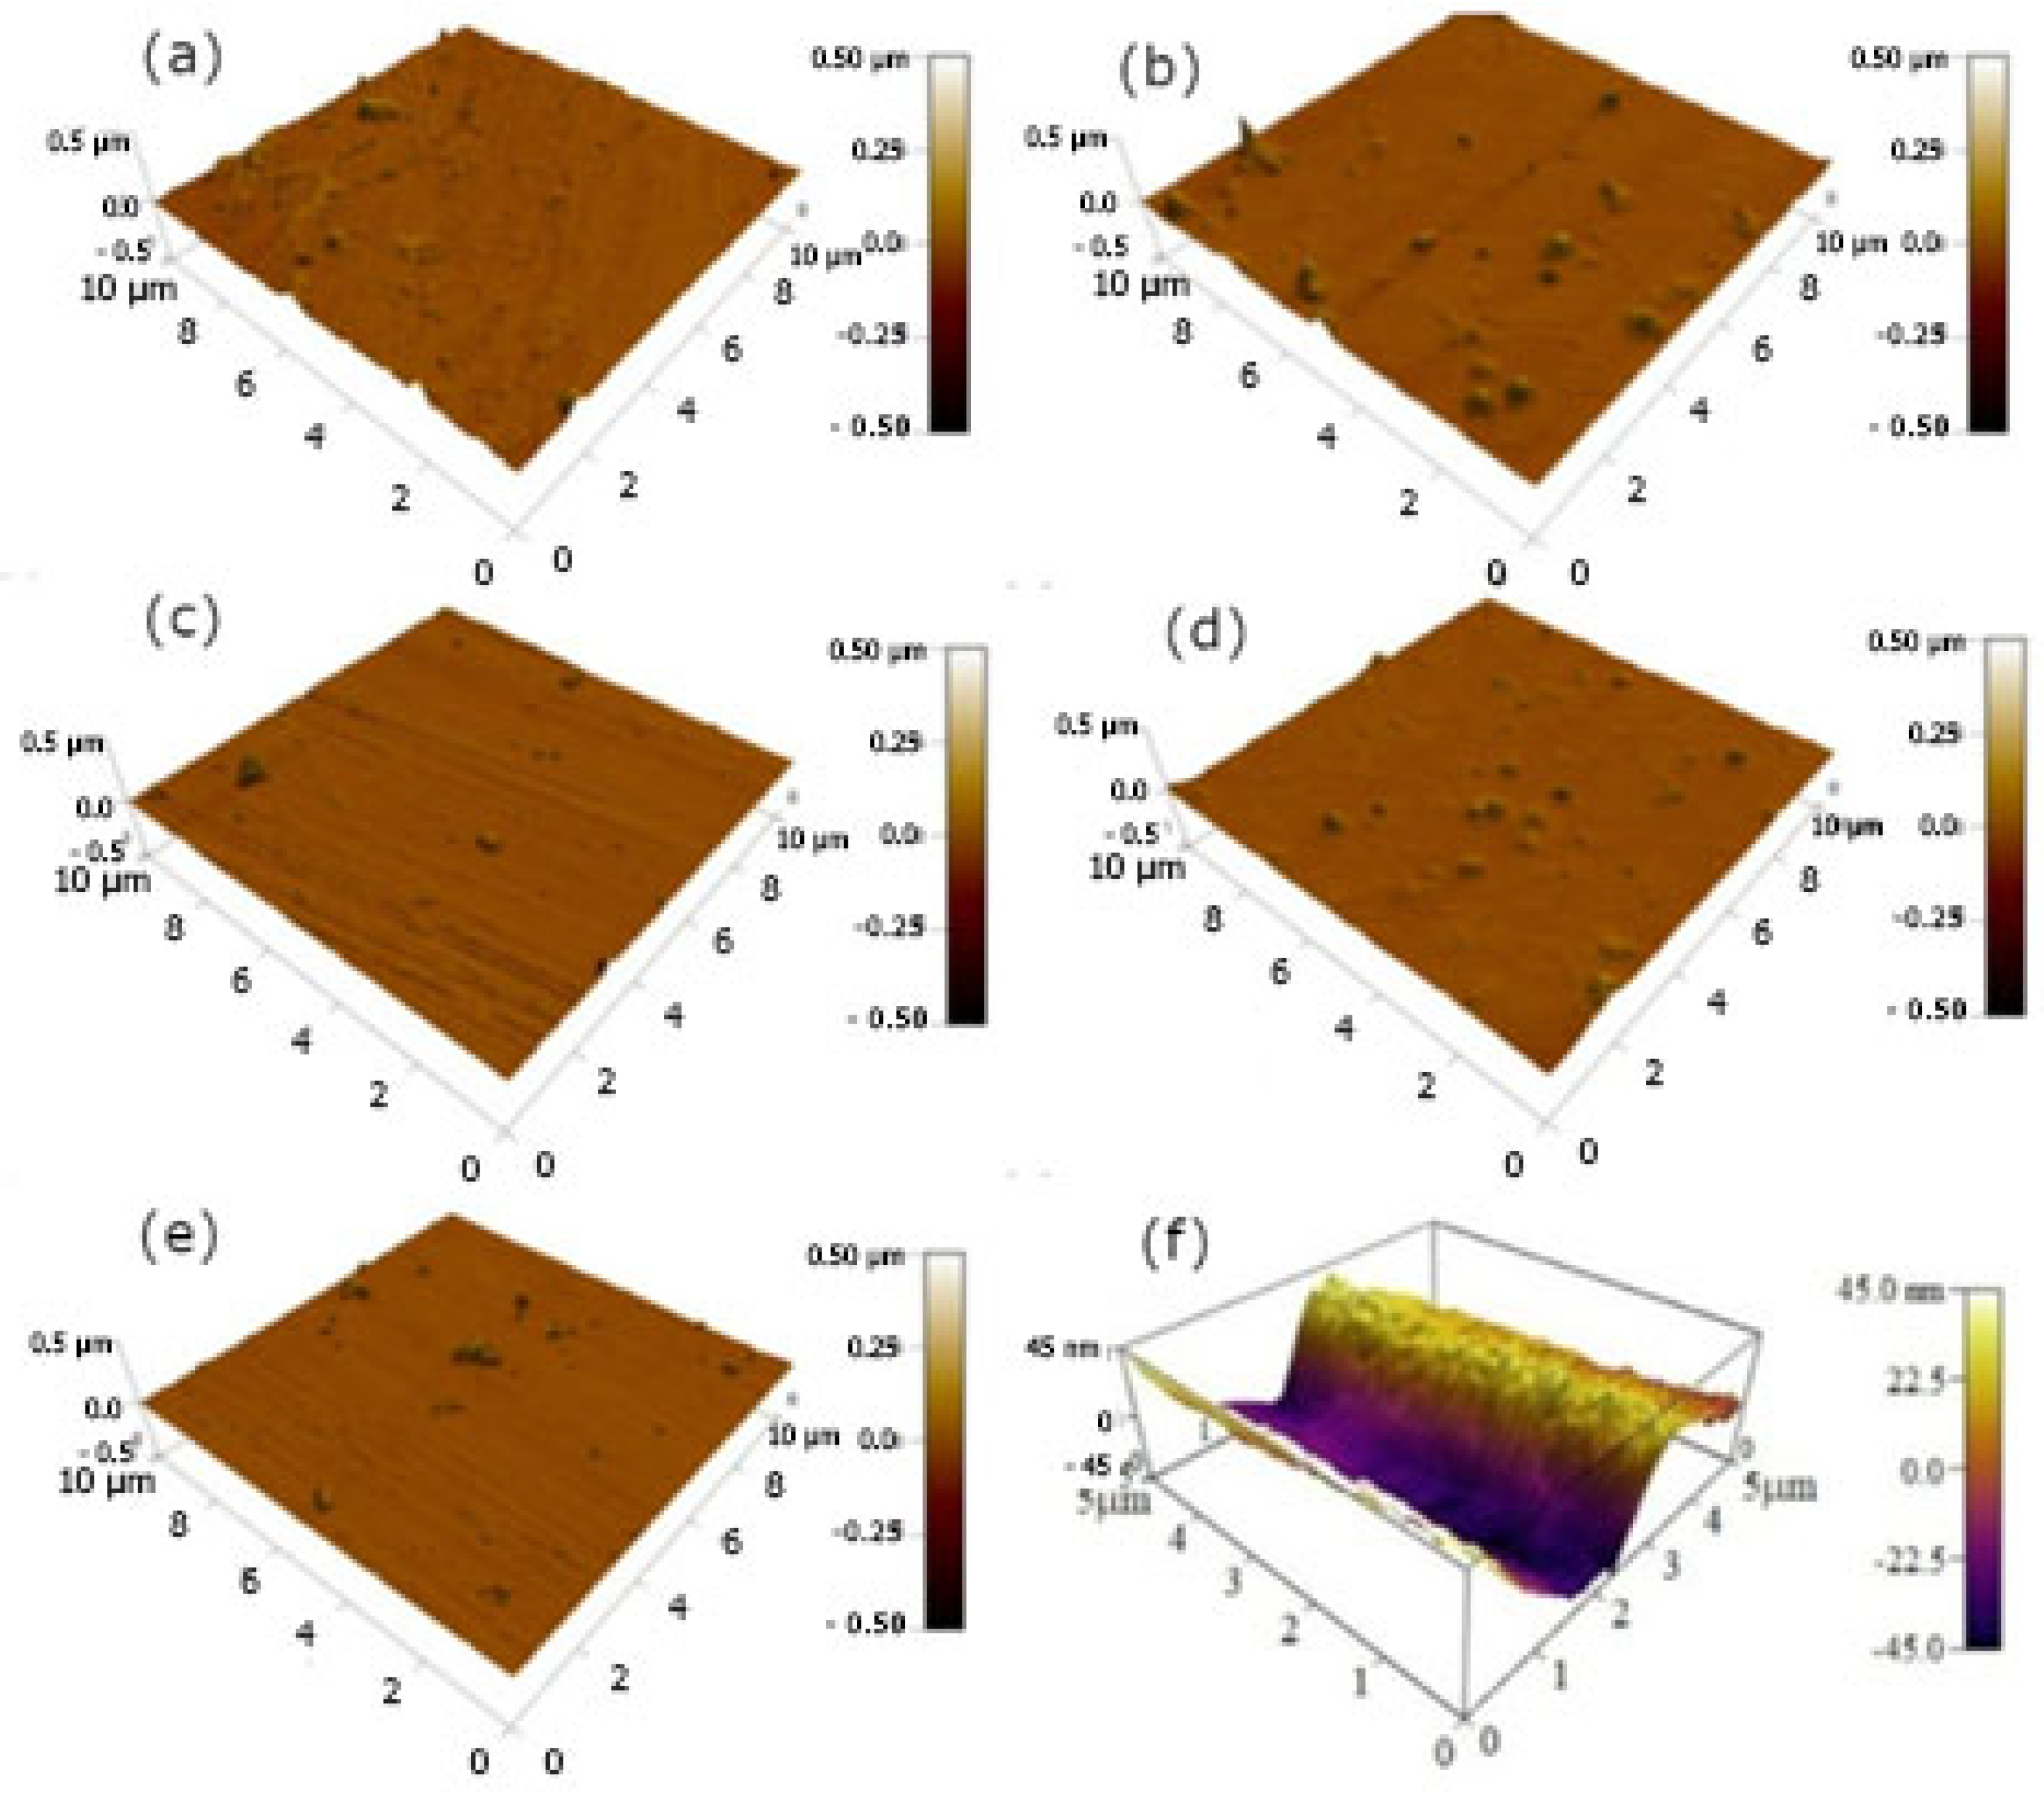
The AFM 3D-surface plots including roughness analysis of samples A, B, C, D, and E, as well as the substrate, are presented in
Figure 4. It is obvious that following coating, the surface roughness decreases (compared to the uncoated sample (S0)), which can be attributed to the effect of the slow spraying rate during the sample coating process [
24]. More specifically, the surface roughness of the different samples was measured at: R
aA = 9.1 nm, R
aB = 8.5 nm, R
aC = 5.5 nm, R
aD = 7.5 nm, R
aE = 7.1 nm, and R
AS0 = 38.1 nm. The corresponding height diagrams show the macro-roughness of the respective surfaces in which micro-roughness is also observed, which cumulatively satisfies the requirement of hydrophobic behavior for the commercial coatings.
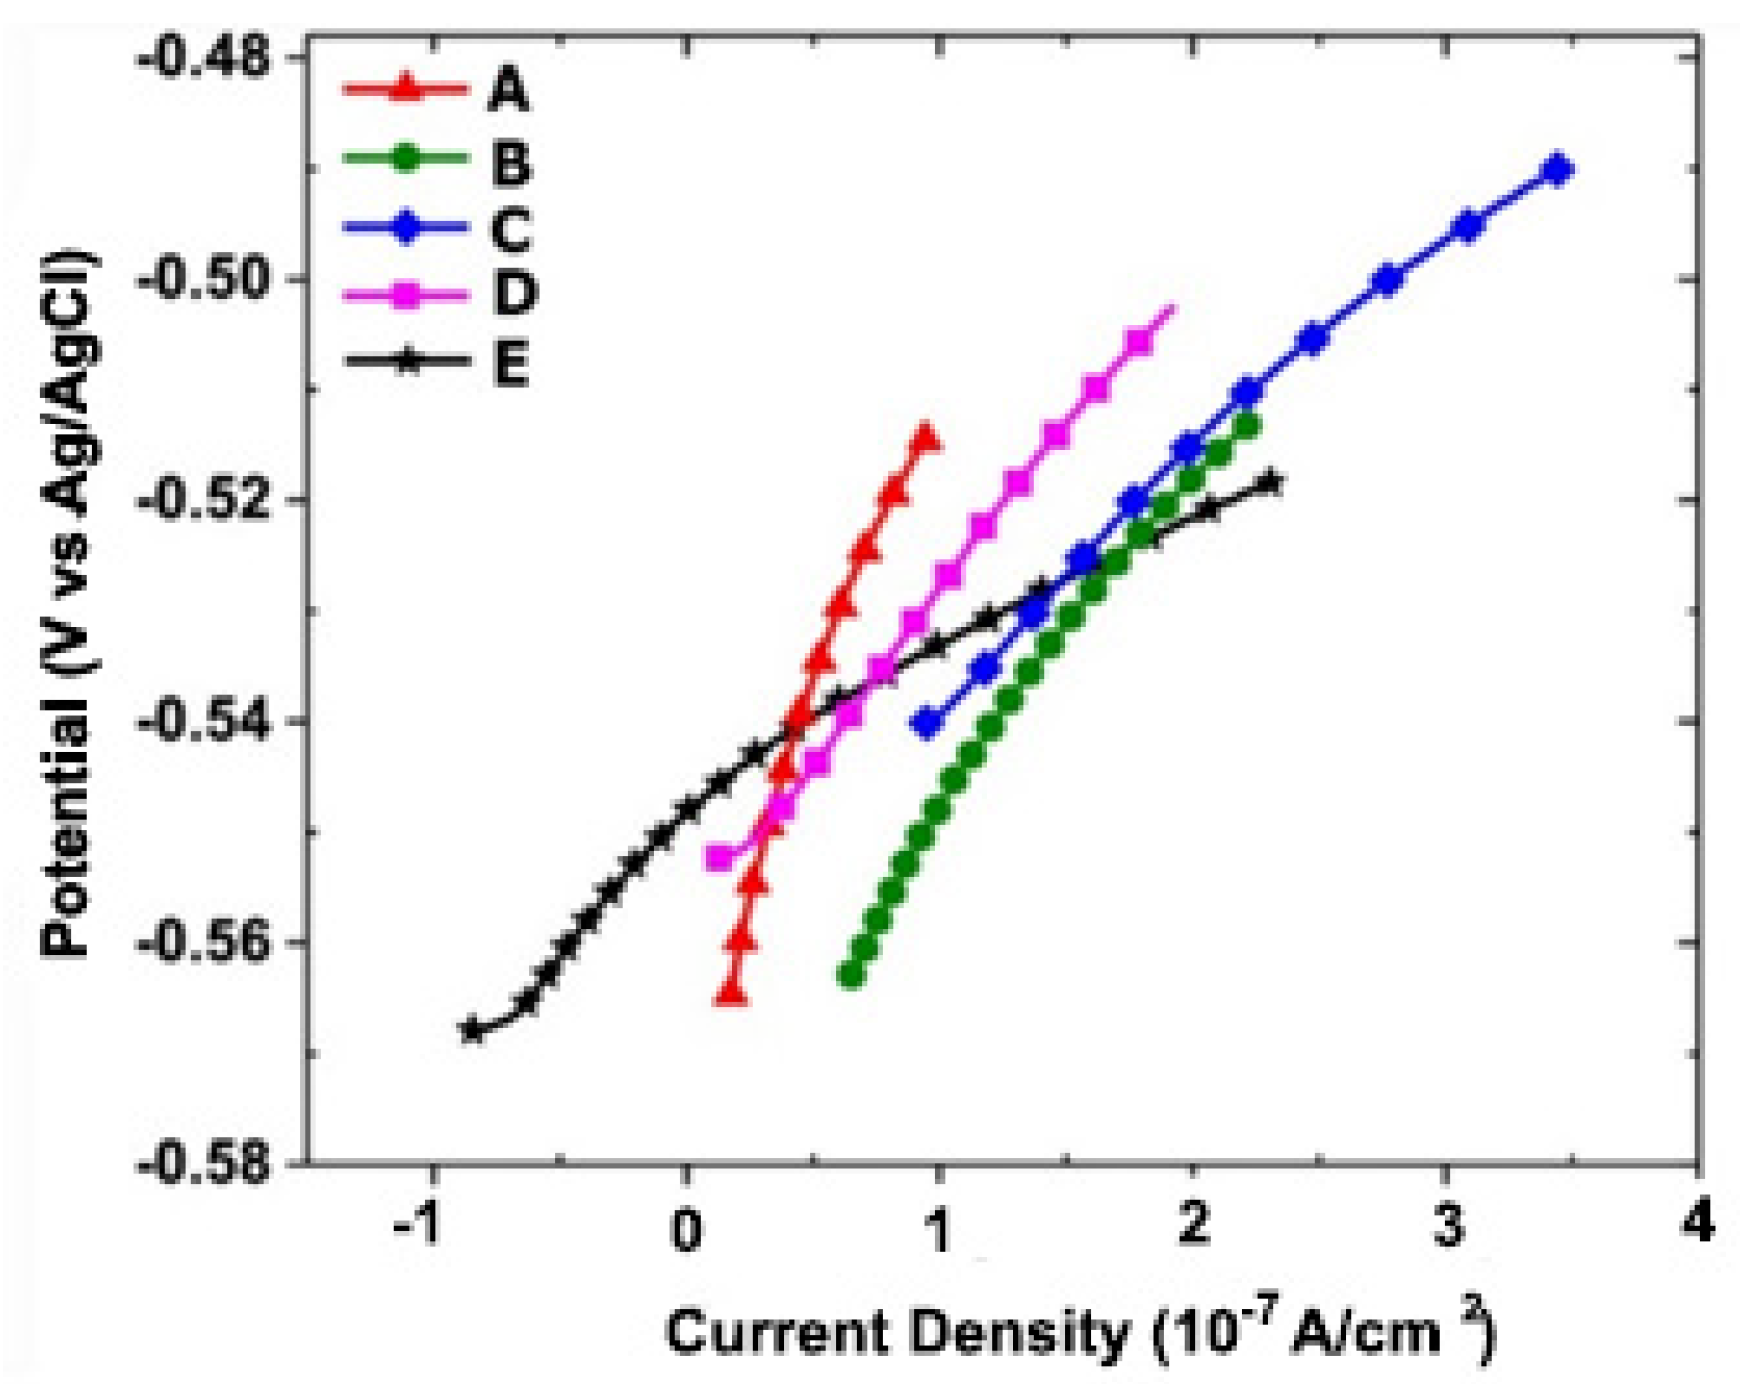
The effect of the antifouling coating’s composition on the electrochemical corrosion behavior of the coated samples was investigated in 0.6 M NaCl solution. The linear polarization curves (LPR) are presented in
Figure 5. The polarization resistance (R
p) is calculated from the slope of the current density graph according to the Stern-Geary equation [
25] (
Table 4).
From the LPR curves, it is clear that sample A (598 Ω cm
2) has the highest polarization resistance. It is followed by sample B with 300 Ω cm
2, C with 251 Ω cm
2, D with 221 Ω cm
2, and E with 142 Ω cm
2. Given that Rp is inversely proportional to the corrosion rate, sample A (with the highest polarization resistance) is expected to exhibit the lowest corrosion rate in real harbor conditions [
26].
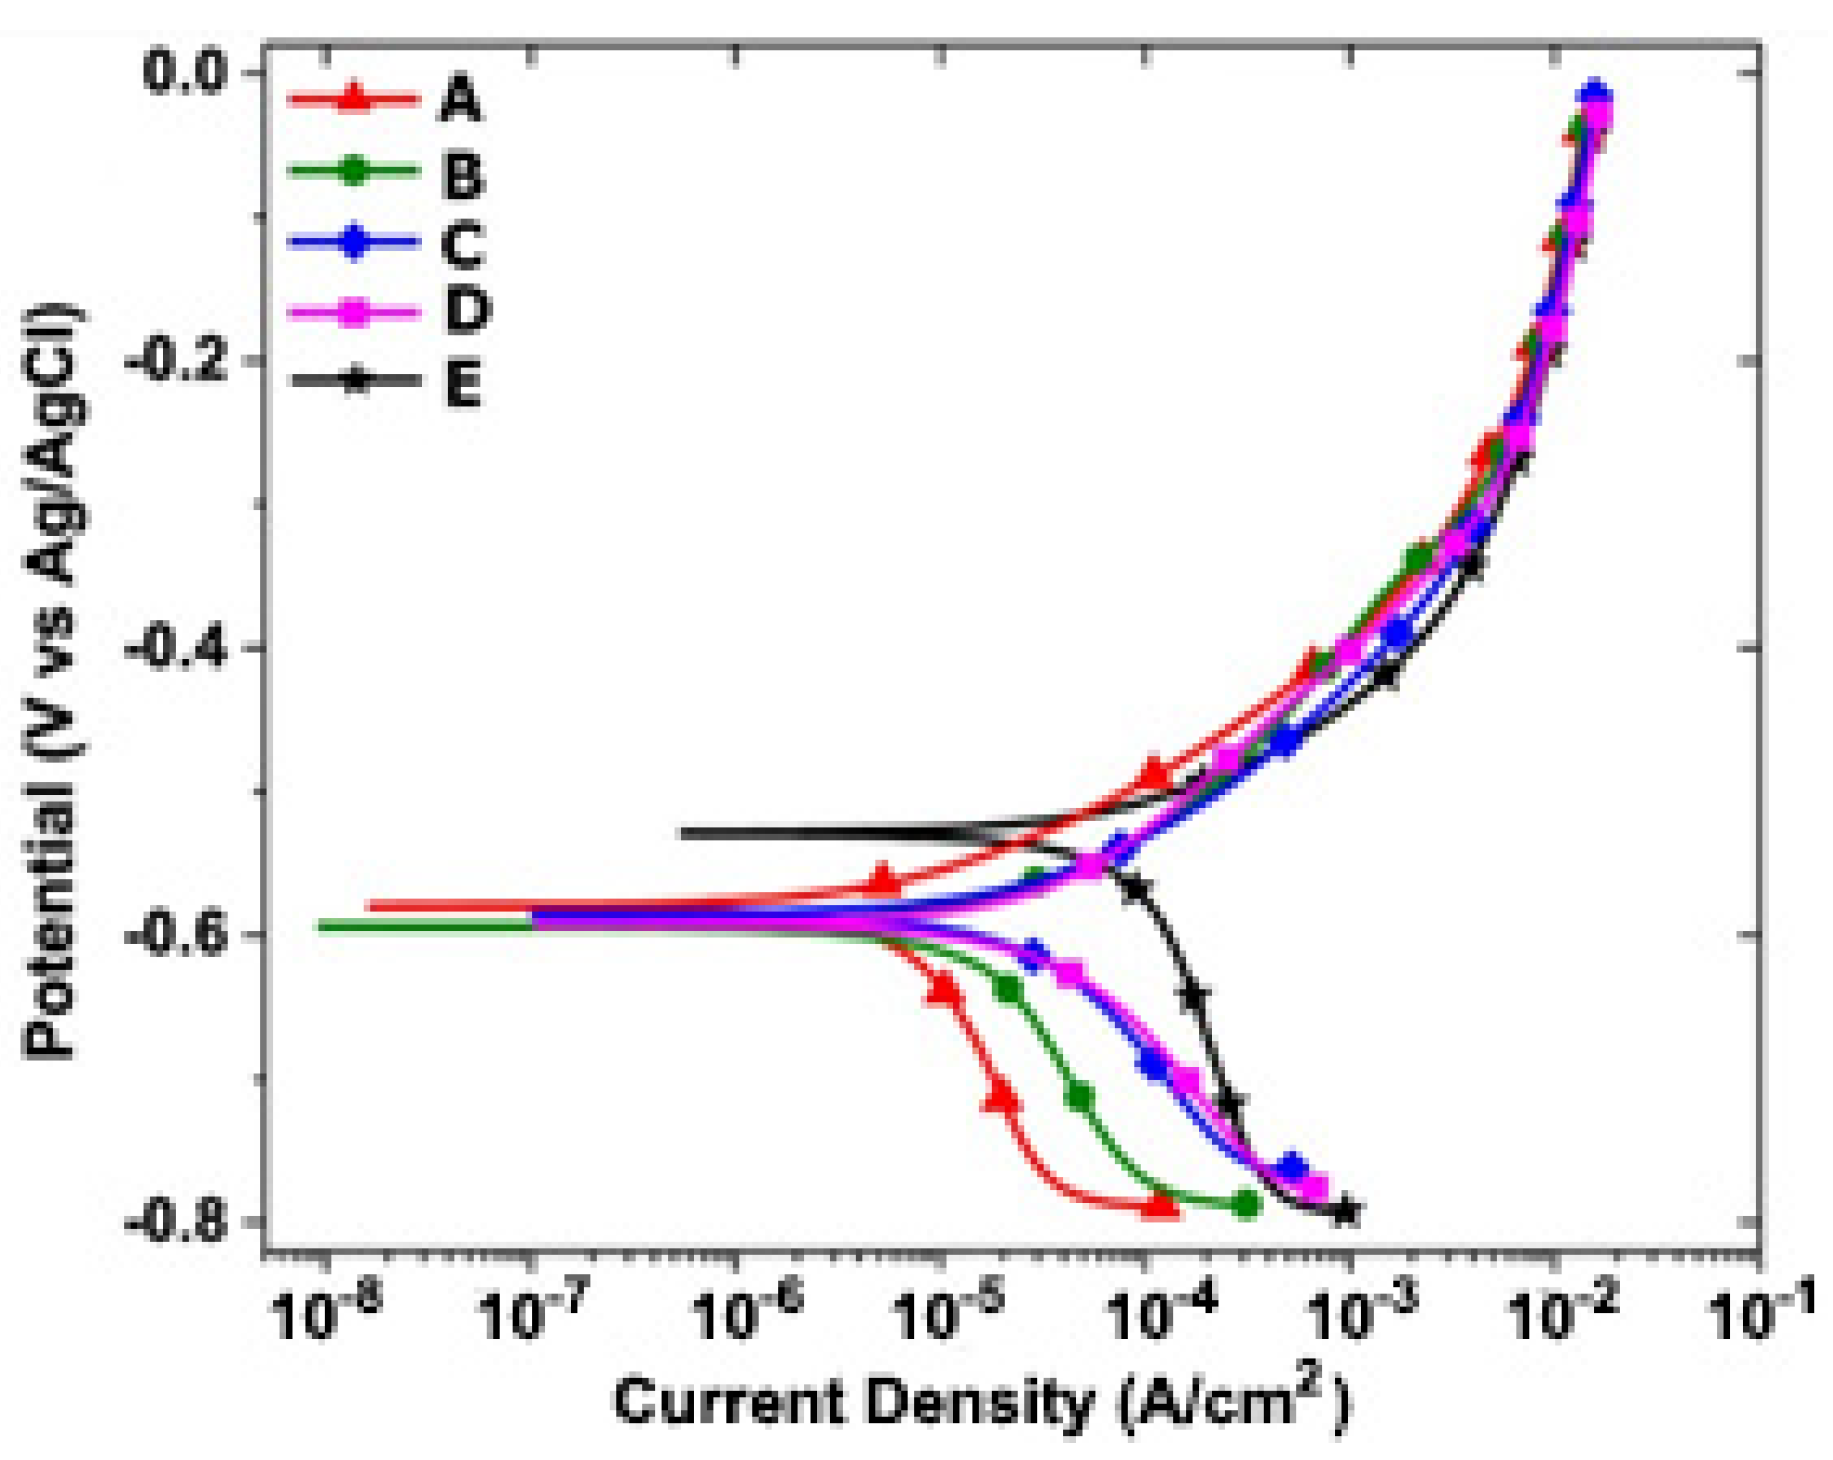
The potentiodynamic polarization curves of the samples are shown in
Figure 6. Using the Tafel slope fitting technique [
27], the anodic (β
a) and the cathodic (β
c) Tafel constants can be determined, as well as the corrosion potential (
Ecorr) and the corrosion current density (
Icorr). In addition, the corrosion rate (CR) can be estimated from the values of I
corr according to Faraday’s law. The determined parameters are summarized in
Table 4.
The PDP curves of samples A, B, C, and D are shifted to the left, i.e., at a lower current density, with sample B demonstrating the lowest current density value. In addition, the corrosion potential (Ecorr) values for the above samples were lower compared to the E samples. Therefore, the coated E samples are expected to have a higher corrosion tendency. The corrosion rate, which reveals the corrosion kinetics of samples A, B, C, and D, indicates that these samples had higher resistance to both anodic and cathodic dissolution in 0.6 M NaCl solution. Notably, the CR values are in accordance with the Rp values. Sample E exhibited the highest CR (6.03 mm/yr), indicating that it would have the weakest corrosion protection. In contrast, sample A showed the best corrosion protection properties, as it has the lowest corrosion rate.
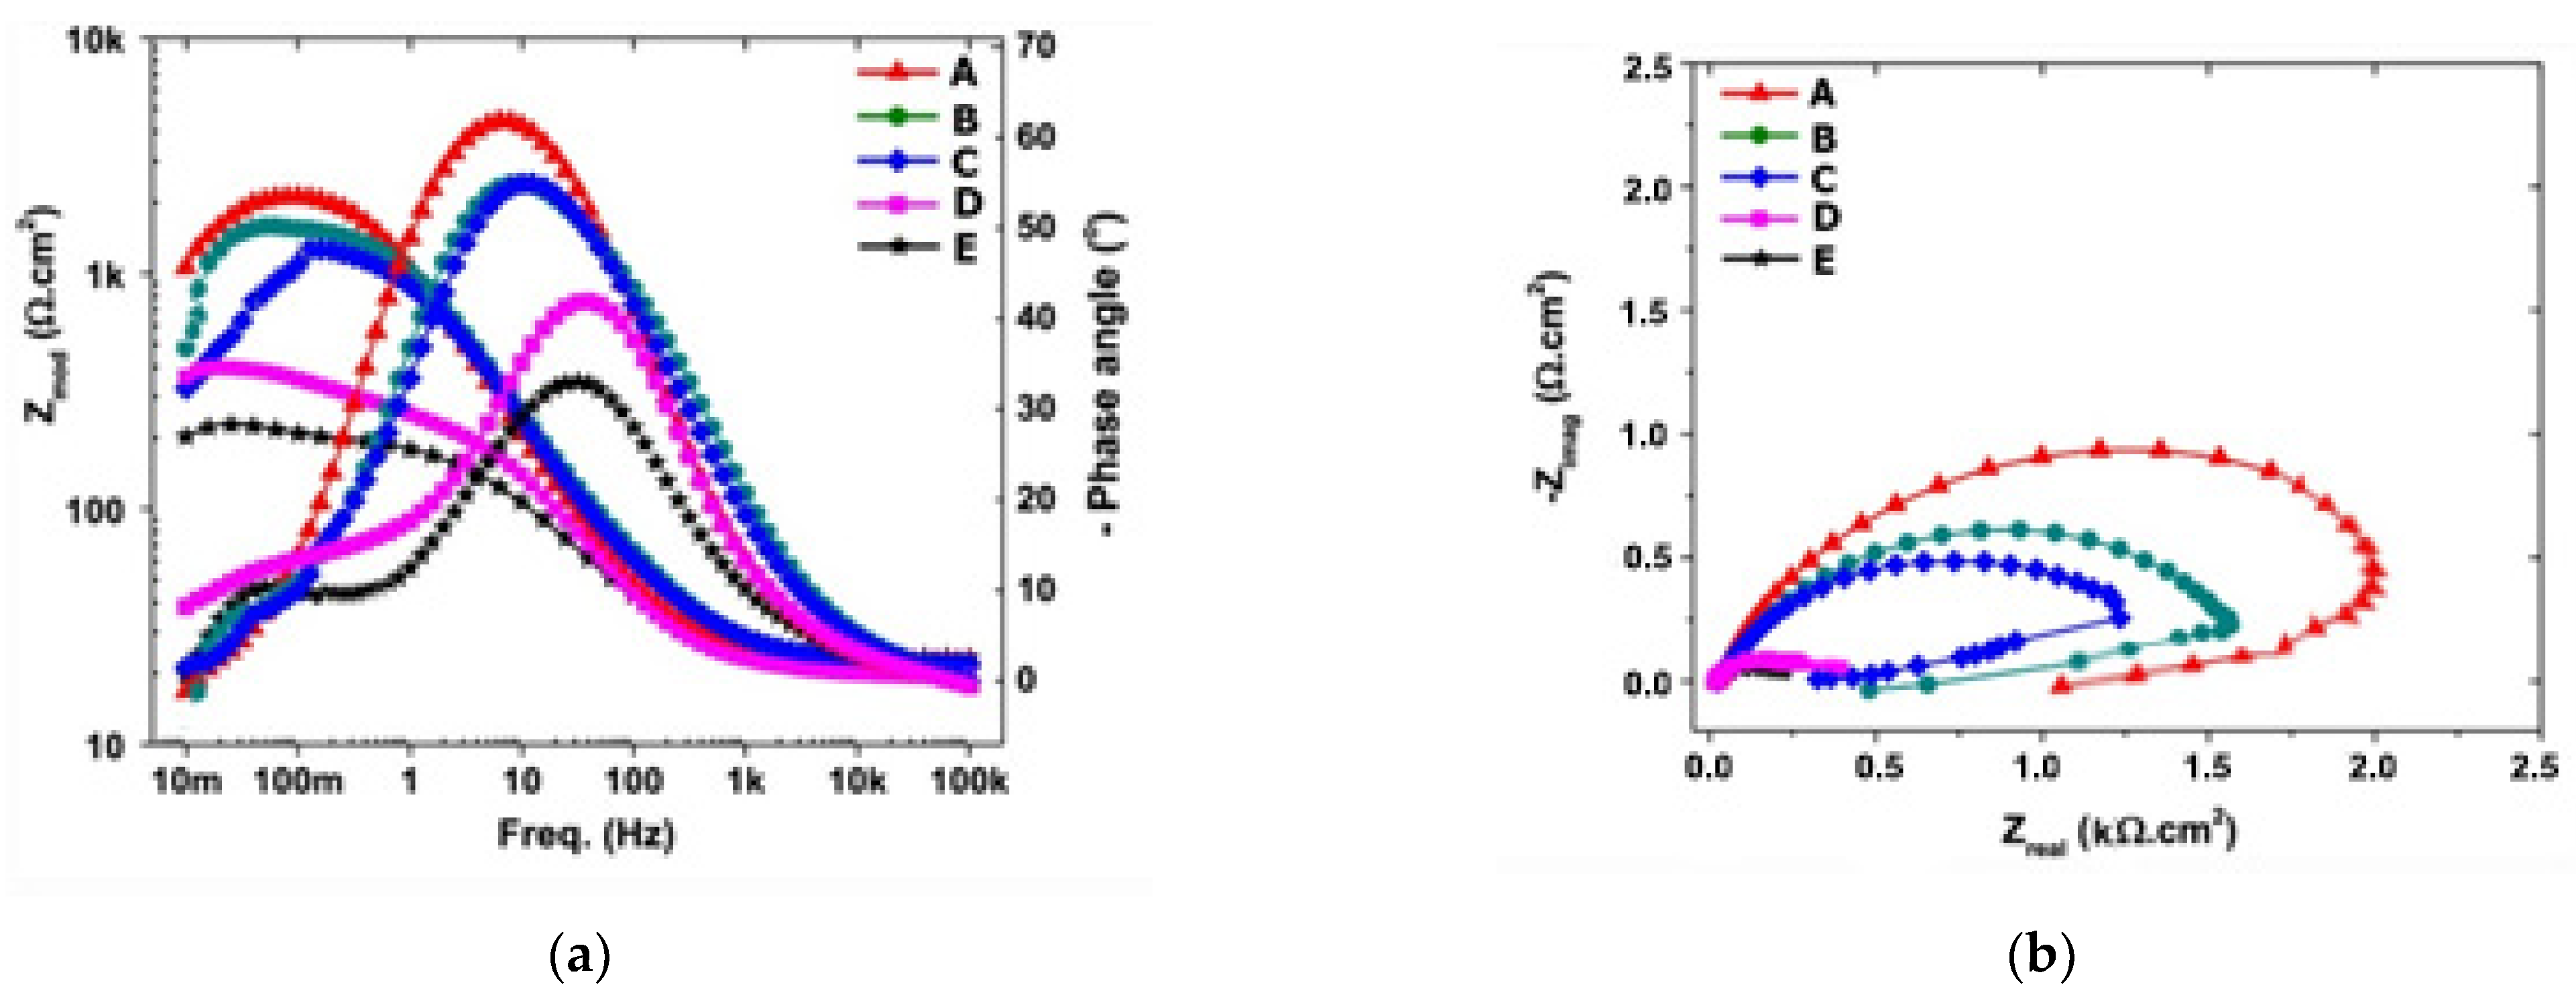
EIS was used to provide further information on the electrochemical behavior of the samples, as this technique provides a qualitative and quantitative understanding of the kinetics and corrosion mechanism. The Bode and Nyquist diagrams of the samples in 0.6 M NaCl solution are shown in
Figure 7a,b, respectively.
The Z mod is inversely proportional to the corrosion rate [
28]. Thus, a large Z mod value indicates a higher charge transfer resistance (R
ct) at the interface between the sample and the electrolyte. Additionally, a larger diameter of the semicircle or capacitive arc of the Nyquist graph is attributed to higher polarization resistance. An enhanced electrochemical behavior can also be estimated from the phase angle diagram, where a wider and higher phase angle diagram shows better stability and improved capacitive behavior over a wide frequency range. From the qualitative evaluation of these three EIS parameters (absolute resistance, Nyquist semicircle, or capacitive arc diameter and phase angle), the samples were evaluated for their corrosion resistance.
Sample E exhibited the lowest Z mod, the lowest phase angle, and the smallest diameter of the Nyquist semicircular diagram. On the contrary, sample A demonstrated the highest Z mod, the lowest phase angle, and the largest diameter of the Nyquist semicircular pattern. These EIS quality parameters proved the enhanced anti-corrosion behavior of sample A. Therefore, the samples can be sorted in descending order: A > B > C > D > E.
In order to compare the electrochemical properties and the corrosion resistance of the samples, EIS data were used to estimate the optimum equivalent circuit (EC). The EC consists of a constant phase element, which represents the capacitance of the electrical double layer (CPE
dl), in parallel with the load transfer resistance (R
ct). Both CPE
dl and R
ct are connected in parallel with an inductive element (L) to consider the inductive behavior of the samples. The resistance of the solution (R
u) is connected in series with the element L. The obtained EIS parameters are presented in
Table 5.
The Rct results represent the resistance of the coating to the entry of corrosive species from the electrolyte. The Rct value of A paint was the highest, and the results gradually decreased, with sample E exhibiting the lowest value. These values are compatible with the corrosion resistance rating obtained from LPR and PDP measurements.
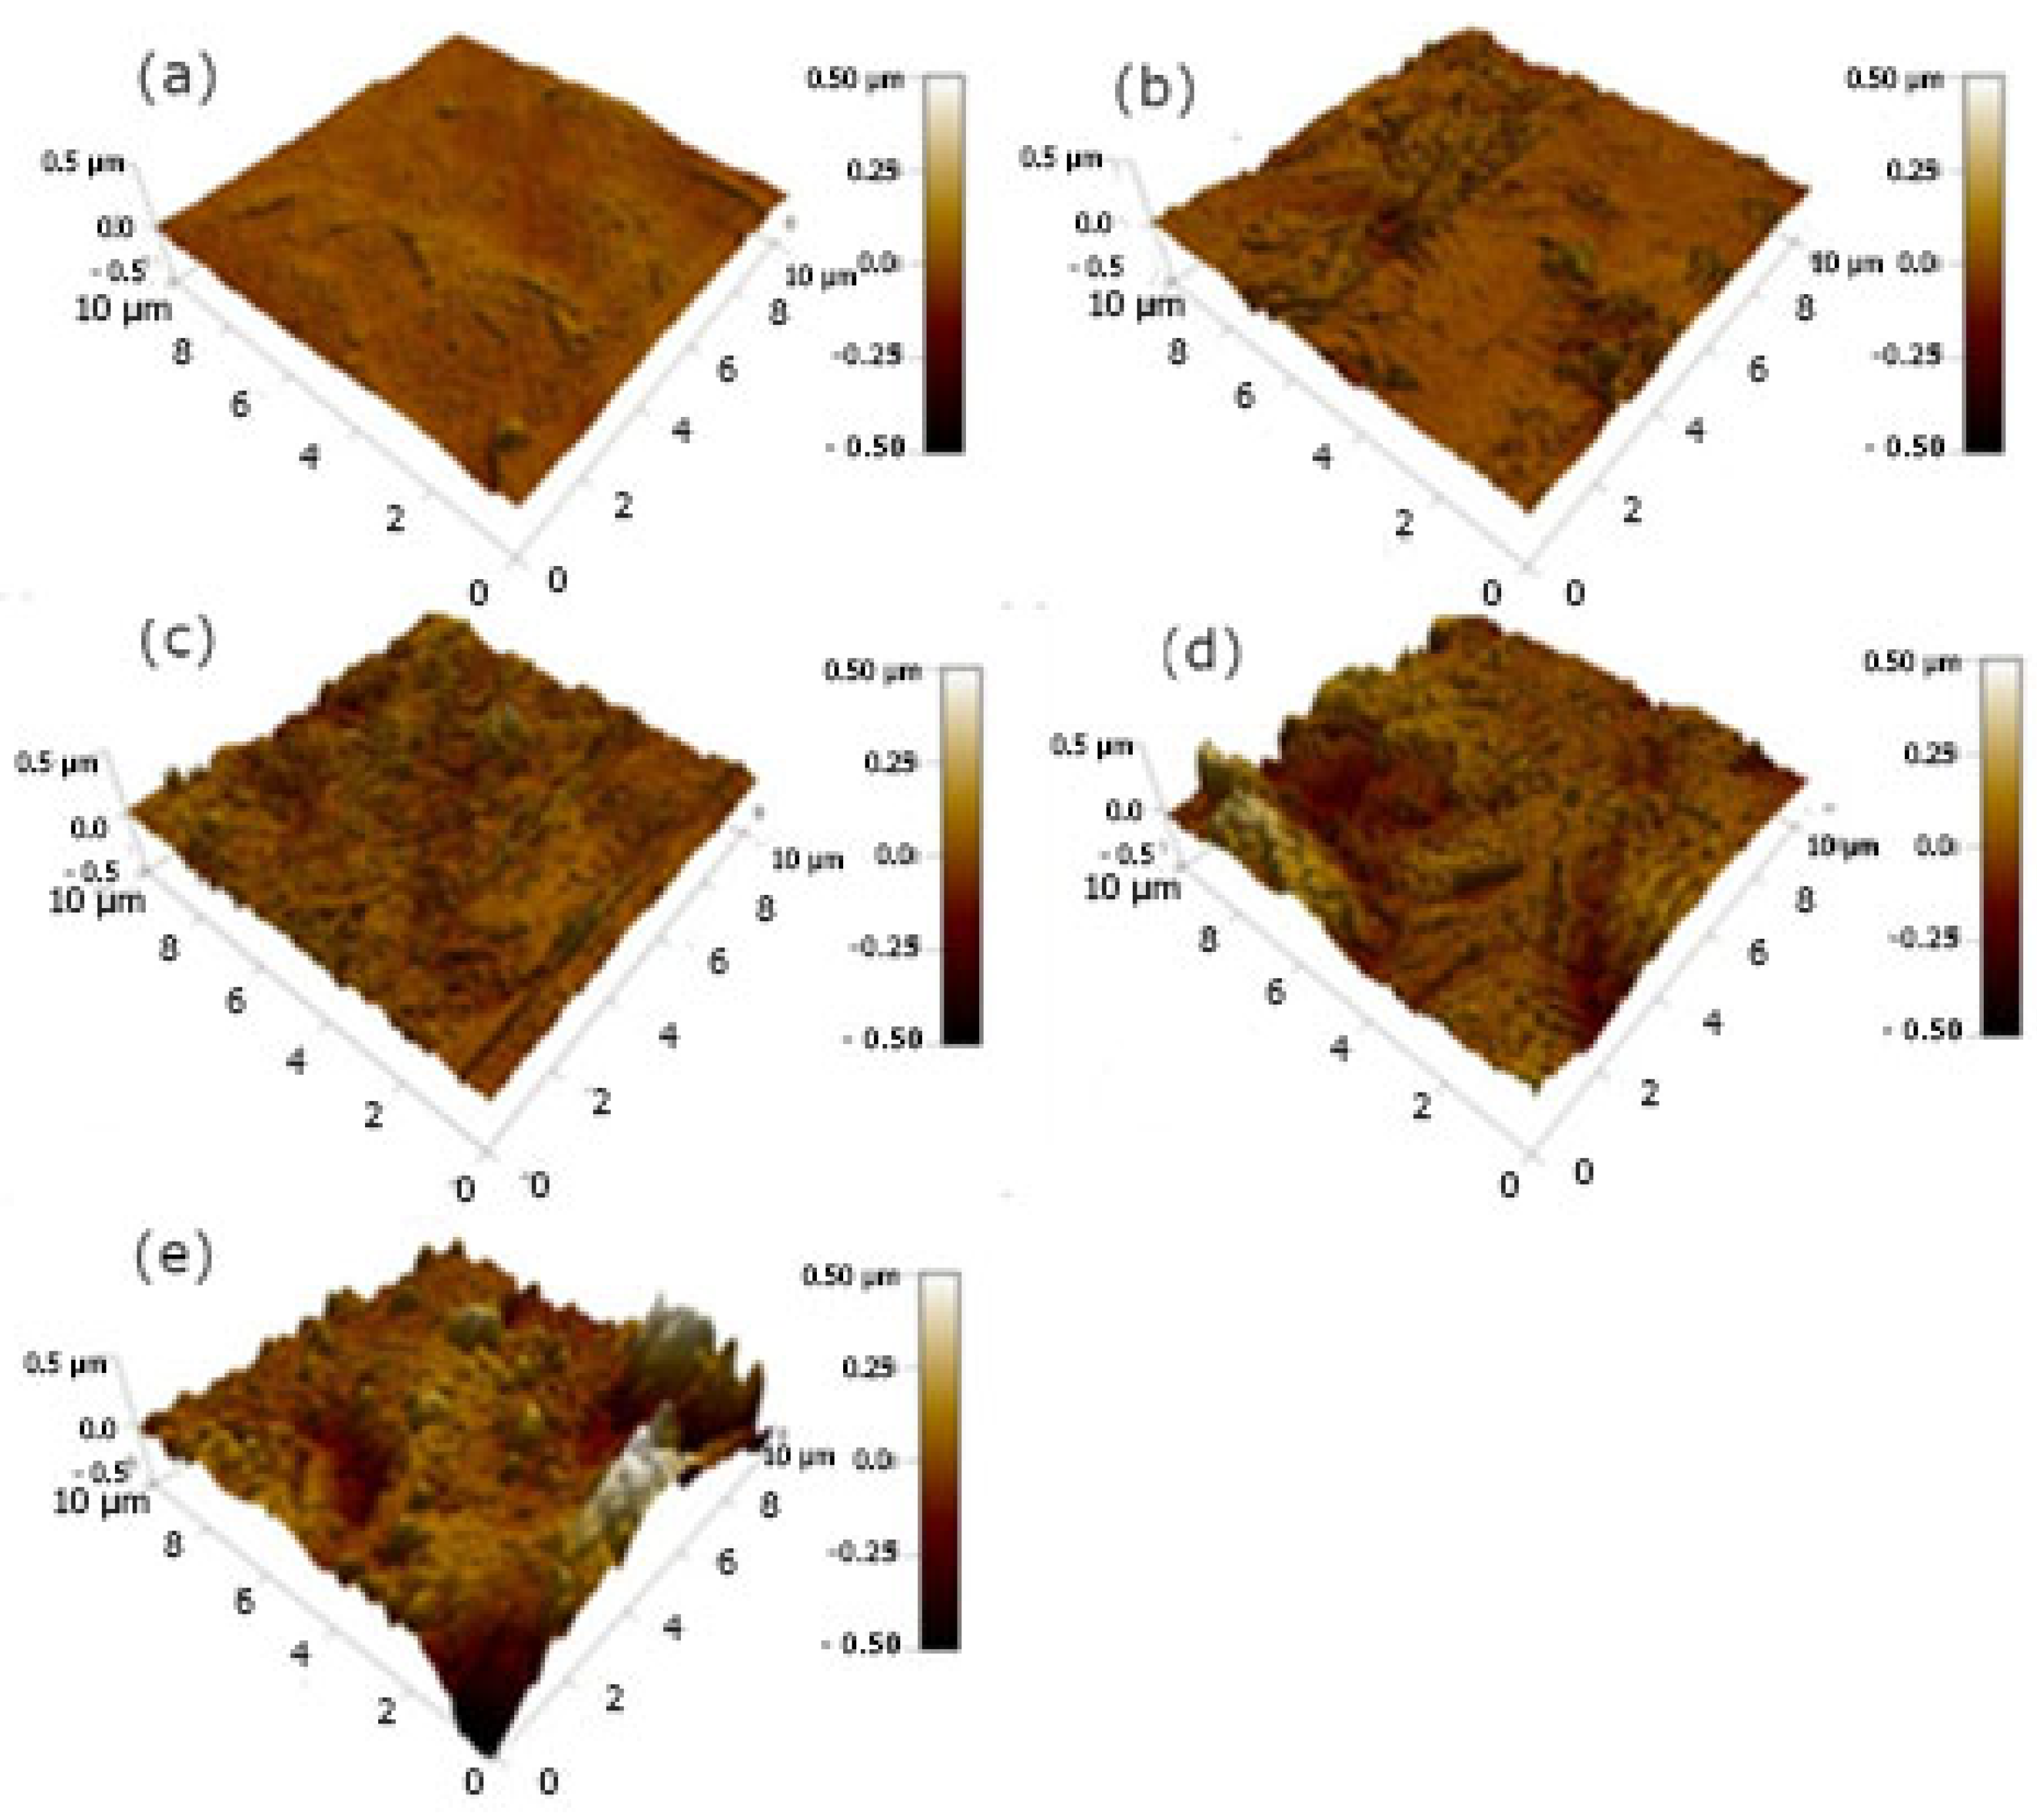
Surface texture and post-corrosion roughness are basic parameters used to assess the degree of corrosion protection. A rougher surface after immersion in a corrosive environment usually indicates active dissolution of the metal or alloy in the electrolyte. It can be used to qualitatively measure the severity of corrosion depending on the extent of roughness. Therefore, the surface profile and the roughness of the exposed surface in the 0.6 M NaCl solution were evaluated by atomic force microscope (AFM).
Figure 8 shows the 3D AFM images of the roughness of the surface of the steel samples after immersion for 1 h in a corrosive medium before the corrosion test. It was observed that the surface roughness increased for all samples after corrosion, although to a different degree. Sample E, which showed the highest corrosion rate based on LPR, PDP, and EIS results, exhibited the highest increase in surface roughness from 10 nm before corrosion, up to about 80 nm after corrosion exposure. Sample A, which had the lowest corrosion rate as determined by the test methods, exhibited a slight increase in surface roughness after corrosion, at about 20 nm from its initial value of 9 nm. Interestingly, the surface roughness of the samples after the corrosion test was in the order: A < B < C < D < E. This order was in agreement with the corrosion resistance rating of the samples, and thus it was found that Sample A demonstrated the best anti-corrosion performance.
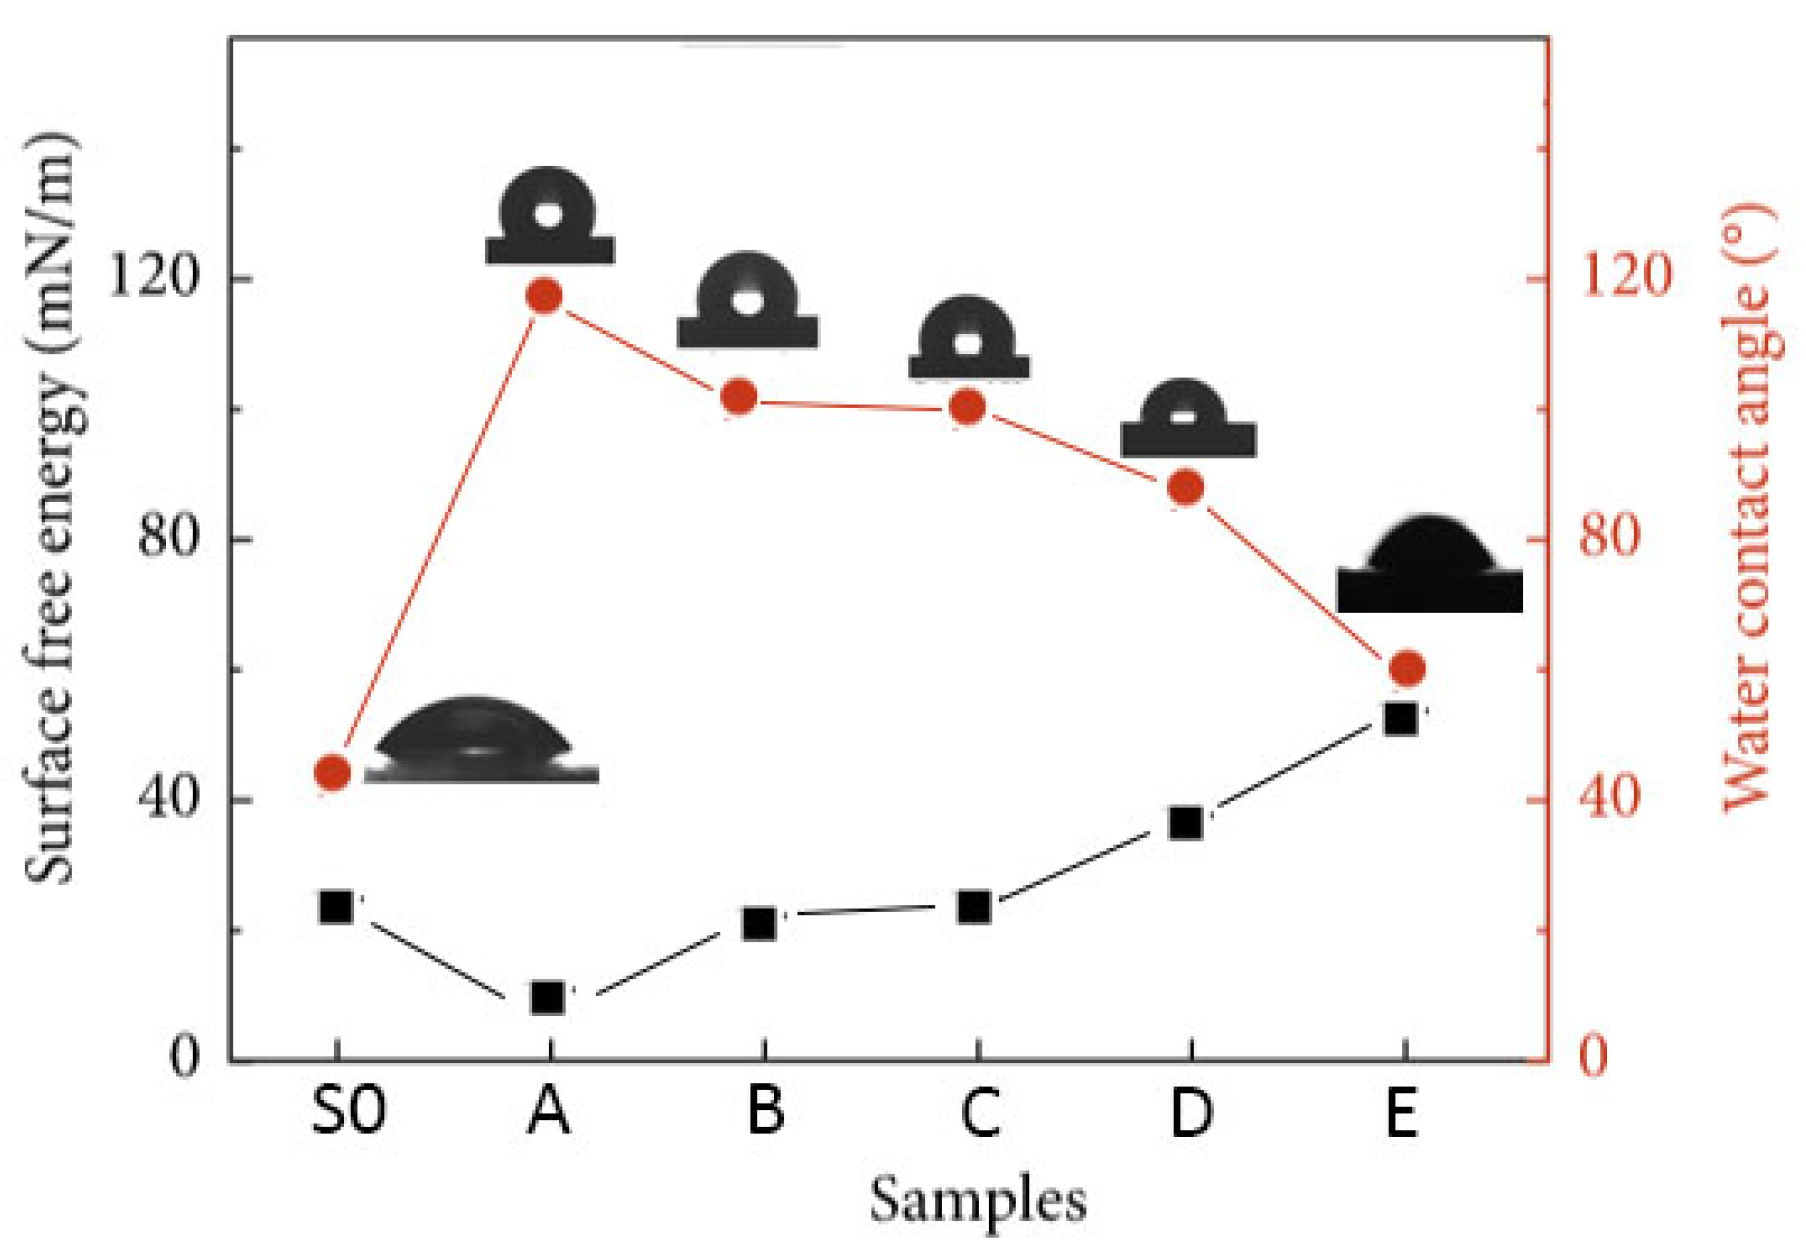
It is important to study the effect of surface free energy and work of adhesion according to the equation of Neumann and Young [
29]:
In which the variables
θ and
γsV are the contact angle of the sample and the surface free energy of the substrate, respectively. Constant
γ1V is the surface tension of water (72.0 mJ/m
2) and β is 0.0001247 ± 0.000010 (mJ/m
2). The calculated results are illustrated in
Figure 9. While the free energy of the surface increases, the adhesion of the coating to the substrate is enhanced. It is clear from
Figure 9 that A is optimal.
The investigation of the corrosion properties of substrate and coated specimens under laboratory conditions was followed by the in-field testing of the panels, which were immersed for 9 months in thirteen different coasts (
Figure 1). In
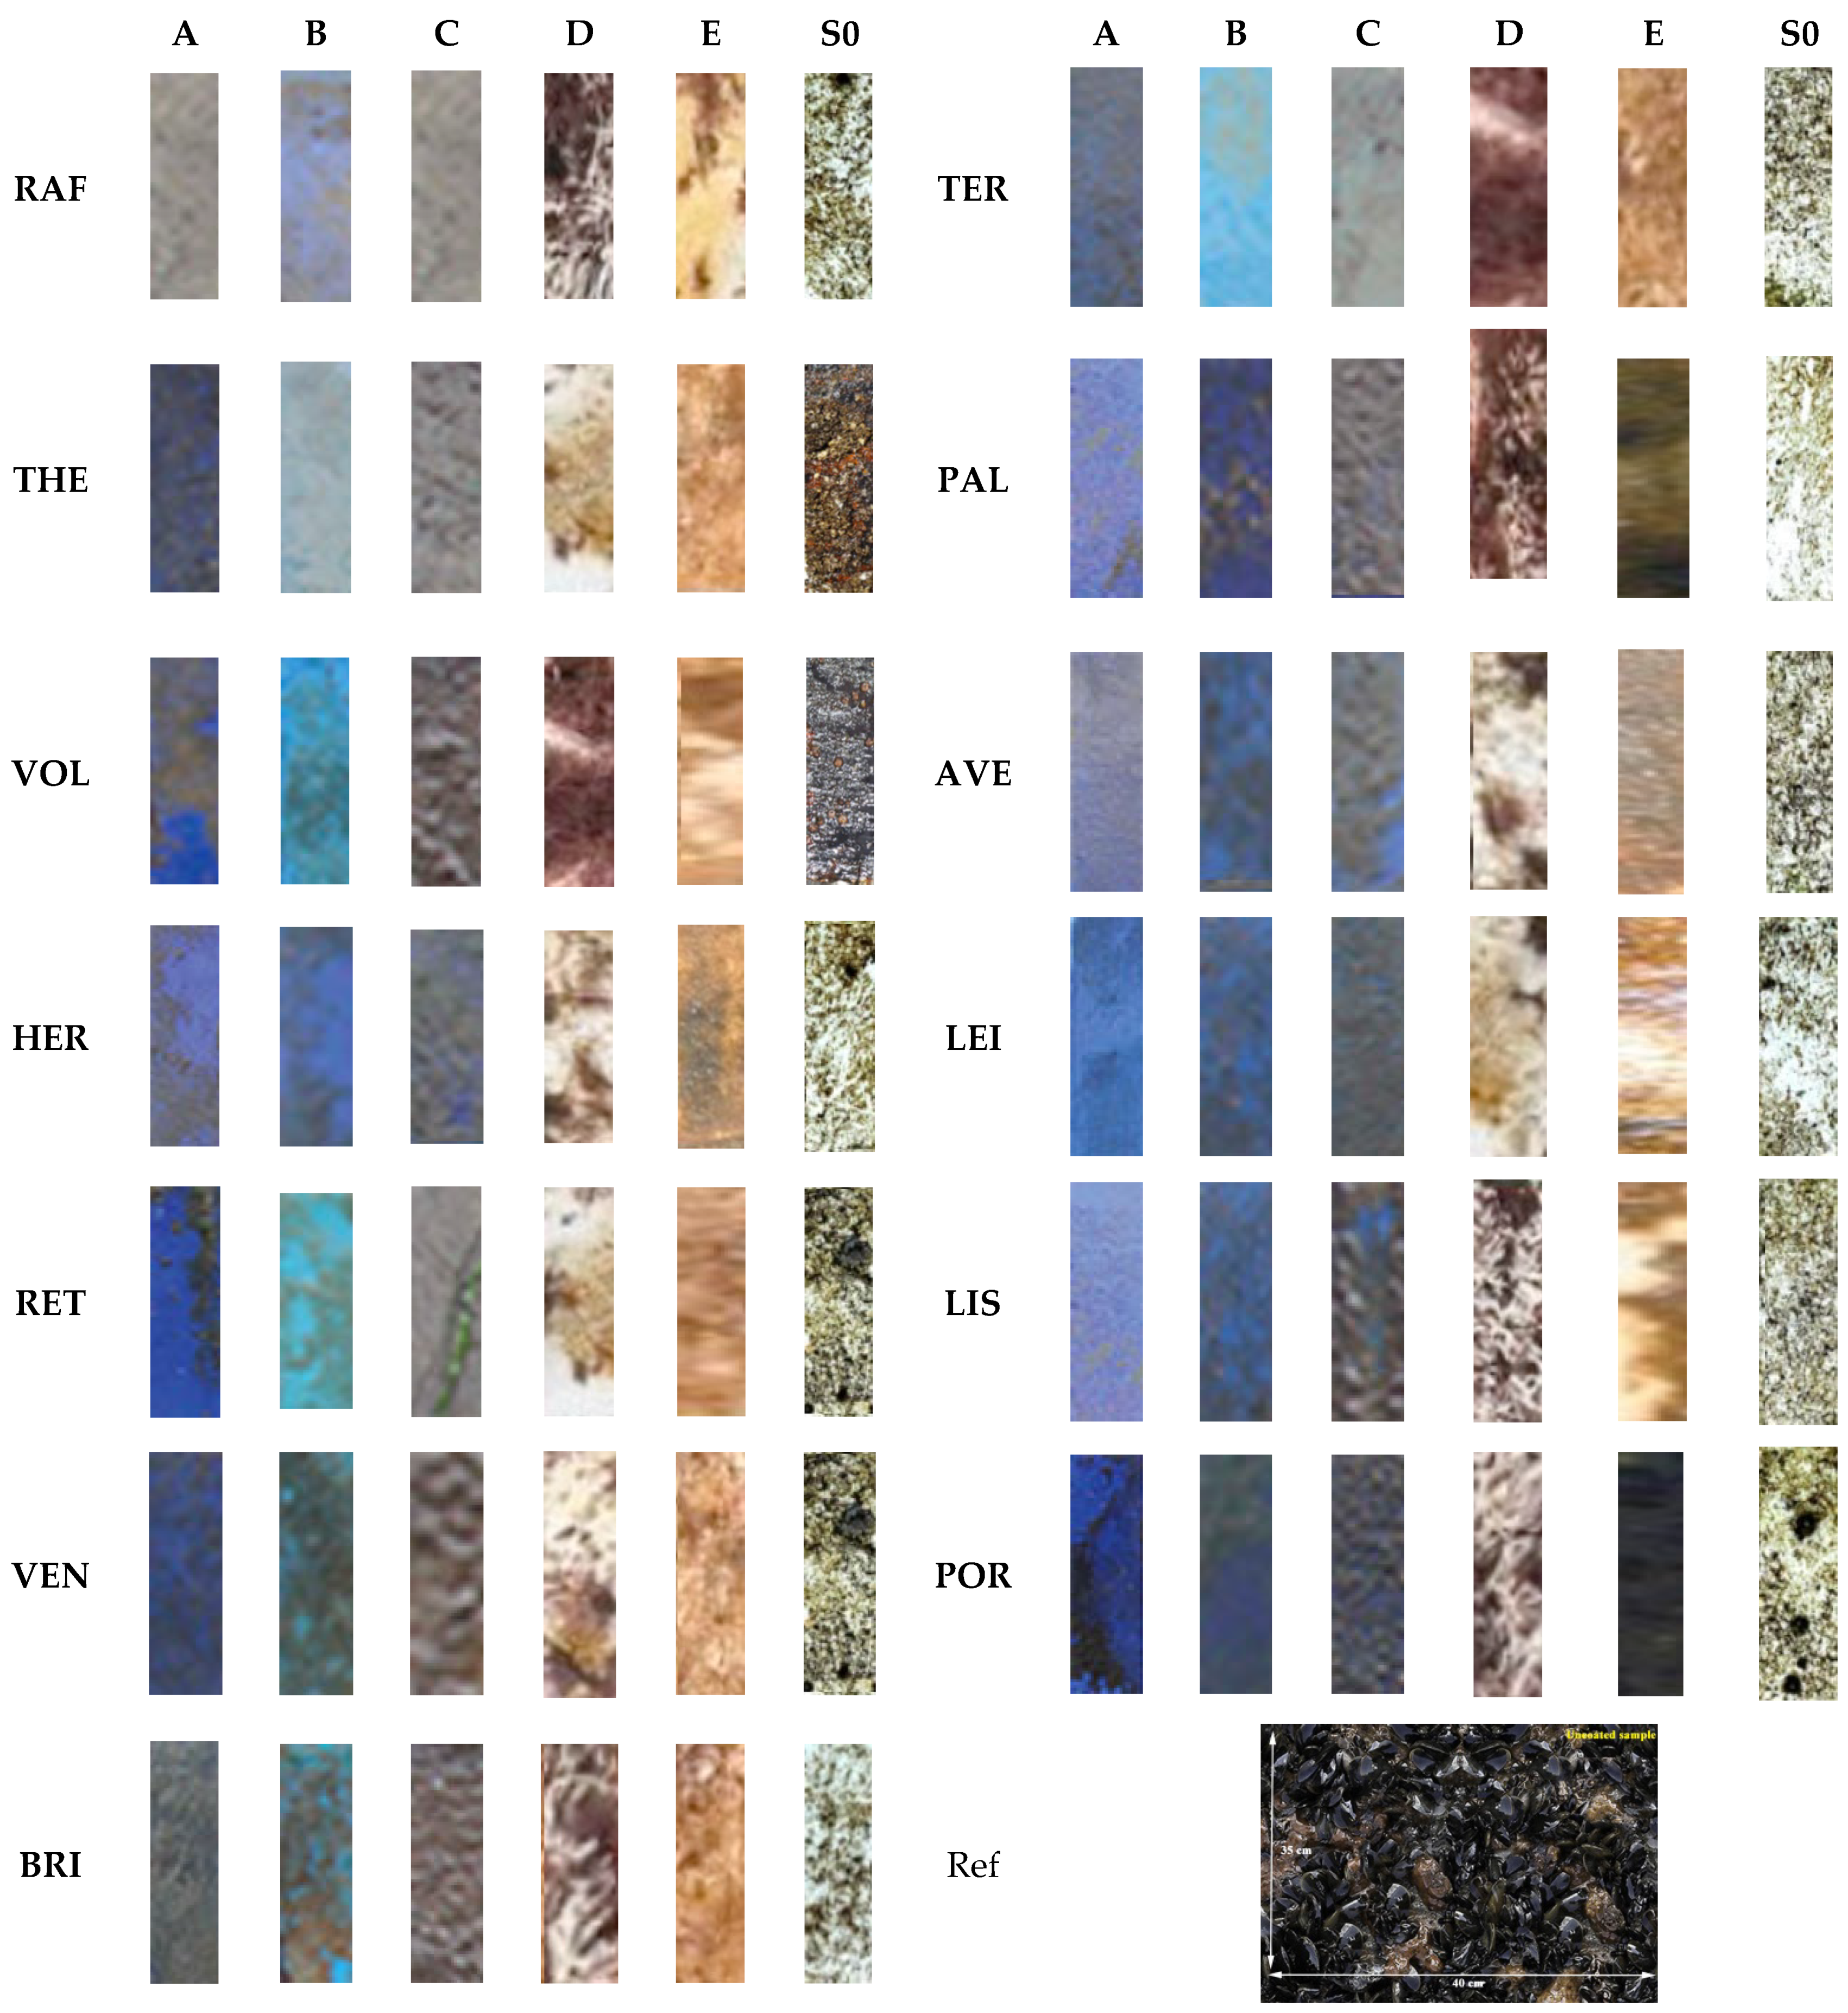
Figure 10, pictures from all the different samples are exhibited, obtained in order to carry out their macroscopic examination.
The visual examination of the panels’ surface, after their 9-month immersion in sea water, showed the gradual adhesion of biofoulers to their surface. The presence of both biofilm and bacterial–algal biofilm was evident in all samples, while bryozoans and tubeworms were present in panels with C and D coating. Coated samples with E paint showed individual macrofoulers (bryozoans, barnacles, ascidians, shellfish, and tube worms). The uncoated samples (S0) were more burdensome, as they presented an increased variety of marine organisms on their surface. However, it is clear that the coated sample A significantly inhibited the deposition of biofoulers in all coasts in which it was immersed.
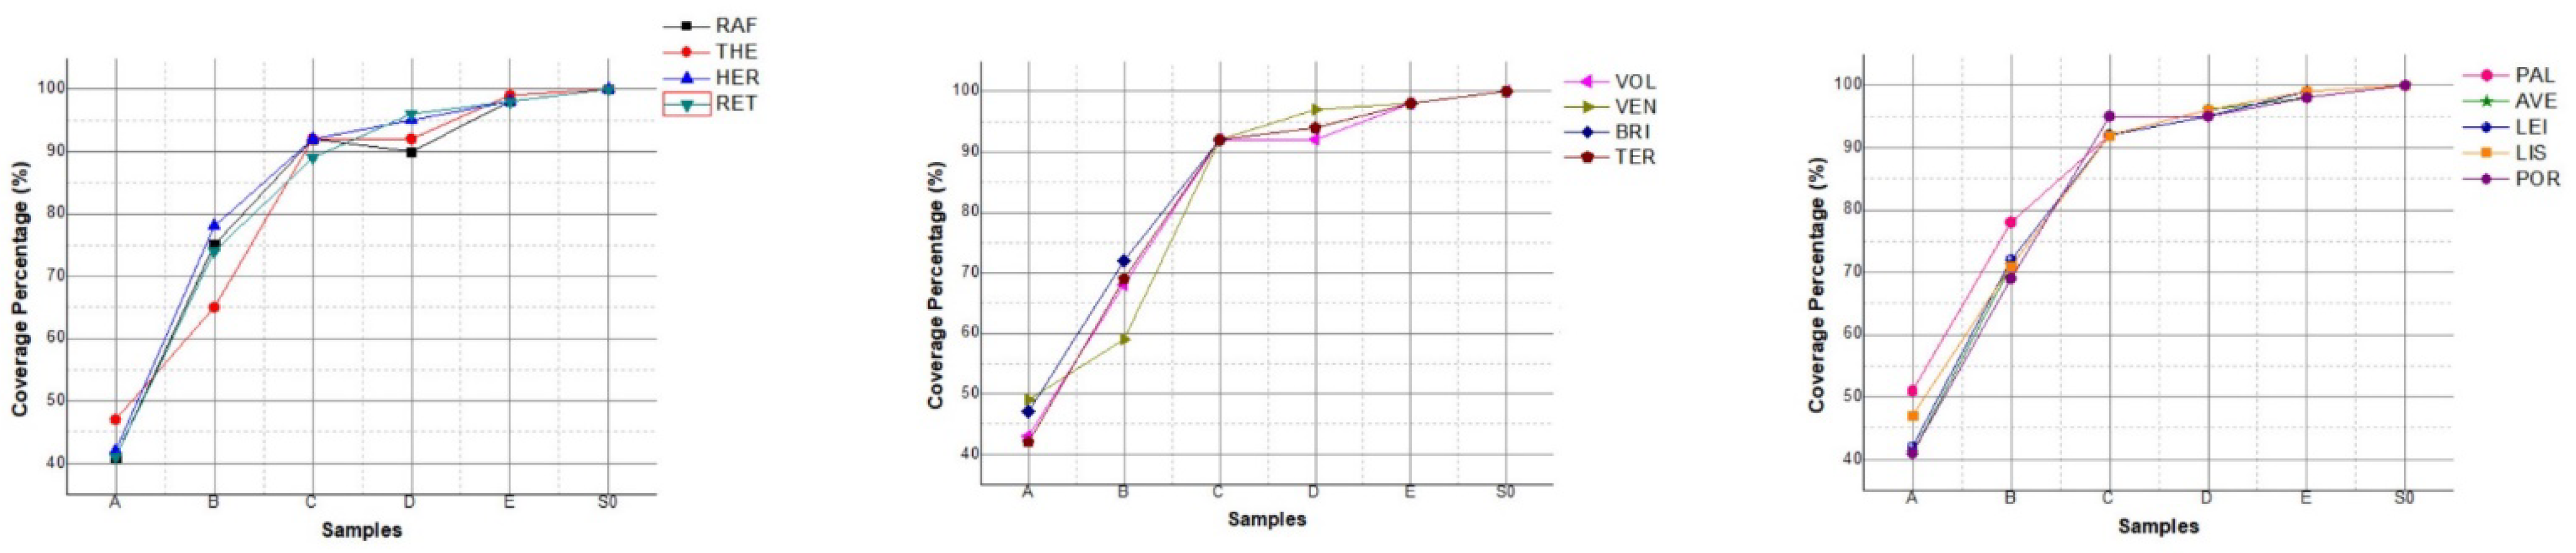
Figure 11 shows the coverage percentage of the coated samples (A, B, C, D, and E) and the uncoated sample (S0) per immersion locations. Compared to the uncoated sample, A showed a significant reduction in fouling coverage (approximately 48%), followed by sample B, with a coverage rate of ~72%. Coated samples C and D were unable to inhibit the deposition of biofilms in the harsh conditions of multi-month static immersion, with their percentage coverage being around 92%. As expected from the results of controlled laboratory corrosion tests, sample E was the least effective in antifouling performance and presented a low efficiency.
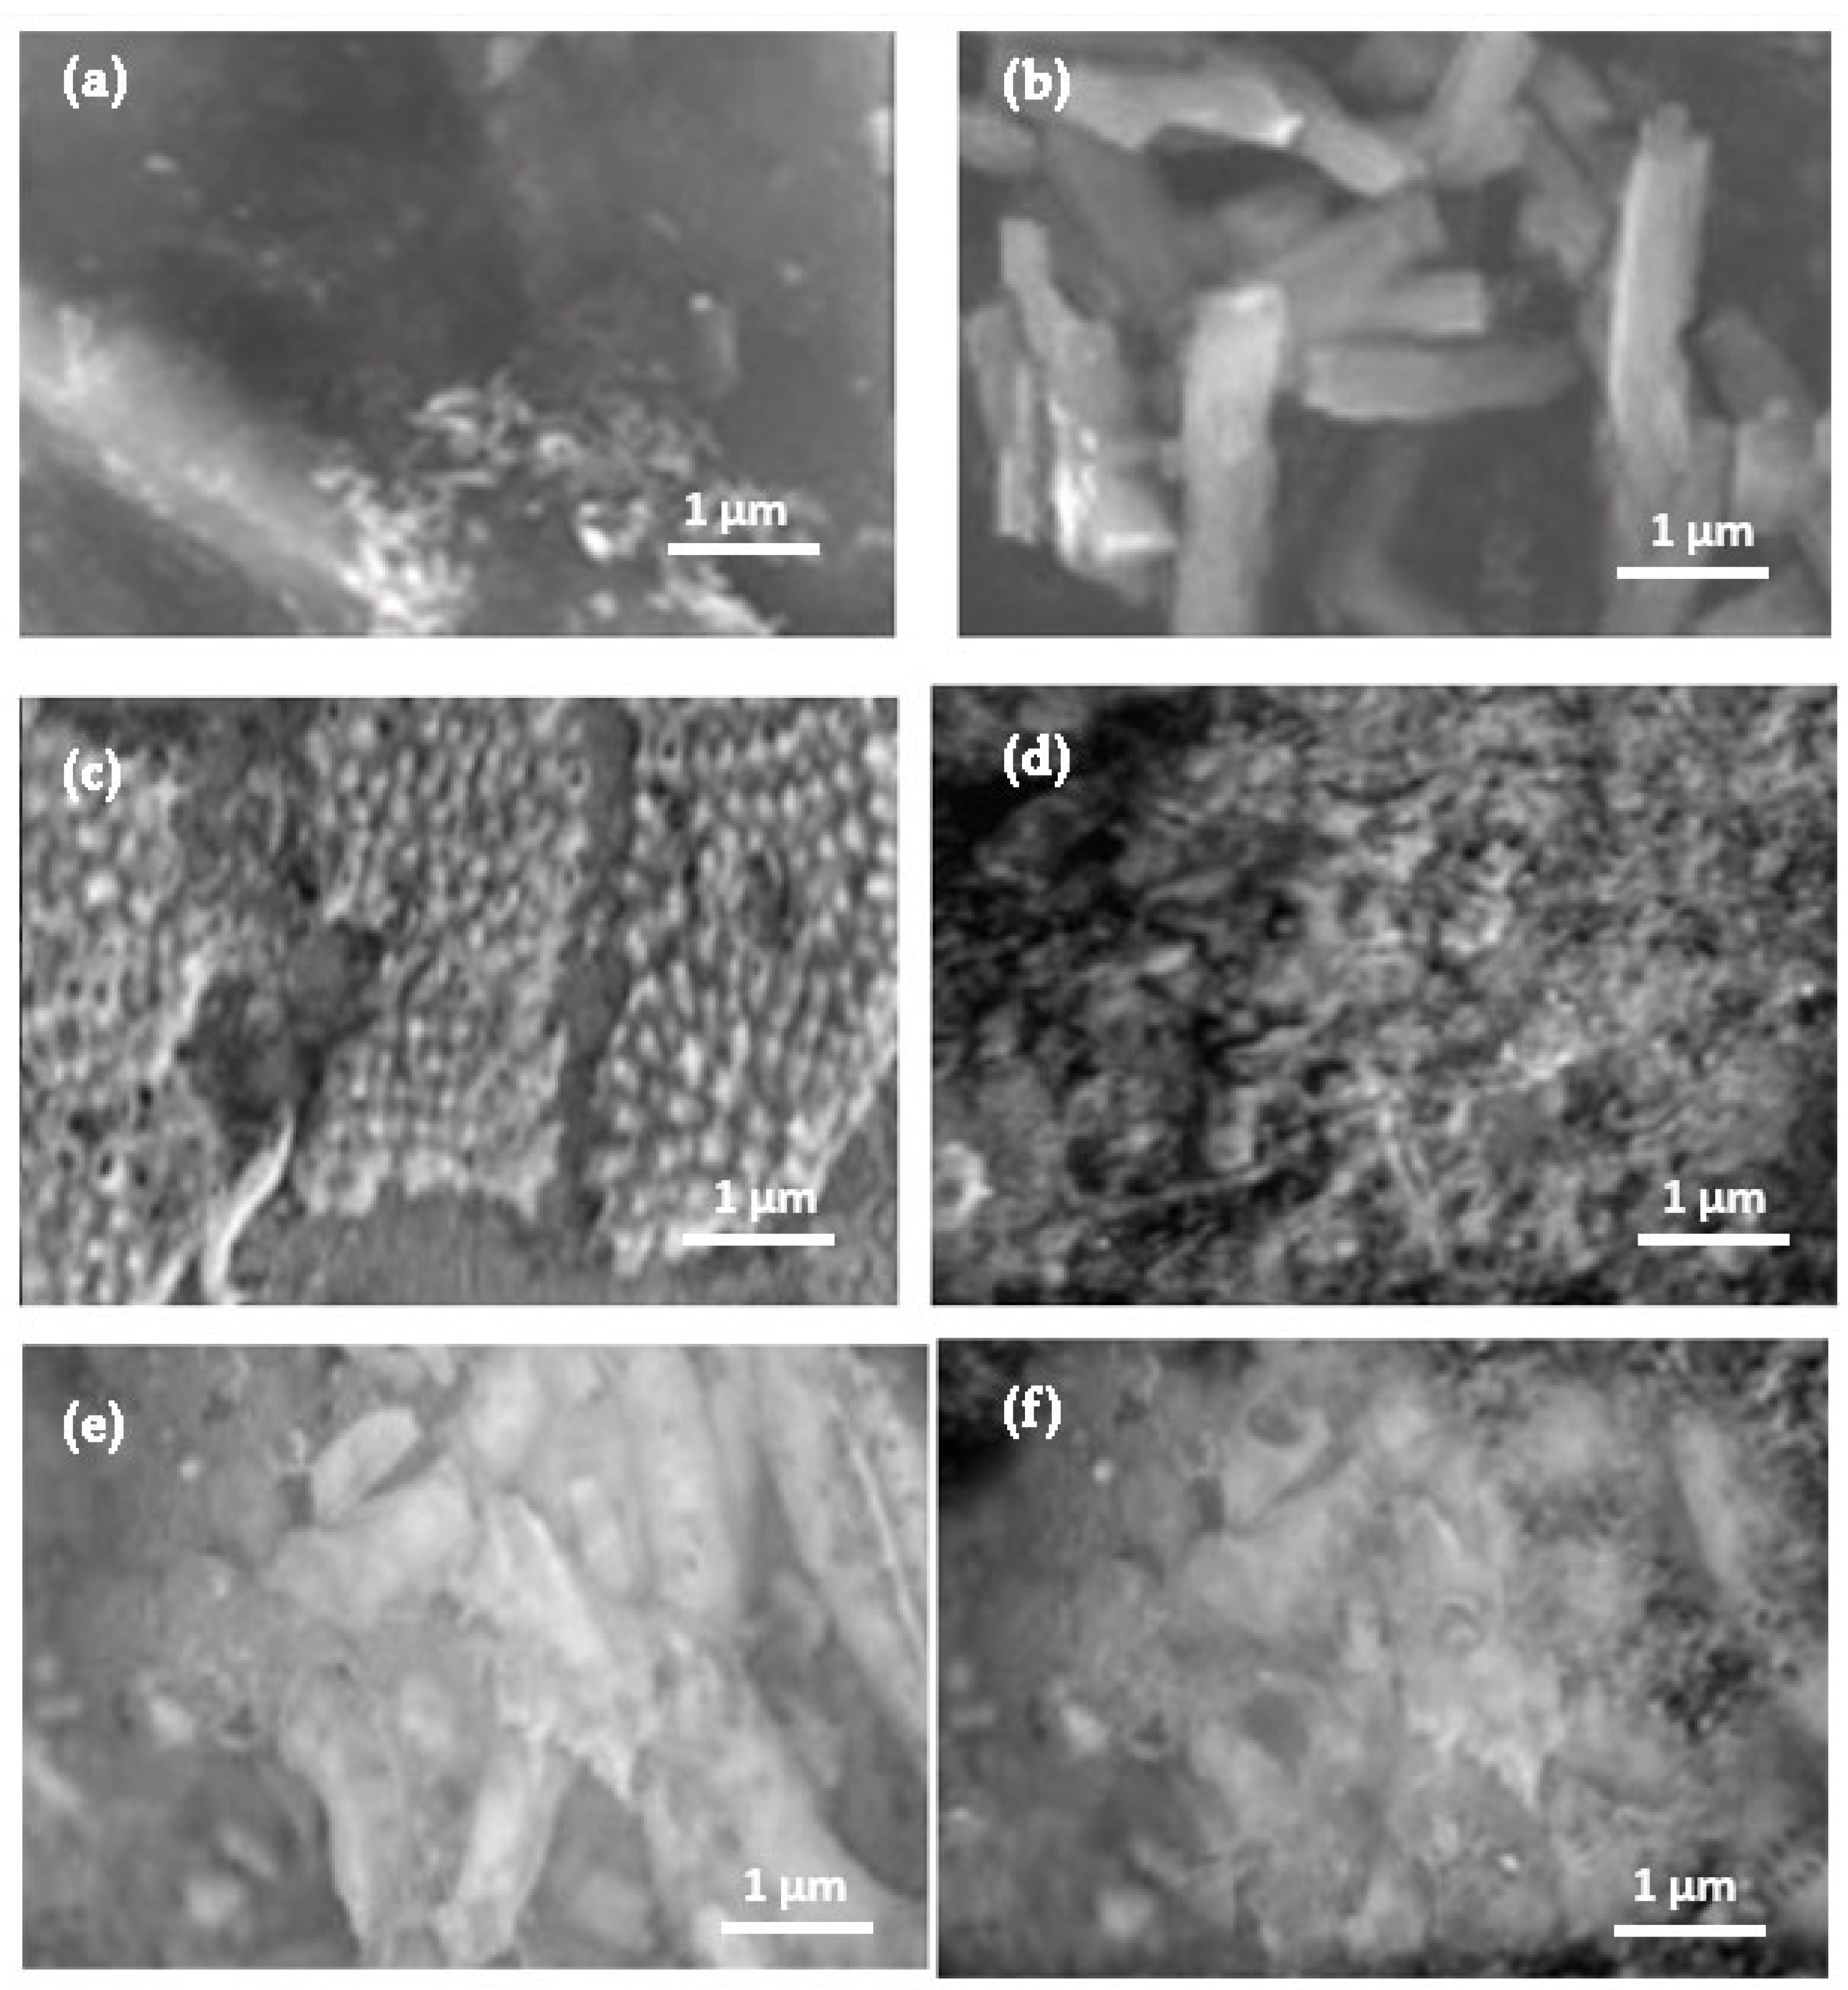
Biofilms on the coated surfaces and uncoated reference sample were visualized after 9 months of immersion (to corrosive sea water media) using scanning electron microscopy (SEM) (
Figure 12). For the sake of simplicity, only the SEM’s secondary electron results from Rafina (RAF) coast are illustrated. It was evident that biofilms formed substantially on the surface of all samples, suggesting that the initial attachment of microbes on the antifouling surfaces was not prevented. After 9 months of continuous immersion, severe biofouling was observed.
Figure 12c-d indicate the growth of macro-organisms visually resembling shellfishes on the surface of the samples coated with C and D paints. As the foulant presence increases, the upper layers become more porous with a greater fraction of large colloids/particles (
Figure 12e). On the surface of the uncoated sample (
Figure 12f), the foulant layer was composed of large organic substances and a dense and compressed sludge deposition. In coated sample A (
Figure 12a), it can be seen that a micro-contamination is residual on its surface. The microorganisms appear elongated, as in coated sample B (
Figure 12b), and engage multimodally to form heterotrophic-oriented clusters. The thickness of the foulant layer on all the coated and uncoated surfaces determined by SEM are shown in
Table 6.
Notably, the coated sample B had higher Cu
2O concentration than the coated sample A. However, according to
Table 2, the foulants on the B surface were characterized as more swollen than on the A surface. For comparison, the foulant layer on the surface of the uncoated sample (
Figure 12f) was comprised of large organic substances and a dense and compressed sludge deposition. It is generally expected that the antifouling activity of the coatings increases with the concentration of copper oxide. However, it must be taken into account that besides loading, the release rate of the biocide is of crucial importance. In fact, the observed behavior might be attributed to a lower release rate of the copper oxide. In that case, A coatings combine better antifouling performance with considerably lower biocide release into the marine environment [
30].
Our results on biofouling can be explained in terms of surface energies of the solid carrier (paint) and cell governing the initial attachment of cells to solid substrata in the marine environment. In fact, thermodynamic modeling performed on freshwater alga cells adhesion has shown that cellular attachment strongly depends on their polar surface energy value with respect to water [
31]. Thus, the lower attachment observed on A samples may be due to the paint disposing lower dispersive surface energy but higher polar surface energy, in full agreement with the results from the contact angle experiments.
Biofilm adsorption depends not only on the hydrophilic or hydrophobic properties of materials, but also on topographical features, including surface curvature, roughness, and geometrical characteristics. It is generally accepted that both the topography and chemical characteristics of surfaces can influence the growth of biofilm in painted samples. According to the AFM results, the corresponding height diagrams show the macro-roughness of the respective surfaces in which micro-roughness is also observed. Supposing that complete contact is retained between the liquid and the solid, this roughness increment indicates the reduction of the Wenzel contact angle [
32], and thus the intrinsic tendency of the coated surface towards enhanced wetting. In fact, the effects of surface topography on the attachment of marine biofoulers cannot be excluded [
33] and the importance of surface characteristics for precise control of the initial cell attachment and development of multifunctional coatings with anti-bioadhesion properties was demonstrated [
34]. Moreover, it has been demonstrated that superhydrophobicity and nanoscale surface topography completely prevent the biofouling [
35]. Furthemore, the superhydrophilic surface finishing finds potentially interesting application for fouling- and corrosion-prevention applications [
36], leading to coatings with enhanced wear resistance and anti-microbial performance [
37,
38]. Thus, in our case, AFM analysis has shown that all coated samples present lower roughness than the reference (uncoated samples), depicting surfaces containing topographical features at multiple length scales from hundreds of nanometers to hundreds of microns. Our approach widens the number and variety of the fouling microorganisms that can be prevented [
39].


