Abstract
The UV/Vis absorption energies (νmax) of different solvatochromic probes measured in co-solvent/water mixtures are re-analyzed as a function of the average molar concentration (Nav) of the solvent composition compared to the use of the mole fraction. The empirical ET(30) parameter of Reichardt’s dye B30 is the focus of the analysis. The Marcus classification of aqueous solvent mixtures is a useful guide for co-solvent selection. Methanol, ethanol, 1,2-ethanediol, 2-propanol, 2-methyl-2-propanol, 2-butoxyethanol, formamide, N-methylformamide (NMF), N,N-dimethylformamide (DMF), N-formylmorpholine (NFM), 1,4-dioxane and DMSO were considered as co-solvents. The ET(30) values of the binary solvent mixtures are discussed in relation to the physical properties of the co-solvent/water mixtures in terms of quantitative composition, refractive index, thermodynamics of the mixture and the non-uniformity of the mixture. Significant linear dependencies of ET(30) as a function of Nav can be demonstrated for formamide/water, 1,2-ethanediol/water, NMF/water and DMSO/water mixtures over the entire compositional range. These mixtures belong to the group of solvents that do not enhance the water structure according to the Marcus classification. The influence of the solvent microstructure on the non-linearity ET(30) as a function of Nav is particularly clear for alcohol/water mixtures with an enhanced water structure.
1. Introduction
The development of Reichardt’s dye 2,6-diphenyl-4-(2,4,6-triphenyl-1-pyridinium)-phenolate (B30) (see Scheme 1) was a milestone in the study of solvent properties [1]. Recall that the original empirical solvent parameter ET(30) is defined as the molar absorption energy of B30 expressed in kcal/mol, measured in a given solvent [1]:
ET(30) (kcal/mol) = 28,591/λmax (nm)
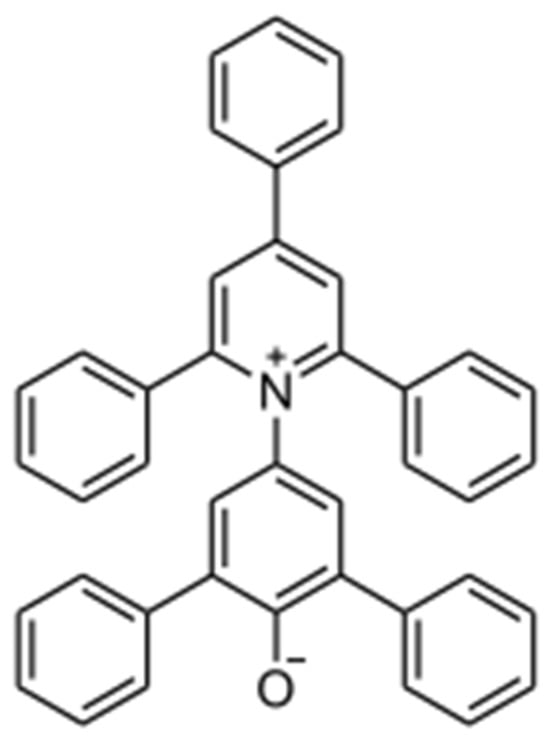
Scheme 1.
Reichardt’s dye 2,6-diphenyl-4-(2,4,6-triphenyl-1-pyridinium)-phenolate (B30).
There are numerous studies in the literature classifying the polarity of pure solvents and solvent mixtures according to their composition, measured with B30 and other solvatochromic probe molecules [2,3,4,5,6,7,8,9,10,11,12,13,14,15,16,17,18,19,20,21,22,23,24,25,26,27,28,29,30,31,32,33,34,35].
Explanatory concepts on solvatochromism can be found in the informative review of [34]. A preliminary summary of the solvent mixtures treated can be found in Table 3 of [35]. In this context, B30 and related solvatochromic probes have been used to establish so-called hydrogen bond strength (HBD) scales for organic solvents [36,37,38,39,40,41]. In addition to the HBD classification, there is a definition for the hydrogen-bond-accepting (HBA) strength of solvents [42]. The HBD and HBA classifications reflect the molecular properties of the solvent molecule in relation to hydrogen bonding in terms of the Kamlet–Taft approach and other similar concepts by Catalan and Laurence [36,37,38,39,40,41]. The interaction of the solvent HBD groups with the phenolate oxygen was considered to be critical in measuring the HBD strength of solvents and solvent mixtures. However, this approach is only partially justified, as we have recently shown [43]. The concept of determining HBD parameters works quite well for ionic liquids (ILs) and other salts due to the electrostatic interaction between the B30 phenolate anion and the constituent cation of the IL [41,44,45,46]. However, due to some contradictions between theory and experimental results, the phenomenon is still under investigation [46].
B30 in particular is routinely used as a polarity indicator for binary solvent mixtures [2,6,7,8,9,13,14,15,16,17,18,19,20,21]. One of the most difficult problems in interpreting the solvatochromism of B30 in solvent mixtures is the issue of preferential solvation and its influence on the ET(30) value [10,15,16,17,18,19,20,21,24,34]. However, the concept of preferential solvation is interpreted differently in the literature [9,10,11,12,24]. The fundamental problem with the definition of preferential solvation was correctly recognized by Ghoneim [24]. Two basic scenarios must be distinguished in this question for B30:
- i.
- The solvent mixture (true micelles are a different situation) is inherently inhomogeneous and the solute B30 is therefore preferentially entrapped by a specific microdomain.
- ii.
- The solute probe such as B30 preferably forms a specific complex with one of the two solvent components.
A complementary good definition for preferential solvation is given by Morisue and Ueno regarding case ii. “Preferential solvation is a phenomenon, whereby solvent proportion of binary mixed solvent in the vicinity of a solute molecule differentiates from the statistic proportion in bulk” [29]. It is therefore necessary to clearly distinguish whether the probe molecule is specifically solvated by the solvent molecule or is present in a partial volume enriched with a component of the mixture. Scenario i. assumes that the physical structure of the solvent mixture is not affected by the solute B30. In the case of scenario ii., the type of probe itself determines the extent to which preferential solvation occurs. Thus, if scenario ii. is true, then different solvatochromic probes should each show different UV/Vis absorption energy dependencies on the quantitative solvent composition for the same mixture. Langhals had already shown in 1981 that different solvatochromic probes used for the same mixture measure the same qualitative dependencies as a function of solvent composition, e.g., for ethanol/water [5]. This crucial finding would rule out scenario ii. But the situation is not so simple.
Despite ambitious work on the subject, the problem of solvatochromism in solvent mixtures has not really been adequately addressed in the literature. It is therefore necessary to explain the chronological development of the concepts for interpreting UV/Vis spectroscopic absorption energy data of probe molecules in solvent mixtures. In the first papers on B30 [1,2], the ET(30) values of various binary solvent mixtures, including ethanol/water and 1,4-dioxane/water, were determined. It was shown that ET(30) depends in a complex way on the quantitative composition of the mixture. Langhals recognized that the solvatochromism of B30, the ET(30) values, can be described empirically as a logarithmic function depending on the concentration of the solvent components [6]. As early as 1982, Langhals also showed that the ET(30 values of the homologous primary n-alcohol series are a linear function of the total molar concentration of the respective alcohol (N) [7]. The core problem was that no theoretical justification for this link had been presented in the past. Perhaps as a result, this very important discovery was not properly understood by many scientists and its significance was not fully appreciated. These seemingly empirical findings [6,7] have an important physical background based on the Lorentz–Lorenz relation [47].
Later in 1986, Haak and Engberts presented a valuable paper on the influence of temperature (T) on the solvatochromic properties of B30 in aqueous solvent mixtures [8]. It is worth analyzing this study in detail, as the authors have correctly identified the effects of the hydrophobic alcoholic component such as 2-n-butoxyethanol (BE) in water on ET(30). However, several interpretations need to be re-evaluated in the light of new physical research on specific solvent mixtures, as will be shown in the course of this study.
Since 1982, the general topic of preferential solvation in solvent–water mixtures has been studied in detail by Marcus in numerous papers based on thermodynamics using the Kirkwood–Buff theory for fully miscible aqueous solvent mixtures [48,49,50,51]. Even then, Marcus was aware of various discrepancies between thermodynamic results and solvatochromic measurements [12]. He stated: “A single probe, such as the betaine used for the ET(30) polarity parameter, cannot provide an answer”. As early as 1988, Dorsey [9] concluded that B30 perceived the hydrogen bond network rather than direct hydrogen bonds: “Therefore, it could be that a change in the hydrogen-bonding network of the solution is being sensed by the ET-30 probe in the dilute alcohol concentration as well”. This is the thesis that reaches the heart of the matter.
Since 1992, O. Connor and Rosés have independently developed the preferential solvation model [11,15,16]. The preferential solvation model suggests the formation of stoichiometrically defined complexes between the solvatochromic probe (solute) and the two solvents, as well as between solvent molecules. It was assumed that the measured UV/Vis shift was caused by the formation of a complex between the B30 probe or similar probes and the solvent molecule [1,36,37]. This scenario belongs to case ii. These models assume that the strength of the H-bridge bond to B30 is linearly correlated with the magnitude of the UV/Vis shift.
In the important paper by Kipkemboi [13], which was not considered further, the solvatochromism of B30 in 2-methyl-2-propanol/water and 2-amino-2-methylpropane/water mixtures was studied in detail. The authors concluded that preferential solvation cannot be the main reason for the observed effects. Taking into account the refractive index and the partial molar concentration of the components in the qualitative interpretation, both the polarizability and the number of water dipoles have an influence on the solvatochromic shifts of B30.
In 2004, however, Bentley took up Langhals’ discovery [7] and showed the dependence of ET(30) on the global polarity of alcohols with respect to N. In addition, the relationships between the ET(30) values of alcohol/water mixtures were alternatively analyzed as a function of volume or molar fraction of the mixture composition [27]. Bentley concluded that preferential solvation may be overestimated.
An actual preferential solvation could be demonstrated for B30 in the phenol/acetone and phenol/acetonitrile systems [43,44]. A stoichiometric 1:1 complex of B30 with phenol can be clearly identified. In phenol/1,2-dichloroethane, depending on the quantitative composition, both effects i. and ii. can be observed simultaneously with different proportions depending on the phenol concentration [43,52,53,54]. Importantly, these UV/Vis studies have convincingly demonstrated that the effect of specific hydrogen bond formation on ET(30) is much less than that of the bulk solvent phenol [43]. Recent studies show that preferential solvation can be detected, but the solute/solvent complexes must be unambiguously identified by independent spectroscopic measurements. [55,56].
As mentioned above, the preferential solvation models are based in particular on the assumption that the UV/Vis shift of B30 and related probes such as 1-ethyl-4-(methoxycarbonyl) pyridinium iodide (K), cis-dicyano-bis(1,10-phenanthroline) iron II (Fe), or Brookers Merocyanine (BM), is mainly caused by the formation of specific interactions (hydrogen bonds) between the solvent and the probe. This assumption is a fundamental misunderstanding. This fact can be clearly demonstrated, independently of each other, using three different derivatives of the Reichardt dye family found in the literature [57,58,59]. C. Reichardt himself ignored the results of the solvatochromism of the thiolate betaine derivative of B30, which did not show the desired difference from B30 when measured in HBD solvents [57]. It was an unpleasant experience for us to discover that the H-bridge bonding patterns at the barbiturate anion substituent of the B30 derivative caused only a negligible UV/Vis shift compared to the bulk HBD solvents [58]. However, at the time, we did not fully appreciate the implications of this finding for understanding the UV/Vis shift. Unfortunately, we had to abandon the concept of molecular recognition by UV/Vis shift of solvatochromic probes. Recently, the Sander group showed that the [2,6-di-tert.-butyl-4-(pyridinium-1-yl)] phenolate forms a defined 1:1 complex with water, leading to only small shifts in the π-π* transition compared to the influence of the global polarity of the bulk water [59]. Thus, B30 and other related probes do not fulfil this purported property as an indicator of the HBD strength of the solvent molecule when the bulk solvent is measured [36,37,40,41]. The overall UV/Vis shift of B30 in pure HBD solvents is mainly due to the effect of the global polarity of the hydrogen bonding network of the solvent and not to direct hydrogen bonding with the dissolved probe [7,9,28,43,60,61,62]. Sander and co-workers also showed that the stoichiometric B30/HBD solvent complex is the true solvatochromic species and not the original B30. This result was the missing link in understanding the discrepancies between the different interpretations of the derivatives of Reichardt’s dye, as it was known that steric shielding of the phenolate oxygen of the B30 derivatives leads to a change in the solvatochromic properties [1].
The misinterpretation that the total UV/Vis shift is primarily due to the direct formation of hydrogen bonds at B30 must be fundamentally corrected, even though many papers have taken this as a defined basis. Accepting this fact will be difficult for many scientists working in this field, as it overturns entrenched patterns of thought. Following Bentley [27], we question the classical preferential solvation approach of special solvatochromic probes for certain alcohol/water and related aqueous binary solvent systems with respect to scenario ii., as reported in [4,19,20,21,25,26,27,30,31,32].
Suppan also concluded that the process of hydrogen bonding between solute and solvent in water can be endergonic, using the preferential solvation index for interpretation [63]. Later, Rezende recognized that the concept of preferential solvation has some weaknesses, and the preferential solvation index was also recommended to overcome some problems in explaining difficult results [64,65].
However, the real scientific problem with the evaluation of UV/Vis absorption energy data of solvatochromic probes in solvent mixtures in the literature is much more serious. Most authors routinely use the mole fraction x of a component of the solvent mixture to define the quantitative composition in physical terms. It has been assumed that a strictly linear dependence of the UV/Vis absorption energy of the dissolved solvatochromic dye on x would indicate ideal mixing behavior [10,14,15,16,17,18,19,20,21,22,23,24,25,26,27,28,29,30,31]. This thesis must be fundamentally questioned, since only the change in the Gibbs free energy (ΔG) of a solvent mixture can be linearly related to the mole fraction of the components involved [10,66]. The Gibbs free energy is a composite variable [66]. For the UV/Vis absorption energy of a dissolved probe molecule in a solvent mixture, however, the situation is somewhat different. The number of transition moments, i.e., the atoms and molecules that are affected by both the light and solvent in a given volume depends on the average molar concentration (Nav,x) of the solvent dipoles with respect to x, but not directly on x [47,67,68]. Therefore, the experimentally found curvilinear relationship ET(30) as a function of x(water) may indicate a preferred solvation [10,14,15,16,17,18,19,20,21], since Nav,x is reciprocal to x(water). We assume that the real reason for the curved shape of the function ET(30) or EPHBD (see later Equation (2)) as a function of x(water) is not necessarily the preferred solvation, but the influence of inhomogeneity due to the difference in mass of the two different solvents. This aspect is particularly relevant for aqueous mixtures due to the low molar mass of water. EPHBD is usually the UV/Vis absorption energy (νmax in cm−1) or in kcal/mol [ET(30)] of the solvatochromic probe such as B30 measured at λmax, Equations (1) and (2).
EPHBD ≡ νmax (cm−1) ≈ aN (mol/cm3) + b.
N refers to the molar concentration, according to Equation (3), of the solvent dipoles or the polarized solvent molecules according to the Debye–Lorenz, Clausius–Mosotti–Lorenz or Lorentz–Lorenz relation [47]. σ is the physical density and M the molar mass of the pure solvent substance.
N (mol/cm3) = σ(g/cm3)/M (g/mol).
There are hardly any well-founded studies on the subject of the various quantities of mixture composition, as the mole fraction x seems to have become established as a routine basis for calculation. There are only a few papers that briefly mention the influence of the different composition variables on ET(30) and qualitatively illustrate it with some examples [9,27,43,50]. Significantly, Marcus already suspected that this topic would raise a number of unanswered questions; he mentioned timidly “the different measures of composition of a binary solvent mixture should be borne in mind” [50].
In addition, it has been empirically found that the EPHBD of pure solvents is linearly correlated with the N (total molar concentration) of the solvent under solvent variation for specific solvent families [7,27,43,61,62]. Furthermore, there is a fundamental relationship between N and the spectroscopic quantities νmax and εmax (Lmol/cm = 103 cm2/mol) as the molar absorption coefficient as shown in Equation (4).
N (mol/cm3) = νmax(cm−1)/εmax(cm2/mol),
νmax (cm−1)) = N (mol/cm3) εmax (cm2/mol).
νmax (cm−1)) = N (mol/cm3) εmax (cm2/mol).
Equation (4) has been completely overlooked in the past. The relationship is not artificial. The physical relationship between the absorption energy νmax, the molar absorption coefficient εmax and N is theoretically determined through Beer’s approximation and the Lorentz–Lorenz relation [67,68]. The fundamental Lorentz–Lorenz relation is given by Equation (5).
With the refractive index measured at 589 nm; Rm molar refractivity and f() = [()2 − 1]/[()2 + 2].
It is a matter of identifying the physically correct amount of N in the solvent system [69]. The general factor N in the original Lorentz–Lorenz relation, Equation (5), refers to the molar concentration of the total number of solvent molecules [47]. It has recently been shown that, within homologous series of n-alkane derivatives, the correlation of the refractive index as a function of N results in a negative slope [69], which theoretically does not agree with the original Lorentz–Lorenz relation [47]. Since N is empirically related to νmax by Equation (2), many correlations of νmax with from the literature are not meaningful. Only when the actual molar concentration of the “chromophore” of the solvent molecule, the C-H bond concentration NCH, is taken into account, is the applicability of the Lorentz–Lorenz relationship for correlation analysis fulfilled. The reason for this is simple, because N ~ −NCH. [69]. Therefore, instead of N, the respective concentration of the corresponding functional fractions of the solvent is actually required which is NCH for special solvent families. Accordingly, N should be replaced by NCH when investigating structure–property relationships with respect to refractive index. Then, Equation (6) is obtained:
For solvents containing hydroxyl- and/or -CO-NH-groups, the situation is straightforward, as the HBD groups are the dominant dipoles in the solvent volume. Thus, Equation (2) essentially holds when solvent families are treated individually, but is convincingly applicable to HBD solvents [6,27,61]. Indeed, many EPHBD correlate linearly with the physically determined hydroxyl group density, which is proportional to the molar concentration N [Equation (2)], rather than with the acidity in terms of the pKa of the solvent [43]. For non-HBD solvents, linear relationships between EP and N are only found if one stays within the series of a particular solvent family [61].
The reason for the clear result of Equation (2) is that εmax of negative solvatochromic probes, Equation (4), changes inversely linearly with νmax as the solvent is varied [1,70,71]. Equation (2) works only moderately well for positive solvatochromic dyes as the preliminary evaluation of Nile Red shows; see Figure S1a in the supplementary materials; the UV/Vis-spectroscopic data are taken from [72]. In this context, the question is how the molar absorption coefficient εmax of the solvatochromic probe changes systematically linearly with N, since εmax also correlates with the refractive index due to the Kramer–Kronig relation [73]. For positive solvatochromic dyes, εmax remains essentially unchanged within structurally similar solvent series [70,71]. This consideration is in line with older studies by Suppan [74,75]. Since the electromagnetic coupling of the solvent chromophore with the dye is theoretically understood for negative solvatochromic dyes [70,71], only the solvatochromism of such dyes with respect to N is analyzed in this review.
There are several reasons for the motivation of this review and re-evaluation of the ET(30) parameters of organic co-solvent/water mixtures. Enormous progress has been made in the study of aqueous solvent mixtures, both experimentally and theoretically. Many new insights into their microstructure and dynamics, structure and properties have been gained in recent years for alcohol/water mixtures [76,77,78,79,80,81,82,83,84,85,86,87,88,89,90,91,92,93,94,95,96] and other co-solvent/water mixtures (see references in the main text). In particular, these new findings on the microstructure of alcohol/water mixtures require a re-evaluation of many older results on the solvatochromism of probes in these mixtures. A crucial argument for testing the solvatochromism of B30 in aqueous mixtures is that water is not a strongly acidic solvent in the sense of the HBD property, but is one of the most polar solvents due to its exceptionally high molar concentration N and the polarization of the volumetric OH bonds [60]. A very precise distinction must be made between volumetric water and smaller quantities of water as a solute in a mixture [75]. From x(water) < 0.2, the situation is different for aqueous mixtures than in the water-rich range, as water behaves more like a solute than a solvent [75,76,77].
Another key argument concerns the appropriate use of the various measures of mix composition [50]. Recently, we have shown that ET(30) is an approximately linear function of the average molar concentration (Nav) of ethanol/water and methanol/chloroform mixtures [43]. This is true for certain concentration ranges, then the correlation coefficient for the linear relationship r (regression coefficient) is ~0.99 [43]. It is likely that linear dependencies ET(30) as a function of Nav only arise if the thermal motion of the solvent molecules overcomes the structuring of the solvent mixture. Is the solvatochromic probe measuring an average number of different solvent dipoles as a snapshot in certain compositional ranges? To answer such questions, we need to take a closer look at the dynamics of the solvent mixture [84,85,86]. Pure alcoholic solvents and alcohol/water mixtures fit into a relationship when the dielectric relaxation time τ1 and the number of OH dipoles are correlated on the basis of N (see Figure 4 in [86]). Relaxation time of ethanol/water mixtures increases with decreasing number of OH dipoles due to increasing alcohol content. Reminder, the dielectric relaxation time τ1 is defined as the time it takes 63% of the molecules in the sample to return to disorder [87]. Thus, the degree of ordering of binary alcohol/water mixtures containing two different types of OH-dipoles probably increases with increasing structuring, i.e., concentration of C-C bonds originating from the alcohol molecules.
The following question arises: Can (binary) solvent mixtures can be treated in the same way as pure solvents with regard to the average molar concentration (Nav) of relevant solvent dipoles or polarizable solvent molecules? The situation regarding the appropriate measure to use is complicated. To correlate the results of UV/Vis spectroscopy or dielectric spectroscopy, different composition variables, such as the molar and volume fractions of the mixture, are sometimes used alternately [9,27,88,89]. For ternary mixtures or multicomponent systems, the determination of the composition in suitable parameters is even more complex. However, the work of F. Martin et al. shows that solvation models can in principle also be used to explain the solvatochromism of probes in ternary mixtures [97,98]. Measuring the physical properties of ternary solvent mixtures in terms of density, refractive index and heat of mixing requires careful and extensive studies. There is not as much data available in this area. Therefore, only binary mixtures will be considered in this review. The fundamental aspect of compositional quantities is covered in the methods chapter of this paper.
2. Methods
The average molar concentration Nav is a crucial physical property of all non-homogeneous substances. It must be clearly defined which atoms and molecules are being considered. This study deals with binary solvent mixtures. The Nav of any homogeneous binary solvent mixture can be easily calculated from the composition of the two components, their molar masses and the actual physical density of the solvent mixture according to Equation (7) [66].
Nav,Z = ρm/MAV,z = ρm(1,2)/(Z1M1 + Z2M2)
ρm(1,2) is the actual density (after mixing) of the mixture at given Z.
M1 and M2 are the molar masses (g/mol) of solvent 1 and 2, respectively;
Mav,z is the average molar mass of the solvent components.
The factors Z1 and Z2 are either:
the molar fraction (Z = x; →Nav,x),
mass fraction (Z = w; →Nav,w), or
volume fraction (Z = φ; →Nav,v) of solvent 1 and solvent 2 before mixing.
The average molar concentrations Nav.z in terms of different Mav,z have not yet been fully considered as quantitative composition size in evaluating physical measurands of solvent mixtures. We had underestimated this point in a previous paper [62]. The linearity of a relationship between a measured quantity and a quantitative composition is not necessarily a criterion for physical correctness. It must be emphasized that the decisive quantity is the average molar mass Mav,z which can be calculated either by x, w or φ [99]; see Equation (8):
Mav,z = z1(M1 − M2) + M2
Therefore, the numerical differences between Nav,x, Nav,w and Nav,v are due to the differences in M1 and M2 as well as the quantitative ratio of the two solvents, rather than to the density changes, as shown for various alcohol/water mixtures when Nav,x is plotted as a function of x(water) (see Figure S1b in the Supplementary Materials).
The problem of average molecular weight is a central one in polymer chemistry. Different physical measurement methods, such as end-group analysis through NMR or acid-based titration, viscosity, osmotic pressure of the polymer solution, light scattering and ultracentrifugation, are used to measure different numerical values of the average molar mass for the same polymer sample [100]. The numerical value of the average molecular weight depends not only on the method of measurement but also on the shape of the molecular weight distribution curve [101]. Note that colligative physical methods measure the number average (Mn) of the polymer sample. This would correspond to the Mav,x of solvent mixtures. Non-colligative physical methods (preferably) measure data related to the weight average (Mw). The result of the non-colligative method depends on the nature of the solvent and polymer solute. For example, the refractive index is a non-colligative measurement. It is therefore not surprising that the determination of mixture composition through refractive index measurements is always controversial [102,103,104].
The non-uniformity of a polymer is defined by the ratio Mw/Mn [100,101]. Following the teachings of polymer chemistry [101], the ratio of Mav,w/Mav,x = DI has been defined in this work as the dispersion index of a binary solvent mixture. Accordingly, Equation (9) is used in practice as an indicator of the non-uniformity of the solvent mixture. DI is an artificially constructed variable, but the approach is borrowed from polymer chemistry.
Mav,w/Mav,x = DI
For a binary mixture, this approach is straightforward. Figure 1a shows the dependence of DI as a function of x(water) for methanol/water, 2-propanol/water and 2-methyl-2-propanol/water mixtures. Mav,x and Mav,w are calculated by Equations (10) and (11), respectively.
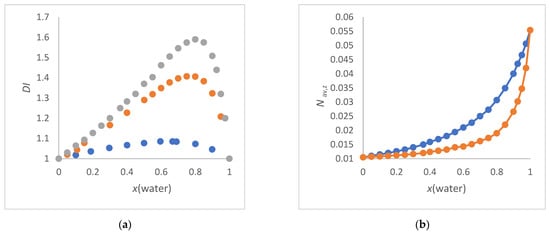
Figure 1.
(a) Dependence of DI as a function of x(water) for methanol/water (blue), 2-propanol/water (orange) and 2-methyl-2-propanol/water (grey); (b) Nav,z (in mol/cm3) of the 2-methyl-2-propanol/water mixture as a function of x(water). Nav,x (blue) and Nav,w (orange), calculated according to Equations (10) or (11); for data see Table S12a. The connections between the individual points serve to orientate the reader.
The 2-methyl-2-propanol/water mixtures show the greatest inhomogeneity at x(water) = 0.8 (strongest curvature of the graph in Figure 1b), since the quotient Mav,w/Mav,x as a function of x(water) has its maximum at this position. This x(water) = 0.8 corresponds to Nav,x = 0.25 mol/cm3 and Nav,w = 0.15 mol/cm3, respectively. As would be expected arithmetically, the greater the mass difference, the greater the DI for a given x. The smaller the mass difference, the wider the distribution of DI at DImax. It cannot be overlooked that the position of DImax with respect to x(water) corresponds to both the order of the excess molar volume of water and the excess thermodynamic properties for these alcohol/water mixtures [78,79,80,83,95]. This is remarkable because the DI only considers the masses and their proportions and does not include any other physical data. It can be assumed that this agreement is rather random for alcohol/water mixtures. Therefore, the suitability of the DI to support the interpretation of ET(30) as a function of solvent composition in alcohol/water mixtures will be demonstrated in this work.
As explained in the introduction, for the evaluation of UV/Vis spectroscopic absorption data) [67,68], the mole fraction (x) is theoretically suitable for the determination of the average molar mass. Therefore, Nav,x, determined through Equation (10), is preferred in this paper for correlation with ET(30).
Nav,x = ρm/MAV,z = ρm(1,2)/(x1M1 + x2M2)
The weight fraction w1 is calculated from the mass fractions m1 and m2 of the two components according to w1 = m1/(m1 + m2). Nav,w is obtained from Equation (11).
Nav,w = ρm/MAV,w = ρm(1,2)/(w1M1 + w2M2)
Since Mav,w is inherently greater than Mav,x [100,101], Nav,x is always greater than Nav,w. For example, Figure 1b shows the relationships between the compositional quantities Nav,x and Nav,w with x(water) for the binary solvent mixture 2-methyl-2-propanol/water. Figure 1b clearly shows that Nav,w reflects the inhomogeneity of the mixture as a function of the quantitative composition more strongly than Nav,x, since the curve Nav,w versus x(water) shows a stronger deviation from linearity than Nav,x versus x(water) (see also Figure S1b in the Supplementary Materials section).
The volume fraction can also be used to determine Nav,v, Equation (12). However, there are still some open questions regarding the physical meaning of this quantity.
Nav,v = ρm/MAVv,v = ρm(1,2)/(φ1M1+ φ2M2).
This consideration refers to the solvent volume of each solvent component before mixing according to the IUPAC definition of volume fraction: “Volume of a constituent of a mixture divided by the sum of volumes of all constituents prior to mixing” [105]. This definition assumes ideal mixing behavior, which is not the case for most aqueous and non-aqueous solvent mixtures [106]. When two liquids are mixed, neither the total number nor the total mass of molecules changes, but the sum of the volumes may change compared to the volumes before mixing. Therefore, the use of the volume fraction in the determination of Nav,v is controversial as to its true physical meaning. The use of Nav,v (average molar concentration related to volume fraction) can only serve as an empirical guide.
Because of these well-known problems with volume changes after mixing, the issue is treated thermodynamically in terms of excess molar volume (VE) by Equation (13) and described semi-empirically by several sophisticated concepts and approaches [66,78,107]. Equation (13) is well established in the textbooks.
VE = (x1M1+x2M2)/ρm(1,2) − (x1M1/ρm(1)) − (x2M2)/ρm(2))
where ρm(1) and ρm(2) are the densities of the pure solvent 1 and 2, respectively. x1 and x2 are the mole fractions of solvent 1 and solvent 2, respectively. Analyses of VE as a function of x(solvent 1) and x(solvent 2) can provide valuable information on the partial excess partial molar volumes of solvents 1 and 2 as a function of composition.
If only the molar fraction of the OH groups of a component on Nav is considered, i.e., that of the HBD solvent fraction (M1), then Equation (7) can be modified to Equation (14).
Nav (component1) = x1.ρm/MAV = x1.ρm(1,2)/(x1M1 + x2M2)
The approach of Equation (14) is useful in determining whether the influence of the proportion of HBD solvents mixed with non-HBD solvents is due to the overall polarity or to the preference of the HBD component. This procedure has been demonstrated for the dependencies of ET(30) as function of Nav,x compared to Nav,x(CH3OH) for methanol/chloroform mixtures [43]. It has been shown that methanol is the dominant solvent according to scenario i of preferential solvation.
Equation (14) can also be used to consider the average number of OH groups (D,av,xDHB) of a multifunctional OH component in the mixture, e.g., for dihydric alcohols such as 1,2-ethanediol [62]. For pure 1,2-ethanediol, then, 2N = DHBD. See later the treatment of 1,2-ethanediol/water mixtures in relation to ET(30).
The problem with the average molar concentration is that the sum of the two dipoles is considered, e.g., for methanol and water. This is correct if the sum of the dipoles of the solvent and their effects is proportional to the measured quantity. Recently, we have shown that the total molar concentration N of pure solvents is not suitable to describe the changes in refractive index as a function of structural variation within homologous series of n-alkane derivatives [69]. Instead, the molar concentration of the C-H bonds (or N-H) is crucial to adequately reflect the theoretically required linear relationship between and N according to the modified Lorentz–Lorenz Equation (6). Equation (15) is particularly suitable for co-solvent/water mixtures to calculate the average molar concentration of C-H and/or N-H bonds of the co-solvent [71].
Nav,x,CH = [m x(co-solvent)] Nav,x,
The factor m is the number of C-H and N-H bonds per co-solvent molecule; x is the mole fraction of the respective co-solvent. Since the atomic refraction of the C-H and N-H (amide) bonds are nearly equal [108], no additional correction is necessary for formamide (FA), N-methylformamide (NMF) and N,N-dimethylformamide (DMF). For mixtures of organic solvents, the situation is more complicated because additional chemical bonds contribute to the molar refraction of the individual solvent molecules. This is particularly important for halogenated and aromatic solvents. Therefore, only the co-solvent/water mixtures are straightforward, as water is a weak (negligible) chromophore.
Basically, the general statement of this chapter shows that the absorption energy (EP) of a dissolved dye in a mixture is inversely proportional to the mole fraction due to Mav ~ x(co-solvent) ~ 1/EP according to Equations (4) and (8). These basic relationships are independent of a physical law such as the Lorentz–Lorenz equation.
3. Results
3.1. Selection of the Solvent Mixtures
Because of the huge amount of data, we looked for a common thread to make statements that are as representative as possible and that also reveal fundamental correlations. Marcus distinguishes two groups of aqueous solvent mixtures in which the co-solvent either enhance or does not enhance the water structure. The evaluation is based on the excess partial molar volume or the excess partial molar heat capacity of the water [109,110]. Note that the Marcus classification only applies to the water-rich section of the mixture [x(water) > 0.7, xco-solvent < 0.3] [109,110]. Marcus stated “Some solutes such as ethylene glycol, 1,4-dioxane, acetonitrile, NMF, FA, urea, ethanolamine, and dimethylsulfoxide, many of which hydrogen-bond very strongly with water, do not enhance the water structure” [110]. The selection was made according to this scientifically justified criterion. However, the Marcus evaluation can only be used as a rough guide because some co-solvents can be classified differently depending on whether the excess partial molar volume or the corresponding heat capacity is used. For some co-solvents, such as DMF, acetone, acetonitrile or THF, the classification is borderline [109,110], which shows how difficult the issue is. The binary mixtures acetonitrile/water, acetone/water and THF/water are each unique and will be discussed together in a separate publication. The situation regarding the non-enhancement of the water structure is quite clear for the FA/water, 1,2-ethanediol/water and glycerol/water mixtures [109,110]. Enhancement of the water structure is particularly relevant for the ethanol/water, 2-propanol/water and 2-methyl-2-propanol/water mixtures [109,110]. However, the term “water structure enhancement” sounds mysterious. [78,79]. The problem is that there are qualitatively different microdomains of water in alcohol/water mixtures in terms of structure and size [90,91,92,93,111]. Marcus [110] noted that the “Enhancement of the water structure then consists of the changing of some of the dense (water) domains to bulky ones”. This phenomenon would inevitably lead to an increase in the average alcohol concentration in the remaining mixed phase compared to the co-existing microdomain water phase or the hypothetical phase resulting from the initial mixing ratio for each composition. Therefore, the overall polarity of the actual ethanol/water mixed phase should be lower than the phase that would result if ethanol and water were statistically completely mixed at a given composition. This should be kept in mind.
The ethanol/water mixture seems to be one of the most difficult solvent mixtures to understand when considering simple systems; see [111] and the references cited. The temperature increase associated with volume shrinkage when ethanol and water are mixed is apparently a thermodynamic anomaly [79]. The strongly negative entropy of the mixing process suggests complex structure formation depending on the composition, as demonstrated through dielectric spectroscopy and a special microscopic technique [86,87,88,89,111].
The curves of the solvatochromic parameters as a function of x(water) in [18,19] agree remarkably well with those of the partial excess molar volume as a function of x(water) of methanol/water, ethanol/water, 2-propanol/water and 2-methyl-2-propanol/water [95,96]. Therefore, the physics of alcohol/water mixtures deserves special attention in this study. There has been little discussion of the effect of the microstructure of alcohol/water mixtures on a solvatochromic probe [33].
3.2. Refractive Index of Aqueous Solvent Mixtures
The suitability of Equation (6) in combination with Equation (15) is illustrated for several amide derivative/water, DMSO/water and 1,4-dioxane/water mixtures. These solvent mixtures belong to the class where no enhancement of the water structure is observed [109,110]. References for data are given in Tables in the Supplementary Materials section. No usable refractive index data could be found in the literature for NMF/water mixtures.
Plotting the refractive index () measured at a wavelength of 589 nm as a function of Nav,x,CH gives a straight line, as can be seen in Figure 2a and from Equation (16) to Equation (20). The 1,2-ethanediol/water and glycerol/water mixtures, both of which show excellent linearity of as a function of Nav,x,CH, are described in Section 3.4.6.
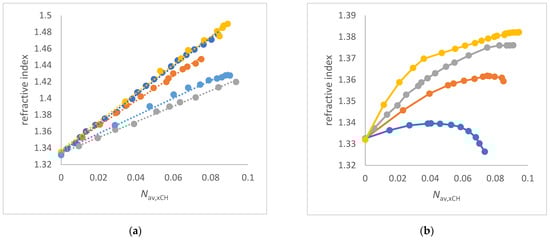
Figure 2.
(a) Correlations of refractive index as a function of Nav,x,CH (mol/cm3) for co-solvents that do not enhance the water structure of co-solvent/water mixtures; (b) Plots of refractive index as a function of Nav,x,CH (mol/cm3) for co-solvents that enhance the water structure of co-solvent/water mixtures; to (a) FA/water (orange), water/N-formylmorpholine (NFM) (yellow), DMF/water (grey), 1,4-dioxane/water (light blue) and DMSO/water (dark blue); to (b) methanol/water (dark blue), ethanol/water (orange), 2-propanol/water (grey), and 2-methyl-2-propanol/water (yellow). The links between the individual points are a guide for the reader.
The positive slopes Δ/ΔNav,x,CH and the excellent quality of the linear correlations as a function of Nav,x,CH for several co-solvent/water mixtures are a clear proof of the approach of Equations (6) and (15) for solvent mixtures. The quantity Nav,x,CH fulfils the theoretical requirements of Beer’s approximation and the Lorentz–Lorenz relation [47,67,69]. The ET(30) parameters of these aqueous solvent mixtures decrease with increasing (see Figure S2 in Supplementary Materials). These results will be explained at the appropriate place in the following text where the particular mixture is discussed.
The conclusive linear relationships in Figure 2a clearly demonstrate the approach of Equations (6) and (15) when analyzing the refractive index of aqueous solvent mixtures. However, this is only true as long as alcohol/water mixtures are not considered.
Remarkably, the linearity as a function of Nav,x,CH does not apply to alcohol/water mixtures in which the water structure is enhanced [109,110]. In particular, the methanol/water and ethanol/water systems give a maximum curve of as a function of Nav,x,CH; see Figure 2b. For the other alcohol/water mixtures, an asymptotic curve is obtained, but with a positive slope along the curve; Figure 2b. In the past there were empirical concepts to get around the non-linearity as function of composition for methanol/water; i.e., by using the quotient /density instead alone [112]. However, the physical background is more complicated and is still under investigation [113,114,115]. Recent studies have shown that at the mesoscale there are microdomains of water and ethanol/water consisting of different refractive indices [111]. Depending on the balance between segregation and aggregation of these regions [115], the non-linearity of as a function of composition is due to the coexistence of two different microdomains with different compositions and hence different refractive indices. The ratio of the two domains is a function of the original solvent proportions before mixing. The polarization effects and dipolar dispersion forces relevant to methanol/water mixtures may have an additional influence [60,93,94]. Figure 2b clearly supports the hypothesis of the coexistence of different microdomains of water/alcohol mixtures [90,91,111]. The following preliminary result can be stated: the alcohol/water mixtures that show an enhancement of the water structure according to Marcus do not show a linear dependence on Nav,x,CH.
Alcohol/water mixtures will be further discussed in this paper under the aspect of the co-existence of different microdomains.
3.3. Temperature Influence on ET(30) in Terms of Density Impact
The ET(30) data of ethanol measured at different temperatures are taken from the original work of Dimroth–Reichardt and Linert to his subject [1,116]. The used data are provided in Supplementary Materials, Table S1. With increasing temperature, ET(30) decreases due to the decreasing density of the solvent and thus the decreasing number of dipoles per volume, which leads to perfect linear correlations of ET(30) as a function of N(T); see Equations (21) and (22). The diagram is shown in Figure S3.
ET(30) = 1834 N (T) + 20.9,
n = 8 (Reichardt), r = 0.9969.
n = 8 (Reichardt), r = 0.9969.
ET(30) = 2205 N (T) + 14.3,
n = 7 (Linert), r = 0.9978
n = 7 (Linert), r = 0.9978
The influence of temperature on the ET(30) value of solutions of B30 in ethanol and methanol was also investigated by Zhao [117]. The authors hypothesized a de-defined B30/methanol complexation with decreasing temperature due to the appearance of an apparent isosbestic point in the UV/Vis spectrum series, in contrast to B30 in ethanol. This conclusion is not yet clear because the increase in the intensity of the UV/vis absorption band is probably due to volume shrinkage on cooling, for which correction is not included in the reference. It is therefore possible that the isosbestic point is caused by the contribution of two or more different species. The presence of alcohol/B30 complexes was also suggested by temperature-dependent UV/vis studies performed by El Soud [118]. However, complexation of B30 with ethanol has not been directly demonstrated through independent spectroscopic measurements. Sanders suggested that the B30/HBD solvent complex would be the actual solvatochromic species as derived from theoretical considerations [59]. However, the specific influence of the dye/solvent complex on ET(30) is much smaller than the volume effect of the global hydrogen bonding network. For these reasons, these few results represent only a snapshot, as much remains to be done to understand the effect of temperature on ET(30) in terms of density fluctuations associated with structural changes as a function of temperature [118,119]. However, this first inventory shows that the increase in ET(30) with decreasing temperature is mainly due to an increase in density and thus in N.
3.4. Solvatochromism of B30 in Aqueous Solvent Mixtures
This part of the manuscript is the central concern. It is about correcting many misinterpretations in the literature. Most of the ET(30) data of the solvent mixtures to be evaluated were taken from [1,2,3,4,11,12,13,14,15,16,17,18,19,20] and others. Some specific comments on the datasets used are necessary, as several aspects have to be taken into account. It is necessary to check which ET(30) value corresponds exactly to the given concentration, as mole fractions, weight fractions and volume fractions are used alternatively [1,2,8,11,12,13,14,15,16,17,18,19,20].
The densities of the mixtures for each specific composition and temperature are required for evaluation. This was the most difficult problem to solve. Fortunately, the densities of alcohol/water mixtures often correlate significantly with the mole fraction (x) in certain ranges of the composition. Thus, unknown densities for certain compositions can be calculated from correlation equations using accurate data from the literature. References are given in the headings of the figures and tables in the Supplementary Material section.
Fortunately, many of the measured ET(30) values from the literature are in very good agreement between different authors for series of measurements. We have compared the data of Reichardt [2] and Rosés [18,19,20] and found that an almost perfect agreement of the measured ET(30) values as a function of Nav,x is found. For an example, see Figure S4a for the ethanol/water mixture. For this task, it was necessary to convert the volume percentages from [1,2] to derive a mole fraction. Despite the very good agreement, a dataset from the same source was generally used for the analysis if sufficient measured values were available. For the FA/water mixture, data from two different references were mixed because the authors’ measurements covered different composition ranges [21,120]. The deviations are very small. When staying within one data series, the regression coefficient r approaches one for FA/water. For the NMF/water mixtures, there is no large variation above x(water) > 0.2, see Supplementary Materials of [21].
The high quality of the overall dataset from Rosés should be emphasized. Rosés also used the carboxylate substituted betaine dye of B30; the B30-COONa to study alcohol/water mixtures due to the low solubility of B30 in pure water and highly water concentrated mixtures [19]. There is an almost perfect agreement between ET(30) and ET(30-COONa) over the whole composition range. This aspect will be taken up again in the discussion section.
The perfect complementarity of the different ET(30) values for DMSO/water from several references [7,12,14,121,122] should be noted (see Figure S4b). All datasets fit exactly in one relationship (see below). However, there are very small differences [ΔET(30) ~ 1 kcal) between the authors’ results.
Since the ET(30) datasets for 1,2-ethanediol/water show some unacceptable differences in the low water concentration range between the data from [12,15], we used only the dataset from [12] which fits well (see Figure S5).
The perfect complementary agreement of the ET(30) data from [13,19] for the 2-methyl-2-propanol/water mixture at high water concentration is also particularly noteworthy.
An unfortunate and common problem was that many measured UV/Vis data of various solvatochromic dyes were accurately reported neither in the tables nor in the Supplementary Materials [6,10]. Often only the coefficients of the applied solvation models or artificially modified parameters were given instead of the original spectroscopic data.
To support the correlations of ET(30) as a function of Nav,x, Kosower’s Z-scale was considered appropriate [123,124,125] because of the linear correlation of Z with the ET(30) parameter [1,34,35]. However, this proved not to be the case. It is important to clarify the situation of the different Z values for DMSO/water and ethanol/water mixtures in the literature, as only the Z values given by Kosower have been directly determined with K [123,124]. The Z values used by Marcus for correlations were calculated by himself indirectly using Brownstein’s S values [126] (see note in citation 23 of Marcus’ paper) [12]. The same applies to Gowland’s Z values, which were also determined indirectly from 4-pyridine-N-oxide via a correlation equation [127]. We are convinced that the main problem is the reproducible measurement of Z values with Kosower’s dye, because in [127] it was mentioned that the Z value depends on the concentration of K in ethanol/water. Sufficient dilution is necessary or, alternatively, extrapolation to infinite dilution if experimental problems may occur.
To test whether case ii. of preferential solvation is significant, the literature data of other negatively solvatochromic probes such as B1 [(2,4,6-triphenyl-1-pyridinium)-phenolate] [1], Brooker’s Merocyanine (BM) [128] or Fe [129] were considered, although fewer data points per individual correlation are available. For this purpose, EP of BM or the UV/Vis absorption energy at the peak maximum νmax(Fe) are analyzed as a function of Nav,x.
3.4.1. 1,2-Ethanediol/Water, Methanol/Water and Ethanol/Water Mixtures
The reason for considering 1,2-ethanediol/water mixtures in comparison to methanol/water and ethanol/water mixtures is as follows. In all three binary solvent mixtures, the enthalpy of mixing is exothermic over the whole composition range [82,83,130]. While 1,2-ethanediol as a co-solvent does not enhance the water structure, methanol and ethanol do [109,110].
As mentioned above, the relationship ET(30) as function of x(water) resulted in a curved line, regardless whether methanol/water, ethanol/water or 1,2-ethanediol/water mixtures were considered, as seen in Figure 3b. This was discussed in the introduction and is well described in the literature [2,8,10,11,12,13,14,15,16,17,18,19,20]. The greater the difference in molar mass, the more non-uniform the mixture will be. The order of DImax is as follows: ethanediol/water mixtures (green) > ethanol/water mixtures (blue) > methanol/water mixtures (grey) (see Figure 3b). This in turn depends on the x(water) in the mixture. It can be clearly seen that the strongest curvature along a line of ET(30) as a function of x(water) for each specific co-solvent/water mixture occurs when the DI is highest. This is a purely physical effect and has nothing to do with the specific solvation.
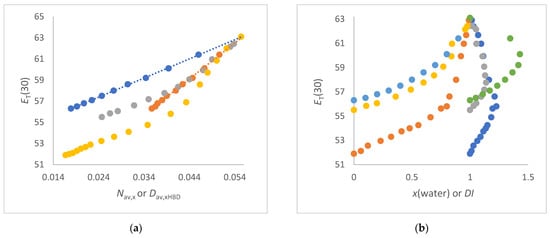
Figure 3.
(a) Comparison of correlations of ET(30) (kcal/mol) as a function of Nav,x (mol/cm3) for 1,2-ethanediol/water (blue dots) with methanol/water (grey dots) and ethanol/water (yellow dots). The orange dots belong to the correlation of ET(30) as function of DHBD for 1,2-ethanediol/water; (b) plots of ET(30) (kcal/mol) as a function of x(water) and DI, respectively, for methanol/water (grey and yellow), 1,2-ethanediol/water (light blue and green) and ethanol/water (orange and blue).
The situation is different when ET(30) is theoretically correctly correlated with Nav,x (see Figure 3a). An excellent linear correlation of ET(30) as a function of Nav,x is then obtained for the 1,2-ethanediol/water mixtures (Equations (23) and (24)). This overall result is very significant. This corresponds to the physical finding that the 1,2-ethanediol/water mixtures do not show abrupt structural changes over the entire composition range [77,110,130]. The interpretation of the ET(30) curve as function of Nav,x for the 1,2-ethanediol/water mixtures requires an essential comment, because each 1,2-ethanediol molecule contains two OH groups. Therefore, the number of OH dipoles per 1,2-ethanediol is doubled. For the 1,2-ethanediol/water mixtures, the hydroxyl group concentration is calculated as a function of the number of the total OH dipoles using the DHBD model [62]. The D,av,xHBD quantities are calculated from Equation (14) using the partial OH concentration of the 1,2-ethanediol component in the mixture (see Table S2). The function ET(30) versus DHBD for 1,2-ethanediol/water mixtures determined according to Equation (14) is the orange dotted line in Figure 3a. This curve is completely congruent with the relationship ET(30) versus Nav,x for methanol/water mixtures in the water-rich range (Nav,x > 0.04 mol/cm3) (grey dotted line of Figure 3a). However, it is noteworthy that the correlation ET(30) versus Nav,x of methanol/water mixtures from Nav,x < 0.04 mol/cm3 runs parallel to the correlation ET(30) versus Nav,x (dark blue) for 1,2-ethanediol/water mixtures. This agreement illustrates the significant influence of the concentration of OH dipoles on ET(30). This result also shows the strong influence of the total number of OH groups of binary aqueous mixtures in terms of D,av,xHBD or Nav,x on ET(30) [62]. These clear results completely exclude a preferential solvation of B30 in methanol/water, ethanol/water and 1,2-ethanediol/water mixtures in the sense of scenario ii. The results for the methanol/water and ethanol/water mixtures do not really correspond to scenario i either. It is always the total number of dipoles per volume that determines the ET(30) value within certain composition ranges, regardless of structural variations.
A kink can be seen in the correlation line ET(30) as a function of Nav,x for both methanol/water and ethanol/water mixtures in Figure 3a. These noticeable kinks in the graphs of ET(30) as a function of composition in alcohol/water mixtures have been recognized in several previous studies and attributed to structural changes in the solvent structure [5,6,131,132].
However, the linear correlations of ET(30) as function of Nav,x for each section of the solvent mixture are of excellent quality as shown by Equations (23)–(28).
ET(30) = 181.3 Nav,x + 53.02,
n = 12 (1,2-ethanediol/water); r = 0.999.
n = 12 (1,2-ethanediol/water); r = 0.999.
ET(30) = 341.1 DHBD + 44,
n = 12 (1,2-ethanediol/water); r = 0.999.
n = 12 (1,2-ethanediol/water); r = 0.999.
ET(30) = 342 Nav,x + 44.02,
n = 7 (methanol/water; Nav,x >0.04); r = 0.9957.
n = 7 (methanol/water; Nav,x >0.04); r = 0.9957.
ET(30) = 162 Nav,x + 51.5
n = 6 (methanol/water; Nav,x < 0.04; r = 0.9985.
n = 6 (methanol/water; Nav,x < 0.04; r = 0.9985.
ET(30) = 500.7 Nav,x + 35.6,
n = 8 (ethanol/water; Nav,x > 0.04; r = 0.995.
n = 8 (ethanol/water; Nav,x > 0.04; r = 0.995.
ET(30) = 158.6 Nav,x + 49.27,
n = 10 (ethanol/water; Nav,x < 0.04); r = 0.998.
n = 10 (ethanol/water; Nav,x < 0.04); r = 0.998.
Various physical data on the properties of methanol-water mixtures indicate a structural variation in the range of x(water) = 0.5 to 0.6; corresponding to Nav,x = 0.035 and 0.04 mol/cm3 [86,87,88,89,90,91,92,93,94,95].
This wide distribution is also confirmed by the heat of interaction as a function of composition, with the largest measured heat of about −850 kJ/mol in a range from x(water) ~06 to 0.75 [81,82]. The refractive index of methanol/water mixtures reaches its maximum at x(water) = 0.6 [112,113,114]. The highest heat of the exothermic interaction is at x(water) = 0.6 [82,83] (Nav,x = 0.038 mol/cm3), which is fully reflected by the DImax of the methanol/water mixtures, which is highest at x(water) = 0.6 (see Figure 1b).
However, the overall situation with these two monohydric alcohol/water mixtures is not entirely clear. For ethanol/water mixtures, the function ET(30) versus Nav,x shows a clear kink at exactly Nav,x = 0.04 mol/cm3 corresponding to x(water) = 0.8. The excess molar volume for ethanol/water mixtures is at x(water) = 0.6, but the heat of interaction is highest at x(water) = 0.82 to 0.845 [82,83]. Therefore, the refractive index maximum of ethanol/water mixtures does not correspond to thermodynamics, as is apparently the case for methanol/water mixtures. The different behavior of the composition of methanol/water and ethanol/water mixtures with respect to the refractive index was also noted by Langhals [112]. For the ethanol/water mixtures, the plots ET(30) as function of Nav,x or x(water) are clearly determined through thermodynamics. Exactly at this composition, where the largest heat of interaction is measured, the graphs show a kink in the line indicating the structural change [5,81,82,84,89]. This agreement between the curves in Figure 3a and the thermodynamics or refractive index clearly show the influence of the physical properties of the mixture on ET(30), as suggested in previous studies [5,6,131,132].
However, there are a number of other aspects to consider. Bentley [27] has shown that the volume fraction correlates better linearly with the static dielectric constant (εr) or the ET(30) values of alcohol/water mixtures than the mole fraction as a composition parameter of alcohol/water mixtures. The volume fraction has also been recommended in a recent publication to explain the ET(30) as a function of solvent composition more accurately than using the mole fraction [133]. Accordingly, for ethanol/water and methanol/water mixtures, the Nav,w and Nav,v quantities have been calculated and empirically tested as variables for correlation with ET(30) [62]. It seems surprising that the Nav,w and Nav,v quantities give a much better linear relationship with ET(30) than the use of Nav,x when the whole range of composition is considered. The methanol/water and ethanol/water mixtures fit seamlessly into the primary alcohol series when the full dataset ET(30) of primary alcohols is included; see Equations (29) and (30) and Figure S6a in the Supplementary Materials. The overall correlations with 42 data points are convincing.
ET(30) = 313 Nav,v + 46.7,
n = 42 (methanol/water, ethanol/water and primary alcohol); r = 0.994.
n = 42 (methanol/water, ethanol/water and primary alcohol); r = 0.994.
ET(30) = 304.8 Nav,w + 46.7,
n = 42 (methanol/water, ethanol/water and primary n-alcohol); r = 0.994.
n = 42 (methanol/water, ethanol/water and primary n-alcohol); r = 0.994.
We are therefore in full agreement with the conclusions of [133], that the volume fraction gives better results in terms of linear correlation. For the correlation with ET(30), however, it makes no qualitative difference whether the mass or the volume fraction is used to determine Nav,z. Therefore, the motivation for using the volume fraction given in [133] should be reconsidered. Using the mass fraction would give similar results. Whichever alcohol/water mixture is considered, the actual curve ET(30) versus Nav,w or Nav,v is not really strictly linear, although a very good regression coefficient for linearity can be calculated. The data points along the relationship lines show a significant pattern like a string of pearls, as can be seen in Figure S6 in the Supplementary Materials. This is an important detail. Thus, the subtleties observed in the correlation of ET(30) with Nav,x do not disappear, but are merely reduced in the plots ET(30) as a function of either Nav,w or Nav,v. The approximate linearity of ET(30) as a function of Nav,w or Nav,v is due to the stronger algorithmic consideration of the inhomogeneity of the solvent components in Nav,w or Nav,v (see Figure 1b).
These results clearly show that the discussed preferential solvation of B30 by water is meaningless for methanol/water and ethanol/water mixtures. This is also an indication that the polarization forces and dipolar effects of the molecules in the solvated mixture act collectively on B30. In 1963, in the first paper on phenolate betaine dyes, Dimroth and Reichardt also studied the better water soluble B1 probe in ethanol/water mixtures [1]. For data, see Table S4. There is also a very good correlation of ET(1) as function of Nav,v, as can be seen from Equation (31). The correlation of ET(1) as versus Nav,x is equivalent to that of ET(30) versus Nav,x.
ET(1) = 216.7 Nav,v + 57.95,
n = 10 (B1 in ethanol/water and water), r = 0.988.
n = 10 (B1 in ethanol/water and water), r = 0.988.
If pure water is omitted from Equation (31), then the correlation quality is significantly improved to r = 0.999. This is also a strong indication that B1 is preferentially enriched in ethanol/water-rich regions when the mixture is examined. The xb values of BM (xb is the shift of the UV/Vis peak of BM in methanol/water) [128]) correlate very well with Nav,x; see Equation (32).
xb = 201.2 Nav,x + 57.8,
n = 11 (BM in methanol/water), r = 0.997.
n = 11 (BM in methanol/water), r = 0.997.
Consequently, the preferential solvation of BM in methanol/water as assumed by Machado [26] or Tanaka [134] is not applicable when Nav,x is used instead of x(water) to evaluate solvatochromism. The methanol/water mixtures were also studied by Taha using the Fe probe [129]. There is also a linear correlation and no curved curve for νmax(Fe) as function of Nav,x, Equation (33).
νmax(Fe) [103 cm−1] = 36.66 Nav,x + 17.32,
n = 11 (Fe in methanol/water), r = 0.992.
n = 11 (Fe in methanol/water), r = 0.992.
For ethanol/water mixtures, the νmax(Fe) as function of Nav,x shows a similar correlation with excellent quality as previously reported [43]. The correlation of νmax(Fe) with x(water) in place with Nav,x is worse.
These results clearly show that several types of negatively solvatochromic dyes such as B30, B1, BM and Fe do not indicate preferential solvation in the methanol/water and ethanol/water mixtures. Thus, the linear correlations of EP parameters as function of Nav,x according to Equation (2) are clearly confirmed by other solvatochromic dyes despite the smaller dataset compared to ET(30). Since the UV/Vis energies of the different solvatochromic probes show the same linear dependencies as a function of Nav,x, it is quite clear that the solvent structure determines the solvatochromism and not the preferred solvation according to scenario ii. This conclusion is in complete agreement with older results by Langhals [5].
3.4.2. Formamide/Water and other Amide/Water Mixtures
FA/water is the only binary aqueous mixing system considered in this study that fulfils the thermodynamics of ideal mixing [66,110,135,136]. The heat of mixing is endothermic, and the entropy is positive over the whole composition range. The mixing entropy is highest at x = 0.5 [135,136].
The best linear correlations (r about 1) of ET(30) as a function of Nav,x over the whole composition range of the solvent mixture were found for FA/water, NMF/water and 1,2-ethanediol/water mixtures (see Figure 3a and Figure 4a).
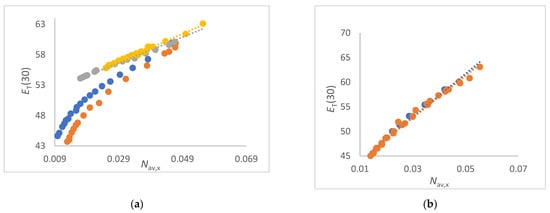
Figure 4.
(a). Correlations of ET(30) (kcal/mol) as a function of Nav,x (mol/cm3) formamide/water (yellow), NMF/water (grey), N-formylmorpholine/water (blue) and DMF/water (orange) mixtures. For data, see Tables S2–S5; (b) correlations of ET(30) (kcal/mol) as a function of Nav,x (mol/cm3) for DMSO/water mixtures (orange, all data); blue dots are data from [15] (O Connor).
For FA/water mixtures the linear correlations ET(30) as function of Nav,x are of excellent quality; see Figure 4a as well as Equation (34).
ET(30) = 229 Nav,x + 50.2,
n = 16 (FA/water); r = 0.999.
n = 16 (FA/water); r = 0.999.
The perfect linearity of ET(30) as a function of Nav,x can be explained by the excellent physical properties of the FA/water mixtures [109,110,135,136,137,138]. The water-like structure of FA is due to the fact that water and FA molecules can exchange positions without changing the solvent structure [139]. Only the VE (Equation (13)) changes a little, as a function of composition [138]. There is no segregation within the FA/water mixtures and the average number of dipoles per volume perfectly determines the ET(30) at room temperature. A very good linear relationship ET(30) versus Nav,x is also obtained for NMF/water mixtures, see Equation (35).
ET(30) = 212 Nav,x + 50.5,
n = 17 (NMF/water); r = 0.993.
n = 17 (NMF/water); r = 0.993.
Furthermore, for NFM/water and DMF/water mixtures, there are also excellent linear correlations of ET(30) as function of Nav,x in the section of higher water content range; xco-solvent < 0.35 [31,107,140,141,142].
The slight kinks in the curves at lower water contents are due to the non-linear change in density as a function of composition [140,141,142]. The physical data of the NMF/water, DMF/water and NFM/water mixtures are given in Tables S2–S5 in the Supplementary Materials. According to [76], water is considered to be a solute rather than a solvent when Nav,x < 0.035 mol/cm3. However, an excellent linear correlation of the refractive index as a function of Nav,x,CH is seen for all mixtures (see Figure 2a) over the entire composition range, including the range of low water concentrations.
Marcus also described the aqueous urea solution as a binary solvent mixture system in which no enhancement of the water structure occurs, although pure urea is a solid at room temperature [110]. Accordingly, we analyzed the ET(30) values of the urea/water and N,N-dimethylpropylene urea/water binary mixtures from the literature [143,144,145]. There are very good linear correlations of ET(30) as a function of Nav.x for both urea/water and N,N-dimethylpropylene urea/water mixtures with high correlation quality (see Figure S6a in Supplementary Materials). This result shows that solutions of solids in water can also be treated in the same way. If the co-solvent or co-component (urea, N,N-dimethylpropylene urea) can form a three-dimensional hydrogen bond structure with water, then a linear correlation of ET(30) with Nav,x is found.
3.4.3. DMSO/Water Mixture
DMSO/water mixtures represent a physical challenge among binary aqueous solvent systems due to the unclear thermodynamics at higher DMSO contents [146,147,148,149,150,151,152,153,154]. This was therefore chosen for this fundamental work as an illustrative example. There are a large number of physical studies on these mixtures, so only those relevant to the explanation of solvatochromism in terms of Nav,x will be referred to. The following analysis shows where the problems lie. There results a very good linear correlation of ET(30) as function of Nav,x including ET(30) data from several references, Equation (36) and Figure 4b.
ET(30) = 432 Nav,x + 39.7,
n = 22 (DMSO/water) r = 0.993.
n = 22 (DMSO/water) r = 0.993.
Although the overall correlation ET(30) with Nav,x seems convincing due to the clear linearity, there is a small kink in the linear plot at Nav,x ≈ 0.025 to 0.03 mol/cm3. The kink becomes more obvious when considering only the data from [15], see Equations (37) and (38).
ET(30) = 414 Nav,x + 40.7,
n = 9 (DMSO/water-rich; Nav,x > 0.02); r = 0.998.
n = 9 (DMSO/water-rich; Nav,x > 0.02); r = 0.998.
ET(30) = 624 Nav,x + 36.2,
n = 5 (DMSO/water low; Nav,x < 0.02); r = 0.999.
n = 5 (DMSO/water low; Nav,x < 0.02); r = 0.999.
This small effect has a significant physical background as the density of the binary solvent mixture changes significantly at this composition [146,148]. However, density measurements for DMSO/water mixtures in the DMSO-rich region are not consistent in the literature [146,148]. In the water-rich range from Nav,x < 0.05541 mol/cm3 (pure water) to Nav,x = 0.03 mol/cm3, the density of water/DMSO mixtures decreases linearly with increasing water content. The density is almost constant in the range from Navx = 0.03 (60% weight DMSO) to 0.014 mol/cm3 (pure DMSO) (see Table S9). In [148], it was reported that the density even decreases slightly. It should be noted that exactly at this mixture composition Nav,x = 0.028 mol/cm3 the plot of ET(30) as a function of Nav,x has a slight, imperceptible kink.
In the literature, there are several investigations on the DMSO/water mixtures using different solvatochromic probes [12,15,129,155,156,157]. Regardless of the type of solvatochromic probe used, it is clear that at Nav,x ≈ 0.03 mol/cm3 a slight change in the profile of the parameter values can be observed as a function of the composition. Thus, the physical structural change of the DMSO/water mixtures determines the empirical parameter and not the artificially constructed acid-base properties of the solvent system [155,157]. This result is fully consistent with the prediction in the introduction that no differences should occur in scenario ii. when different probes are used. For reasons of space, the analyses of the Kamlet–Taft (KAT) parameters of DMSO/water mixtures [157] are presented in Figure S9 in the Supplementary Materials. As a consequence of this result, the determination of individual empirical polarity parameters in terms of the KAT or Catalán scale is meaningless for DMSO/water mixtures. Furthermore, a curved function of the ET(30) value of the solvatochromic probe on x(water) of DMSO/water mixtures is found (see (Figure 5) of [12]). If the x(water) is replaced by Nav,x, a linear correlation is obtained, as shown in Figure 4b. The correlation of the UV/Vis absorption energy of other probes such as Fe [νmax10−3 cm−1 (Fe)] [129] as function of Nav,x for DMSO/water mixtures clearly shows a linear dependence, see Equation (39).
νmax10−3 cm−1 (Fe) = 67.7 Nav,x + 15.8,
n = 12 (DMSO/water), r = 0.996.
n = 12 (DMSO/water), r = 0.996.
The change in the curve of the solvatochromic parameter after at Nav,x about 0.03 mol/cm3 is clearly due to physical changes in the solvent structure. Furthermore, if the static dielectric constant (εr) of DMSO/water mixtures is plotted as a function of Nav,x, then the kink at Nav,x at 0.03 mol/cm3 becomes also evident (see Figure S7a). The εr data are taken from [151]. This property is also shown in the plots of ET(30) as a function of (Figure S2). While the correlation of as a function of Nav,CH (Equation (10)) is nearly linear (Figure 2a), the correlation of ET(30) as function of shows a slight kink at Nav,x = 0.03 mol/cm3.
To return to the DMSO/water mixtures, the concentration of all dipoles (water + DMSO) of the system determines the solvatochromic property and not the preferential solvation. This is a clear result. The only surprising thing is the rather good linearity of the function ET(30) versus Nav,x when many data from the literature are used together. This shows that B30 is not very sensitive to physical changes in the DMSO/water mixture system at RT. Therefore, the solvatochromic method is not well suited to detecting the physical change in the liquid structure of DMSO/water at different compositions.
What is the reason for the good linearity of ET(30) as a function of Nav,x although major structural changes of the mixture occur at Nav,x = 0.03 mol/cm3? The complexity of the water dynamics of DMSO/water mixtures has been thoroughly investigated through ultrafast IR experiments and dielectric spectroscopy [149,150,151]. These results are very important in partially explaining the results of the correlations in this study. The average lifetime of water-bound DMSO changes (decreases) almost linearly with the mole fraction of water. This result is consistent with ET(30) increasing almost linearly with water content (see also Figure 5 in [149]). This explains why the barely noticeable kink in the correlation can be neglected, as the water dynamics overcome the local structuring around the dissolved dye. Thus, the lifetime of the water/water component is independent of the water concentration in the high DMSO region Nav,x < 0.03 mol/cm3. Obviously, neither water/DMSO nor B30/water complexes are relevant for the determination of ET(30) since the solvent mixture has a high dynamic at 298 K [150,151]. Thus, even if DMSO/water or B30/water complexes are present, they cannot be detected using B30 due to the fast dynamics of the binary solvent system. The situation is similar to other solvatochromic dyes such as Fe. Therefore, other physical measurements such as dielectric spectroscopy are more suitable than solvatochromic probe molecules for analyzing the structure of DMSO/water mixtures. The outstanding behavior of the DMSO/water mixtures at higher DMSO contents Nav,x < 0.028 mol/cm3 has been the subject of numerous simulation experiments [152,153,154]. Apparently, the behavior at Nav,x < 0.03 mol/cm3 is due to the entropy increase in the system, which is still difficult to understand theoretically [154], since the experimentally determined heat of interaction is exothermic over the whole composition range.
3.4.4. 1,4-Dioxane/Water Mixtures
The 1,4-dioxane/water mixtures were subjected to numerous physical tests [158,159,160,161,162,163,164,165,166,167,168,169]. The dependence of the UV/Vis-absorption energy maxima of solvatochromic dyes such as B30, Fe, M540, various 7-N,N-diethylaminocoumarins or harmaline as function of dioxane/water composition has been extensively studied in the literature [2,5,70,129,165,166,167,168,169].
The thermodynamics of 1,4-dioxane/water mixtures is characterized by a transition from exothermic to endothermic heat of mixing with increasing 1,4-dioxane content [158]. This is the main difference to the DMSO/water system [147]. The heat of interaction ΔrH of 1,4-dioxane/water mixtures has its maximum exothermic heat at around x(water) = 0.8 (yellow dot in Figure 5b) corresponding to Nav,x = 0.032 mol/cm3 or Nav,v = 0.018 mol/cm3. The largest partial molar volume of water in 1,4-dioxane/water mixtures is x = 0.8 [167]. ΔrH is zero at x(water) = 0.52 (Nav,x = 0.02 mol/cm3). With this composition, the 1,4-dioxane/water mixture has the highest density and the lowest −TΔS value. At x(water) < 0.52, the heat of interaction becomes endothermic. For the evaluation in this paper, the volume fractions of the 1,4-dioxane/water mixtures given in [2] were reconverted to the average molar concentration of the solvent dipoles. Fortunately, there is excellent agreement between the ET(30) data from four different literature sources, as shown in Table S7. The ET(30) data from these four different sources fit perfectly into a relationship. To evaluate the influence of the inhomogeneity of the mixture with respect to the composition, we plotted ET(30) as function of Nav,x and Nav,v as well as x(water) (Figure 5a,b).
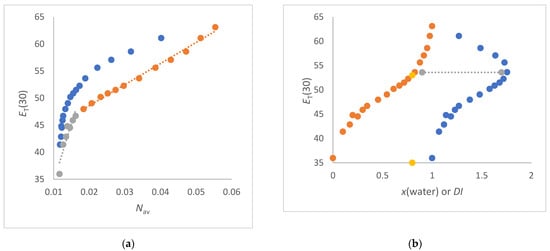
Figure 5.
(a) Correlations of ET(30) (kcal/mol) as a function of Nav,x (mol/cm3) (orange dots) and Nav,v (blue dots) for 1,4-dioxane/water mixtures at 298 K; (b) plots of ET(30) (kcal/mol) as a function of x(water) for 1,4-dioxane/water mixtures (orange dots) compared with the inhomogeneity (DI) of the system in terms of Mav,v/Mav,x ratio (blue dots). The yellow dots indicate the composition with the greatest inhomogeneity. The yellow dots indicate the composition with the inflection point and the greatest inhomogeneity. The grey dots show the correspondence between the two curves in terms of maximum inhomogeneity.
The correlation of ET(30) as a function of Nav,x results in two consecutive linear lines with different slopes. The change in the function ET(30) as function of Nav, is at Nav,x = 0.015 [x(water) = 0.3] mol/cm3; see Equations (40) and (41) and Figure 5a.
At this composition (at ET(30) ~ 46 kcal/mol), there is also the strongest curvature in the curve ET(30) as a function of x(water) in the 1,4-dioxane-rich section (see Figure 5b).
ET(30) = 2997.5 Nav,x + 2.123
r = 0.944, n= 7 (Nav,x < 0.02 mol/cm3, 1,4-dioxane rich section)
r = 0.944, n= 7 (Nav,x < 0.02 mol/cm3, 1,4-dioxane rich section)
ET(30) = 398,8 Nav,x + 40.42
r = 0.997, n= 12 (Nav,x > 0.02 mol/cm3, water-rich section)
r = 0.997, n= 12 (Nav,x > 0.02 mol/cm3, water-rich section)
The correlation of ET(30) as a function of Nav,v (blue dots in Figure 5a) gives an asymptotic curve without linearity of specific sections. This could be explained by the fact that the variable Nav,v better reflects the inhomogeneities of the composition.
The 1,4-dioxane/water mixtures are subject to fine structuring over the whole composition range, in which both types of molecules are always involved [161,162,163,164]. The volume structure of 1,4-dioxane/water mixtures changes significantly in the range of Nav,x < 0.02 mol/cm3. Accordingly, the strongest bend in the graph ET(30) as function of Nav,x corresponds to the composition where the significant change in the volume structure of the 1,4-dioxane/water mixtures takes place. Exactly at ET(30) = 47 kcal/mol (Nav,x = 0.018 mol/cm3), the dielectric relaxation time τ1 passes through a maximum (τ1 ≈ 25 ps) for 1,4-dioxane/water mixtures [162]. The use of Nav,X(water) according to Equation (14) as the mixture composition parameter gives a similar plot as when Nav,x is used (see Figure S8b), indicating that 1,4-dioxane and water are always involved together in the volumetric structure and thus in the dissolution of dissolved B30. Thus, 1,4-dioxane does not enhance the water structure in any way, which is in full agreement with the Marcus classification [110].
It is worth analyzing the correlations of ET(30) as a function of x(water) from the point of view of thermodynamics and the structural change of the 1,4-dioxane/water mixtures as shown in Figure 5b. At x(water) = 0.52 (Nav,x = 0.02 mol/cm3), the curve ET(30) as a function of x(water) shows an inflection point (not marked in Figure 5b). It is precisely at this composition that this binary solvent system behaves in an athermal manner, i.e., ΔrH mixture = 0 [158,159]. The strong curvature ET(30) as a function of x(water) = 0.8 (marked in yellow) (Nav,v = 0.015 mol/cm3) is clearly due to the inherent mass inhomogeneity of the mixture, as shown in the simultaneous plot for the DI (Figure 5b). At this composition (Nav,x = 0.032 mol/cm3), mixing has the highest exotherm. This result is consistent with the results from the thermodynamics of methanol/water and ethanol/water mixtures, which are a good indication that x(water) reflects the thermodynamics of the mixture in relation to other quantities more comprehensively than the quantity Nav,x. Thus, the S-shaped function ET(30) versus x(water) (Figure 5b, orange dots) is attributed to the change in interaction heat as function of composition. This feature is only partly recognized when Nav,x is used as the composition size, as seen in Figure 5a. There is no bend or kink in the plot ET(30) as function of Nav,x for Nav,x ~ 0.032 mol/cm3 (largest exothermic heat), but at Nav,x = 0.02 mol/cm3 (zero heat).
The linear function of ET(30) as a function of Nav,x in the water-rich region Nav,x > 0.02 mol/cm3 is due to the fact that the average concentration of both the water dipoles and 1,4-dioxane molecules determines the ET(30) value. Both fractions are constantly mixed together and do not segregate [162,163]. The larger ET(30) in the 1,4-dioxane rich fraction, compared to a hypothetical linear plot of ET(30) versus Nav,x, can be easily explained by the results of Buchner: “This indicates a largely microheterogeneous structure for such mixtures, with the presence of water-rich domains of significant size in the dioxane-rich fraction” [163]. Thus, B30 preferentially measures the water enriched portions of the 1,4-dioxane/water domains within the compositional spectrum. Obviously, the water clusters are solvated by the 1,4-dioxane excess and the B30 is enriched in the 1,4-dioxane clusters below Nav,x < 0.015 mol/cm3.
The refractive index as a function of the composition Nav,xCH of the 1,4-dioxane mixture (see Figure 2a, red dots) and Equation (23) give a linear curve. This is consistent with the fact that the static permittivity εr of 1,4-dioxane/water mixtures is also a linear function of Nav,x including pure 1,4-dioxane (see Figure S7b). For this investigation, the composition data x(water) from [162] were converted to Nav,x. In contrast, the correlation of ET(30) as a function of εr or is not linear over the whole composition range, because the values of the pure 1,4-dioxane or the 1,4-dioxane-rich fraction do not fit linearly; see Figure S8a.
As a consequence, the B30 probe reflects the volumetric structure of 1,4-dioxane/water differently compared to volumetric polarity-related physical measurements such as dielectric spectroscopy or refractive index. In summary, the 1,4-dioxane/water mixtures present a challenge in terms of the formation of solvent structures as a function of the quantitative composition, since different physical methods (UV/vis spectroscopy of B30, dielectric spectroscopy, refractive index, calorimetry) register different dependencies of the measurand on the different composition sizes.
Note that only x and Nav,x are physically based quantities, referring to thermodynamic and UV/Vis spectroscopic quantities, respectively. Despite this concern, in summary, the complex dependence of ET(30) on the composition of 1,4-dioxane/water mixtures can be readily interpreted in terms of Nav,x, Nav,v or x(water). This is possible by analyzing the physical properties of this binary solvent system, where thermodynamics, dipole concentration and solvent dynamics play a role. Despite this caveat, it is clear that the specific solvation of B30 by HBD solvent molecules is not responsible for this UV/Vis shift. The ET(30) of 1,4-dioxane/water mixtures is mainly determined through the concentration of water dipoles permanently mixed with 1,4-dioxane molecules.
3.4.5. 2-Propanol/Water and 2-methyl-2-propanol/Water Mixtures
The 2-propanol/water and 2-methyl-2-propanol/water mixtures are considered separately because they show a change in the heat of mixing with increasing alcohol content in the sense of a reversal from exothermic to endothermic heat [80,82], similar to the 1,4-dioxane/water mixtures [158]. In particular, the 2-methyl-2-propanol-water mixtures in particular have been the subject of research and speculative interpretations in recent decades [170,171,172,173,174,175,176,177,178,179]. A mystical character has been attributed to this particular mixture due to the method-dependent results of the mixture [178].
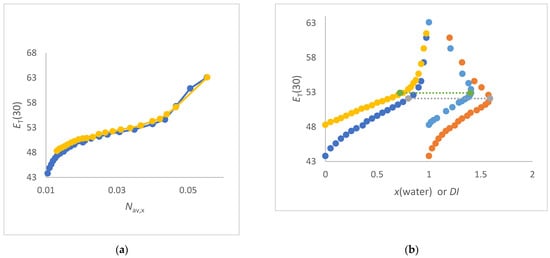
Figure 6.
(a) Correlations of ET(30) (kcal/mol) as a function of Nav,x (mol/cm3) for 2-propanol/water (yellow) and 2-methyl-2-propanol/water (blue); (b) plot of ET(30) (kcal/mol) as a function of x(water) for 2-methyl-2-propanol-water (dark blue and orange) and 2-propanol/water (yellow and light blue) compared with the plot of ET(30) as a function of the inhomogeneity (DI) of the solvent mixture in terms of Mav,w/Mav,x (orange and light blue).
The plot of ET(30) as a function of mole fraction x(water) shows relatively similar curves for all mixtures (see Figure S10 in the Supplementary Materials).
If one compares the curves ET(30) with the curve of the inhomogeneity (DI) of the solvent mixture, both as a function of x(water), see Figure 3b and Figure 6b, then the same result is obtained for 2-propanol/water and 2-methyl-2-propanol/water, methanol/water, ethanol/water and 1,4-dioxane/water mixtures. The strongest curvature of the plot ET(30) versus x(water) always occurs immediately after the strongest inhomogeneity. This corresponds “immediately after” to a difference of about 1.5 kcal/mol with respect to ET(30), which is illustrated by the horizontal lines (grey and green dots) between the two curves in Figure 6b. This scenario can be found in all plots of ET(30) versus Mav,w/Mav,x, regardless of the type of alcohol/water mixture.
The curves ET(30) as a function of Nav,x for methanol/water, ethanol/water, 2-propanol/water and 2-methyl-2-propanol/water mixtures differ qualitatively for both methanol/water and ethanol/water mixtures compared to both 2-propanol/water and 2-methyl-2-propanol/water mixtures in the low water content range. Therefore, the plots of ET(30) as a function of Nav,x show an inflection points at about 0.031 mol/cm3 and 0.0273 mol/cm3 for 2-propanol/water and 2-methyl-2-propanol/water mixtures, respectively.
At lower water concentrations, the 2-propanol/water mixtures (x(water) < 0.5; Nav,x = 0.02 mol/cm3) and 2-methyl-2-propanol mixtures (x(water) < 0.55; Navx = 0.018 mol/cm3) are endothermic in terms of the heat of mixture. At about x = 0.65 to x = 0.5 (water) (Nav,x ≈ 0.03, see Figure 6a), both systems behave athermally; i.e., ΔHmixing = 0. Exactly at this composition, the curve ET(30) as a function of Nav,x (see Figure 6a) shows an inflection point. The same result is found for the 1,4-dioxane/water mixtures (see Figure 5b). In the composition range with endothermic heat of mixing, both curves ET(30) vs. Navx show a higher ET(30) than would be expected from linearity. In this region, the entropy of mixing is positive and the proportion of water in the mixture determines the ET(30) proportionally, more than in the water-rich region does. The dielectric relaxation time decreases significantly from low to high water content, i.e., the structure in the water-poor region is more stable in time than in the water-rich region.
The Fe complex has also been studied in 2-propanol/water mixtures [129]. Consistent with the correlations of ET(30) versus Nav,x,, the plot of νmax (Fe) as a function of Nav,x (see Figure S11) shows a similar pattern to that of Figure 6a. This shows the influence of the physical structure of the solvent as a function of composition.
In addition, there are numerous studies with positive solvatochromic probes such as Nile Red [7], 4-nitroaniline [18,180,181,182], 4-nitroanisole [18], 4-(1-azetidinyl)-benzo-nitrile [177] or coumarin 343 and 480 [178] in various alcohol/water mixtures.
While ET(30) as a function of Nav,x for 2-propanol/water and 2-methyl-2-propanol/water mixtures show similar curves, the situation is different for the 2-butoxyethanol/water mixtures.
3.4.6. 2-Butoxyethanol/Water Mixtures
As a final example, the solvatochromism of B30 in 2-butoxyethanol (BE)/water mixtures is reanalyzed. The ET(30) data are taken from [8]. BE itself is partially hydrophobic, but it mixes completely with water at room temperature; separation occurs only at higher temperatures [8,183]. Due to their self-structuring properties, BE/water mixtures have been the subject of numerous physical investigations [184,185,186,187,188,189,190,191,192,193]. The self-propelled agglomeration of the BE molecules in water has been demonstrated through various scattering methods [184,185]. At x(BE) > 0.02 agglomeration begins to occur resulting in an inhomogeneous solvent mixture at the level of about 1 nm [184]. However, other studies have shown that 130 nm aggregates are present [185]. The inhomogeneity of the BE/water mixing system is complicated by the fact that this feature can be observed at different length and time scales [188,189,190,191,193].
The mixtures BE/water and 2-methyl-2-propanol/water are often compared for their similarity [193]. We will show that, despite the discussion in the literature, the two solvent mixtures are completely different. The microstructures of both solvent mixtures are very subtle and are strongly influenced by the composition in the water-rich part. However, the heat of mixing is exothermic over almost the whole composition range for BE/water mixtures, but weakly endothermic at high BE concentrations (about 95 wt%) [187,188]. In addition, photo-switchable spiro compounds have been measured in BE/water mixtures [192]. It has been suggested that the solvent structure of BE/water is affected by this type of photo-switching. Therefore, it cannot be excluded that the dissolved probe molecule co-determines the fine structure of BE/water mixtures, complicating the whole situation. Therefore, only the analysis of the ET(30) values will be discussed here. Unfortunately, the interesting solvatochromic results of El Seoud on this solvent system were not given as original data [22]. Plotting ET(30) as a function of Nav,x for BE/water mixtures gives an asymmetric profile, as shown in Figure 7a (grey dots).
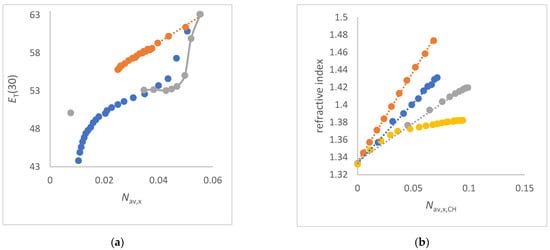
Figure 7.
(a) Relations of ET(30) (kcal/mol) as a function of Nav,x (in mol/cm3) for BE/water mixtures (grey). The links between the individual grey dots are a guide for the reader. 2-methyl-2-propanol/water mixtures (blue) compared to the FA/water mixtures (orange dots), which have ideal mixing behavior, as a reference; (b) relations of as a function of Nav,x,CH for 2-butoxyethanol/water (grey), 2-methyl-2-propanol/water (yellow), 1,2-ethanediol/water (blue) and glycerol/water mixtures (orange).
The crucial region of low BE content (at Nav,x = 0.0497 mol/cm3) deserves special attention, since, at this composition, the agglomeration of BE molecules occurs [x(BE) ≈ 0.02; or Nav,xCH = 0.017 mol/cm3] [184]. B30 dye is apparently absorbed by these BE-rich agglomerates, leading to an abrupt decrease in ET(30) at Nav,x ≈ 0.05 mol/cm3, as shown by the grey dotted line in Figure 7a. This is consistent with the fact that ET(30) decreases abruptly with increasing C-H concentration due to the BE component at Nav,CH = 0.017 mol/cm3 (not plotted; for data, see Table S13). There is only a narrow transition.
This result exactly fulfils the preferential solvation scenario i., as explained in the Introduction. The agglomeration of BE is driven by hydrophobic interactions, as also suggested by the analysis of the fluorescence of coumarin and related probe molecules in BE/water mixtures [193,194]. Obviously, the trapping of probes is also determined through the solvent cage property of the BE/water mixtures. This is in contrast to 2-methyl-2-propanol/water mixtures, where strong thermal fluctuations in partial concentrations occur [195,196]. Thus, in 2-methyl-2-propanol/water mixtures there is no true hydrophobic solvation of B30, but the partial water structures are changed depending on the composition, as discussed in the previous chapter.
The two binary solvent mixtures glycerol/water and 1.2-ethanediol/water show a perfect mixing behavior according to the Marcus classification, so that there is no enhancement of the water structure in any way [110]. These two mixtures are documented in Figure 7b as references. For glycerol/water and 1,2-ethanediol/water mixtures, there are perfect linear correlations of as a function of Navx,CH; see Equations (42) and (43) [89,197].
The larger slopes of Δ/ΔNavx,CH for glycerol/water and 1,2-ethanediol/water mixtures compared to BE/water mixtures are attributed to the influence of the polarizability of the hydrogen bond network and the higher refraction of the C-O bond compared to C-H [60,62,108].
The change in the overall bulk solvent structure of 2-methyl-2-propanol/water mixtures as a function of composition is also clearly visible in the plot of the refractive index as function of Nav,xCH (yellow dotted lines in Figure 2b and Figure 7b), which shows a kink at about 0.035 to 0.04 mol/cm3. Remarkably, the kink in the plot of ET(30) as a function of Nav,x is also observed at this composition; see Figure 6a. In this concentration range, the thermodynamic changes from exothermic to endothermic with increasing Nav,xCH for 2-methy-2-propanol/water mixtures. This thermodynamic scenario does not apply to BE/water mixtures [187,188].
Remarkably, the correlation of as function of Nav,xCH for BE/water mixtures is approximately linear over the whole composition range; see Equation (44) and Figure 7b (grey dotted line).
Obviously, BE as a co-solvent does not enhance the water structure, but water enhances the BE structure. That is the special thing. According to the Marcus classification, this is the reverse scenario of solvent structure enhancement. These considerations convincingly show the qualitative differences between BE/water and 2-methyl-2-propanol/water mixtures. The different solvation behavior of B30 in BE/water mixtures compared to 2-methyl-2-propanol/water mixtures can also be supported by considering the DI from Equation (9). The BE/water mixtures show the greatest inhomogeneity with respect to DI at x(water) = 0.85 (Nav,x = 0.029 mol/cm3), while the kink in the curve ET(30) as a function of Nav,x occurs far away from this at ≈ 0.045 mol/cm3. This is the crucial difference between BE/water mixtures and all other (monohydric) alcohol/water mixtures studied in this work. Therefore, this result could be used as a criterion to define the preferential solvation scenario of case i. However, the results do not exclude that the B30 dye itself has an influence on the solvent cage of the BE/water mixture at low BE content, as mentioned in [192,193] for other solutes.
4. Discussion
The plot of ET(30) as a function of Nav,x for co-solvent/water mixtures shows a different pattern depending on the co-solvent of the mixture. The scenario of each specific co-solvent/water mixture can be clearly assigned according to the Marcus classification. Four different scenarios can be identified:
- A.
- The ET(30) increases significantly and linearly with Nav,x (1,2-ethanediol/water, FA/water, urea/water, NMF/ water and DMSO/water mixtures) (see Figure 3a and Figure 4a,b). These co-solvents belong to the group of solvents that do not enhance the water structure at all and form strong hydrogen bonds with water. In these cases, the ET(30) of the pure co-solvent is fitted to the linear plot.
- B.
- The ET(30) increases asymptotically with increasing Nav,x where the ET(30) value is always higher than with a linear dependence (1,4-dioxane/water, DMF/water and NFM/water mixtures) (see Figure 4a and Figure 5a). In these cases, the co-solvent-rich fraction shows the non-linearity ET(30) as function of Nav,x. These co-solvents do not enhance the water structure but form weaker hydrogen bonds with water than those belonging to scenario (A).
- C.
- The ET(30) increases as Nav,x increases, with the ET(30) value always being lower than expected for a linear dependence (see Figure 3a). This scenario applies to methanol/water and ethanol/water mixtures. These co-solvents enhance the water structure.
- D.
- ET(30) shows an S-shaped curve as a function of Nav,x (see Figure 6a). With increasing Nav,x the ET(30) value is always higher than expected with a linear dependence in the co-solvent-rich part. In the water-rich part, the ET(30) is lower than with a linear dependence according to scenario (C). The mixtures 2-propanol/water, 2-methyl-2-propanol/water and 2-butoxyethanol/water belong to this group. This scenario applies to binary solvent mixtures that interact either on the structure of the water or on the structure of the co-solvent.
In particular, these binary co-solvent/water mixtures of scenario (A), which include glycerol/water mixtures, have been shown to be robust reference liquids for contact angle measurements, as no segregation occurs when in contact with different types of surfaces [198]. This is an important result in support of the Marcus theory for the classification of aqueous mixtures.
When rapid solvent dynamics occur in a particular solvent system, thermal motion overcomes local structuring effects. An almost perfect linear relationship of ET(30) as a function of Nav,x is then observed. This scenario is shown to hold for FA/water, DMSO/water, 1,2-ethanediol/water, urea/water and NMF/water mixtures. This interpretation is strongly supported by the results of dielectric spectroscopy and ultrafast IR experiments.
The heat of mixing of the 1,2-ethanediol/water, DMSO/water and NMF/water mixtures is exothermic over the whole composition range, whereas the heat of interaction of the FA/water mixtures is always weakly endothermic. The best fits of ET(30) as a function of Nav,x are for 1,2-ethanediol/water, NMF/water mixtures (exothermic over the whole composition range) and FA/water mixtures (weak endothermic over the whole composition range). For all co-solvent/water mixtures with respect to scenario (A), the qualitative heat of interaction does not change as a function of composition.
With regard to scenario (B), these co-solvents also belong to the Marcus classification, which do not enhance the water structure. There is a linear dependence of ET(30) as a function of Nav,x up to Nav,x > 0.02 mol/cm3. However, the water fraction obviously has a greater effect on ET(30) than the average number of dipoles over the whole composition range would suggest. A linear correlation of ET(30) as a function of Nav,x is always found in the range of higher water contents. Thus, the average molar concentration of the dipoles (water and co-solvent) acting on the probe is the dominant factor in the higher water content range. Only from Nav,x > 0.0135 is there a bend in the curve, indicating that water as a co-component loses its influence on ET(30). These co-solvents form weaker hydrogen bonds with water compared to scenario (A), indicating that the water structure changes non-linearly with composition [199,200,201]. These co-solvents can be classified differently depending on the criteria used by Marcus for evaluation.
For the 1,4-dioxane/water mixtures, the ET(30) is always larger than expected from the sum of water and 1,4-dioxane dipoles. The curves for 1,4-dioxane/water and DMF/water mixtures are congruent up to Nav,x = 0.0135 mol/cm3. However, while the heat of mixing of DMF with water is exothermic over the whole composition range, the situation is different for 1,4-dioxane/water mixtures, as discussed above. Therefore, the thermodynamic changes in the DMF/water and dioxane/water mixtures are not always captured by the correlation of ET(30) with Nav,x.
The correlation of ET(30) with x(water) gives a better indication of the thermodynamic changes at different compositions of the 1,4-dioxane/water mixture.
This detailed result is very significant because it shows the linkage of x(water) with thermodynamics but not directly with the UV/Vis shift. In summary, scenario (B) requires more detailed studies using related binary solvent mixtures. Further studies will consider the complexity of THF/water, acetone/water and acetonitrile/water mixtures and other binary solvent mixtures such as pyridine/water or piperidine/water mixtures [2] with respect to solvatochromism. These evaluations are necessary to clarify or complement some of the conclusions regarding scenario (B) of this study. As shown by Marcus [200,201], each specific mixture actually requires special treatment in order to understand the many physical effects. Therefore, this review provides only a rough overview of the overall problem using selected examples.
In scenarios (C) and (D), the co-solvents belong to the Marcus classification, which enhance the water structure. But why is the ET(30) value for methanol/water, ethanol/water, 2-propanol/water and 2-methyl-2-propanol/water mixtures lower at high water concentrations than would be expected from a linear dependence such as that observed for 1,2-ethanediol/water, as seen in Figure 3a? The answer is quite pragmatic: the hydrophobic dye B30 is difficult to dissolve in pure water [1]. It therefore dissolves much better in the alcohol/water domain, where the partial alcohol concentration is greater than the total alcohol concentration in the initial mixture. Accordingly, a lower ET(30) is logically measured than would be expected from the total average molar concentration (Nav,x), since the average water concentration in the partial alcohol/water fraction must be lower outside the areas of enhanced water structure. The mole fraction x(water), as a measure of solvent composition in solvatochromism analysis, falsifies preferential solvation, since x is inversely proportional to Nav,x. The previously observed curved functions of ET(30) as a function of x(water) determined so far are due to the inhomogeneity (DI) of the solvent mixture.
This result is a significant contribution to the identification of enhanced water structures in alcohol/water mixtures. The enhanced microdomain water structure ranges of alcohol/water mixtures are apparently not recognized by B30 for two reasons: firstly, B30 dissolves poorly in pure water; secondly, the molar absorption coefficient of B30 in water is rather low [1,70].
The first argument is supported by the fact that different solvatochromic dyes such as 4-nitroaniline, 4-nitrophenol, 4-nitroanisole or B30 show qualitatively different dependencies of the UV/Vis absorption energy as a function of alcohol/water composition, especially in the water-rich range x(water) > 0.8 [18,19]. This observation holds regardless of the methanol/water, ethanol/water, 2-propanol/water or 2-methyl-2-propanol/water mixtures is considered. Obviously, hydrophilic dyes are distributed in all these fractions and hydrophobic dyes are preferentially dissolved in the alcohol/water fraction. As B30 itself is a hydrophobic molecule, this scenario is likely.
This explanation is also consistent with the results of the BE/water mixtures. The BE/water domain captures the hydrophobic B30 particularly well, as there is an abrupt decrease in ET(30) with increasing BE content occurs when agglomeration of n-butoxyethanol takes place.
However, it appears that B30 and B30-COONa measure the water-rich fraction in the same sense [19]. Note that the full width at half maximum of the UV/Vis absorption band of B30 measured in alcohol/water mixtures is quite broad. These very broad UV/Vis spectra with large half-widths are often measured in water/salt mixtures [202]. Unfortunately, the UV/Vis spectra are not given in [19]. Therefore, it is not possible to say whether there are superpositions of several UV/Vis bands originating from different solvation states. A definitive statement is therefore not yet possible.
The 2-propanol/water and 2-methyl-2-propanol/water mixtures belong to scenario (D). In the co-solvent rich range the B30 is preferentially influenced by the partial water concentration of the mixture due to the larger ET(30) is measured as expected from the linearity. The situation is quite delicate because the thermodynamics of the mixture changes from exothermic to endothermic depending on the composition. Then, at ΔrHmixing = 0, the plot ET(30) as function of Nav,x shows an inflection point, as is clearly seen for 2-propanol/water, 2-methyl-2-propanol/water and 1,4-dioxane/water mixtures. However, this is only a preliminary result that needs to be confirmed by further studies.
The conclusion from these considerations is that the thermodynamics of the interaction between the solvatochromic probe and the solvent mixture is crucial. Unfortunately, the dissolution thermodynamics of B30 in different solvents has not yet been systematically studied. There are only two papers with calorimetric results on the solvation thermodynamics of B30 [203,204]. The ambiguous results of the two references are not consistent with the theory of exothermic solvation of the probe leading to a lowering of the ground state energy [34,35]. The dissolution process of B30 in acetonitrile, ethyl acetate and higher alcohols is found to be endothermic, which is difficult to explain and may be due to entropic effects rather than re-association of B30 as discussed [204]. Thus, the thermodynamics of the B30/HBD solvent interaction is not trivially explainable in terms of specific hydrogen bond formation. This is consistent with the results of the present study that hydrogen bond formation has no significant effect on the ET(30) value. As consequence, the influence of the thermodynamics of solvation of B30 in terms of the real ground state energy is difficult to assess because the calorimetric studies on several B30/solvent systems are difficult to interpret.
There are various approaches to correlating polarity data with calorimetric results, which are partly successful, but also give very strange results [180,205]. Therefore, this approach has often not been pursued further.
The complicated situation regarding solvation thermodynamics is similar for positive solvatochromic dyes such as 4-nitroaniline [206]. The dissolution process of 4-nitroaniline in co-solvent/water mixtures is endothermic in terms of the heat of mixing in the high-water content range [180,206]. Therefore, a reinterpretation of the solvatochromic results of 4-nitroaniline and related probes in co-solvent/water mixtures from the literature [18,19,181,182] is imperative. The effect of endothermic solvation and its impact on the UV/Vis absorption energy requires more detailed analysis in future work. The idea that solvation of an electronic state leads to an energetic decrease should be abandoned.
There is another aspect to consider. Dissolved B30 probes are statistically influenced by the dynamically moving solvent molecules. For this reason, the UV/visible spectrum only measures a snapshot of different solvation states. A superposition of many solvation states is recorded. Thus, the discrimination of domain formation in solvent mixtures by solvatochromic probes is only possible if the dynamics of the solvent is much lower than that of the optical excitation process of B30. This argument applies precisely to those mixtures where the co-solvent enhances the water structure. This can be explained by considering the relaxation time τ1 measured by dielectric spectroscopy. The larger the τ1 values, the more structural subtleties of the mixture are detected using the solvatochromic probe at ambient temperature, as shown for 2-propanol/water and 2-methyl-2-propanol/water mixtures [86,88,89]. Therefore, the results of dielectric spectroscopy in terms of relaxation time are a useful adjunct to explain the results of UV/Vis measurements.
The two groups of co-solvents, which either enhance or do not enhance the water structure, can probably be distinguished on the basis of the refractive index. When is correlated as function of Nav,x,CH as shown in Figure 2, different curves are obtained. If there is no linear correlation of with Nav,x over the entire composition range, then microdomains of water have formed in the mixture in the form of enhanced water structures. This hypothesis should be tested in further studies. However, this proposed rule does not apply to the correlation of the dielectric constant as a function of Nav,x for DMSO/water mixtures, where a curved line is found instead of a straight line [207,208,209]. For this, εr correlates linearly with x(water), but not linearly with [208]. This particular behavior of DMSO/water mixtures is due to the recently recognized unusual microheterogeneity of these particular mixtures [209]. This important detail supports the thesis that the local mass inhomogeneity in terms of DI has an influence on the result of the physical measurement. Therefore, nothing is riskier than relying on routine evaluations of measurement results as a function of the composition of co-solvent/water mixtures.
Due to the complex structure of aqueous solvent mixtures, a growing body of knowledge is emerging based on conventional and modern measurement methods that take into account the density, refractive index, heat of interaction and other properties (dielectric relaxation) of the individual solvent mixture systems. The combination of UV/Vis spectroscopic data such as ET(30) with physical properties of the solvent mixture (molar concentration of dipoles, dielectric dynamics, thermodynamics, domain size formation) has proved to be necessary but very complex.
New work on the structure of ethanol/water or 2-methyl-2-propanol/water mixtures continues to emerge, providing a refined picture of these unusual solvent systems [111,210,211]. However, the results of recent studies clearly confirm the presence of coexisting microdomains of water and alcohol/water. The considerations of this study also apply to organic solvent mixtures. As early as 1981, Langhals showed that the same relationships that apply to aqueous mixtures can also be used for binary organic solvent mixtures [212]. This motivates us to re-evaluate and classify binary organic solvent mixtures as well, in terms of the average molar concentration. This evaluation requires an extensive literature search for density data. However, the formation of hydrogen bonds on the probe can have a stronger effect in special systems [213], but the use of Nav,x instead of x is necessary for a correct evaluation of UV/Vis spectroscopic data [67,68]
Despite the correlations found between UV/Vis data and physical solvent properties of mixtures, it must be made clear that solvatochromism is of limited use for analyzing the chemical properties of solvent mixtures, unless one simply wants to measure the composition quickly using calibration curves [6]. To understand the complex dependence of the absorption energy of a solvatochromic probe on the solvent composition, the structure of the solvent mixture must be analyzed. However, solvatochromism cannot analyze structures, as Marcus correctly concluded for acetonitrile/water mixtures [214].
5. Conclusions
The Marcus classification of aqueous solvent mixtures has proved to be very useful and explains the qualitatively different correlations of ET(30) with Nav,x for different co-solvent/water mixtures. This should easily solve many puzzles in the literature, as all previous evaluations of solvatochromic data using the molar fraction x(water or co-solvent) as the composition variable are physically incorrect. Various linear and curvilinear relationships of ET(30) as a function of solvent composition in terms of Nav,x have been analyzed. With increasing both the OH dipole and co-solvent dipole concentration, ET(30) increases linearly for those mixtures where the co-solvent does not enhance the water structure. This characteristic holds for FA/water, 1,2-ethandiol/water, NMF/water, urea/water and DMSO/water.
Co-solvents which enhance the water structure of aqueous mixtures (Marcus) show an S-shaped or curved curve of ET(30) as function of Nav,x. Whether a curved or an S-shaped function is obtained depends on the thermodynamics of the mixing process and the solvent dynamics in terms of the relaxation time. Even if preferential solvation of a solute occurs, this may not always be observed with solvatochromic probes if the dynamics in the binary solvent mixture are too high. An average number of solvation states is then recorded. The complexity of the structure of alcohol/water mixtures is reflected in the correlation of the refractive index or ET(30) as a function of various compositional quantities such as x(water), Nav,x, Nav,x,CH or Nav,v.
The Nav,x of the binary mixture is physically justified as a suitable measure of composition for the analysis of UV/Vis results of solvatochromic probes, because of its linear relationship with the UV/Vis absorption energy according to the Lorentz–Lorenz relation. The refined interpretations of ET(30) as a function of solvent composition in this work were only possible on the basis of many new and modern insights into the physical structure of solvent mixtures and the true significance of optical measurements.
In general, the significance of the various measures of the average molar mass of solvent mixtures requires further research into their relationship with physical methods of investigation and their informative value. The use of the inhomogeneity of the solvent mixtures in terms of the Mav,w/Mav,x quantity should be considered for other solvent mixtures in order to support the conclusions of this study in future work.
Finally, it is incomprehensible why hardly anyone has used the average molar concentration Nav,z as a measure of the composition of solvent mixtures. The molar fraction x is needed for thermodynamics, but not for spectroscopy. However, both x and Nav,z are crucial in understanding the physics of mixing. Irrespective of the theoretically justified relationships of the Debye, Clausius–Mosotti or Lorentz–Lorenz equations, the use of the molar concentration is actually necessary for the evaluation of UV/vis spectroscopic data and the refractive index.
Supplementary Materials
The following supporting information can be downloaded at: https://www.mdpi.com/article/10.3390/liquids4010010/s1, References [215,216,217,218,219,220,221,222] belong to this chapter. Figure S1a. (left panel) Correlation of ET(nile red) (kcal/mol) as a function of DHBD (mol/cm3) for protic solvents including water, methanol, ethanol, 1-propanol, 2-propanol, 1-butanol, 2-methyl-2-propanol, 2-ethanolamine, 1,2-ethandiol, 2,2,2-trifluoroethanol and 1,1,1,3,3,3-hexafluoro-2-propanol. The UV/vis-spectroscopic data are taken from ref. [72] and the DHBD parameter from [62]. ET(nile red) = −118.8 DHBD + 54.3, n = 12, r = 0.924. The correlation supports the DHBD parameter proposed for 2,2,2-trifluoroethanol and 1,1,1,3,3,3-hexafluoro-2-propanol from ref. [62]. Figure S1b. (right panel) Plots of Nav,x (sum of total OH dipoles) (in mol/cm3) as a function of x(water) for methanol/water (orange dots), ethanol/water (grey dots) 2-propanol/water (yellow dots), 2-methyl-2-propanol/water (light blue dots); 2-n-butoxyethanol/water (dark blue) mixtures, physical data from references [191,198,199,200,201,202]. Figure S2. Plots of ET(30) (kcal/mol) as function of for 1,2-ethanediol/water (grey), DMSO/water (blue) and 1,4-dioxane/water (orange) mixtures. Figure S3. Correlation of ET30) (in kcal/mol) as a function of N (in mol/cm3) in the temperature range from −75 to + 75 °C, Reichardt [1] (blue dots) and Linert [116] (orange dots). Densities see ref. [218]. Figure S4a (left panel). Comparison of ET(30) (kcal/mol) as function of Nav,x (mol/cm3) for ethanol/water mixtures. Data from Dimroth–Reichardt [2] (red dots) and data from Rosés [18] (blue dots), (25 °C). Figure S4b (right panel). Comparison of ET(30) (kcal/mol) as a function of x(DMSO) for DMSO/water mixtures data from [12,14,121,122] (orange dots) (25 °C) and data from Connors [15] (blue dots). Figure S5. Comparison of ET(30) (kcal/mol) as function of x(1,2-ethanediol) (mol %) for 1,2-ethanediol/water mixture, data from Kosower/Marcus [12] (orange dots) (25 °C); data from Connors [15] (blue dots). Figure S6a. ET(30) (kcal/mol) as a function of Nav,x (mol/cm3) for urea/water (blue) and N,N’-dimethylpropyleneurea/water (orange) mixtures; data from [143,144]. ET(30) (urea/water) = 80.3 + 58.7; n = 8, r = 0.996; ET(30) N,N’-dimethylpropyleneurea/water) = 432 + 39.7; n = 7, r = 0.994. Figure S6b (right panel). Overall correlation of ET(30) (kcal/mol) as a function of N for the homologous series of primary alcohols (orange dots) as well as ET(30) as function of Nav,v (mol/cm3) for ethanol/water mixtures (blue dots) and methanol/water mixtures (grey dots). All ET(30) data are taken from [2,18,34]. Figure S7a. Correlation of the static dielectric constant of DMSO /water mixtures [151] as a function of Nav,x (mol/cm3). Figure S7b. Correlation of the static dielectric constant εr as function of Nav,x (mol/cm3) for several co-solvent/water mixtures, including the pure co-solvents, 1,4-dioxane/water mixtures [162]: εr = 1827 Nav,x − 25; n = 11; r = 0.996 (grey dots). The 1,2-ethanediol/water mixtures, εr = 975 Nav,x + 25; n = 11; r = 0.994 (blue dots) and the glycerol/water mixtures, εr = 908 Nav,x − 29; n = 11; r = 0.999 (orange dots) are used as independent reference. Figure S8a (left panel) Correlation of ET(30) (kcal/mol) as a function of the static dielectric constant εr for DMSO/water (orange) [151] and 1,4-dioxane/water mixtures [162] (blue). Figure S8b. (right panel) Correlation of ET(30) (kcal/mol) as a function of Nav,x (blue) and Nav,x(water) (orange) for 1,4.dioxane/water mixtures. Figure S9. Plots of Kamlet–Taft (KAT) α HBD parameter (orange and grey dots), β (HBA) parameter) (yellow dots) and π* dipolarity/polarizability parameter (blue dots) as a function of Nav,x (mol/cm3) for DMSO/water mixtures [157]. Note the maximum KAT value for π* corresponds exactly to the kink in the curve for KAT α as a function of Nav,x and the inflection point of β versus Nav,x at the same composition. Figure S10. Correlations of ET(30) as a function of x(water) for methanol/water (grey), ethanol/water (orange), 2-propanol/water (blue), and 2-methyl-2-propanol/water (yellow) mixtures. Data from [2,18,19]. Figure S11. Plot of νmax(Fe) [103 cm−1] as a function of Nav,x (mol/cm3) for the 2-propanol/water mixtures [126]. Linear fit: νmax(Fe) [103 cm−1] = 41.95 Nav,x + 17.05; r = 0.99, n = 11. Table S1. ET(30) values for ethanol measured at various temperatures; data from Reichardt and Linert [1,116] and densities at various temperatures of the ethanol/water mixture [218]. Table S2. Physical properties of the 1,2-ethanediol/water mixture in terms of mole fractions as well as refractive index and ET(30) values [12,77,130]. Dav,x,HBD values are the total concentration of OH dipoles when the partial OH concentration of the 1,2-ethanediol component is taken into account according to Equation (9). Table S3. Physical data of methanol/water mixtures with respect to mole, volume and mass fraction, and ET(30) values [17]. Physical data from [215,216,217]. Table S4. ET(30) and ET(1) values, density, average molar masses and average molar concentrations in ethanol/water mixtures. Data from Reichardt [1,2]. Physical solvent mixture are data from [215,216,217]. Table S5. Physical properties and ET(30) values of the formamide/water mixtures [21,120,137,138]. Table S6. The N-methylformamide (NMF) /water mixtures. X(water), Mavx, Nav,x. Data from [139,219]. ET(30)data from [21]. Table S7. The N,N-dimethylformamide (DMF)/water mixtures, physical data and ET(30) values [21,141,142,220]. Table S8. The N-formylmorpholine/water mixtures, Nav.x, refractive index and ET(30) values [32,221,222]. Table S9. Physical properties and ET(30) values of DMSO/water mixtures from different literature sources [12,15], Density from [146,148]. Table S10. Physical properties of the 1,4-dioxane/water mixtures in terms of mole and volume fractions as well as refractive index and ET(30) values, data from [2,159,160,161,162,165]. Table S11. Physical properties of 2-propanol/water mixtures [215,216,217] and ET(30) values [2,18,19]. Table S12a. ET(30), density, various average molar masses and corresponding molar concentrations of 2-methyl-2-propanol/water mixtures, data from [173,174]. ET(30) values, data from [19]. Table S12b. Refractive index, density, average molar masses and average molar concentrations of 2-methyl-2-propanol/water mixtures, data from [173,174]. ET(30) values, data from [19]. Table S13. Physical data and ET(30) values, data from [8], for the 2-Butoxyethanol (BE)/water mixtures at 25 °C, physical data from [191].
Funding
Chemnitz University of Technology provided organizational support for the work.
Acknowledgments
The author would like to thank R. Buchner, University of Regensburg, and T. G. Mayerhöfer, Friedrich Schiller University and Leibniz Institute for Photonic Technologies Jena, for helpful discussions and suggestions on dielectric spectroscopy and refractive index.
Conflicts of Interest
The author declares no conflict of interest.
References
- Dimroth, K.; Reichardt, C.; Siepmann, T.; Bohlmann, F. On pyridinium-N-phenol-betaines and their use in characterising the polarity of solvents (original in german). Liebigs Ann. Chem. 1963, 661, 1–37. [Google Scholar] [CrossRef]
- Dimroth, K.; Reichardt, C. Die colorimetrische Analyse binärer organischer Lösungsmittelgemische mit Hilfe der Solvatochromie von Pyridinium-N-phenolbetainen, the colourimetric analysis of binary organic solvent mixtures using the solvatochromism of pyridinium-N-phenolbetaines. Fresenius Z. Anal. Chem. 1966, 215, 344–350. [Google Scholar] [CrossRef]
- Maksimovic, Z.B.; Reichardt, C.; Spiric, A. Determination of empirical parameters of solvent polarity ET in binary mixtures by solvatochromic pyridinium-N-phenol betaine dyes. Z. Anal. Chem. 1974, 270, 100–104. [Google Scholar] [CrossRef]
- Krygowski, T.M.; Wrona, P.K.; Zielkowska, U.; Reichardt, C. Empirical parameters of Lewis acidity and basicity for aqueous binary solvent mixtures. Tetrahedron 1985, 41, 4519–4527. [Google Scholar] [CrossRef]
- Langhals, H. Die quantitative Beschreibung der Lösungsmittelpolarität binärer Gemische unter Berücksichtigung verschiedener Polaritätsskalen. Chem. Ber. 1981, 114, 2907–2913. [Google Scholar] [CrossRef][Green Version]
- Langhals, H. Polarity of binary liquid mixtures. Angew. Chem. Int. Ed. Engl. 1982, 21, 724–733. [Google Scholar] [CrossRef]
- Langhals, H. The description of the polarity of alcohols as a function of their molar content of OH groups. Nouv. J. Chim. 1982, 6, 265–267. Available online: https://epub.ub.uni-muenchen.de/93533/ (accessed on 2 November 2022).
- Haak, J.R.; Engberts, J.B.F.N. Solvent polarity and solvation effects in highly aqueous mixed solvents. Application of the Dimroth-Reichardt ET(30) parameter. Recl. Trav. Chim. Pays-Bas 1986, 105, 307–311. [Google Scholar] [CrossRef]
- Michels, J.J.; Dorsey, J.G. Retention in reversed-phase liquid chromatography: Solvatochromic investigation of homologous alcohol-water binary mobile phases. J. Chromatogr. 1988, 21, 85–98. [Google Scholar] [CrossRef]
- Chatterjee, P.; Bagchi, S. Preferential solvation of a dipolar solute in mixed binary solvent. A study by UV–visible spectroscopy. J. Phys. Chem. 1991, 95, 3311–3314. [Google Scholar] [CrossRef]
- Bosch, E.E.; Rosés, M. Relationships between ET Polarity and Composition in Binary Solvent Mixtures. J. Chem. Soc. Faraday Trans. 1992, 88, 3541–3546. [Google Scholar] [CrossRef]
- Marcus, Y. The use of chemical probes for the characterization of solvent mixtures. Part 2. Aqueous mixtures. J. Chem. Soc. Perkin Trans. 1994, 2, 1751–1758. [Google Scholar] [CrossRef]
- Kipkemboi, P.K.; Easteal, A.J. Solvent Polarity Studies of the Water+t-Butyl Alcohol and Water+t-Butylamine Binary Systems with the Solvatochromic Dyes Nile Red and Pyridinium-N-phenoxide Betaine, Refractometry and Permittivity Measurements. Austr. J. Chem. 1994, 47, 1771–1781. [Google Scholar] [CrossRef]
- Banerjee, D.; Laha, A.K.; Bagchi, S. Preferential solvation in mixed binary solvent. J. Chem. Soc. Faraday Trans. 1995, 91, 631–636. [Google Scholar] [CrossRef]
- Skwierczynski, R.D.; Connors, K.A. Solvent effects on chemical processes. Part 7. Quantitative description of the composition dependence of the solvent polarity measure ET(30) in binary aqueous–organic solvent mixtures. J. Chem. Soc. Perkin Trans. 1994, 2, 467–472. [Google Scholar] [CrossRef]
- Marcus, Y. Use of chemical probes for the characterization of solvent mixtures. Part 1. Completely non-aqueous mixtures. J. Chem. Soc. Perkin Trans. 2 1994, 5, 1015–1021. [Google Scholar] [CrossRef]
- Rosés, M.; Ràfols, C.; José Ortega, J.; Bosch, E. Solute–solvent and solvent–solvent interactions in binary solvent mixtures. Part 1. A comparison of several preferential solvation models for describing ET(30) polarity of bipolar hydrogen bond acceptor-cosolvent mixtures. J. Chem. Soc. Perkin Trans. 1995, 2, 1607–1615. [Google Scholar] [CrossRef]
- Bosch, E.E.; Rosés, M.; Herodes, K.; Koppel, I.; Leito, I. Solute-solvent and solvent-solvent interactions in binary solvent mixtures. Part 3. The ET(30) polarity of binary mixtures of hydroxylic solvents. J. Chem. Soc. Perkin Trans. 1996, 2, 1497–1503. [Google Scholar] [CrossRef]
- Rosés, M.; Buhvestov, U.; Ràfols, C.; Rived, F.; Bosch, E. Solute–solvent and solvent–solvent interactions in binary solvent mixtures. Part 6. A quantitative measurement of the enhancement of the water structure in 2-methylpropan-2-ol–water and propan-2-ol–water mixtures by solvatochromic indicators. J. Chem. Soc. Perkin Trans. 1997, 2, 1341–1348. [Google Scholar] [CrossRef]
- Buhvestov, U.; Rived, F.; Ràfols, C.; Bosch, E.; Rosés, M. Solute–solvent and solvent–solvent interactions in binary solvent mixtures. Part 7. Comparison of the enhancement of the water structure in alcohol–water mixtures measured by solvatochromic indicators. J. Phys. Org. Chem. 1998, 11, 185–196. [Google Scholar] [CrossRef]
- Herodes, K.; Leito, I.; Koppel, I.; Rosés, M. ET(30) Polarity of Binary Mixtures of Formamides with Hydroxylic Solvent. J. Phys. Org. Chem. 1999, 12, 109–115. [Google Scholar] [CrossRef]
- Tada, E.B.; Novaki, L.P.; El Seoud, O.A. Solvatochromism in pure and binary solvent mixtures: Effects of the molecular structure of the zwitterionic probe. J. Phys. Org. Chem. 2000, 13, 679–687. [Google Scholar] [CrossRef]
- El Seoud, O.A. Solvation in pure and mixed solvents: Some recent developments. Pure Appl. Chem. 2007, 79, 1135–1151. [Google Scholar] [CrossRef]
- Ghoneim, N. Study of the preferential solvation of some betaine dyes in binary solvent mixtures. Spectrochim. Acta A Mol. Biomol. Spectrosc. 2001, 57, 1877–1884. [Google Scholar] [CrossRef] [PubMed]
- Wu, Y.G.; Tabata, M.; Takamuku, T. Preferential Solvation in Aqueous–Organic Mixed Solvents Using Solvatochromic Indicators. J. Sol. Chem. 2002, 31, 381–395. [Google Scholar] [CrossRef]
- Bevilaqua, T.; da Silva, D.C.; Machado, V.G. Preferential solvation of Brooker’s merocyanine in binary solvent mixtures composed of formamides and hydroxylic solvents. Spectrochim. Acta Part A 2004, 60, 951–958. [Google Scholar] [CrossRef] [PubMed]
- Bentley, T.W.; Koo, I.S. Role of hydroxyl concentrations in solvatochromic measures of solvent polarity of alcohols and alcohol–water mixtures—Evidence that preferential solvation effects may be overestimated. Org. Biomol. Chem. 2004, 21, 2376–2380. [Google Scholar] [CrossRef]
- El Seoud, O.A. Understanding solvation. Pure Appl. Chem. 2009, 8, 697–707. [Google Scholar] [CrossRef]
- Morisue, M.; Ueno, I. Preferential Solvation Unveiled by Anomalous Conformational Equilibration of Porphyrin Dimers: Nucleation Growth of Solvent–Solvent Segregation. J. Phys. Chem. B 2018, 122, 5251–5259. [Google Scholar] [CrossRef]
- Duereh, A.; Anantpinijwatna, A.; Latcharote, P. Prediction of Solvatochromic Polarity Parameters for Aqueous Mixed-Solvent Systems. Appl. Sci. 2020, 10, 8480. [Google Scholar] [CrossRef]
- Pasham, F.; Jabbari, M.; Farajtabar, A. Solvatochromic Measurement of KAT Parameters and Modeling Preferential Solvation in Green Potential Binary Mixtures of N-Formylmorpholine with Water, Alcohols, and Ethyl Acetate. J. Chem. Eng. Data 2020, 65, 5458–5466. [Google Scholar] [CrossRef]
- Sandri, J.C.; de Melo, C.E.A.; Giusti, L.A.; Rezende, M.C.; Machado, V.G. Preferential solvation index as a tool in the analysis of the behavior of solvatochromic probes in binary solvent mixtures. J. Mol. Liq. 2021, 328, 1155450. [Google Scholar] [CrossRef]
- Pavel, C.M.; Ambrosi, E.; Dimitriu, D.G.; Dorohoi, D.O. Complex formation and microheterogeneity in water–alcohol binary mixtures investigated by solvatochromic study. Eur. Phys. J. Spec. Top. 2023, 232, 415–425. [Google Scholar] [CrossRef]
- Reichardt, C.; Welton, T. Solvents and Solvent Effects in Organic Chemistry, 4th ed.; Wiley-VCH: Weinheim, Germany, 2011; ISBN 978-3-527-32473-6. [Google Scholar]
- Reichardt, C. Solvatochromic Dyes as Solvent Polarity Indicators. Chem. Rev. 1994, 94, 2319–2358. [Google Scholar] [CrossRef]
- Kamlet, M.-J.; Abboud, J.L.M.; Abraham, M.H.; Taft, R.W. Linear Solvation Energy Relationships. 23. A Comprehensive Collection of the Solvatochromic Parameters, π*, α, and ß, and Some Methods for Simplifying the Generalized Solvatochromic Equation. J. Org. Chem. 1983, 48, 2877–2887. [Google Scholar] [CrossRef]
- Catalán, J.; Diaz, C. A generalized solvent acidity scale: The solvatochromism of o-tert-Butylstilbazolium Betaine dye and ist homomorph o,o’-di-tert-butylstilbazolium betaine dye. Liebigs Ann. 1997, 1997, 1941–1949. [Google Scholar] [CrossRef]
- Catalán, J.; Díaz, C. Extending the Solvent Acidiy Scale to Highly Acidic Organic Solvents: The Unique Photophysical Behaviour of 3,6-Diethyltetrazine. Eur. J. Org. Chem. 1999, 4, 885–891. [Google Scholar] [CrossRef]
- Catalán, J. Toward a Generalized Treatment of the Solvent Effect Based on Four Empirical Scales: Dipolarity (SdP, a New Scale), Polarizability (SP), Acidity (SA), and Basicity (SB) of the Medium. J. Phys. Chem. B 2009, 113, 5951–5960. [Google Scholar] [CrossRef] [PubMed]
- Cerón-Carrasco, J.P.; Jacquemin, D.; Laurence, C.; Planchat, A.; Reichardt, C.; Sraïdi, K. Determination of a Solvent Hydrogen-Bond Acidity Scale by Means of the Solvatochromism of Pyridinium-N-phenolate Betaine Dye 30 and PCM-TD-DFT Calculations. J. Phys. Chem. B 2014, 118, 4605–4614. [Google Scholar] [CrossRef]
- Laurence, C.; Mansour, S.; Vuluga, D.; Sraidi, K.; Legros, J. Theoretical, Semiempirical, and Experimental Solvatochromic Comparison Methods for the Construction of the α1 Scale of Hydrogen-Bond Donation of Solvents. J. Org. Chem. 2022, 87, 6273–6287. [Google Scholar] [CrossRef]
- Laurence, C.; Mansour, S.; Vuluga, D.; Planchat, D.; Legros, J. Hydrogen-Bond Acceptance of Solvents: A 19F Solvatomagnetic β1 Database to Replace Solvatochromic and Solvatovibrational Scales. J. Org. Chem. 2021, 86, 4143–4158. [Google Scholar] [CrossRef]
- Spange, S.; Weiß, N. Empirical Hydrogen Bonding Donor (HBD) Parameters of Organic Solvents Using Solvatochromic Probes–A Critical Evaluation. ChemPhysChem 2023, 24, e202200780. [Google Scholar] [CrossRef]
- Pike, S.J.; Lavagnini, E.; Varley, L.M.; Cook, J.L.; Hunter, C.A. H-Bond donor parameters for cations. Chem. Sci. 2019, 10, 5943–5951. [Google Scholar] [CrossRef] [PubMed]
- Spange, S.; Lienert, C.; Friebe, N.; Schreiter, K. Complementary interpretation of ET(30) polarity parameters of ionic liquids. Phys. Chem. Chem. Phys. 2020, 160, 9954–9966. [Google Scholar] [CrossRef]
- Mero, A.; Guglielmero, L.; Guazzelli, L.; D’Andrea, F.; Mezzetta, A.; Pomelli, C.S. A specific interaction between ionic liquids’ cations and Reichardt’s Dye. Molecules 2022, 27, 7205. [Google Scholar] [CrossRef]
- Böttcher, C.J.F. Theory of Electric Polarization, 2nd ed.; Elsevier: Amsterdam, The Netherlands, 1973; ISBN 978-0-444-41019-1. [Google Scholar] [CrossRef]
- Marcus, Y. Preferential solvation of ions in mixed solvents. Part 2—The solvent composition near the ion. J. Chem. Soc. Faraday Trans. I 1988, 84, 1465–1473. [Google Scholar] [CrossRef]
- Marcus, Y. Preferential solvation in mixed solvents. Part 5—Binary mixtures of water and organic solvents. J. Chem. Soc. Faraday Trans. 1990, 86, 2215–2224. [Google Scholar] [CrossRef]
- Marcus, Y. Solvent Mixtures: Properties and Selective Solvation; CRC Press: Boca Raton, FL, USA, 2014; pp. 9–15. ISBN 9780429175664. [Google Scholar]
- Marcus, Y. Preferential Solvation in Mixed Solvents X. Completely Miscible Aqueous Co-Solvent Binary Mixtures at 298.15 K. Chem. Mon. 2001, 132, 1387–1411. [Google Scholar] [CrossRef]
- Spange, S.; Lauterbach, M.; Gyra, A.K.; Reichardt, C. Über Pyridinium-N-phenolat-Betaine und ihre Verwendung zur Charakterisierung der Polarität von Lösungsmitteln, XVI. Bestimmung der empirischen Lösungsmittelpolaritäts-Parameter ET(30) und AN für 55 substituierte Phenole. Liebigs Ann. Chem. 1991, 323–329. [Google Scholar] [CrossRef]
- Coleman, C.A.; Murray, C.J. Hydrogen bonding between N-pyridinium phenolate and O-H donors in acetonitrile. J.Org. Chem. 1992, 57, 3578–3582. [Google Scholar] [CrossRef]
- Laurence, C.; Berthelot, M.; Graton, J. Hydrogen-Bonded Complexes of Phenols. In The Chemistry of Phenols; Rappoport, Z., Ed.; Wiley: New York, NY, USA, 2004; ISBN 978-0-470-86945-1. [Google Scholar]
- Cook, J.L.; Hunter, C.A.; Low, C.M.R.; Perez-Velasco, A.; Vinter, J.G. Solvent Effects on Hydrogen Bonding. Angew. Chem. Int. Ed. 2007, 46, 3706–3709. [Google Scholar] [CrossRef] [PubMed]
- Cook, J.L.; Hunter, C.A.; Low, C.M.R.; Perez-Velasco, A.; Vinter, J.G. Preferential Solvation and Hydrogen Bonding in Mixed Solvents. Angew. Chem. Int. Ed. 2008, 47, 6275–6277. [Google Scholar] [CrossRef]
- Reichardt, C.; Eschner, M. On pyridinium N-phenolate betaines and their use in characterising the polarity of solvents, XVIII. Synthesis and UV/Vis spectroscopic properties of a negatively solvatochromic pyridinium N-thiophenolate betaine dye (in german). Liebigs Ann. Chem. 1991, 1991, 1003–1012. [Google Scholar] [CrossRef]
- Bolz, I.; Schaarschmidt, D.; Rüffer, T.; Lang, H.; Spange, S. A pyridinium barbiturate betaine dye with pronounced negative solvatochromism: A new approach to molecular recognition. Angew. Chem. Int. Ed. 2009, 48, 7440–7443. [Google Scholar] [CrossRef] [PubMed]
- Plenert, C.; Mendez-Vega, E.; Sander, W. Micro- vs. Macrosolvation in Reichardt’s Dyes. J. Am. Chem. Soc. 2021, 143, 13156–13166. [Google Scholar] [CrossRef]
- Henkel, S.; Misuraca, M.C.; Troselj, P.; Davidson, J.; Hunter, C.A. Polarisation effects on the solvation properties of alcohols. Chem. Sci. 2018, 9, 88–89. [Google Scholar] [CrossRef]
- Spange, S.; Weiß, N.; Schmidt, C.; Schreiter, K. Reappraisal of Empirical Solvent Polarity Scales for Organic Solvents. Chem. Methods 2021, 1, 42–60. [Google Scholar] [CrossRef]
- Spange, S.; Weiß, N.; Mayerhöfer, T.G. The Global Polarity of Alcoholic Solvents and Water–Importance of the Collectively Acting Factors Density, Refractive Index and Hydrogen Bonding Forces. Chem. Open 2022, 11, e202200140. [Google Scholar] [CrossRef]
- Lerf, C.; Suppan, P. Hydrogen Bonding and Dielectric Effects in Solvatochromic Shifts. J. Chem. Soc. Faraday Trans. 1992, 88, 963–969. [Google Scholar] [CrossRef]
- Rezende, M.C.; Machado, V.G.; Morales, S.; Pastenes, C.; Vidal, M. Use of Nonideality Parameters for the Analysis of the Thermodynamic Properties of Binary Mixtures. ACS Omega 2021, 6, 16553–16564. [Google Scholar] [CrossRef]
- Morales, S.; Pastenes, C.; Machado, V.G.; Rezende, M.C. Applications of a preferential–solvation index (PSI) for the comparison of binary mixtures with ionic liquids. J. Mol. Liq. 2021, 343, 117644. [Google Scholar] [CrossRef]
- Lüdecke, C.; Lüdecke, D. Thermodynamic properties of homogeneous mixtures. In Thermodynamik: Physikalisch-Chemische Grundlagen der Thermischen Verfahrenstechnik, Thermodynamics: Physical-Chemical Fundamentals of Thermal Process Engineering; Springer: Berlin/Heidelberg, Germany, 2000; 424p. [Google Scholar] [CrossRef]
- Mayerhöfer, T.G.; Dabrowska, A.; Schwaighofer, A.; Lendl, B.; Popp, J. Beyond Beer’s Law: Why the Index of Refraction Depends (Almost) Linearly on Concentration. ChemPhysChem. 2020, 21, 707–711. [Google Scholar] [CrossRef] [PubMed]
- Mayerhöfer, T.G.; Popp, J. Beyond Beer’s Law: Revisiting the Lorentz-Lorenz Equation. ChemPhysChem 2020, 21, 1218–1223. [Google Scholar] [CrossRef] [PubMed]
- Mayerhöfer, T.G.; Spange, S. Understanding refractive index changes in homologous series of hydrocarbons based on Beer’s law. ChemPhysChem 2023, 24, e202300430. [Google Scholar] [CrossRef] [PubMed]
- Spange, S.; Mayerhöfer, T.G. The Negative Solvatochromism of Reichardt’s Dye B30–A Complementary Study. Chem. Phys. Chem. 2022, 23, e202200100. [Google Scholar] [CrossRef] [PubMed]
- Spange, S.; Kaßner, L.; Mayerhöfer, T.G. New insights into the negative solvatochromism of various merocyanines. PhysChemPhys 2023. submitted. [Google Scholar]
- Deye, J.F.; Berger, T.A.; Anderson, A.G. Nile Red as a Solvatochromic Dye for Measuring Solvent Strength in Normal Liquids and Mixtures of Normal Liquids with Supercritical and Near Critical Fluids. Anal. Chem. 1990, 62, 615–622. [Google Scholar] [CrossRef]
- Kasap, S.; Capper, P. Springer Handbook of Electronic and Photonic Materials; Springer: Berlin/Heidelberg, Germany, 2006; p. 49. ISBN 978-0-387-26059-4. [Google Scholar]
- Suppan, P. Polarizability of excited molecules from spectroscopic studies. Spectrochim. Acta 1967, 24A, 1161–1165. [Google Scholar] [CrossRef]
- Suppan, P. Solvent effects on the energy of electronic transitions: Experimental observations and applications to structural problems of excited molecules. J. Chem. Soc. A 1968, 3125–3133. [Google Scholar] [CrossRef]
- Dei, L.; Grassi, S. Peculiar Properties of Water as Solute. J. Phys. Chem. B 2006, 110, 12191–12197. [Google Scholar] [CrossRef]
- Lee, H.; Hong, W.-H.; Kim, H. Excess Volumes of Binary and Ternary Mixtures of Water, Methanol and Ethylene Glycol. J. Chem. Eng. Data 1990, 35, 371–374. [Google Scholar] [CrossRef]
- Franks, F.; Ives, D.J.G. The structural properties of alcohol–water mixtures. Q. Rev. Chem. Soc. 1966, 20, 1–44. [Google Scholar] [CrossRef]
- Armitage, D.A.; Blandamer, M.J.; Morcom, K.W.; Treloar, N.C. Partial Molar Volumes and Maximum Density Effects in Alcohol–Water Mixtures. Nature 1968, 219, 718–720. [Google Scholar] [CrossRef]
- Lama, F.R.; Lu, C.Y. Excess Thermodynamic Properties of Aqueous Alcohol Solutions. J. Chem. Eng. Data 1965, 10, 216–219. [Google Scholar] [CrossRef]
- Douheret, G.; Khadir, A.; Pal, A. Thermodynamic Characterization of the Water + Methanol System, at 298.15 K. Thermochim. Acta 1989, 142, 219–243. [Google Scholar] [CrossRef]
- Peeters, D.; Huyskens, P. Endothermicity or exothermicity of water/alcohol mixtures. J. Mol. Struct. 1993, 300, 539–550. [Google Scholar] [CrossRef]
- Xiao, C.; Bianchi, H.; Tremaine, P.R. Excess molar volumes and densities of (methanol+water) at temperatures between 323 K and 573 K and pressures of 7.0 MPa and 13.5 MPa. J. Chem. Thermodyn. 1997, 29, 261–286. [Google Scholar] [CrossRef]
- Petong, P.; Pottel, R.; Kaatze, U. Water-Ethanol Mixtures at Different Compositions and Temperatures. A Dieletric Relaxation Stud. J. Phys. Chem. A 2000, 104, 7420–7428. [Google Scholar] [CrossRef]
- Sato, T.; Chiba, A.; Nozaki, R. Hydrophobic hydration and molecular association in methanol–water mixtures studied by microwave dielectric analysis. J. Chem. Phys. 2000, 112, 2924–2932. [Google Scholar] [CrossRef]
- Sato, T.; Buchner, R. Dielectric Relaxation Processes in Ethanol/Water Mixtures. J. Phys. Chem. A 2004, 108, 5007–5015. [Google Scholar] [CrossRef]
- Moldoveanu, S.; David, V. Chapter 6—Solvent Extraction. In Modern Sample Preparation for Chromatography; Elsevier: Amsterdam, The Netherlands, 2015; pp. 131–139. [Google Scholar] [CrossRef]
- Kaatze, U. The Dielectric Properties of Water in Its Different States of Interaction. J. Solution Chem. 1997, 26, 1049–1112. [Google Scholar] [CrossRef]
- Behrends, R.; Fuchs, K.; Kaatze, U. Dielectric properties of glycerol/water mixtures at temperatures between 10 and 50 °C. J. Chem. Phys. 2006, 124, 144512. [Google Scholar] [CrossRef] [PubMed]
- Dixit, S.; Crain, J.; Poon, W.C.K.; Finney, J.L.; Soper, A.K. Molecular segregation observed in a concentrated alcohol–water solution. Nature 2002, 416, 829–832. [Google Scholar] [CrossRef] [PubMed]
- Pascal, T.A.; Goddard, W.A. Hydrophobic Segregation, Phase Transitions and the Anomalous Thermodynamics of Water/Methanol Mixtures. J. Phys. Chem. B 2012, 116, 13905–13912. [Google Scholar] [CrossRef] [PubMed]
- Tan, M.-L.; Miller, B.T.; Te, J.; Cendagorta, J.R.; Brooks, B.R.; Ichiye, T. Hydrophobic hydration and the anomalous partial molar volumes in ethanol-water mixtures. J. Chem. Phys. 2015, 142, 064501. [Google Scholar] [CrossRef] [PubMed]
- Moučka, C.F.; Nezbeda, I. Partial molar volume of methanol in water: Effect of polarizability. Coll. Czech. Chem. Commun. 2009, 74, 559–563. [Google Scholar] [CrossRef]
- Besford, Q.A.; Van den Heuvel, W.; Christofferson, A.J. Dipolar Dispersion Forces in Water–Methanol Mixtures: Enhancement of Water Interactions upon Dilution Drives Self-Association. J. Phys. Chem. B 2022, 126, 6231–6239. [Google Scholar] [CrossRef]
- Guevara-Carrion, G.; Fingerhut, R.; Vrabec, J. Density and partial molar volumes of the liquid mixture water + methanol + ethanol + 2-propanol at 298.15 K and 0.1 MPa. J. Chem. Eng. Data 2021, 66, 2425–2435. [Google Scholar] [CrossRef]
- Han, C.; Gao, J.; Sun, W.; Han, C.; Li, F.; Li, B. Structure study of water in alcohol-water binary system based on Raman spectroscopy. J. Phys. Conf. Ser. 2022, 2282, 012021. [Google Scholar] [CrossRef]
- Nunes, N.; Ventura, C.; Martins, F.; Elvas-Leitão, R. Modeling Preferential Solvation in Ternary Solvent Systems. J. Phys. Chem. B 2009, 113, 3071–3079. [Google Scholar] [CrossRef]
- Nunes, N.; Elvas-Leitão, R.; Martins, F. Using solvatochromic probes to investigate intermolecular interactions in 1,4-dioxane/methanol/acetonitrile solvent mixtures. J. Mol. Liq. 2018, 266, 259–268. [Google Scholar] [CrossRef]
- Atkins, P.W.; de Paula, J. Physical Chemistry, 4th ed.; Wiley-VCH: Weinheim, Germany, 2006; p. 724. ISBN 3-527-31546-2. [Google Scholar]
- Lechner, M.D.; Gehrke, K.; Nordmeier, E.H. Macromolecular Chemistry: A Textbook for Chemists, Physicists, Materials Scientists and Chemical Engineers, 5th ed.; Springer: Berlin/Heidelberg, Germany, 2014; 15p, ISBN 978-3-642-41768-9. [Google Scholar] [CrossRef]
- Stepto, T.F.T. Dispersity in Polymer Science. Pure Appl. Chem. 2009, 8, 351–353. [Google Scholar] [CrossRef]
- Heller, W. Remarks on Refractive Index Mixture Rules. J. Phys. Chem. 1965, 69, 1123–1129. [Google Scholar] [CrossRef]
- Tasic, A.Z.; Djordjevic, B.D.; Grozdanic, D.K.; Radojkovic, N. Use of mixing rules in predicting refractive indexes and specific refractivities for some binary liquid mixtures. J. Chem. Eng. Data 1992, 37, 310–313. [Google Scholar] [CrossRef]
- Pretorius, F.; Focke, W.W.; Androsch, R.; du Toi, E. Estimating binary liquid composition from density and refractive index measurements: A comprehensive review of mixing rules. J. Mol. Liq. 2021, 332, 115893. [Google Scholar] [CrossRef]
- IUPAC. Compendium of Chemical Terminology, 2nd ed.; McNaught, A.D., Wilkinson, A., Eds.; Blackwell Scientific Publications: Oxford, UK, 1997. [Google Scholar] [CrossRef]
- Markgraf, H.G.; Nikuradse, A. Über den Volumeneffekt in binären Gemischen einiger organischer Flüssigkeiten. On the volume effect in binary mixtures of some organic liquids. Z. Naturforsch. A 1954, 9, 27–34. [Google Scholar] [CrossRef]
- Redlich, O.; Kister, A.T. Algebraic Representation of Thermodynamic Properties and the Classification of Solutions. Ind. Eng. Chem. 1948, 40, 341–348. [Google Scholar] [CrossRef]
- Speight, J.G. Atomic and Group Refractions. In Lange’s Handbook of Chemistry, 16th ed.; McGraw-Hill Education LLC: New York, NY, USA; ISBN 10:0070163847. Available online: https://www.labxing.com/files/lab_data/1340-1625805401-Qqoazhfj.pdf (accessed on 2 November 2022).
- Marcus, Y. Water structure enhancement in water-rich binary solvent mixtures. J. Mol. Liq. 2011, 158, 23–26. [Google Scholar] [CrossRef]
- Marcus, Y. Water structure enhancement in water-rich binary solvent mixtures. Part II. The excess partial molar heat capacity of the water. J. Mol. Liq. 2012, 166, 62–66. [Google Scholar] [CrossRef]
- Hsu, W.-H.; Yen, T.-C.; Chen, C.-C.; Yang, C.-W.; Fang, C.-K.; Hwang, I.-S. Observation of mesoscopic clathrate structures in ethanol-water mixtures. J. Mol. Liq. 2022, 366, 120299. [Google Scholar] [CrossRef]
- Langhals, H. The relationship between the refractive index and the composition of binary liquid mixtures. Ζ. Phys. Chem. 1985, 266, 775–780. [Google Scholar] [CrossRef]
- Herraez, J.V.; Beld, R. Refractive Indices, Densities and Excess Molar Volumes of Monoalcohols + Water. J. Solution Chem. 2006, 35, 1315–1328. [Google Scholar] [CrossRef]
- El-Dossoki, F.I. Refractive index and density measurements for selected binary protic-protic, aprotic-aprotic, and aprotic-protic systems at temperatures from 298.15 K to 308.15 K. J. Chin. Chem. Soc. 2007, 54, 1129–1137. [Google Scholar] [CrossRef]
- Riobóo, R.J.; Philipp, M.; Ramos, M.A.; Krüger, J.K. Concentration and temperature dependence of the refractive index of ethanol-water mixtures: Influence of intermolecular interactions. Eur. Phys. J. E 2009, 30, 19–26. [Google Scholar] [CrossRef] [PubMed]
- Linert, W.; Jameson, R. Acceptor properties of solvents: The use of isokinetic relationships to elucidate the relationship between the acceptor number and the solvatochromism of N-phenolate betaine dyes. J. Chem. Soc. Perkin Trans. 1993, 2, 1415–1421. [Google Scholar] [CrossRef]
- Zhao, X.; Knorr Jeanne, F.J.; Mc Hal, L. Temperature-dependent absorption spectrum of betaine-30 in methanol. Chem. Phys. Lett. 2002, 356, 214–220. [Google Scholar] [CrossRef]
- Tada, E.B.; Silva, P.L.; El Seoud, O.A. Thermosolvatochromism of betaine dyes in aqueous alcohols: Explicit consideration of the water–alcohol complex. J. Phys. Org. Chem. 2003, 16, 691–699. [Google Scholar] [CrossRef]
- Bosch, E.; Rosés, M.; Herodes, K.; Koppel, I.; Leito, I.; Koppel, I.; Taal, V. Solute-solvent and solvent-solvent interactions in binary solvent mixtures. 2. Effect of temperature on the ET(30) polarity parameter of dipolar hydrogen bond acceptor-hydrogen bond donor mixtures. J. Phys. Org. Chem. 1996, 9, 403–410. [Google Scholar] [CrossRef]
- Papadakis, R. Preferential Solvation of a Highly Medium Responsive Pentacyanoferrate(II) Complex in Binary Solvent Mixtures: Understanding the Role of Dielectric Enrichment and the Specificity of Solute–Solvent Interactions. J. Phys. Chem. B 2016, 120, 9422–9433. [Google Scholar] [CrossRef]
- Hernandez-Perni, G.; Leuenberger, H. The characterization of aprotic polar liquids and percolation phenomena in DMSO/water mixtures. Eur J. Pharm. Biopharm. 2005, 61, 201–213. [Google Scholar] [CrossRef]
- Yalcin, A.J.D.; Christofferson, C.J.; Drummond, T.L. Greaves, Solvation properties of protic ionic liquid–molecular solvent mixtures. Phys. Chem. Chem. Phys. 2020, 22, 10995–11011. [Google Scholar] [CrossRef]
- Kosower, E.M. The Effect of Solvent on Spectra. I. A New Empirical Measure of Solvent Polarity: Z-Values. J. Am. Chem. Soc. 1958, 80, 3253–3260. [Google Scholar] [CrossRef]
- Kosower, E.M. The Effect of Solvent on Spectra. II. Correlation of Spectral Absorption Data with Z-Values. J. Am. Chem. Soc. 1958, 80, 3261–3267. [Google Scholar] [CrossRef]
- Kosower, E.M.; Dodiuk, H.; Tanizawa, K.; Ottolenghi, M.; Orbach, N. Intramolecular Donor-Acceptor Systems Radiative and Nonradiative Processes for the Excited States of 2-iV-Arylamino-6-naphthalenesulfonates. J. Am. Chem. Soc. 1975, 97, 2167–2178. [Google Scholar] [CrossRef]
- Brownstein, S. The effect of solvents upon equilibria, spectra, and reaction rates. Can. J. Chem. 1960, 38, 1590–1596. [Google Scholar] [CrossRef]
- Gowland, J.H.; Schmid, J.H. Two linear correlations of pKa vs. solvent composition. Can. J. Chem. 1969, 47, 2953–2958. [Google Scholar] [CrossRef]
- Brooker, L.G.S.; Arnold, C.; Craig, C.; Heseltine, D.W.; Jenkins, P.W.; Lincoln, L.L. Color and Constitution. XIII. Merocyanines as Solvent Property Indicators. J. Am. Chem. Soc. 1965, 87, 2443–2450. [Google Scholar] [CrossRef]
- Taha, A.; Ramadan, A.A.T.; El-Behairy, M.A.; Ismaila, A.I.; Mahmoud, M.M. Preferential solvation studies using the solvatochromic dicyanobis (1, 10-phenanthroline) iron (II) complex. New J. Chem. 2001, 25, 1306–1312. [Google Scholar] [CrossRef]
- Huot, J.Y.; Battistel, E.; Lumry, R.; Villeneuve, G.; Lavallee, J.-F.; Anusiem, A.; Jolicoeur, C. A comprehensive thermodynamic investigation of water-ethylene glycol mixtures at 5, 25, and 45° C. J. Solution Chem 1988, 17, 601–636. [Google Scholar] [CrossRef]
- Langhals, H. Polarity of liquid mixtures with components of limited miscibility. Tetrahedron Lett. 1986, 27, 339–342. [Google Scholar] [CrossRef]
- Langhals, H. Polarität von Flüssigkeitsgemischen mit begrenzt mischbaren Komponenten. Z. Phys. Chem. 1987, 268, 91–96. [Google Scholar] [CrossRef]
- Jyoti, N.; Meena, A.S.; Beniwal, V. Evaluation of the Polarity in Binary Liquid Mixtures as a Function of Volume Fraction. Asian J. Chem. 2023, 35, 721–726. [Google Scholar] [CrossRef]
- Tanaka, Y.; Kawashima, Y.; Yoshida, N.; Nakano, H. Solvatochromism and preferential solvation of Brooker’s merocyanine in water–methanol mixtures. J. Comp. Chem. 2017, 38, 2411–2419. [Google Scholar] [CrossRef] [PubMed]
- Kiss, B.; Fábián, B.; Idrissi, A.; Szőri, M.; Jedlovszky, P. Miscibility and Thermodynamics of Mixing of Different Models of Formamide and Water in Computer Simulation. J. Phys. Chem. B 2017, 121, 7147–7155. [Google Scholar] [CrossRef] [PubMed]
- Egan, E.P., Jr.; Luff, B.B. Heat of Solution, Heat Capacity, and Density of Aqueous Formamide Solutions at 25° C. J. Chem. Eng. Data 1966, 11, 194–196. [Google Scholar] [CrossRef]
- Campos, V.; Marigliano, A.C.G.; Sólimo, H.N. Density, Viscosity, Refractive Index, Excess Molar Volume, Viscosity, and Refractive Index Deviations and Their Correlations for the (Formamide + Water) System. Isobaric (Vapor + Liquid) Equilibrium at 2.5 kPa. J. Chem. Eng. Data 2008, 53, 211–216. [Google Scholar] [CrossRef]
- Egorov, G.I.; Makarov, D.M. Densities and Molar Isobaric Thermal Expansions of the Water + Formamide Mixture over the Temperature Range from 274.15 to 333.15 K at Atmospheric Pressure. J. Chem. Eng. Data 2017, 62, 1247–1256. [Google Scholar] [CrossRef]
- Perticaroli, S.; Comez, L.; Sassi, P.; Morresi, A.; Fioretto, D.; Paolanton, M. Water-like Behavior of Formamide: Jump Reorientation Probed by Extended Depolarized Light Scattering. J. Phys. Chem. Lett. 2018, 9, 120–125. [Google Scholar] [CrossRef]
- de Visser, C.; Pel, P.; Somsen, G. Volumes and Heat Capacities of Water and N-Methylformamide in Mixtures of These Solvents. J. Solution Chem. 1977, 6, 571–580. [Google Scholar] [CrossRef]
- Cilense, M.; Benedetti, A.V.; Vollet, D.R. Thermodynamic properties of liquid mixtures. II. Dimethylformamide-water. Thermochim. Acta 1983, 63, 151–156. [Google Scholar] [CrossRef]
- Kota Venkata Sivakumar, K.; Murthy Neriyanuri, K.; Krishnadevaraya, S.; Surahmanyam, S.V. Excess thermodynamic functions of the systems water+ N-methyl formamide and water+ N, N-dimethyl formamide. Acustica 1981, 48, 341–345. [Google Scholar]
- Spange, S.; Keutel, D. Untersuchungen zur Polarität wäßriger Harnstoff-und Zucker-Lösungen mit der Methode der vergleichenden Solvatochromie. Liebigs Ann. 1993, 1993, 981–985. [Google Scholar] [CrossRef]
- Stroka, J.; Herfort, I.; Schneider, H. Dimethylpropyleneurea—Water Mixtures: 1. Physical Properties. J. Solution Chem. 1990, 19, 743–753. [Google Scholar] [CrossRef]
- Civera, C.; del Valle, J.C.; Elorza, M.A.; Elorza, B.; Arias, C.; Díaz-Oliva, C.; Catalán, J.; Blanco, F.G. Solvatochromism in urea/water and urea-derivative/water solutions. Phys. Chem. Chem. Phys. 2020, 22, 25165. [Google Scholar] [CrossRef]
- LeBel, R.G.; Goring, D.A.I. Density, Viscosity, Refractive Index, and Hygroscopicity of Mixtures of Water and Dimethyl Sulfoxide. Chem. Eng. Data 1962, 7, 100–101. [Google Scholar] [CrossRef]
- Clever, H.L.; Pigott, S.P. Enthalpies of mixing of dimethylsulfoxide with water and with several ketones at 298.15 K. J. Chem. Thermodyn. 1971, 3, 221–225. [Google Scholar] [CrossRef]
- Egorov, G.I.; Makarov, D.M. The bulk properties of the water-dimethylsulfoxide system at 278–323.15 K and atmospheric pressure. Rus. J. Phys. Chem. A 2009, 83, 693–698. [Google Scholar] [CrossRef]
- Wong, D.B.; Sokolowsky, K.P.; El-Barghouthi, M.I.; Fenn, E.E.; Giammanco, C.H.; Sturlaugson, A.L.; Fayer, M.D. Water Dynamics in Water/DMSO Binary Mixtures. J. Phys. Chem. B 2012, 116, 5479–5490. [Google Scholar] [CrossRef] [PubMed]
- Kaatze, U.; Pottel, R.; Schaefer, M. Dielectric spectrum of dimethyl sulfoxide/water mixtures as a function of composition. J. Phys. Chem. 1989, 93, 5623–5627. [Google Scholar] [CrossRef]
- Płowaś, I.; Świergiel, J.; Jadżyn, J. Relative Static Permittivity of Dimethyl Sulfoxide + Water Mixtures. J. Chem. Eng. Data 2013, 58, 1741–1746. [Google Scholar] [CrossRef]
- Kirchner, B.; Reiher, M. The Secret of Dimethyl Sulfoxide−Water Mixtures. A Quantum Chemical Study of 1DMSO−nWater Clusters. J. Am. Chem. Soc. 2002, 124, 6206–6215. [Google Scholar] [CrossRef]
- Özal, T.A.; van der Vegt, N.F.A. Confusing cause and effect: Energy–entropy compensation in the preferential solvation of a nonpolar solute in dimethyl sulfoxide/water mixtures. J. Phys. Chem. B 2006, 110, 12104–12112. [Google Scholar] [CrossRef]
- Idrissi, A.; Marekha, B.; Barj, M.; Jedlovszky, P. Thermodynamics of mixing water with dimethyl sulfoxide, as seen from computer simulations. J. Phys. Chem. B 2014, 118, 8724–8733. [Google Scholar] [CrossRef]
- Catalán, J.; Dıaz, C.; Garcıa-Blanco, F. Characterization of binary solvent mixtures of DMSO with water and other cosolvents. J. Org. Chem. 2001, 66, 5846–5852. [Google Scholar] [CrossRef]
- Inamdar, S.R.; Gayathri, B.R.; Mannekutla, J.R. Rotational diffusion of coumarins in aqueous DMSO. J. Fluoresc. 2009, 19, 693–703. [Google Scholar] [CrossRef]
- Jabbari, M.; Khosravi, N.; Feizabadi, M.; Ajloo, D. Solubility temperature and solvent dependence and preferential solvation of citrus flavonoid naringin in aqueous DMSO mixtures: An experimental and molecular dynamics simulation study. RSC Adv. 2017, 7, 14776–14789. [Google Scholar] [CrossRef]
- Goates, J.R.; Sullivan, R.J. Thermodynamic Properties of the System Water-p-Dioxane. J. Phys. Chem. 1958, 62, 188–190. [Google Scholar] [CrossRef]
- Sakurai, M. Partial Molar Volumes for 1,4-Dioxane + Water. J. Chem. Eng. Data 1992, 37, 492–496. [Google Scholar] [CrossRef]
- Schott, H. Densities, Refractive Indices, and Molar Refractions of the System Water-Dioxane at 25 °C. J. Chem. Eng. Data 1961, 6, 19–20. [Google Scholar] [CrossRef]
- Ahn-Ercan, G.; Krienke, H.; Schmeer, G. Structural and dielectric properties of 1,4-dioxane–water mixtures. J. Mol. Liq. 2006, 129, 75–79. [Google Scholar] [CrossRef]
- Schrödle, S.; Fischer, B.; Helm, H.; Buchner, R. Picosecond dynamics and microheterogenity of water+ dioxane mixtures. J. Phys. Chem. A 2007, 111, 2043–2046. [Google Scholar] [CrossRef]
- Schrödle, S.; Hefter, G.; Buchner, R. Dielectric Spectroscopy of Hydrogen Bond Dynamics and Microheterogenity of Water + Dioxane Mixtures. J. Phys. Chem. B 2007, 111, 5946–5955. [Google Scholar] [CrossRef]
- Kumbharkhane, A.C.; Joshi, Y.S.; Mehrotra, S.C.; Yagihara, S.; Sudo, S. Study of hydrogen bonding and thermodynamic behavior in water–1,4-dioxane mixture using time domain reflectometry. Phys. B Conden. Matter 2013, 421, 1–7. [Google Scholar] [CrossRef]
- Casassas, E.; Fonrodona, G.; de Juan, A. Solvatochromic parameters for binary mixtures and a correlation with equilibrium constants. Part I. Dioxane-water mixtures. J. Solution Chem. 1992, 21, 147–162. [Google Scholar] [CrossRef]
- Hüttenhain, S.H.; Balzer, W. Solvatochromic Fluorescence of 8-(Phenylamino)-l-naphthalene-ammonium-sulfonate (8,1 ANS) in 1,4-Dioxane/Water Mixtures, revisited. Z. Naturforsch. A 1993, 48, 709–712. [Google Scholar] [CrossRef]
- Raju, B.B.; Costa, S.M.B. Photophysical properties of 7-diethylaminocoumarin dyes in dioxane–water mixtures: Hydrogen bonding, dielectric enrichment and polarity effects. Phys. Chem. Chem. Phys. 1999, 1, 3539–3547. [Google Scholar] [CrossRef]
- Sánchez, F.; Díaz, A.N.; Algarra, M.J.; Lovillo, J.; Aguilar, A. Time resolved spectroscopy of 2-(dimethylamine)fluorene. Solvent effects and photophysical behavior. Spectrochim. Acta A Mol. Biomol. Spectrosc. 2011, 83, 88–93. [Google Scholar] [CrossRef] [PubMed]
- Sahoo, R.; Jana, D. Seth, Photophysical study of an alkaloid harmaline in 1,4-dioxane-water mixtures. Chem. Phys. Lett. 2018, 706, 158–163. [Google Scholar] [CrossRef]
- de Visser, C.; Perron, G.; Desnoyers, J.E. The heat capacities, volumes, and expansibilities of tert-butyl alcohol–water mixtures from 6 to 65 °C. Can. J. Chem. 1977, 55, 856–862. [Google Scholar] [CrossRef]
- Sakurai, M. Partial molar volumes in aqueous mixtures of nonelectrolytes, I. tert. butyl alcohol. Bull. Chem. Soc. Jpn. 1987, 60, 1–7. [Google Scholar] [CrossRef]
- Bowron, D.T.; Sober, A.K.; Finney, J.L. Temperature dependence of the structure of a 0.06 mole fraction tertiary butanol-water solution. J. Chem. Phys. 2001, 114, 6203–6219. [Google Scholar] [CrossRef]
- Egorov, G.I.; Makarov, D.M. Densities and volume properties of (water + tert-butanol) over the temperature range of (274.15 to 348.15) K at pressure of 0.1 MPa. J. Chem. Thermodyn. 2011, 43, 430–441. [Google Scholar] [CrossRef]
- Subramanian, D.; Klauda, J.B.; Leys, J.; Anisimov, M.A. Thermodynamic anomalies and structural fluctuations in aqueous solutions of tertiary butyl alcohol. arXiv 2013, arXiv:1308.3676. [Google Scholar] [CrossRef]
- Aman-Pommier, F.; Jallut, C. Excess specific volume of water + tert-butyl alcohol solvent mixtures: Experimental data, modeling and derived excess partial specific thermodynamic quantities. Fluid Phase Equilibria 2017, 439, 43–66. [Google Scholar] [CrossRef]
- Gavrylyak, M.S. Investigation of dynamic fluctuations of refraction index of water tertiary butanol solutions. In Proceedings of the Eighth International Conference on Correlation Optics, Chernivsti, Ukraine, 11–14 September 2007. [Google Scholar]
- Gazi, A.H.R.; Biswas, R. Heterogeneity in Binary Mixtures of (Water + Tertiary Butanol): Temperature Dependence Across Mixture Composition. J. Phys. Chem. A 2011, 115, 2447–2455. [Google Scholar] [CrossRef] [PubMed]
- Subramanian, D.; Anisimov, M.A. Resolving the Mystery of Aqueous Solutions of Tertiary Butyl Alcohol. J. Phys. Chem. B 2011, 115, 9179–9183. [Google Scholar] [CrossRef] [PubMed]
- Banik, D.; Bhattacharya, S.; Kumar Datta, P.; Sarkar, N. Anomalous Dynamics in tert-Butyl Alcohol–Water and Trimethylamine N-Oxide–Water Binary Mixtures: A Femtosecond Transient Absorption Study. ACS Omega 2018, 3, 383–392. [Google Scholar] [CrossRef]
- Arnett, E.M.; Hufford, D.; McKelvey, D.R. The Ground-State Solvation Contribution to an Electronic Spectral Shift. J. Am. Chem. Soc. 1966, 88, 3142–3148. [Google Scholar] [CrossRef]
- Duereh, A.; Sato, Y.; Smith, R.L.; Inomata, H.; Pichierri, F. Does Synergism in Microscopic Polarity Correlate with Extrema in Macroscopic Properties for Aqueous Mixtures of Dipolar Aprotic Solvents? J. Phys. Chem. B 2017, 121, 6033–6041. [Google Scholar] [CrossRef]
- Akay, S.; Kayan, B.; Martínez, F. Solubility, dissolution thermodynamics and preferential solvation of 4-nitroaniline in (ethanol + water) mixtures. Phys. Chem. Liq. 2021, 59, 956–968. [Google Scholar] [CrossRef]
- Ellis, C.-M. The 2-butoxyethanol-water system: Critical solution temperatures and salting-out effects. J. Chem. Educ. 1967, 44, 405–407. [Google Scholar] [CrossRef]
- Quirion, F.; Magid, L.J.; Drifford, M. Aggregation and Critical Behavior of 2-Butoxyethanol in Water. Langmuir 1990, 6, 244–249. [Google Scholar] [CrossRef]
- Kaatze, U.; Menzel, K.; Pottel, R.; Schwerdtfeger, S. Microheterogeneity of 2-Butoxyethanol/Water Mixtures at Room Temperature. An Ultrasonic Relaxation Study. Z. Phys. Chem. 1994, 186, 141–170. [Google Scholar] [CrossRef]
- Kaatze, U.; Pottel, R.; Schumacher, A. Dielectric spectroscopy of 2-butoxyethanol/water mixtures in the complete composition range. J. Phys. Chem. 1992, 96, 6017–6020. [Google Scholar] [CrossRef]
- Siu, W.; Koga, Y. Excess partial molar enthalpies of 2-butoxyethanol and water in 2-butoxyethanol-water mixtures. Can. J. Chem. 1989, 67, 671–676. [Google Scholar] [CrossRef]
- Andersson, B.; Olofsson, G. Partial molar enthalpies of solution as indicators of interactions in mixtures of 2-butoxyethanol and 2-butanol with water. J. Solution Chem. 1988, 17, 1169–1182. [Google Scholar] [CrossRef]
- Yoshida, K.; Yamaguchi, T.; Nagao, M.Y.; Kawabata, Y.; Seto, H.; Takeda, T. Slow dynamics of n-butoxyethanol–water mixture by neutron spin echo technique. Appl. Phys. A 2002, 74, 386–388. [Google Scholar] [CrossRef]
- Joshi, Y.S.; Kumbharkhan, A.C. Study of dielectric relaxation and hydrogen bonding in water + 2-butoxyethanol mixtures using TDR technique. Fluid Phase Equilib. 2012, 317, 96–101. [Google Scholar] [CrossRef]
- Chiou, D.-R.; Chen, S.-Y.; Chen, L.J. Density, Viscosity, and Refractive Index for Water + 2-Butoxyethanol and + 2-(2-Butoxyethoxy) ethanol at Various Temperatures. J. Chem. Eng. Data 2010, 55, 1012–1016. [Google Scholar] [CrossRef]
- Kajimoto, S.; Moria, A.; Fukumura, H. Photo-controlled phase separation and mixing of a mixture of water and 2-butoxyethanol caused by photochromic isomerisation of spiropyran. Photochem. Photobiol. Sci. 2010, 9, 208–212. [Google Scholar] [CrossRef]
- Indra, S.; Biswas, R. Heterogeneity in (2-butoxyethanol + water) mixtures: Hydrophobicity-induced aggregation or criticality-driven concentration fluctuations? J. Chem. Phys. 2015, 142, 204501. [Google Scholar] [CrossRef] [PubMed]
- Catalán, J.; Díaz-Oliva, C.; García-Blanco, F. On the hydrophobic effect in water–alcohol mixtures. Chem. Phys. 2019, 527, 110467. [Google Scholar] [CrossRef]
- Li, R.; Agostino, C.; McGregor, J.; Mantle, M.D.; Zeitler, A.; Gladden, L.F. Mesoscopic Structuring and Dynamics of Alcohol/Water Solutions Probed by Terahertz Time-Domain Spectroscopy and Pulsed Field Gradient Nuclear Magnetic Resonance. J. Phys. Chem. B 2014, 118, 10156–10166. [Google Scholar] [CrossRef] [PubMed]
- Baksi, A.; Biswas, R. Dynamical Anomaly of Aqueous Amphiphilic Solutions: Connection to Solution H-Bond Fluctuation Dynamics? ACS Omega 2022, 7, 10970–10984. [Google Scholar] [CrossRef] [PubMed]
- Koohyar, F.; Kiani, F.; Sharifi, S.; Sharifirad, M.; Rahmanpour, S.H. Study on the Change of Refractive Index on Mixing, Excess Molar Volume and Viscosity Deviation for Aqueous Solution of Methanol, Ethanol, Ethylene Glycol, 1-Propanol and 1, 2, 3-Propantriol at T = 292.15 K and Atmospheric Pressure. Res. J. Appl. Sci. Eng. Technol. 2012, 4, 3095–3101. [Google Scholar]
- Zhang, Z.; Wang, W.; Korpacz, A.N.; Dufour, C.R.; Weiland, Z.J.; Lambert, C.R.; Timko, M.T. Binary Liquid Mixture Contact-Angle Measurements for Precise Estimation of Surface Free Energy. Langmuir 2019, 35, 12317–12325. [Google Scholar] [CrossRef]
- Davis, M.I. Determination and analysis of the excess molar volumes of some amide-water systems. Thermochim. Acta 1987, 120, 299–314. [Google Scholar] [CrossRef]
- Marcus, Y. Preferential solvation in mixed solvents. 15. Mixtures of acetonitrile with organic solvents. J. Chem. Thermodyn. 2019, 135, 55–59. [Google Scholar] [CrossRef]
- Marcus, Y. The structure of mixtures of water and acetone derived from their cohesive energy densities and internal pressures. J. Mol. Liq. 2020, 320, 112801. [Google Scholar] [CrossRef]
- Reichardt, C. Pyridinium-N-phenolate betaine dyes as empirical indicators of solvent polarity: Some new findings. Pure Appl. Chem. 2008, 80, 1415–1432. [Google Scholar] [CrossRef]
- Kiselev, V.D.; Kashaeva, E.A.; Luzanova, N.A.; Konovalov, A.I. Enthalpies of solution of lithium perchlorate and Reichardt’ dye in some organic solvents. Thermochim. Acta 1997, 303, 225–228. [Google Scholar] [CrossRef]
- Machado, C.; da Graça Nascimento, M.; Rezende, M.C.; Beezer, A.E. Calorimetric evidence of aggregation of the ET(30) dye in alcoholic solutions. Thermochim. Acta 1999, 328, 150–159. [Google Scholar] [CrossRef]
- Catalán, J.; Gomez, J.; Saiz, J.L.; Couto, A.; Ferraris, M.; Laynez, J. Calorimetric quantification of the hydrogen-bond acidity of solvents and its relationship with solvent polarity. J. Chem. Soc. Perkin Trans. 2 1995, 1, 2301–2305. [Google Scholar] [CrossRef]
- Bose, K.; Kundu, K.K. Thermodynamics of transfer of p-nitroaniline from water to alcohol + water mixtures at 25 °C and the structure of water in these media. Can. J. Chem. 1977, 55, 3961–3966. [Google Scholar] [CrossRef]
- Cowie, J.M.G.; Toporowski, P.M. Association in the binary liquid system dimethylsulphoxide-water. Can. J. Chem. 1961, 39, 2240–2243. [Google Scholar] [CrossRef]
- Schrader, A.M.; Donaldson, S.H., Jr.; Song, J.; Israelachvili, J.N. Correlating steric hydration forces with water dynamics through surface force and diffusion NMR measurements in a lipid–DMSO–H2O system. Proc. Natl. Acad. Sci. USA 2015, 112, 10708–10713. [Google Scholar] [CrossRef] [PubMed]
- Bandyopadhyay, S.N.; Singh, K.K.; Goswam, D. Sensing non-ideal microheterogeneity in binary mixtures of dimethyl sulfoxide and water. J. Opt. 2022, 24, 054001. [Google Scholar] [CrossRef]
- Cerar, J.; Jamnik, A.; Pethes, I.; Temleitner, L.; Pusztai, L.; Tomšič, M. Structural, rheological and dynamic aspects of hydrogen-bonding molecular liquids: Aqueous solutions of hydrotropic tert-butyl alcohol. J. Coll. Interf. Sci. 2020, 560, 730–742. [Google Scholar] [CrossRef]
- Chakraborty, S.; Pyne, P.; Mitra, R.K.; Das Mahanta, D. A subtle interplay between hydrophilic and hydrophobic hydration governs butanol (de)mixing in water. Chem. Phys. Lett. 2022, 807, 140080. [Google Scholar] [CrossRef]
- Langhals, H. Ein neues, unkompliziertes Verfahren zur Bestimmung der Zusammensetzung binärer Fliissigkeitsgemische, A new, uncomplicated method for the determination of the composition of binary liquid mixtures. Fresenius Z. Anal. Chem. 1981, 308, 441–444. [Google Scholar] [CrossRef]
- Królicki, R.; Jarzȩba, W.; Mostafavi, M.; Lampre, I. Preferential Solvation of Coumarin 153 The Role of Hydrogen Bonding. J. Phys. Chem. A 2002, 106, 1708–1713. [Google Scholar] [CrossRef]
- Marcus, Y. The structure of and interactions in binary acetonitrile + water mixtures. J. Phys. Org. Chem. 2012, 35, 1072–1085. [Google Scholar] [CrossRef]
- Shalmashi, A.; Amani, F. Densities and excess molar volumes for binary solution of water + ethanol, + methanol and + propanol from (283.15 to 313.15) K). Lat. Am. Appl. Res. 2014, 44, 163–166. [Google Scholar] [CrossRef]
- Galicia-Andrés, E.; Dominguez, H.; Pusztai, L.; Pizio, O. On the composition dependence of thermodynamic, dynamic and dielectric properties of water-methanol model mixtures. Molecular dynamics simulation results. Condens. Mater. Phys. 2015, 18, 43602. [Google Scholar] [CrossRef]
- Martens, M.; Hadrich, M.J.; Nestler, F.; Ouda, M.; Schaad, A. Combination of Refractometry and Densimetry–A Promising Option for Fast Raw Methanol Analysis. Chem. Ing. Tech. 2020, 92, 1474–1481. [Google Scholar] [CrossRef]
- Ortega, J. Densities and Refractive Indices of Pure Alcohols as a Function of Temperature. J. Chem. Eng. Data 1982, 27, 312–317. [Google Scholar] [CrossRef]
- Zaichikov, A.M.; Krestyaninov, M.A. Thermodynamic characteristics of and intermolecular interactions in aqueous solutions of N-methylformamide. Russ. J. Phys. Chem. 2006, 80, 1249–1254. [Google Scholar] [CrossRef]
- de Visser, C.; Perron, G.; Desnoyers, J.E.; Heuvelsland, W.J.M.; Somsen, G. Volumes and Heat Capacities of Mixtures of N, N- Dimethylformamide and Water at 298.15 K. J. Chem. Eng. Data 1977, 22, 74–79. [Google Scholar] [CrossRef]
- Al-Azzawl, S.F.; Allo, E.I. Density, Viscosity, and Refractivity Data off Solutions of Potassium Iodide in /V-Formylmorpholine-Water at 25, 35, and 45 °C. J. Chem. Eng. Data 1992, 37, 158–162. [Google Scholar] [CrossRef]
- Chen, G.; Hou, Y.; Knapp, H. Diffusion Coefficients, Kinematic Viscosities, and Refractive Indices for Heptane + Ethylbenzene, Sulfolane + 1-Methylnaphthalene, Water + N,N-Dimethylformamide, Water + Methanol, Water + N-Formylmorpholine, and Water + N-Methylpyrrolidone. J. Chem. Eng. Data 1995, 40, 1005–1010. [Google Scholar] [CrossRef]


Disclaimer/Publisher’s Note: The statements, opinions and data contained in all publications are solely those of the individual author(s) and contributor(s) and not of MDPI and/or the editor(s). MDPI and/or the editor(s) disclaim responsibility for any injury to people or property resulting from any ideas, methods, instructions or products referred to in the content. |
© 2024 by the author. Licensee MDPI, Basel, Switzerland. This article is an open access article distributed under the terms and conditions of the Creative Commons Attribution (CC BY) license (https://creativecommons.org/licenses/by/4.0/).