Abstract
This article contains a comparative spectral analysis corroborated with the quantum mechanical computations of four cycloimmonium ylids. The spectral shift of the visible electronic absorption band of the studied molecules in 20 solvents with different empirical parameters is expressed by linear multi-parametric dependences that emphasize the intramolecular charge transfer (ICT) process. The nature of molecular interactions and their contribution to the spectral shift of the visible ICT band of solutes are also established in this manuscript. The results of the statistical analysis are used to estimate the cycloimmonium ylids’ excited dipole moment by the variational method, using the hypothesis of McRae. The importance of the structure of both the heterocycle and carbanion substituents to the stability and reactivity of the studied cycloimmonium ylids is underlined by the quantum mechanical computations of the molecular descriptors.
1. Introduction
Cycloimmonium ylids [1,2,3] are N-ylids with separated charges on a nitrogen belonging to a heterocycle and on a negative α-exo-cycle carbon, named the carbanion. Two highly electronegative atomic substituents are bonded to the carbanion in carbanion-disubstituted methylids, while in carbanion-monosubstituted methylids, one electronegative atomic group and a hydrogen atom are bonded to the carbanion.
In the second half of the 20th century, Professors I. Zugravescu and M. Petrovanu with their teams, working in the Faculty of Chemistry of Alexandru Ioan Cuza University of Iasi, made a great contribution by obtaining and characterizing new molecules belonging to the cycloimmonium ylid class [2].
The studied cycloimmonium ylids contain heterocycles (pyridinium, iso-quinolinium, pyridazinium and benzo-[f]-quinolinium) and the carbanion’s substituents (carbethoxy, acetyl and benzoyl) [2].
The stability of cycloimmonium ylids is influenced by both the electronegativity of the carbanion substituents and the electron-withdrawing ability of the heterocycles [2,3]. For example, the carbanion-disubstituted cycloimmonium ylids are more stable than those that are carbanion-monosubstituted, and iso-quinolinium ylids are more stable than pyridinium ylids.
The most common method for obtaining cycloimmonium ylids is the “salt method” from the quaternary halogenures of heterocycles in basic solutions [2].
All cycloimmonium ylids are characterized by a high-wavelength electronic absorption band (usually placed in the visible range) that is attributed to an internal charge transfer (ICT) from the carbanion toward the heterocycle and is very sensitive to the solvent nature [3,4,5,6,7,8]. This band shifts to high wavenumbers when the ylid is passed from nonpolar or non-protic solvents to polar and protic ones; it disappears or its intensity diminishes in acid media [3,7].
Cycloimmonium ylids are used as acid–basic indicators due to their change in color in the presence of acids and bases [2,3]. They are also used as semiconductors [9], in obtaining thin conducting films [10], or as chemical precursors in reactions for new heterocycles [11,12]. The 2,3 dipolar cycloadditions of cycloimmonium ylids to dienophiles have been used to synthesize steroid analogs with biological activity [13], including antiviral [14], anticancer [15], antifungal [16,17] and antituberculosis [18] effects.
Due to their high reactivity, some cycloimmonium ylids with monosubstituted carbanions are used as precursors in synthesis reactions [19,20].
As dipolar and polarizable molecules, cycloimmonium ylids are used, in small concentrations, as sounders in liquids in order to obtain information about the nature and the strength of the molecular interactions in solutions [5,6,7,8,21].
In order to illustrate the importance of solvents’ empirical scales in characterizing the nature and strength of molecular interactions and in estimating the excited-state dipole moment of the solute molecules, we have chosen four cycloimmonium ylids: two with common heterocycle and two pairs with common carbanions. These molecules were previously studied separately from a spectral point of view in binary and ternary solutions [5,6,7,8,22,23,24]. The chosen cycloimmonium molecules show electronic absorption bands in the UV range of the type and a visible band of the n type [3]. The UV bands are of high intensity and low sensitivity to the solvent nature, but the visible absorption band is of low intensity, disappears in acid media and shifts to blue when the solute molecules pass through a non-polar/aprotic solvent to a polar/protic solvent. Based on these characteristics, the electronic visible band was attributed to an intramolecular charge transfer (ICT) transition from the ylid carbanion toward its heterocycle [3,6,7,8].
The mechanism of the visible ICT band of cycloimmonium ylids is similar to that based on the definition of the solvent polarity scales ( and ) introduced by Cristian Reichardt and co-workers [25,26,27] using betaine dye derivatives as spectrally active molecules.
The empirical mono-parameter solvent scales classify liquids regarding their solvation ability but do not allow us to establish the contribution of each type of molecular interaction to the solvation energy. They measure only the difference between the solvation energies in the electronic states responsible for the electronic (absorption/emission) band appearance according to its position in the electronic spectrum relative to the solute gaseous phase.
The theoretical relationships [28,29,30] established for describing the influence of dielectric continuous liquids on the electronic bands of the solutes, as well as the new empirical parameters [31] introduced by Kamlet, Abboud and Taft (KAT) and by Catalan [32] in order to consider the ability of solvents to form hydrogen bonds by receiving or donating protons, were used, with better results, in establishing both the nature and contribution of each type of interactions to the total spectral shift in a given solvent and in estimating the dipole moment in the excited state of the studied cycloimmonium ylids.
In all solutions, interactions between the components can modify some chemical descriptors of the molecules. Both specific (hydrogen bonds, change of electrons or protons, dimerization and clusterization) and non-specific (orientation, induction, polarization and dispersive) interactions can take place between the solution components. Intermolecular interactions induce changes in spectral tools of solutions, such as spectral shifts, variations in intensities and/or polarization of the spectral bands.
Solvatochromism describes the changes in the position/intensity of molecular UV–Vis bands of the solute induced by the solvent polarity. Some researchers previously used the notion of the solvent polarity. For example, Brooker [33] suggested the term solvent polarity in 1951, and Kosower realized a solvent scale based on the energy at the maximum of a visible electronic absorption band in 1958 [34]. But the term solvent polarity was recognized by IUPAC in 1994 when it was introduced in the Glossary of terms used in physical organic chemistry and defined as the “solvation capability of solvent depending on all intermolecular solute/solvent interactions which do not change the chemical nature of the solution components”. When a chemical reaction occurs in situ, it must be ensured that the reaction components of the chosen solvent have good solubility and do not change their chemical structure.
In the middle of the 20th century, the chemists used the term solvent polarity (suggested by Brooker in 1951 [33]) to characterize liquid properties. Kosower [34,35] was the first to determine the positions of the visible electronic band of the complex 1-ethyl-4-carbomethoxy pyridinium iodide in 21 solvents and classified them based on the energy at the maximum of intermolecular charge transfer band between the iodine and pyridine derivative, listing a Z-scale, or solvent polarity scale.
The complex structure and the charge transfer mechanism studied by Kosower are shown in Figure 1. Due to the change in the orientation of the complex dipole moment caused by the visible photon absorption (see Figure 1a), the spectral position of the visible absorption band of the complex depends only on the ground dipole moment of complex (by the solvation energy of the complex in its non-excited electronic state). The dipole moment in the excited electronic state of the complex is perpendicular on the ground state dipole moment. The interaction with the reactive field created by the solvent molecules surrounding the solute becomes null after the visible photon absorption. Therefore, the parameter Z introduced by Kosower measures the solvation energy of the considered complex in its ground electronic state. The solvent polarity scale is based on Equation (1) in which the wavelength at the maximum of the electronic absorption band is expressed in cm and the solvent polarity Z in kcal/mol.
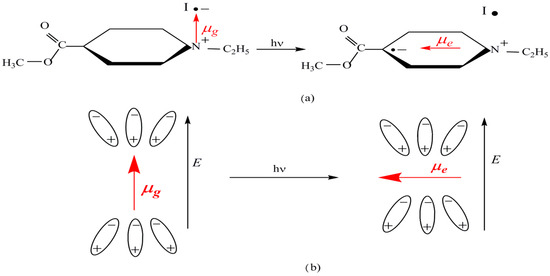
Figure 1.
Chemical structure of 1-ethyl-4-carbomethoxy-pyridinium iodide complex and the mechanism of ICT of the visible electronic band appearance. (a) Electron transfer from iodine to heterocycle. (b) Relative orientation of the solvent molecules and the dipole moments of solute on its ground and excited states.
Some inconvenient factors, such as insolubility of this complex in the non-polar solvents and high concentration at which the spectral recordings must be carried out, make it impossible to measure Z values for a great number of solvents.
A large number of solvent scales have been defined. More than 30 empirical polarity solvent scales have been published to date [36], and the existence of linear correlations between them was emphasized by different authors.
The Dimroth and Reichardt [25,26,27] empirical scale of solvent polarity is usually applied to characterize the solvatochromic effects of solvents. It is constructed based on the spectral characteristics of betaine 1 (2,6-bis[4-(t-butyl)phenyl]-4-[2,4,6-tris[4-(t-butyl)phenyl]pyridine-1-yl]phenolate) [25] with the chemical structure illustrated in Figure 2a.
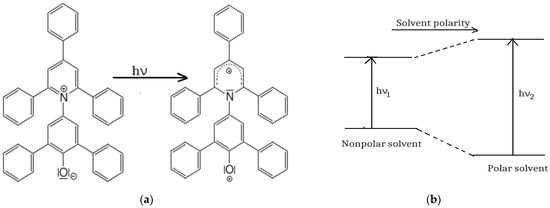
Figure 2.
(a) Chemical structure of betaine 1 dye and mechanism of the ICT in this molecule; (b) hypsochromic shift of the visible band of betaine 1 in polar solvents compared with non-polar ones.
Betaine 1 dye (Figure 2a) shows a visible electronic absorption band due to an intramolecular charge transfer (ICT) through oxygen towards the heterocycle; this process causes the decrease in the dye excited-state dipole moment and the change in its sensitivity. So, the solvation energy in the ground state of the solute determines its stabilization, while in the excited state, the local field created by the solvent becomes antiparallel to the molecular dipole moment, and the energy corresponds to a destabilization process, as Figure 2b suggests.
Betaine 1 dye is used to measure the solvent polarity due to its high solubility in the majority of liquids and due to the great difference between its dipole moments in the ground ( and in the first excited ( electronic states, inducing high values of the spectral shifts in the visible range for the polar solvents compared with the non-polar ones.
Betaine 1 dye is at the basis of two solvent polarity scales, and , with the following definitions.
In Equation (2), is the wavenumber at the maximum of the electronic absorption band, measured in , and is the wavelength (expressed in cm) corresponding to the same maximum.
The second empirical solvent scale is named , and it is defined using the values of in the respective solvent and in water and TMS, corresponding with Equation (3).
The last scale was introduced in order to avoid the use of non-IS unity kcal/mol and then transform it in kJ/mol. The parameter is adimensional.
Reichardt contributed to the proposal of these empirical scales and to the increase in the solvent number characterized by parameter , considering the electronic absorption spectra of other betaine dyes [26] as standard dyes for the solvents in which betaine 1 is not soluble. A complex study of the solvent influence on organic molecules was realized by prof. C. Reichardt in [27].
These two solvent polarity scales are known for more 400 pure and mixed liquids. The increasing the solvent polarity is in the following order:
- Non-polar non hydrogen bond donor (HBD) (cyclohexane, benzene, THF and dichloromethane);
- Dipolar non-polar HBD (aprotic) solvents (acetone, DMF and DMSO);
- Dipolar protic solvents (alcohols and acids).
The empirical scales of the solvents [36] arrange the liquids using the spectral data and can be applied to the solute molecules showing electronic spectra and developing the same type of interactions with a given solvent. In the solution of a solute, molecular interactions differ according to the standard molecule, and deviations in the linear dependence of the spectral data vs. empirical parameters are observed. The presence of the aberrant points in graphs of experimental wavenumbers vs. empirical solvent parameters indicates the presence of supplemental interactions between the solute and the solvent molecules.
The statistical analysis of experimental data shows the linearity between the experimental wavenumbers at the maximum of the electronic band of the solute and the empirical polarity parameter of the solvent according to Equation (4).
In Equation (4), the following notation is used: ν is the wavenumber at the maximum of the electronic band, and Pp is the empirical polarity parameter of the solvent. The correlation coefficients m and n can be statistically established using experimental spectral data and the values of the solvent polarity parameters. Due to the linear relationships between various polarity scales according to [36], in the present paper, we used an equation of the type (4) both for Z and ET(30) parameters.
The empirical solvent scales based on multiple parameters have the advantage of separately considering the effect of the different forces on the solute molecules.
Some theoretical representations [28,29,30] were concomitantly developed in order to compute the contributions of each type of solvent to the electronic bands of the solute. But, as Reichardt comments [26,27], these theories take into consideration only universal interactions, considering the solvent a continuum dielectric acting on the valence electrons of the solute molecules. The solvation energy in the electronic states responsible for the appearance of the electronic transition in absorption or emission processes is computed using macroscopic parameters n (refractive index) and ε (electric permittivity) of the solvent in the existent theories. The specific interactions of the solute/solvent type are neglected by the existent theories.
The impossibility to develop a unitary theory describing the complex phenomena from the liquid phase results from the multitude of the interactions developed between its components and from the very close values of the interaction energies and the energy of the thermal motion, which determine only a partial order in liquids.
In this situation, the researchers combined [5,8,37] the theoretical and empirical correlations using multi-parametric linear relations between the spectral characteristics of the solute and the solvent parameters in order to assure good correspondence between the experimental and computed results. Usually, equations of the type (5) are used to describe the solvent influence on the electronic bands of the solutes.
In Equation (5), the first term signifies the wavenumber at the maximum of the electronic band of the solute measured in its gaseous phase; the two following terms describe the universal interactions as functions of the macroscopic parameters of the solvent (refractive index, n, and electric permittivity, ε), and the terms and describe the specific interactions in which the solvent molecules donate and receive protons, respectively.
This combination of the theoretical representations and the empirical treatment permit us to use the theoretical expressions of the correlation coefficients and [6,7] in order to compute some molecular parameters of the solute in its excited state of electronic transition.
Equations of the types (6) and (7) express the correlation coefficients (determined by statistical means) as functions of microscopic parameters of the solute (molecular radius, a; dipole moment, µ; polarizability, α; and ionization potentials, I, of solute (u) and solvent (v) in the solute ground (g) and excited (e) states of the electronic transition). The corresponding parameters of the solute in its ground state can be computed by quantum mechanical procedures.
In the case of solute molecules showing both absorption and emission electronic spectra, the dipole moments in the electronic states responsible for the electronic transition and the angle between them can be computed based on similar relations written for both types of electronic spectra [38,39,40,41]. In the case in which the solute molecules are active only in absorption spectra, the variational method [42], based on the McRae hypothesis [28] that the molecular polarizability does not vary in the visible photon absorption process, can be applied.
The combined spectral and computational analyses of the molecular parameters help us to obtain supplemental information about the excited states of the molecular structures, contributing to the development of the quantum mechanical calculations for the excited states.
2. Materials and Methods
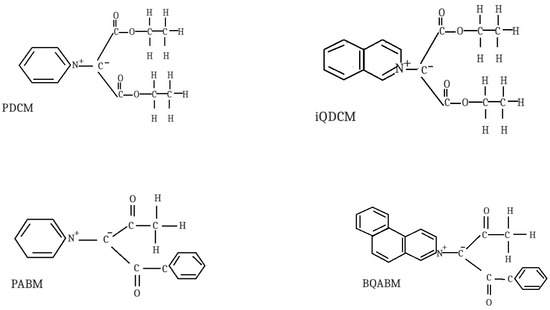
Four cycloimmonium ylids, pyridinium-dicarbethoxy-methylid (PDCM)—C12H15O4N1, iso-quinolinium dicarbethoxy methylid (iQDCM)—C16H17O4N1, pyridinium-acetyl-benzoyl methylid (PABM)—C15H13O2N1 and benzo-[f]-quinolinium acetyl-benzoyl-methylid (BQABM)—C23H17O2N1, are considered in this paper. The structural features of the studied cycloimmonium ylids are given in Scheme 1. Two ylids (PDCM and PABM) have pyridine as a common heterocycle. Two pairs of ylids have the same substituents at their carbanions (PDCM and iQDCM, respectively, BQABM and PABM).
Scheme 1.
Structural features of the studied cycloimmonium ylids.
The optimized geometries of the studied ylids, in a common format, are provided in Supplementary Material.
The studied substances were prepared as described in [2] in Alexandru Ioan Cuza University Organic Chemistry Labs. Their purity was assessed by spectral (NMR and IR) and chemical (elemental) means.
The spectral grade solvents were obtained from Merck Company, Darmstadt, Germany, and Sigma-Aldrich, Burlington, MA, United States (headquarters) and used without any purification.
The solvent parameters were taken from [43].
The solvent parameters used in this paper are listed in Table 1, where and are from [27].

Table 1.
Solvent parameters.
The visible electronic absorption band was recorded with a Specord UV–Vis Carl Zeiss Jena spectrophotometer with a data acquisition system.
The optimized structure and the molecular descriptors of cycloimmonium ylids in the electronic ground state, in vacuum, were established with the Spartan’14 program [44,45]. The density function theory (DFT) was used with the B3LYP method (Becke’s three-parameter functional using the Lee–Yang–Parr correlation functional) in combination with the 6-31G* basis set [46].
Statistical analysis was carried out using the Origin 9 program using fitting methods (linear fit and multiple linear regressions). In order to obtain a better correlation between the spectral data and solvent parameters, the aberrant points were eliminated.
3. Results and Discussion
3.1. Computational Results
The optimized structures of the studied methylids are illustrated in Figure 3, Figure 4, Figure 5 and Figure 6.
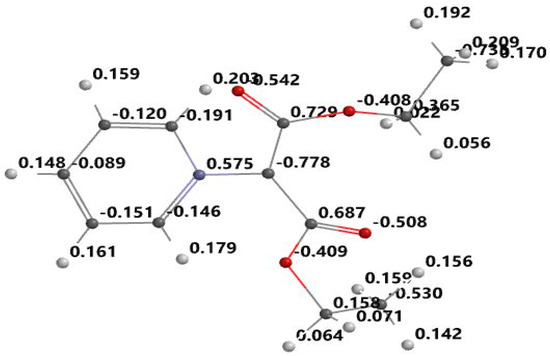
Figure 3.
Optimized structure and atomic electrostatic charge for PDCM.
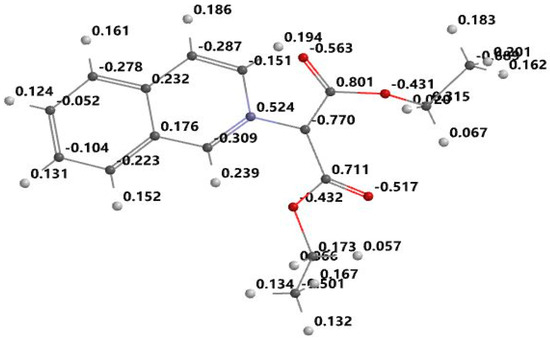
Figure 4.
Optimized structure and atomic electrostatic charge for iQDCM.
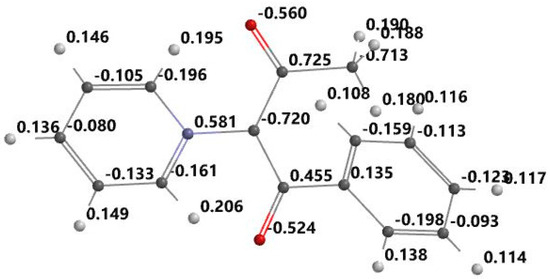
Figure 5.
Optimized structure and atomic electrostatic charge for PABM.
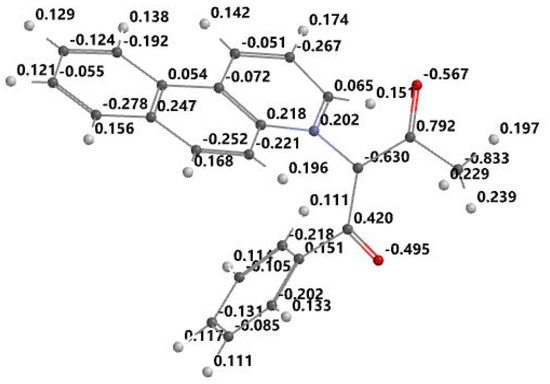
Figure 6.
Optimized structure and atomic electrostatic charge for BQABM.
From the Figure 3, Figure 4, Figure 5 and Figure 6, it can be seen that the ylid covalent bond is polarized; the electronic charge is shifted to carbanion from nitrogen. In this way, the studied methylids have a zwitterionic and basic nature in their ground electronic state. One can see that the covalent bond C=O is also polarized due to the high electronegativity of oxygen. Pronounced charge separation on the covalent bond C=O due to high electronegativity of oxygen can be seen in Figure 3, Figure 4, Figure 5 and Figure 6. The smallest charge separation is on the C=O bond neighboring the benzene ring in PABM (Figure 5). This fact favors the ability of the studied methylids to participate in specific interactions with protic molecules [3,5,7].
Figure 7, Figure 8, Figure 9 and Figure 10 show the transitions between HOMO and LUMO orbitals with intramolecular charge transition (ICT) from the carbanion towards the heterocycle for all studied cycloimmonium ylids.
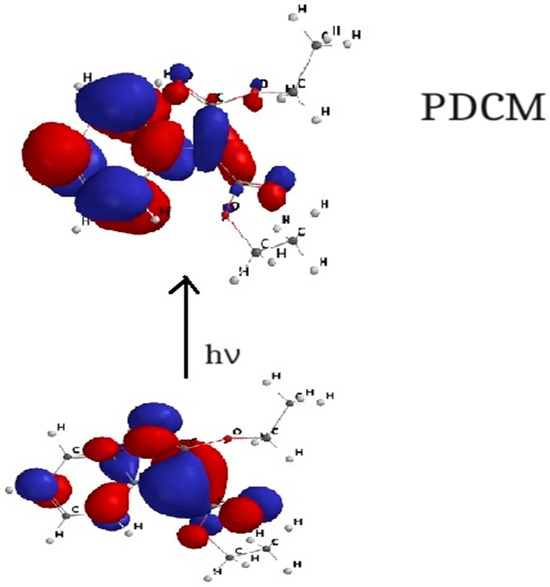
Figure 7.
HOMO–LUMO orbital transition for PDCM.
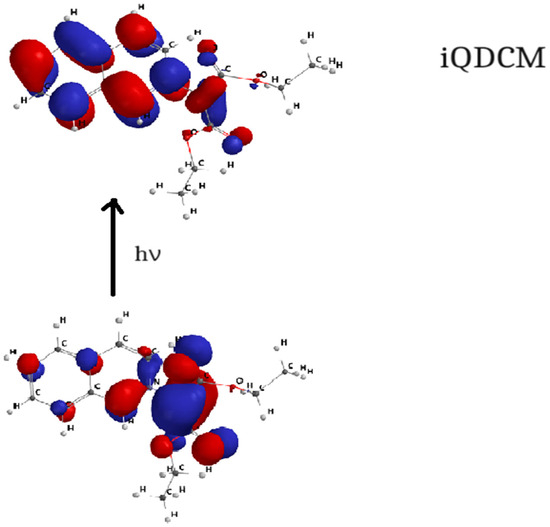
Figure 8.
HOMO–LUMO orbital transition for iQDCM.
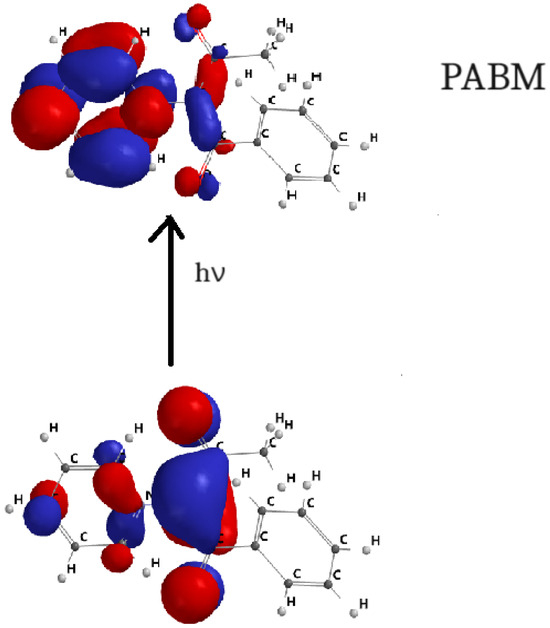
Figure 9.
HOMO–LUMO orbital transition for PABM.
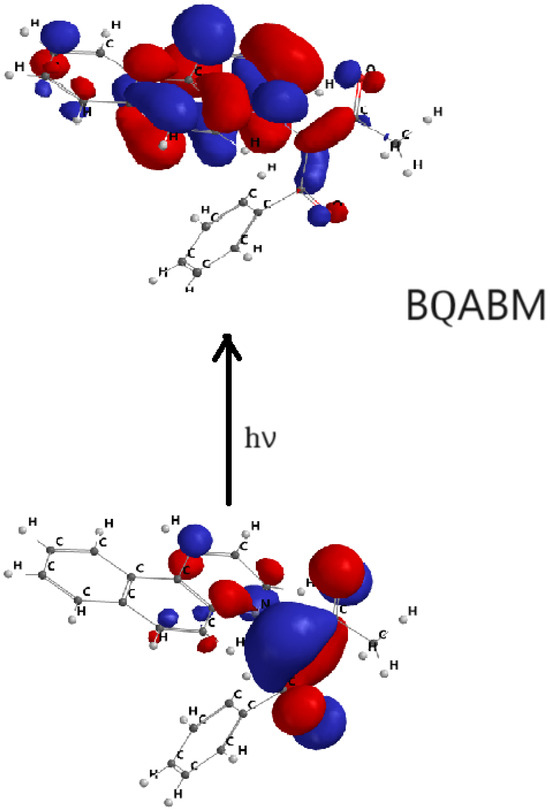
Figure 10.
HOMO–LUMO orbital transition for BQABM.
In the ground electronic state (HOMO), the studied methylids are characterized by a high electronic charge on the carbanion, while in their excited electronic state (LUMO), the non-bonded electrons are shifted towards the heterocycle. So, the electric dipole moment of the considered molecules decreases [6,7,23,24] in the process of the visible photon absorption. This results in the solvation energy of the studied methylids being higher in the ground electronic state compared with the first excited-state solvation energy.
The molecular descriptors obtained in quantum mechanical analysis for the considered cycloimmonium ylids are listed in Table 2. The results from Table 2 correspond to gaseous state of the studied molecules.
Table 2.
Molecular descriptors of the studied methylids computed by Spartan ‘14.
From Table 2, it can be seen that studied molecules are dipolar and polarizable. According to Koopmans’s theorem [47] the values with the changed sign of HOMO and LUMO energies are the ionization potential and electron affinity of the studied methylids. The relatively small values of these parameters show that the cycloimmonium ylids can be used as precursors in chemical reactions.
The HOMO–LUMO gap (Table 2) shows the high chemical reactivity and biological activity of the studied molecules.
The HBA and HBD count shows that the methylids do not donate protons to the solvent molecules (null value of HBD count) but can receive protons from protic solvents. There are three places (HBA count is 3) in methylids where the hydrogen bond can be realized.
The data from Table 2 were corroborated with the spectral results used in this study for calculating the excited dipole moments for the studied molecules.
3.2. Spectral Results
The experimental wavenumbers (expressed in ) at the maximum of the visible electronic absorption bands of the considered methylids are listed in Table 3.
Table 3.
Wavenumbers at the maximum of the electronic absorption band for the studied methylids.
The data from Table 3 show that the visible band of cycloimmonium ylids is sensitive to the solvent nature; it shifts to blue when the ylids are passed from non-polar/aprotic solvents to polar/protic ones, due to the increase in the orientation and specific interactions in the ground electronic state.
One can establish linear dependence between the energy at the maximum of the visible band of cycloimmonium ylids and the empirical parameter introduced by Kosower for the solvent polarity (see Equation (8) and Table 4).
Table 4.
Regression coefficients for Equation (8).
The slope M, in relation to (8), indicates the strength of the molecular interactions of the methylid with the solvent and the cut at the origin, N (kcal/mol), approximates the energy at the maximum of the visible absorption band when it is recorded in the vaporous state of the spectrally active molecule. From Table 4, it can be seen that cycloimmonium ylids with symmetrically substituted carbanion are less sensitive to the solvent action compared to those with asymmetric carbanion. The cut at the origin in Equation (8) decreases with the increase in the benzene rings in the ylid molecule. In the last column of Table 4, the number Nr of the points used in statistical analysis after the elimination of the aberrant points is specified.
The dependence of the type (8) is illustrated in Figure 11. The very good linear dependence between and the Kosower empirical polarity is given due to the similar mechanism determining the visible band appearance for the cycloimmonium ylids and for the complex considered by Kosower.
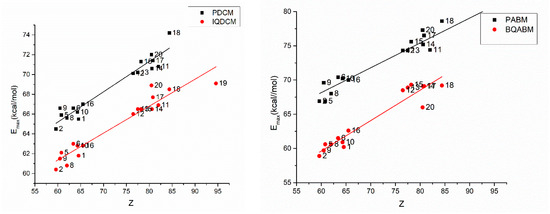
Figure 11.
Energy at the maximum of the absorption band versus Z solvent parameter for the studied molecules.
The standard molecule considered by Reichardt in obtaining the solvent polarity, betaine 1 dye (see Figure 2a), has a chemical structure more similar to that of the cycloimmonium ylids. It is normal to obtain a good linear dependence between the energy at the maximum of the visible band of cycloimmonium ylids and the parameters of the ET(30) empirical scale, from Equation (9), as shown by the data of Table 5.
Table 5.
Regression coefficients for Equation (9).
In the last column of Table 5, the number N of the points used in statistical analysis after the elimination of the aberrant points is specified.
Very good correlation between the positions of the visible band of cycloimmonium ylids and those of the Reichardt’ standard dye is illustrated in Figure 12. This fact can be explained by the similitude between the electronic transitions in the visible photon absorption process for both types of molecules.
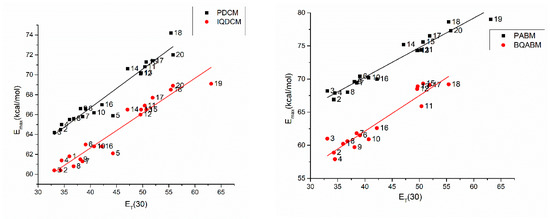
Figure 12.
Energy at the maximum of the absorption band versus the ET(30) parameter for the studied molecules.
The mono-parameter empirical scales of solvents proposed by Kosower and by Reichardt categorize the solvents regarding their influence on the ITC visible band of cycloimmonium ylids but do not establish relations between the correlation coefficients of Equations (8) or (9) and the molecular descriptors computed for the cycloimmonium ylids.
By using dependences of the type (5), in which the theoretical results are combined with the empirical ones, the correlation coefficients resulting from theoretical means express their dependence on the molecular descriptors of the spectrally active molecules by equations of the types (6) and (7), allowing new estimations to be obtained for the excited states of the studied molecules.
In our attempt to use an equation of the type (5) in statistical analysis of the spectral data, the equation of the type (10) was obtained, showing an important role of the universal interactions (described by the term and of the hydrogen bond (described by the term ), in which the methylids accept protons from the protic molecules of the solvents. An equation of the type (10) suggests the basic nature of cycloimmonium ylids and their dipolar characteristics in orientation interactions.
In the last column of Table 6, the number N of the points used in statistical analysis after the elimination of the aberrant points is specified.
Table 6.
Regression coefficients for Equation (10).
The correlation coefficients obtained in statistical analysis based on relation (5) and the data of Table 1 and Table 3, when the parameters without real importance (f(n) and β) were eliminated, are given in Table 6.
The values computed by Equation (10) and the experimental data referring to the visible electronic absorption band of the considered cycloimmonium ylids are plotted in Figure 13 and Figure 14.
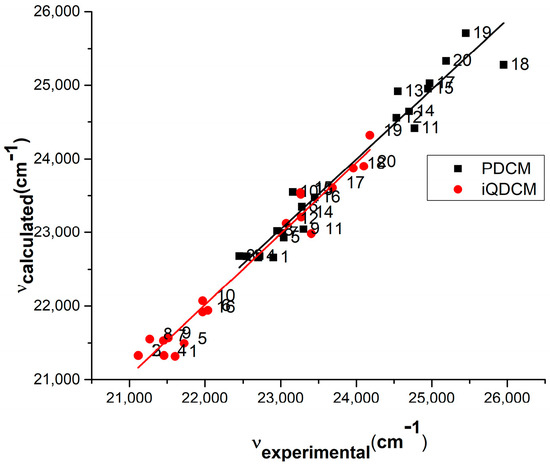
Figure 13.
Experimental vs. computed values of the wavenumbers in maximum of the visible electronic absorption band of PDCM and iQDCM molecules.
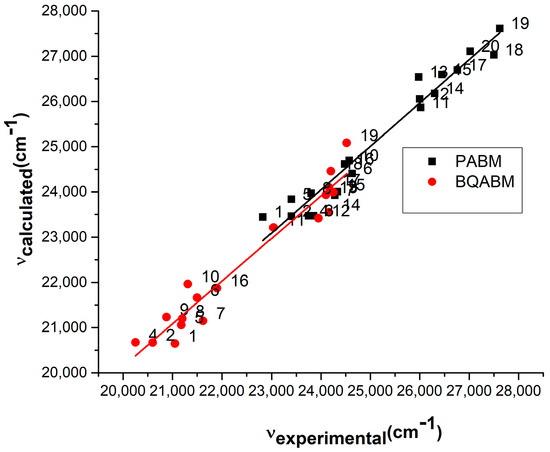
Figure 14.
Experimental vs. computed values of the wavenumbers in maximum of the visible electronic absorption band of PABM and BQABM molecules.
There is a very good correlation between computed and experimental wavenumbers at the maximum of the absorption band: the slopes are nearly 1 (0.95 for PDCM, 0.97 for iQDCM, 0.96 for PABM, 0.94 for BQABM), and the regression coefficient Adj R-square is over 0.94 for all studied molecules.
Using the correlation coefficients from Table 6, the contribution of each type of interaction was computed for the four cycloimmonium ylids under study. The term describes the strength of the universal interactions, while the term describes the contribution of the specific interactions. Table 7a,b show the results of calculation for the contribution of these interactions to the total spectral shift recorded in the respective solvent, in , as well as in percentages.
Table 7.
(a). Contribution of universal interactions () and of the specific interactions () to the total spectral shift recorded in each solvent. The numbers correspond to the solvents from Table 1. (b). Contribution of universal interactions () and of the specific interactions () to the total spectral shift recorded in each solvent. The numbers correspond to the solvents from Table 1.
The data of Table 7a,b show that the universal orientation-induction interactions are prevalent in non-protic solvents, while the specific interactions of the type hydrogen bonds become very important in the protic solvents, even more strong than those universal.
By using the values of C1 () from Table 6 and relations (6) and (7), the excited-state dipole moment of the studied cycloimmonium ylids can be estimated (in the limits of the variational model [7,23,42]. The values of the molecular descriptors from Table 2 were used in estimating the excited dipole moment of the studied molecules.
The results of estimating the excited dipole moment of the studied molecules are listed in Table 8. The values of the molecular radius, a, of cycloimmonium ylids were computed using the values of the molecular area and volume computed by Spartan ’14.
Table 8.
Excited- and ground-state dipole moments of cycloimmonium ylids.
We mention that the estimation of the excited-state dipole moment was conducted using the values of the ground electronic state of the dipole moment and polarizability for each molecule considered in its vaporous phase (Table 2).
From the data of Table 8, it can be seen that the smallest dipole moment in the ground state corresponds to PABM, a molecule with a uni-ring heterocycle and with an asymmetrically substituted carbanion. It is smaller than the ground-state dipole moment of PDCM, a cycloimmonium ylid with the same heterocycle due to the presence of four oxygen atoms in PDCM compared with PABM containing only two oxygen atoms. Oxygen is known as an electronegative atom able to increase the electronic charge delocalization. The ground dipole moment of PABM is smaller than that of BQABM due to the structure of the heterocycle in the last ylid. It can be seen that the charge separation on the C=O bond neighboring the benzene ring is very small (see Figure 5).
From Table 8, it can be seen that the electric dipole moment of all cycloimmonium ylids under study is diminished by the visible photon absorption in accordance with the shift of this absorption band to blue when the solvent polarity increases. The largest decrease by excitation was obtained for PABM. It is possible that the carbanion asymmetry determines its sp3 hybridization and facilitates the electronic charge shift towards the heterocycle.
In Table 8, the values of the distance between the ground and the first excited level (LUMO-HOMO) expressed in are also listed, and it can be observed that the transition is realized from the ground state towards one non-occupied level situated below the LUMO.
4. Conclusions
By corroborating the computational and spectral data regarding the chosen four cycloimmonium ylids, one can observe the dipolar and polarizable characteristics of these molecules.
The two empirical scales, proposed by Kosower and by Reichardt, categorize the solvents regarding their global effects on the studied cycloimmonium ylids.
Results of the present study showed very good correspondence between the wavenumbers at the maximum of the electronic bands determined by the same mechanism (based on the electron charge transfer) both for the studied molecules and for the standard molecules used in the definition of the mono-parameter polarity scales.
The multi-parameter solvent scales can be used in determining the nature of molecular interactions and the contribution of each type of interaction to the total spectral shifts of the electronic bands.
Corroborating the theoretical results with the empirical treatment of the solvent effect on the electronic absorption bands of the spectrally active molecules, as cycloimmonium ylids, one can obtain information about the excited-state dipole moments.
The excited-state dipole moment of each studied cycloimmonium ylid is smaller than that in its ground electronic state, proving the shift of electronic charge towards the heterocycle in the visible absorption process.
Supplementary Materials
The following supporting information can be downloaded at: https://www.mdpi.com/article/10.3390/liquids4010009/s1.
Author Contributions
Conceptualization, D.O.D. and D.B.; Methodology, D.O.D.; Software, A.V. and D.B.; Validation, D.B. and D.O.D.; Formal Analysis, A.V.; Investigation, D.O.D. and A.V.; Data Curation, A.V.; Writing—Original Draft Preparation, D.O.D. and A.V.; Writing—Review & Editing, D.O.D. and D.B.; Visualization, A.V. and D.B.; Supervision, D.O.D. and D.B.; Project Administration, D.O.D. All authors have equal contribution to this study. All authors have read and agreed to the published version of the manuscript.
Funding
This research received no external funding.
Data Availability Statement
Data are contained within the article and supplementary materials.
Acknowledgments
We acknowledge the efforts of Professor Christian Reichardt in developing the experimental and theoretical studies regarding solvent effects in Organic Chemistry; for the proposal and enrichment of two solvent polarity scales, E_(T) (30) and E_TN, based on betaine dyes for about 400 simple and complex liquids; and for the great number of important applications in biology, techniques and fundamental science induced by his research. His understanding of liquid complexity and his perseverance, tenacity, devotion and modesty inspire the young generation and greatly contribute to scientific knowledge and productivity.
Conflicts of Interest
The authors declare no conflicts of interest.
References
- Johnson, A.W. Ylid Chemistry; Academic Press: New York, NY, USA, 1966. [Google Scholar]
- Zugravescu, I.; Petrovanu, M. N-ylid Chemistry; McGraw Hill: New York, NY, USA, 1976. [Google Scholar]
- Dorohoi, D.O. Electronic spectra of N-ylids. J. Mol. Struct. 2004, 704, 31–43. [Google Scholar] [CrossRef]
- Dorohoi, D.O.; Dascalu, C.F.; Teslaru, T.; Gheorghies, L.V. Electronic absorption spectra of two 3-aryl-pyridazinium-2,4,6-picryl-benzoyl-methylids. Spectrosc. Lett. 2012, 45, 383–391. [Google Scholar] [CrossRef]
- Dorohoi, D.O.; Dimitriu, D.G.; Dimitriu, M.; Closca, V. Specific interactions in N-ylid solutions, studied by nuclear magnetic resonance and electronic spectroscopy. J. Mol. Struct. 2013, 1044, 79–86. [Google Scholar] [CrossRef]
- Morosanu, A.C.; Gritco-Todirascu, A.; Creanga, D.E.; Dorohoi, D.O. Computational and solvatochromic study of pyridinium-acetyl-benzoyl-methylid (PABM). Spectrochim. Acta Mol. Biomol. Spectrosc. 2018, 189, 307–315. [Google Scholar] [CrossRef] [PubMed]
- Dorohoi, D.O.; Creanga, D.E.; Dimitriu, D.G.; Morosanu, A.C.; Gritco-Todirascu, A.; Mariciuc, G.G.; Melniciuc, N.P.; Ardelean, E.; Cheptea, C. Computational and Spectral Means for Characterizing the Intermolecular Interactions in Solutions and for Estimating Excited State Dipole Moment of Solute. Symmetry 2020, 12, 1299. [Google Scholar] [CrossRef]
- Babusca, D.; Morosanu, A.C.; Dimitriu, D.G.; Dorohoi, D.O.; Cheptea, C. Spectroscopic and quantum mechanical study of molecular interactions of iso-quinolinium ylids in polar solutions. Mol. Cryst. Liq. Cryst. 2020, 698, 87–97. [Google Scholar] [CrossRef]
- Leontie, L.; Olariu, I.; Rusu, G. On the charge transport in some new carbanion disubstituted ylides in thin films. Mater. Chem. Phys. 2003, 80, 506–511. [Google Scholar] [CrossRef]
- Leontie, L.; Roman, M.; Branza, F.; Podaru, C.; Rusu, I.G. Electrical and optical properties of some new synthetized ylids in thin films. Synth. Mat. 2009, 159, 642–648. [Google Scholar] [CrossRef]
- Pawda, A. 1,3-Dipolar Cycloaddition Reactions Chemistry; Wiley Interscience: New York, NY, USA, 1984. [Google Scholar]
- Petrovanu, M.; Zugravescu, I. Cycloaddition Reactions; Romanian Academic Publishing House: Bucuresti, Romania, 1997. [Google Scholar]
- Bejan, V.; Moldoveanu, C.; Mangalagiu, I.I. Ultrasound assisted reactions of steroid analogous of anticipated biological activities. Ultrason. Sonochem. 2009, 16, 312–315. [Google Scholar] [CrossRef] [PubMed]
- Saxena, H.O.; Faridi, U.; Kumar, J.; Luqman, S.; Darokar, M.; Shanker, K.; Chanotiya, C.S.; Gupta, M.; Negi, A.S. Synthesis of chalcone derivatives on steroidal framework and their anticancer activities. Steroids 2007, 72, 892–900. [Google Scholar] [CrossRef] [PubMed]
- Wu, Y.; Batist, G.; Zamfir, L. Identification of a novel steroid derivative, NSC12983, as a paclitaxel-like tubulin assembly promoter by 3-D virtual screening. Anti-Cancer Drug Design 2001, 16, 129. [Google Scholar] [PubMed]
- Ungureanu, M.; Mangalagiu, I.; Grosu, G.; Petrovanu, M. Antimicrobial activity of some new pyridazine derivatives. Ann. Pharm. Fr. 1997, 55, 69–72. [Google Scholar] [PubMed]
- Caprosu, M.; Butnariu, R.M.; Mangalagiu, I. Synthesis and antimicrobial activity of some new pyridazine derivatives. Heterocycles 2005, 65, 1871–1873. [Google Scholar] [CrossRef]
- Mantu, D.; Luca, M.C.; Moldoveanu, C.; Zbancioc, G.; Mangalagiu, I.I. Synthesis and Antituberculosis Activity of some new Pyridazine Derivatives. Part II. Eur. J. Med. Chem. 2010, 45, 5164–5168. [Google Scholar] [CrossRef]
- Seifi, M.; Bahonar, S.; Ebrahimipour, S.Y.; Simpson, J.; Dusek, M. Combination of pyridinium and isoquinolinium ylides with phenylisocyanate and isothiocyanates: Synthesis, characterisation, and X-ray crystal structures of mesoionic monosubstituted 3-oxo-propanamides or thioamides. Aust. J. Chem. 2015, 68, 1577–1582. [Google Scholar] [CrossRef]
- Sar, S.; Guha, S.; Prabakar, T.; Maiti, D.; Sen, S. Blue light-emitting diode-mediated in situ generation of pyridinium and isoquinolinium ylides from aryl diazoesters: Their application in the synthesis of diverse dihydroindilozine. J. Org. Chem. 2021, 86, 11736–11747. [Google Scholar] [CrossRef] [PubMed]
- Pop, V.; Dorohoi, D.; Holban, V. Molecular interactions in binary solutions of 4-amino-phthalimide and 3-p-cumyl-pyridazinium-acetyl-benzoyl-methylid. Spectrochim. Acta Part A Mol. Spectrosc. 1994, 50, 2281–2289. [Google Scholar] [CrossRef]
- Dulcescu, M.M.; Stan, C.; Dorohoi, D.O. Spectral study of intermolecular interactions in water-ethanol solutions of some carbanion disubstituted ylids. Rev. Roum. Chim. 2010, 55, 403–408. Available online: http://ucb.icf.ro/rrch/ (accessed on 15 June 2023).
- Dorohoi, D.O.; Partenie, D.H.; Morosanu, A.C. Specific and universal interactions in Benzo-[f]-Quinolinium Acetyl-Benzoyl Methylid (BQABM) solutions; excited state dipole moment of BQABM. Spectrochim. Acta Part A Mol. Biomol. Spectrosc. 2019, 213, 184–191. [Google Scholar] [CrossRef] [PubMed]
- Dulcescu-Oprea, M.M.; Morosanu, A.C.; Dimitriu, D.G.; Gritco-Todirascu, A.; Dorohoi, D.O.; Cheptea, C. Solvatochromic study of pyridinium acetyl benzoyl methylid (PABM) in ternary protic solvents. J. Mol. Struct. 2021, 1227, 129539. [Google Scholar] [CrossRef]
- Dimroth, K.; Reichardt, C.; Siepmann, T.; Bohlmann, F. Über Pyridinium-N-phenol-betaine und ihre Verwendung zur Charakterisierung der Polarität von Lösungsmitteln. Justus Liebigs Ann. Chem. 1963, 661, 1–37. [Google Scholar] [CrossRef]
- Reichardt, C. Pyridinium-N-phenolate betaine dyes as empirical indicators of solvent polarity: Some new findings. Pure Appl. Chem. 2008, 80, 1415–1432. [Google Scholar] [CrossRef]
- Reichardt, C. Solvents and Solvent Effects in Organic Chemistry, 3rd ed.; Wiley-VCH: Weinheim, Germany, 2003. [Google Scholar]
- McRae, E.G. Theory of solvent influence on the molecular electronic spectra. Frequency shifts. J. Phys. Chem. 1957, 61, 562–572. [Google Scholar] [CrossRef]
- Bakhshiev, N.G. Spectroscopy of Intermolecular Interactions; Nauka: Leningrad, Russian Federation, 1972. (In Russian) [Google Scholar]
- Abe, T. Theory of solvent influence on the molecular electronic spectra. Frequency shifts. Bull. Chem. Soc. Jpn. 1965, 38, 1314–1318. [Google Scholar] [CrossRef]
- Kamlet, M.J.; Abboud, J.I.; Abraham, M.; Taft, R.W. Linear solvation energy relationships 23. A comprehensive collection of the solvatochromic parameters π^*,α,β and some methods for simplifying the generalized solvatochromic equation. J. Org. Chem. 1983, 48, 2877–2887. [Google Scholar] [CrossRef]
- Catalán, J.; Hopf, H. Empirical Treatment of the Inductive and Dispersive Components of Solute−Solvent Interactions: The Solvent Polarizability (SP) Scale. Eur. J. Org. Chem. 2004, 2004, 4694–4702. [Google Scholar] [CrossRef]
- Brooker, L.G.S.; Keyes, G.H.; Heseltine, D.W. Color and Constitution. X.1 Absorption of the Merocyanines. J. Am. Chem. Soc. 1951, 73, 5332–5350. [Google Scholar] [CrossRef]
- Kosower, E.M. The Effect of Solvent on Spectra. II. Correlation of Spectral Absorption Data with Z-Values. J. Am. Chem. Soc. 1958, 80, 3261–3267. [Google Scholar] [CrossRef]
- Streitwieser, A.; Heathcoch, C.H.; Kosower, E.M. Introduction to Organic Chemistry, 4th ed.; Maxwell MacMillan International: New York, NY, USA, 1992; pp. p. 678 and essay 4 after p. 621. [Google Scholar]
- Griffiths, T.R.; Puch, D.C. Solvent polarity studies. Part I. NewZ values and relationships with other solvent polarity scales. J. Solut. Chem. 1979, 8, 247–258. [Google Scholar] [CrossRef]
- Sıdır, I.; Sıdır, Y.G. Investigation on the interactions of E -4-methoxycinnamic acid with solvent: Solvatochromism, electric dipole moment and pH effect. J. Mol. Liq. 2017, 249, 1161–1171. [Google Scholar] [CrossRef]
- Kawski, A. On the Estimation of Excited-State Dipole Moments from Solvatochromic Shifts of Absorption and Fluorescence Spectra. Z. Nat. A 2002, 57, 255–262. [Google Scholar] [CrossRef]
- Kawski, A.; Bojarski, P. Comments on the determination of excited state dipole moment of molecules using the method of solvatochromism. Spectrochim. Acta Part A Mol. Biomol. Spectrosc. 2011, 82, 527–528. [Google Scholar] [CrossRef] [PubMed]
- Gahlaut, R.; Tewari, N.; Bridhkoti, J.P.; Joshi, N.K.; Joshi, H.C.; Pant, S. Determination of ground and excited states dipole moments of some naphthols using solvatochromic shift method. J. Mol. Liq. 2011, 163, 141–146. [Google Scholar] [CrossRef]
- Zakerhamidi, M.S.; Moghadam, M.; Ghanadzadeh, A.; Hosseini, S. Anisotropic and isotropic solvent effects on the dipole moment and photophysical properties of rhodamine dyes. J. Lumin. 2012, 132, 931–937. [Google Scholar] [CrossRef]
- Dorohoi, D.O. Excited state molecular parameters determined by spectral means. Ukr. J. Phys. 2018, 63, 701–707. [Google Scholar] [CrossRef]
- Available online: https://www.stenutz.eu./chem.solv26.php (accessed on 22 June 2023).
- Spartan’14 for Windows, Macintosh and Linux. In Tutorial and User’s Guide; Wavefunction Inc.: Irvine, CA, USA, 2010.
- Young, D. Computational Chemistry; Wiley Interscience: Sebastopol, CA, USA, 2001. [Google Scholar]
- Lin, C.Y.; George, M.W.; Gill, P.M.W. E.D.F.2: A density functional for predicting molecular vibrational frequencies. Aust. J. Chem. 2004, 57, 365–370. [Google Scholar] [CrossRef]
- Koopmans, T. Über die Zuordnung von Wellenfunktionen und Eigenwerten zu den einzelnen elektronen eines Atom. Physica 1934, 1, 104–113. [Google Scholar] [CrossRef]


Disclaimer/Publisher’s Note: The statements, opinions and data contained in all publications are solely those of the individual author(s) and contributor(s) and not of MDPI and/or the editor(s). MDPI and/or the editor(s) disclaim responsibility for any injury to people or property resulting from any ideas, methods, instructions or products referred to in the content. |
© 2024 by the authors. Licensee MDPI, Basel, Switzerland. This article is an open access article distributed under the terms and conditions of the Creative Commons Attribution (CC BY) license (https://creativecommons.org/licenses/by/4.0/).