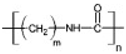
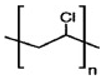
3.1. Molecular Interaction Between Polyamide and LasB (PDB ID: 1EZM)
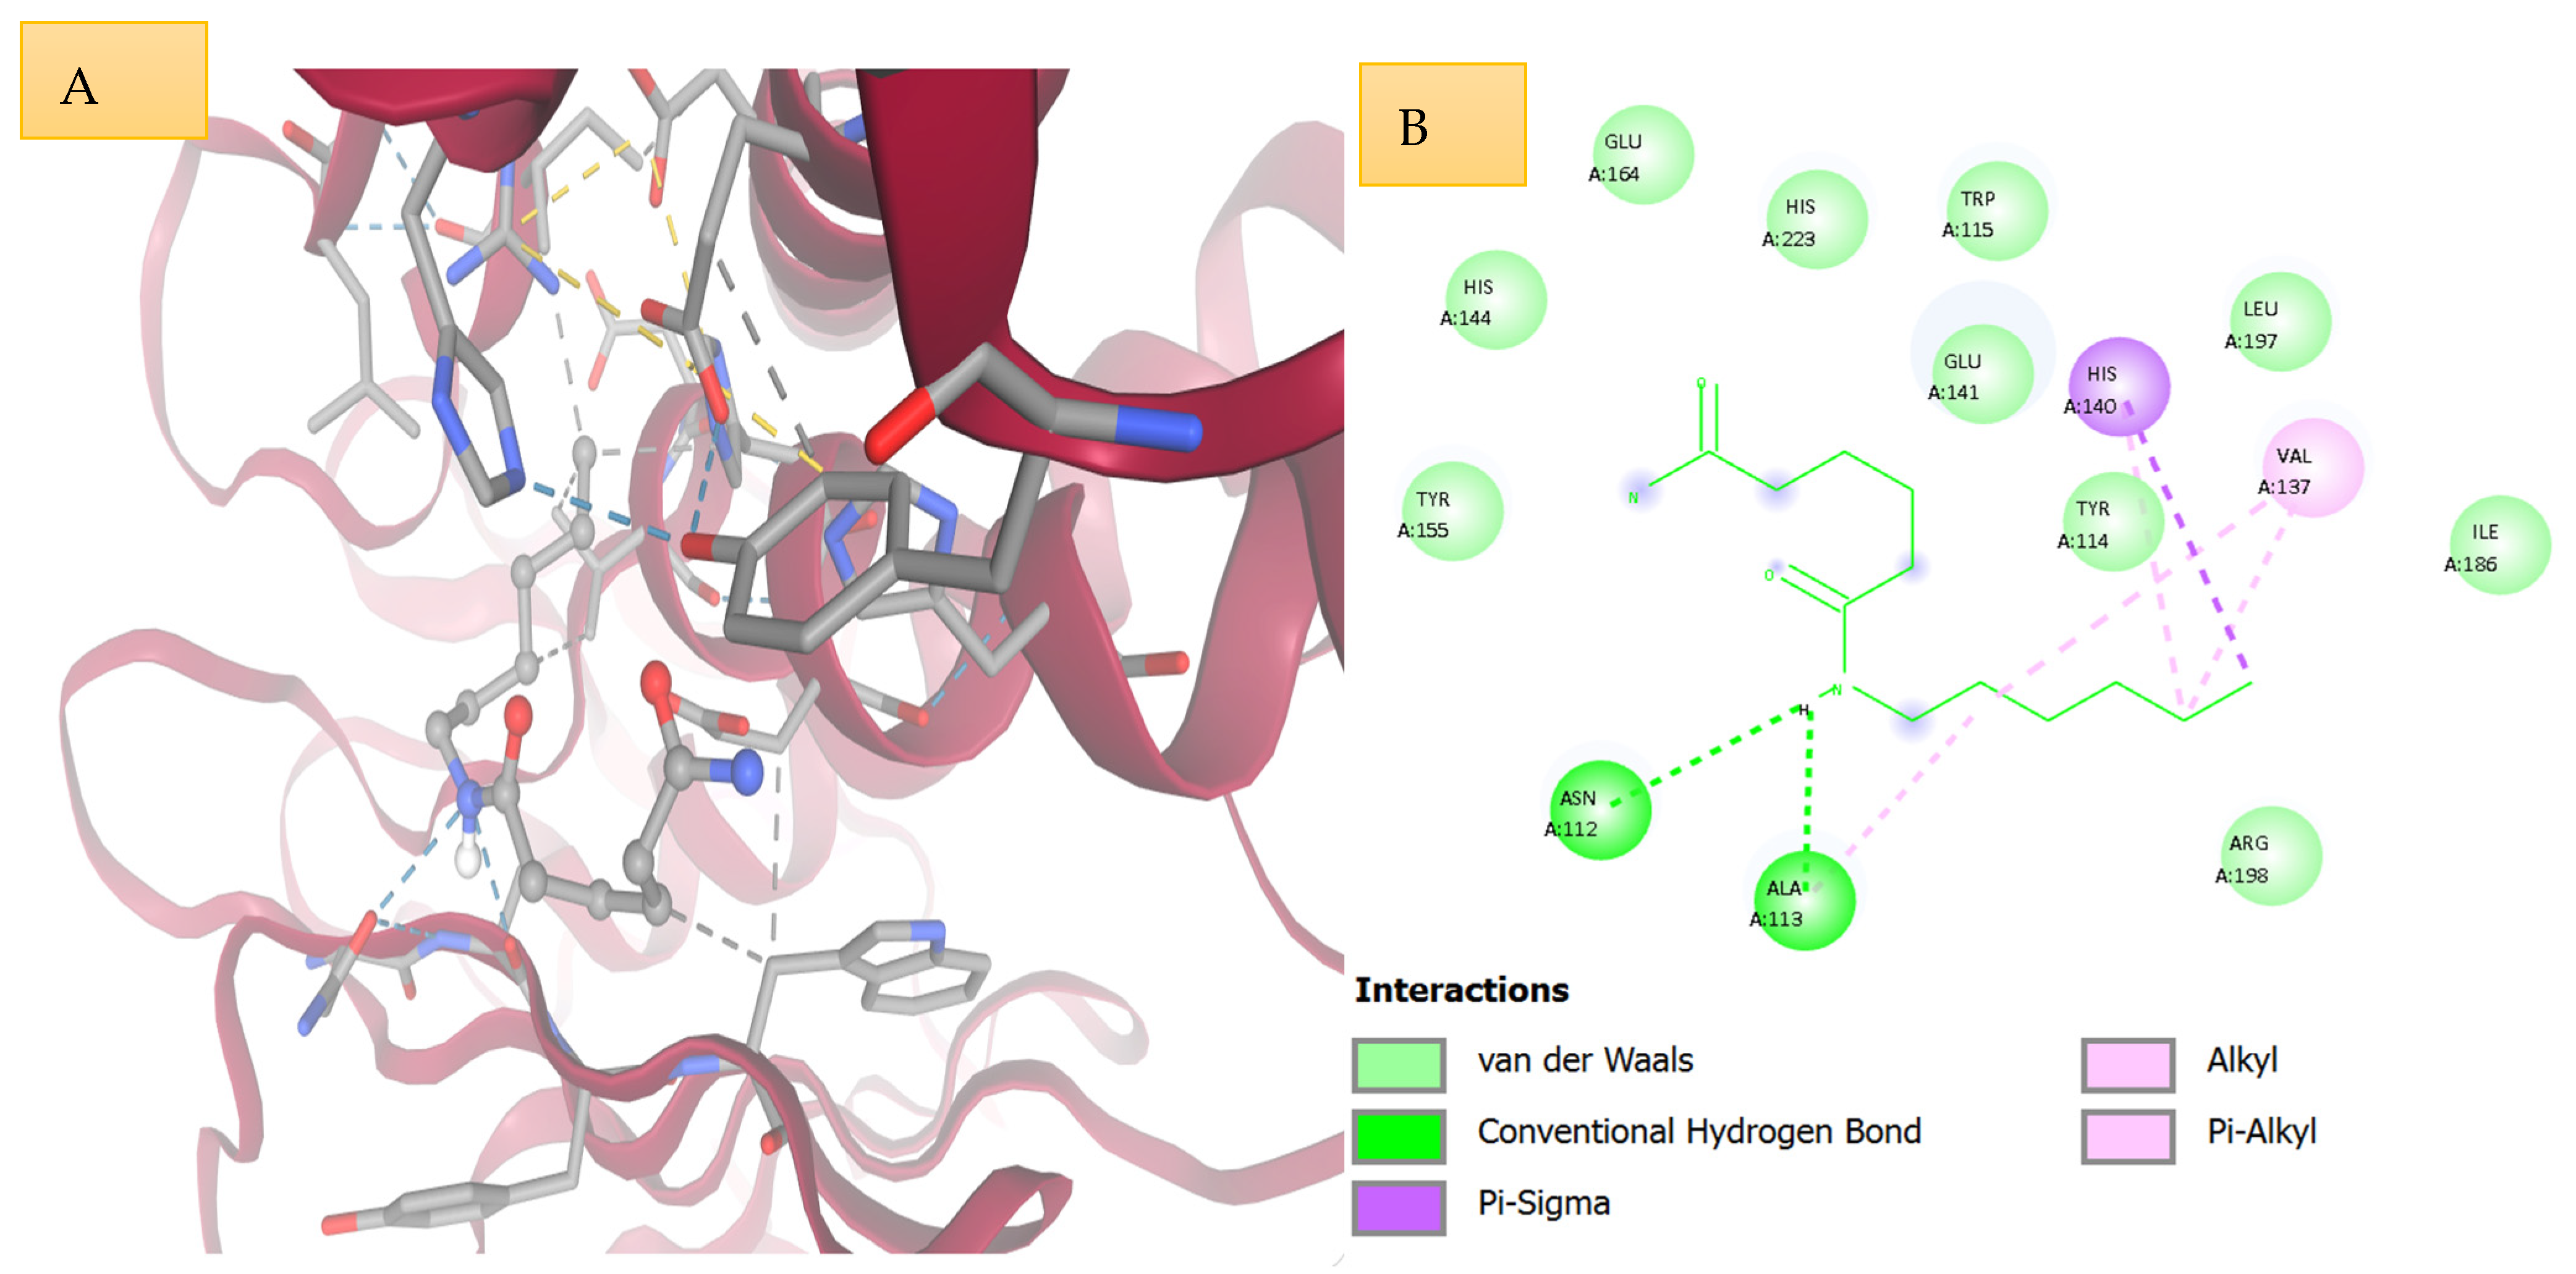
As shown in
Figure 1, the polyamide (PA) fragment bound within the catalytic cleft of
Pseudomonas aeruginosa elastase (LasB) with a binding affinity of −5.277 kcal/mol, indicating moderate active-site compatibility. The docked pose adopted an extended orientation along the substrate-recognition groove, allowing the ligand to engage both polar and hydrophobic residues within the binding channel.
The interaction analysis revealed that Asn112 established a traditional hydrogen bond, which was probably responsible in ligand anchoring, and that Val137 and Leu132 established alkyl/π and alkyl/alkyl hydrophobic contacts. The complex was further stabilized by a π–sigma interaction with His140 and other van der Waals interactions between Glu141, Tyr155, His144, Ile186, Arg198, Met120 and Trp115.
In general, a balanced interaction profile with one directional hydrogen bond and multiple hydrophobic and van der Waals contacts favors the moderate accommodation of PA in the LasB catalytic pocket.
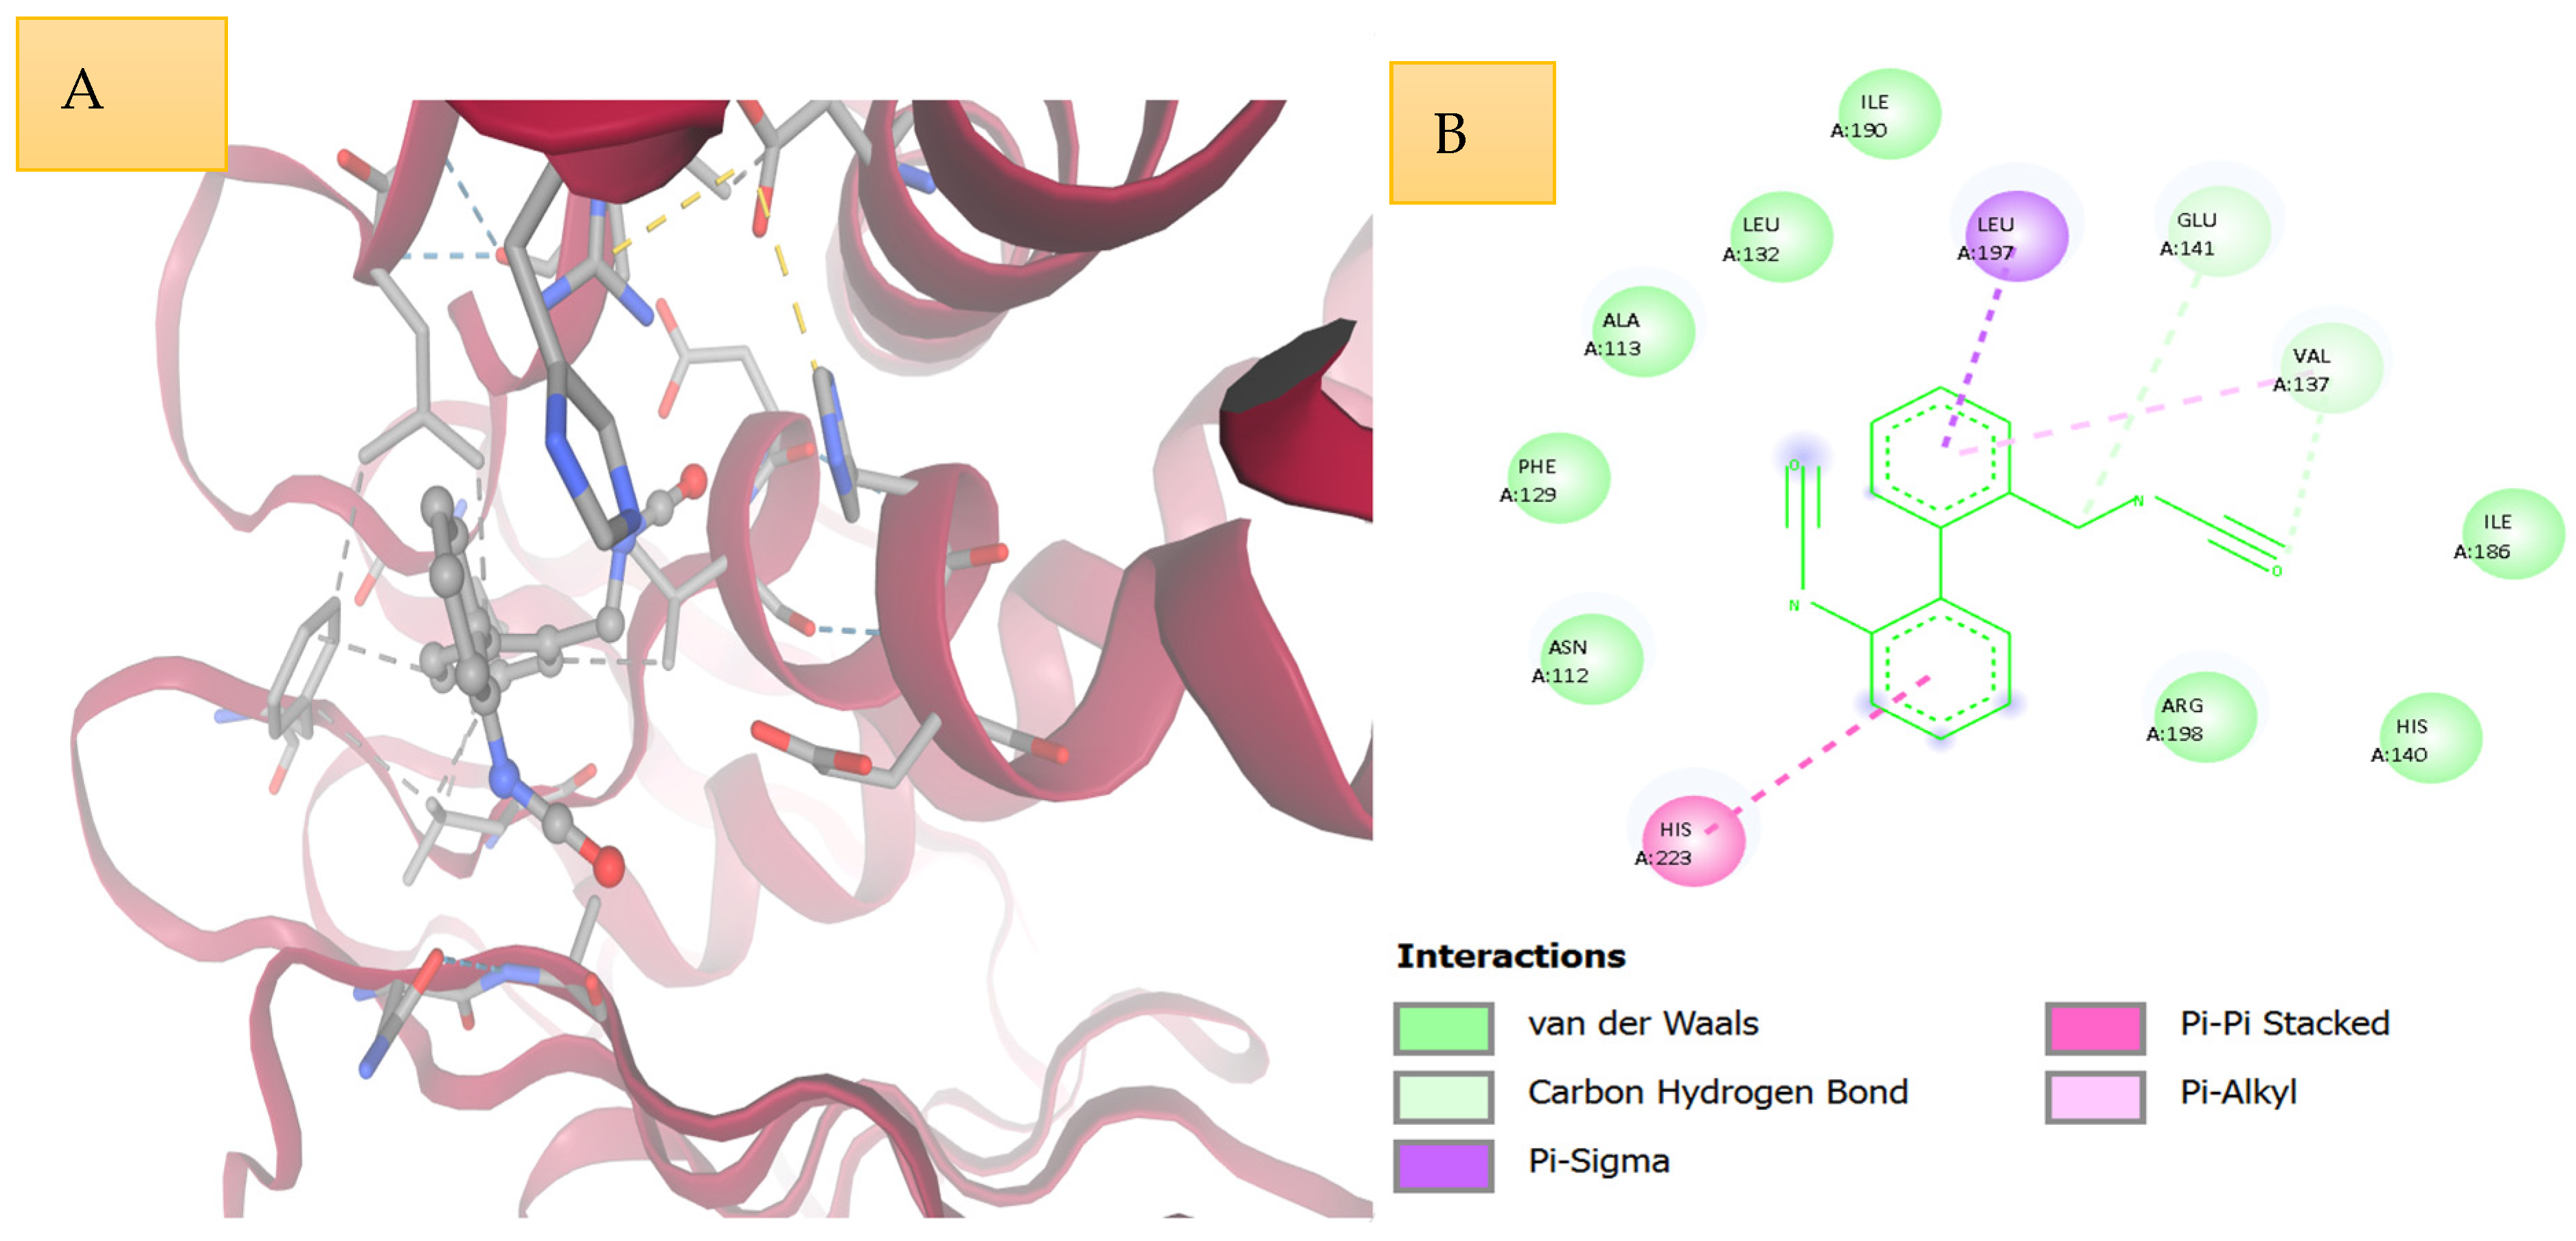
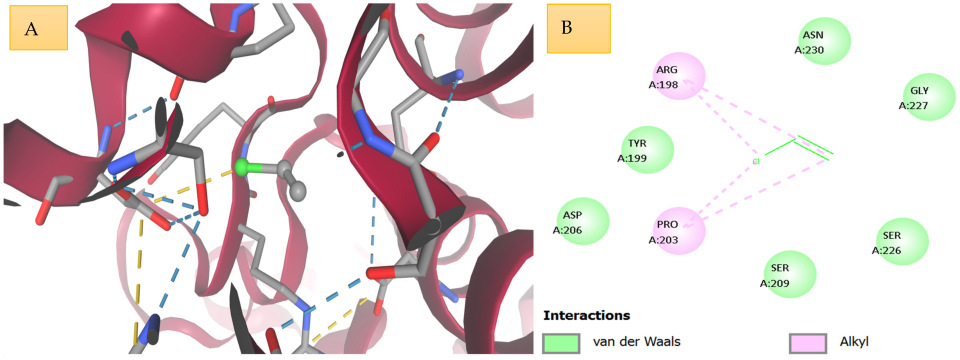
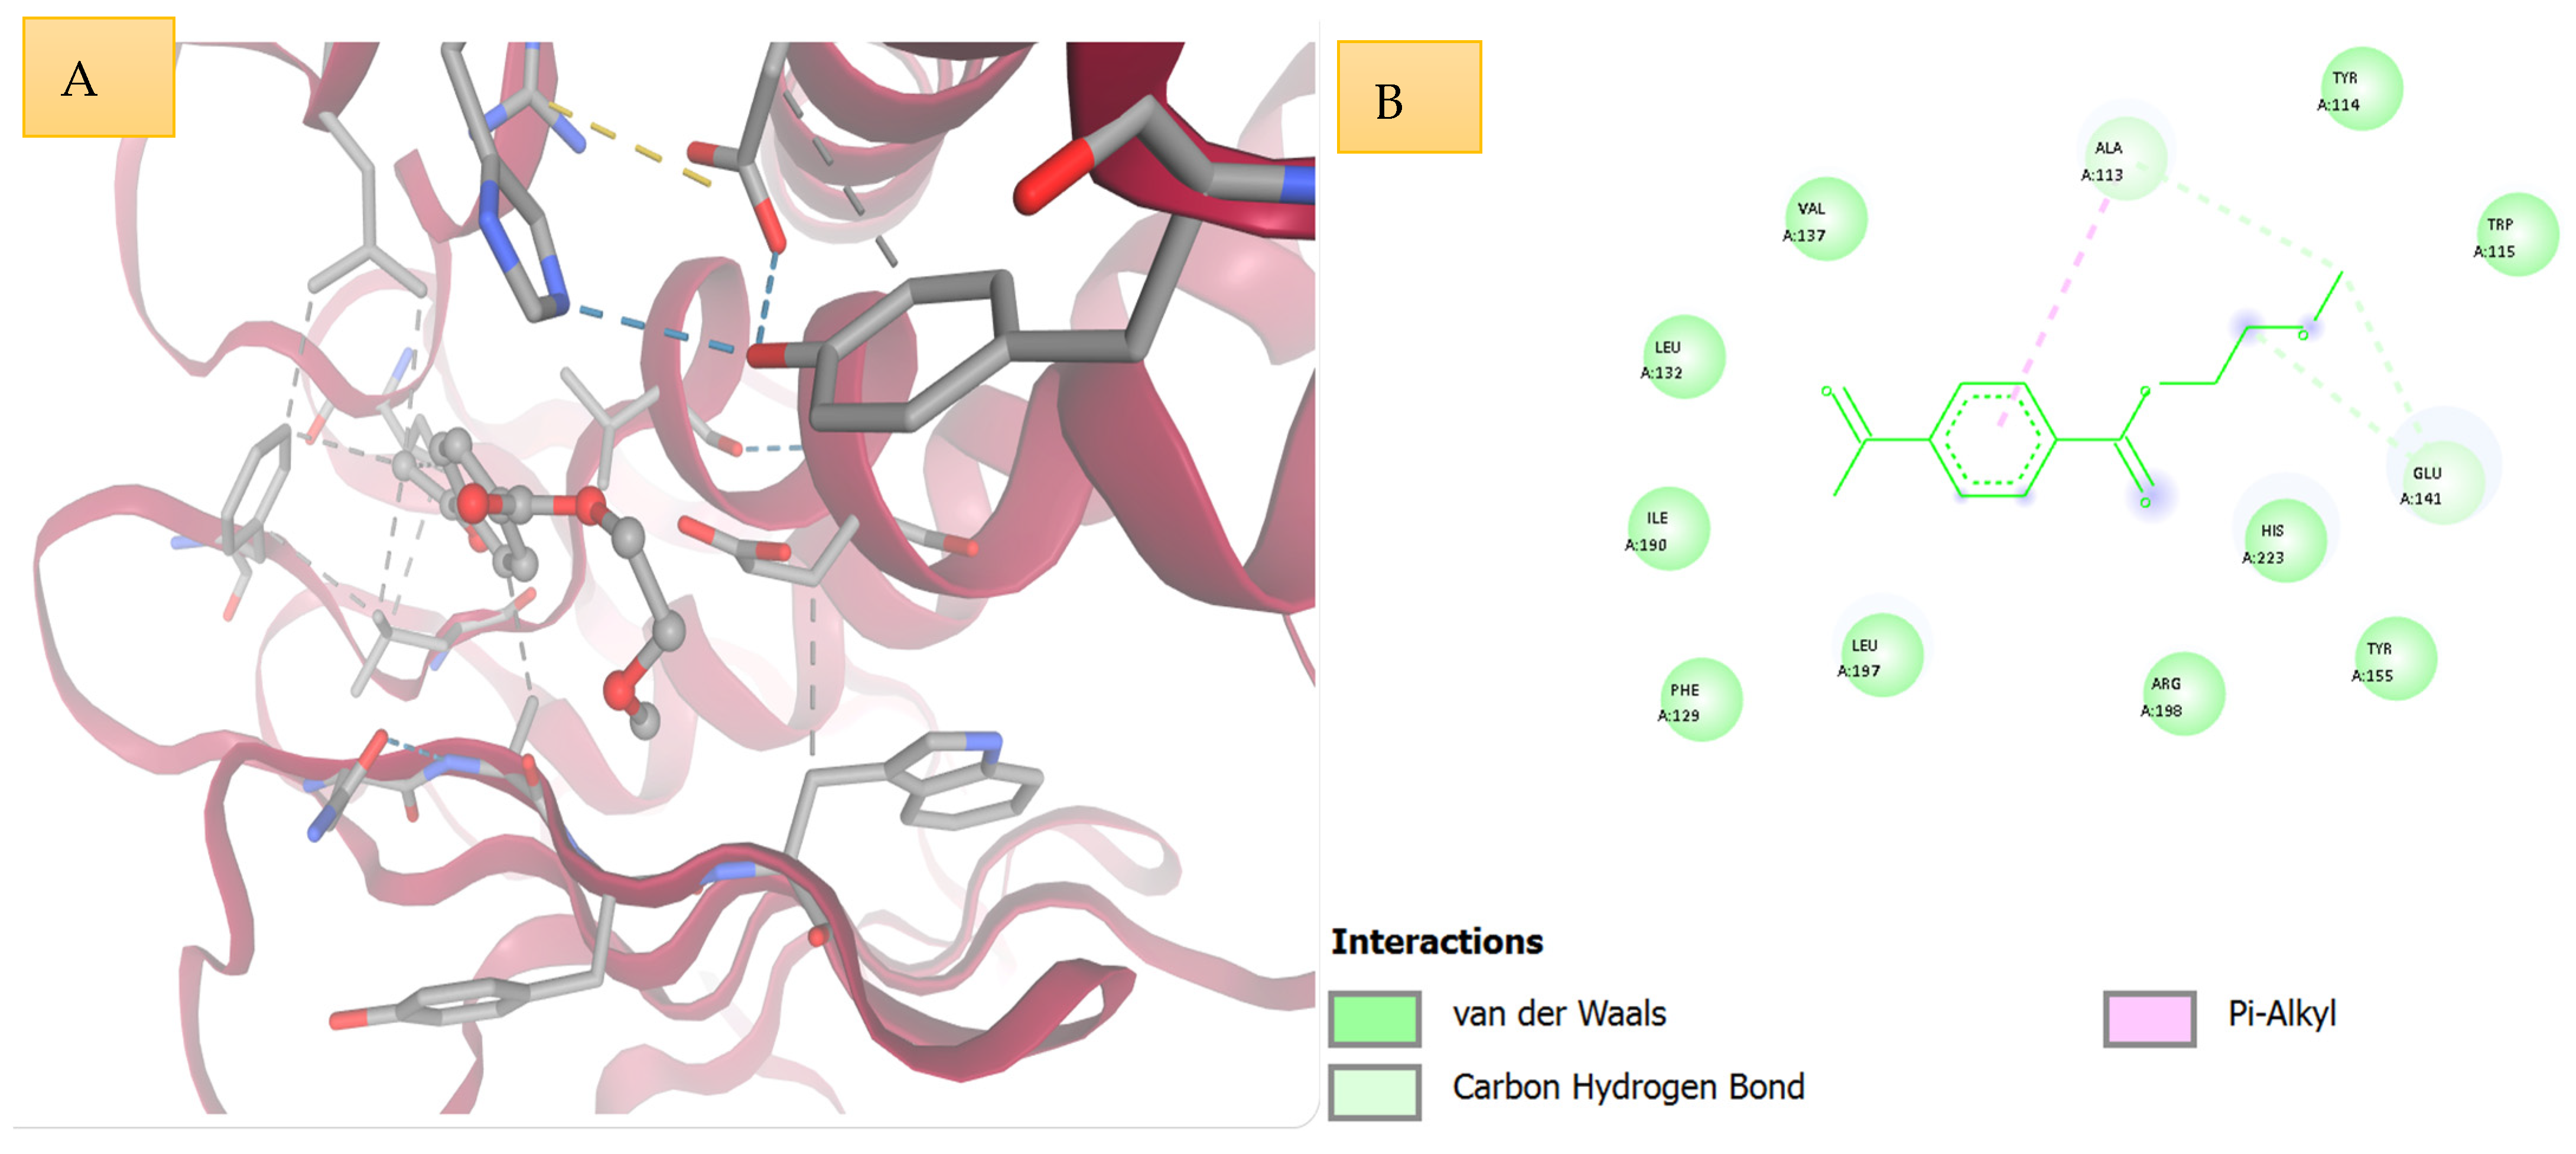
3.5. Molecular Interaction Analysis of Polymethyl Methacrylate (PMMA) with LasB
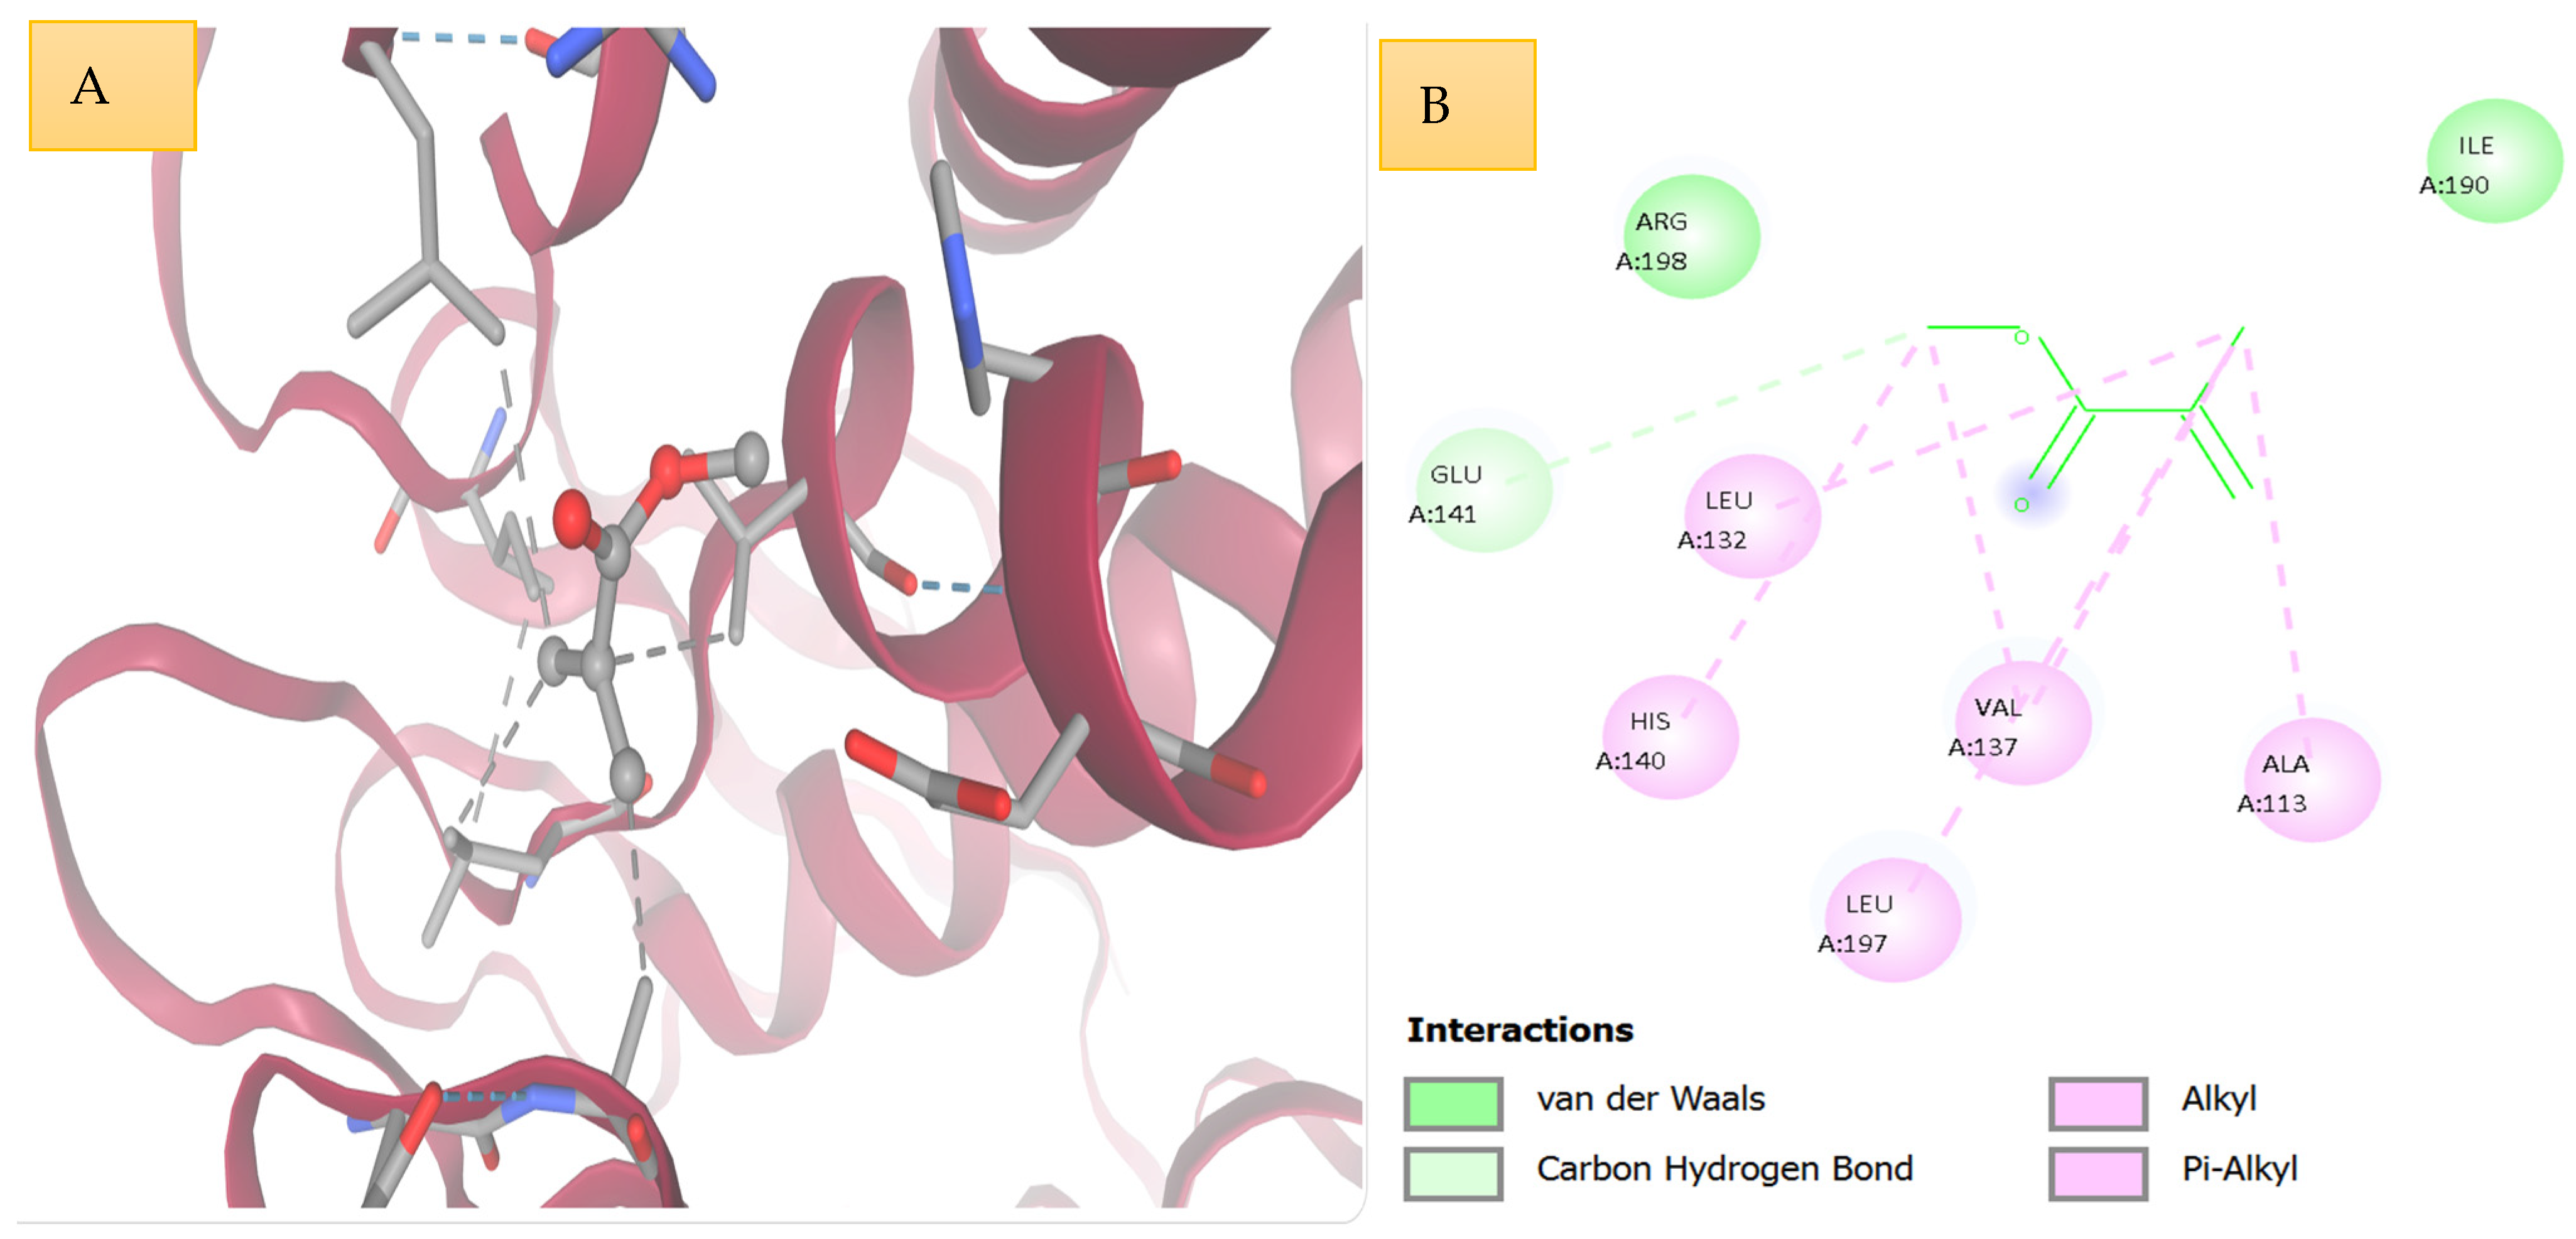
PMMA had a binding affinity of −3.051 kcal/mol (
Figure 5), which is relatively weak, between PVC and PA, PET, PC, and PUR. The docked ligand was not deeply bound to the binding cleft, but rather not deeply bound to the cata-lytic cavity.
Hydrophobic contacts were common especially on Leu132, Val137, Leu197, His140 and Ala113, with van der Waals interaction observed at Arg198, Ile190 and Glu141. There were no strong conventional hydrogen bonds observed.
The reason behind this is that the lower rank of the ligands is explained by this predominantly non-polar interaction pattern, which causes the lower affinity of PMMA compared to the other higher-ranking ligands. Nevertheless, the detected connections show that PMMA-derived fragments may be momentarily attached to the LasB binding groove by hydrophobic complementarity.
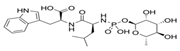
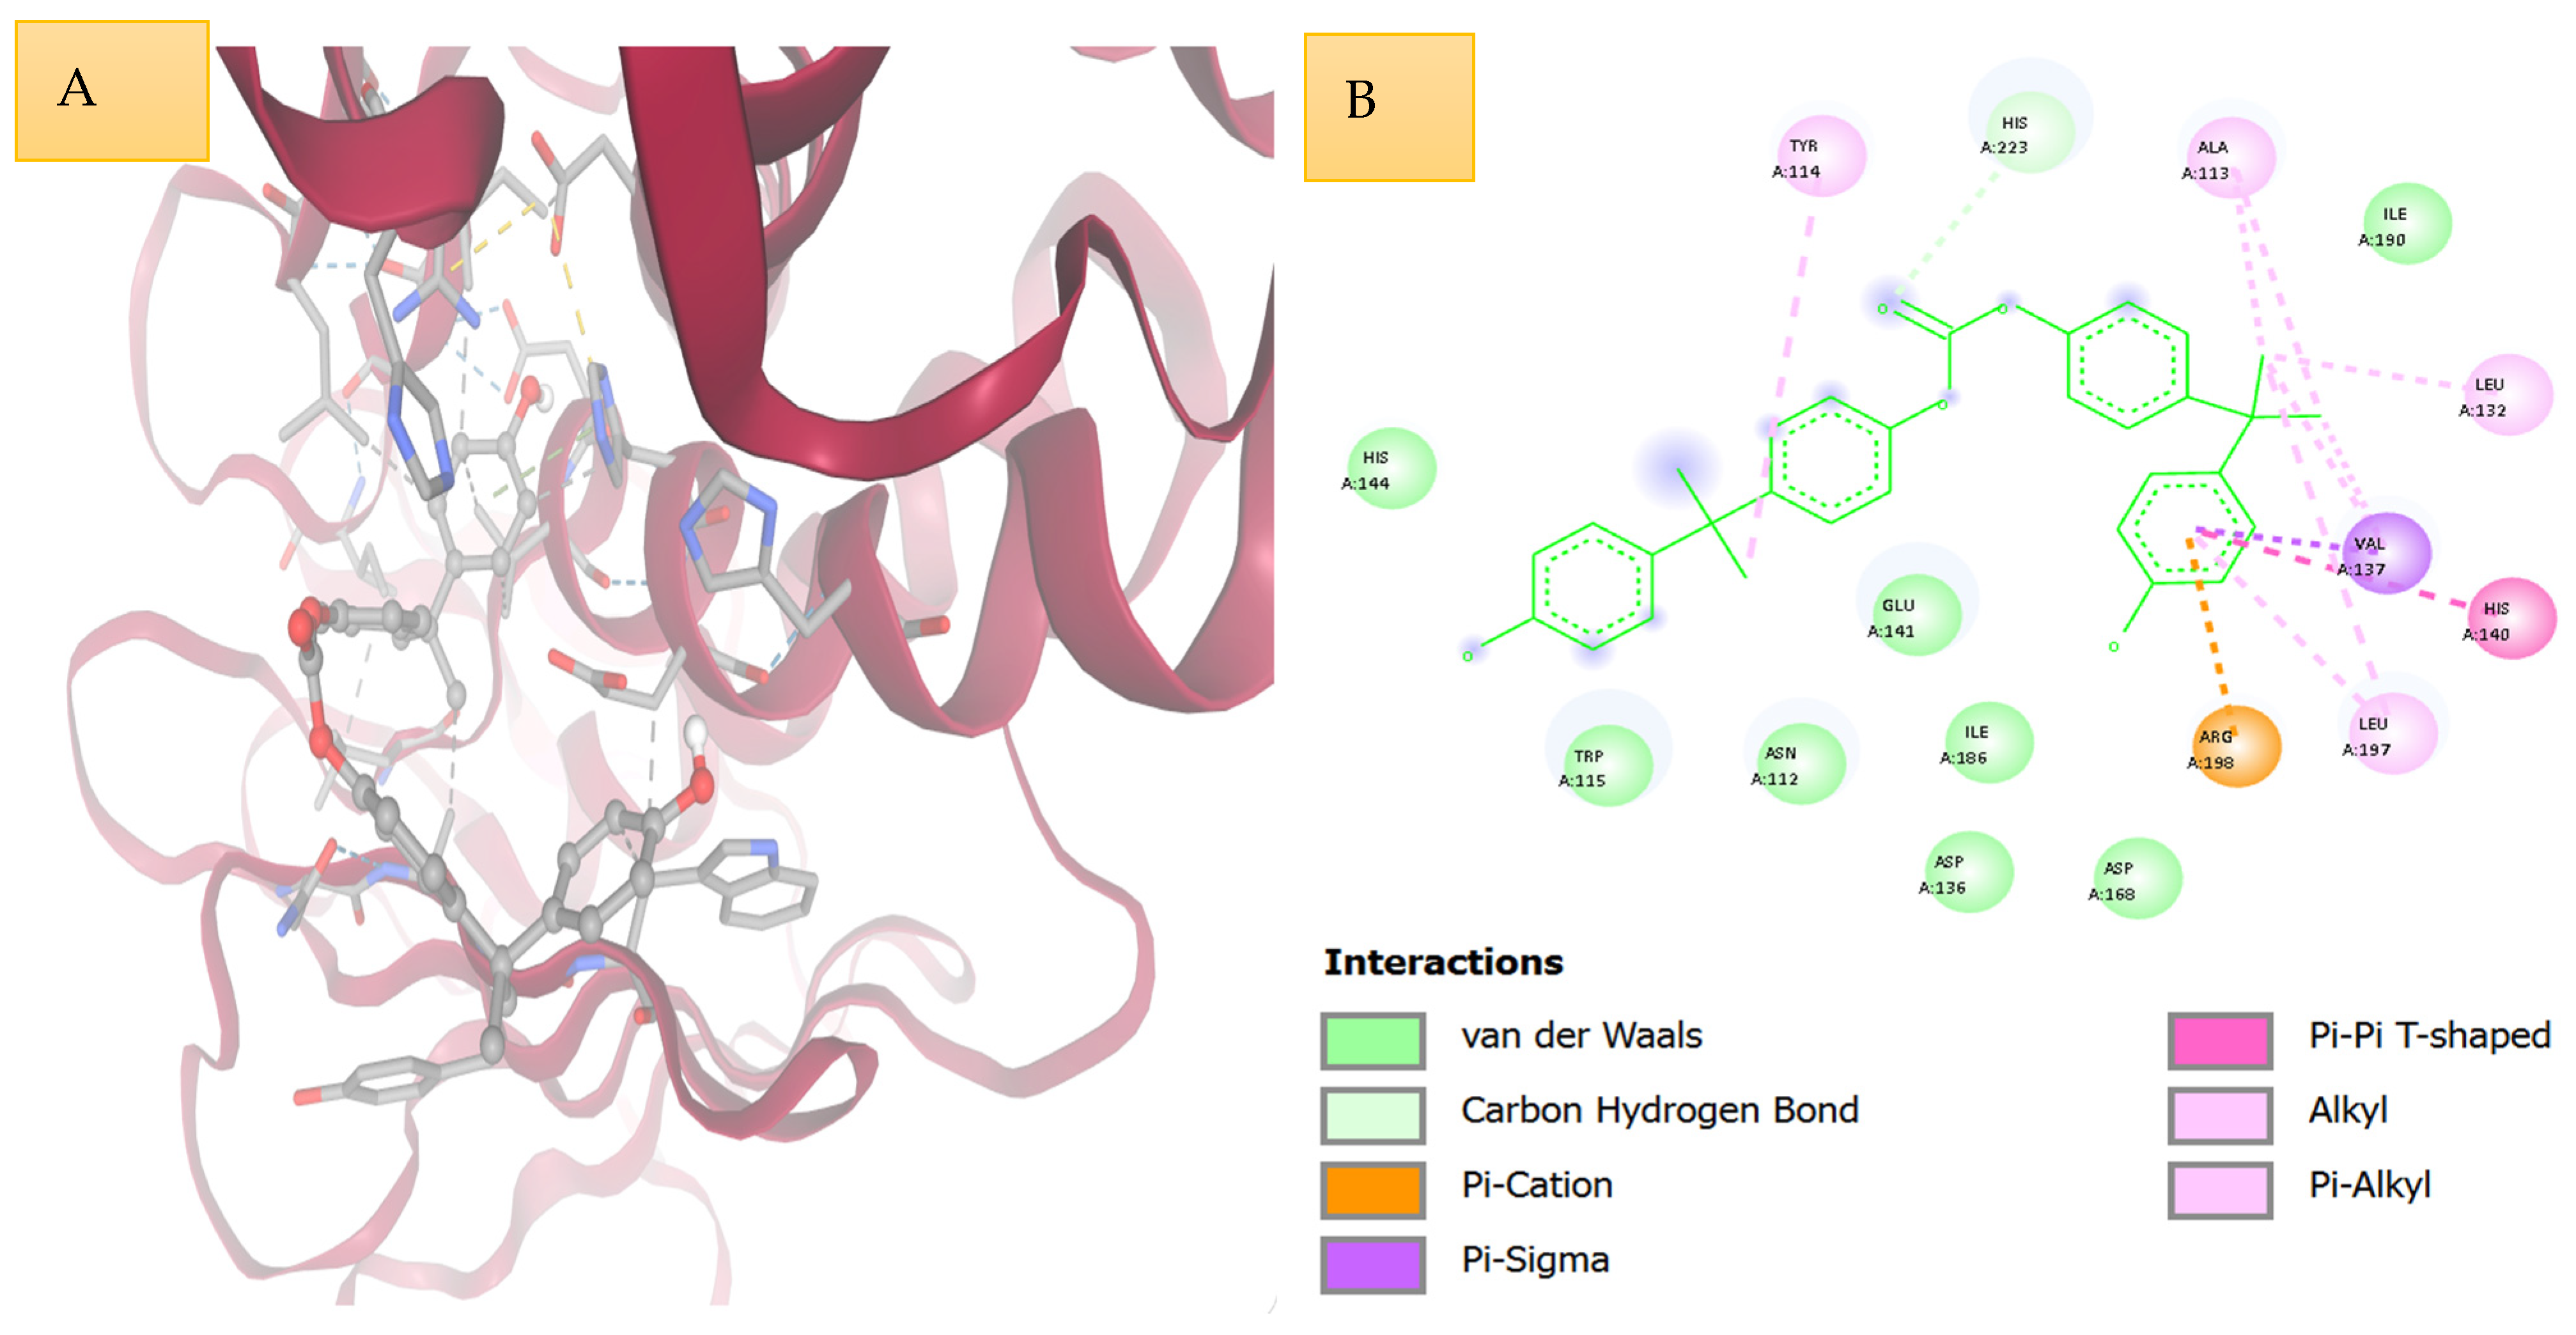
3.7. Molecular Docking Analysis of Pseudomonas aeruginosa Elastase (LasB) Interacting with Positive Control (Phosphoramidon)
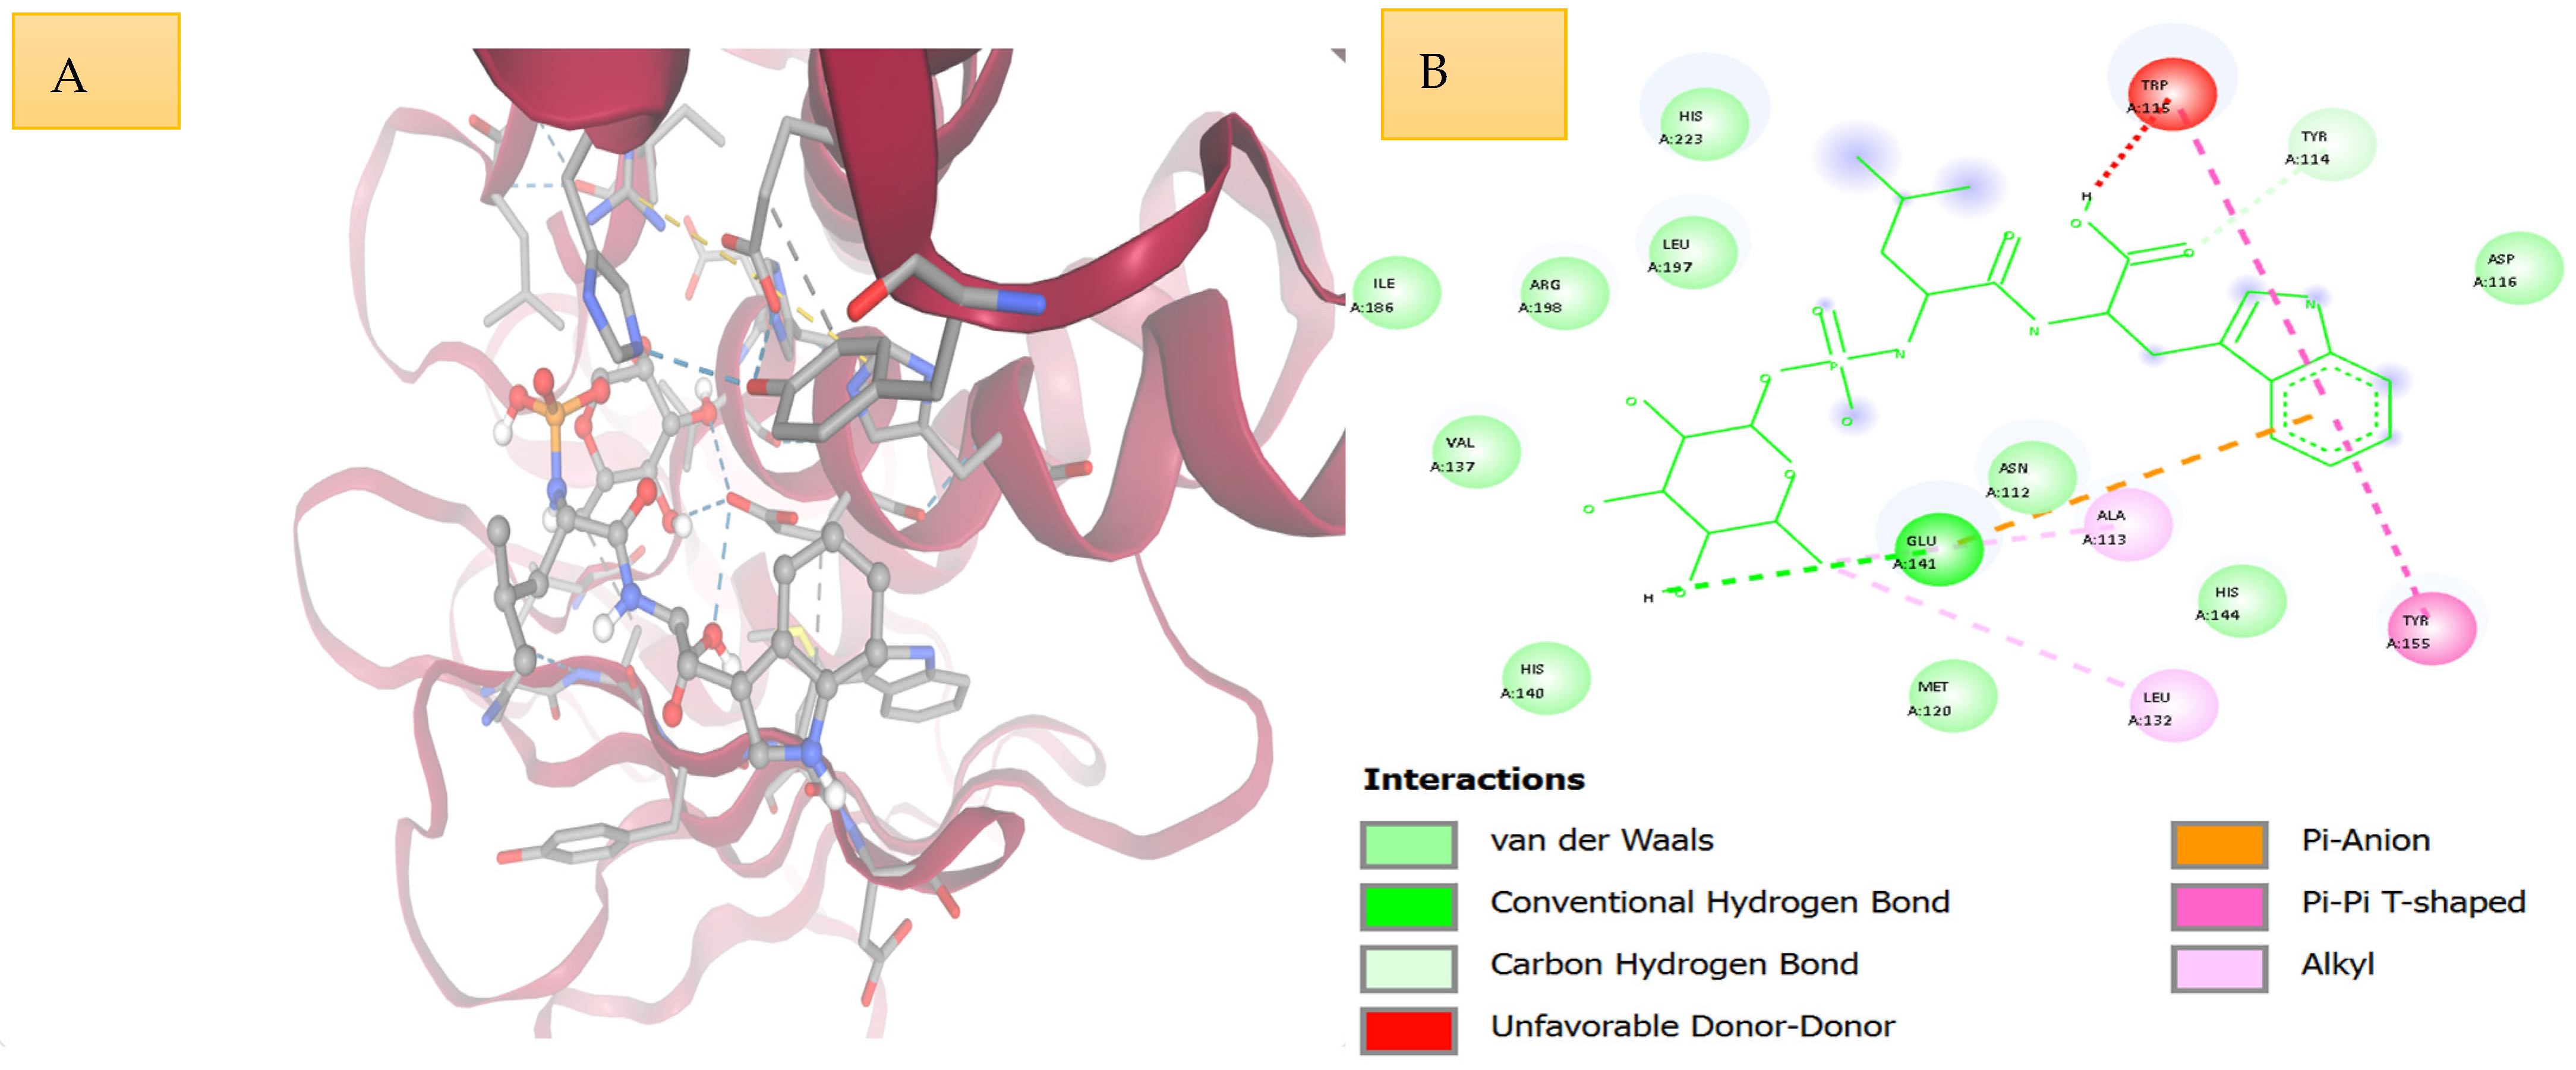
Phosphoramidon, used as the positive control, displayed a binding affinity of −5.498 kcal/mol and occupied the catalytic site in close proximity to the catalytic Zn
2+ ion (
Figure 7). Its phosphoramidate group was oriented toward the metalloprotease active center in a manner consistent with its known inhibitory behavior.
The ligand formed a conventional hydrogen bond with Glu141, along with extensive van der Waals contacts involving Ile186, Leu197, Arg198, Val137, His223, Asn112, Met120, His140, Asp116, Tyr114, His144, and Trp115. Additional stabilization was provided by a π–π T-shaped interaction with Trp115, a π–anion interaction, and hydrophobic contacts with Ala113 and Leu132. Although an unfavorable donor–donor interaction was also observed, it did not appear to destabilize the overall binding mode.
Overall, phosphoramidon showed the broadest and most catalytically relevant interaction network, supporting its use as a suitable reference ligand for comparison with the polymer-derived fragments.
A comparative summary of docking affinities, key interacting residues, and dominant interaction types for all polymer-derived ligands and the positive control is presented in
Table 2.
3.8. Interaction Simulation Between Elastase (LasB) and Polyamide (PA)
The structural stability and interaction behavior of Pseudomonas aeruginosa elastase (LasB) in the presence of polyamide (PA) were inferred by conducting a simulation trajectory of about 50 ns using a comprehensive analysis of molecular dynamics simulation. Several structural and interaction parameters were assessed, such as hydrogen bond dynamics, root mean square deviation (RMSD), root mean square fluctuation (RMSF), radius of gyration (Rg), molecular surface area (MSA), polar surface area (PSA), solvent accessible surface area (SASA) and radial distribution function (RDF). All these analyses form a picture of the conformational stability, interaction processes, and spatial arrangement of the LasB-PA complex.
3.8.1. Hydrogen Bond Interaction Profile
The analysis of the interaction with hydrogen bonds shows that in the PA interaction with LasB, the interaction does not concern the presence of the hydrogen bond net but rather the ad hoc formation of hydrogen bonds throughout the simulation trajectory. The hydrogen bond count varied at the initial phases of the simulation (around 10–1 ns) from 0 to 2, which also shows that there are polar interactions in the initial accommodation of PA into the protein environment. After this first stage of adaptation, the rate of formation of the hydrogen bonds was significantly slower and most time intervals were enormous. forming zero hydrogen bonds, separated by single hydrogen bond interactions at around 26–27 ns and at around 49 ns.
This trend highlights that despite the fact that hydrogen bonding actually contribute to the stabilizing of the ligand, the overall binding of PA with LasB is dominated by non-polar interactions, van der Waals contacts, and structural complementarity as opposed to long-range hydrogen bond networks. These interactions are also transient and indicate that PA can take various conformational orientations in the protein environment, which are capable of rotating dynamically without breaking the overall association with the enzyme.
3.8.2. Structural Stability Assessed by RMSD
Root mean square deviation (RMSD) is an important analysis which gives information about the stability of LasB-PA complex in the simulation. After a sharp rise in the early simplified structure at the start of the trajectory, the values of RMSD leveled to be mostly in the range of 0.816 to 1.80. These low RMSD values show that the system experiences only slight conformational variations of the starting structure, which shows a stable interaction environment.
RMSD variations were also somewhat higher during the initial 20–25 ns, which is probably due to the equilibration and positional adjustment of PA on the enzyme surface or binding pocket. Following this step, especially between 30 and 43 ns, the RMSD trend took a comparatively stationary plateau at 1.30–1.50 AA, signifying that the complex had achieved a dynamic equilibrium position.
There was a slight decrease in RMSD at around 43–46 ns, after which a slight rise was observed towards the end of the simulation, close to about 1.6–1.7 A. Notably, the changes did not go beyond the scope of a small range, however, showing that there was no significant conformational rearrangements or dissociation events during the simulation. On the whole, the RMSD profile shows that LasB-PA complex does not appear to lose its structural integrity and dynamic stability during the simulation period.
3.8.3. Residue Flexibility Analysis (RMSF)
The protein structure was assessed in terms of the flexibility at the residue level with the assistance of the root mean square fluctuation (RMSF) in the interaction with PA. The RMSF of the majority of residues fell between approximately 2.6 to 5.2 Å, an average range of surface residues and loop regions.
It was found that the residue indices of the central residues (circa 35) had the least fluctuations suggesting that a rigid structural core exists in this location. Such rigids tend to be typical of the stable secondary structural elements that maintain the overall conformation of the protein.
Conversely, the terminal residue showed an increment in the flexibility radical and the RMSF values were about 18A. The broad scope is most probably indicative of a terminal loop/flexible tail region, which is more likely to be mobile as there are no stabilizing tertiary contacts. It is worth emphasizing that this local flexibility does not suggest any instability of the world, but is an indication of dynamism of the terminal or solvent-exposed segments in nature.
3.8.4. Radius of Gyration (Rg) and Structural Compactness
The analysis of the compactness of the protein–polymer complex during the simulation was done via radius of gyration (Rg) analysis. The Rg values were between 3.0 and 3.7 Å, and this meant that the structural packing of the system was not extremely unstable.
It was observed that the short transient values decreased to approximately 2.8–2.9 Å at approximately 20 ns as well as at approximately 47 ns, indicating temporary increase in structural compactness. Such fluctuations are probably due to small-scale conformational changes in the protein structure, as opposed to large-scale folding or unfolding.
Interestingly, the lack of accumulating trends in terms of Rg values proves that the LasB structure did not experience progressive expansion and destabilization through the simulation. Rather, the protein assumed a favorable balance between tight forms of structural packing and the required conformational flexibility, which facilitated the stability of the LasB-PA complex.
3.8.5. Molecular Surface Area Dynamics
The molecular surface area (MSA) of the complex was found to be between 233 and 220 Å2 for most of the simulation. Nevertheless, sharp transient declines were found at the period between 13 and 21 ns, where the surface area reduced to about 194,205 Å2.
This temporary loss in surface area can be attributed to the localized re-arrangements of structure, perhaps by the partial burial of PA in a groove on the surface or the conformational change of adjacent residues. Following this step, the MSA slowly returned to larger values and stabilized around 228,233 Å2, which showed that the system gained a stable structural configuration.
Towards the end of the path, the MSA values were slightly decreased again, but the differences were not large and did not reflect any significant structural changes.
3.8.6. Polar Surface Area (PSA)
The structural stability of the complex is also supported by the polar surface area (PSA) analysis. PSA values were mostly in the 170–175 Å2 range, but fell periodically to 162–166 Å2 at 14 ns and 20–21 ns.
It is possible that these temporary decreases are confined to localized solvent-exposure of polar groups encountered by the burial of polar residues, or by contact with the polyamide polymer. That the values of PSA rapidly restored to baseline levels suggests that these structural changes were temporary and did not change the overall polarity distribution of the protein surface.
3.8.7. Solvent Accessible Surface Area (SASA)
The solvent accessible surface area (SASA) profile showed the dynamic behavior of the solvent exposure during the simulation. The values of SASA were mostly within the range of 110 and 160 Å2, indicating moderate protein solvent exposure.
There were two significant cuts in SASA. The former was at approximately 58 ns, at which SASA went down to approximately 60–90 Å2, indicating that there was partial burying of the polymer or other residues in the protein surface. There was a second reduction at about 26–28 ns, when SASA once again decreased to about 70–110 Å2.
After these events, SASA stabilized at 145–160 Å2 between 30 and 45 ns, meaning that the complex had reached a stable state with an intermediate exposure to the solvent. The ultimate decrease in the end of the simulation might have been a sign of slight reorganization of PA within the protein environment.
3.8.8. Radial Distribution Function (RDF) Analysis
The radial distribution function (RDF) analysis is capable of giving the data on the spatial structure of atoms in the LasB-PA interaction. The RDF profile showed a primary, sharp peak at a very short distance (1.1 Å), which suggests that the probability of close atomic contacts at short distances is high.
It was observed that there were secondary peaks that fell between about 1.4 and 2.8 Å, which represent the additional coordination shells and layers of short-range interactions around the interacting atoms. Thereafter, the RDF intensity slowly reduced below 3–4 Å, returning nearly to baseline with an increase in distance.
There was a gradual increase in the cumulative coordination number with distance and a tendency towards a limiting value of about 16 atoms surrounding the atom at an approximate distance of 910 Å. This indicates that PA engages with a group of adjacent residues and not with a solitary point of contact to create a multi-contact interaction setting in the protein fold.
3.8.9. Overall Interaction Mechanism
All the data collected during the simulation suggests that the LasB-PA complex continues to have a stable dynamic interaction over the course of the 50 ns simulation. Low values of RMSD, stable Rg behavior, and a moderate level of residue flexibility support structural stability. The interaction mechanism also seems to be based mainly on short-range contacts, hydrophobic interactions and complementarity of surfaces, as opposed to persistent hydrogen bonding.
Temporary variation in surface parameters and solvent exposure shows that PA reduces and increases its position somewhat to enable the system to attain the equilibrium state. The RDF analysis also confirms that PA forms several short-range contacts with the surrounding residues, which form a spatially coordinated interaction environment.
In general, these findings indicate that polyamide is able to bind to elastase (LasB) in stable, multi-point interactions that do not alter the structural integrity of the enzyme, but allow for adaptive conformational flexibility.
The total system energy decreased substantially from 27,482.233 kJ/mol to −34,307.473 kJ/mol, yielding a ΔE of −61,789.706 kJ/mol.
3.9. Interaction Between Elastase (LasB) and Polyvinyl Chloride (PVC)
3.9.1. Structural Stability of the LasB-PVC Complex (RMSD)
The root means square deviation (RMSD) trajectory gives a critical assessment of structural stability of the LasB-PVC complex during the simulation of the molecular dynamics. The RMSD of the initial equilibration of the system was observed to increase at a high rate due to the minimized starting structure to about 1.4–1.6 Å within the first nanosecond, signifying the early structural relaxation of the system. After this initial adjustment, RMSD values were within the range of 1.5–2.2 Å during the majority of the time of the simulation.
The wavelengths of 10–25 ns had a moderate oscillation (1.6–1.9 Å), meaning that the system was converting its shape to accommodate the presence of the polymer chain. This is typical of protein-polymer interfaces, where ligand lacks binding constraints that are rigid, and can be reconfigured dynamically in the surface of the protein. Subsequently in the simulation (between 30–50 ns), a slow but steady slight increase in RMSD to 2.0–2.3 A was observed, which is slight alterations in conformation, but not structural destabilization or complex dissociation. It is important to note that no sudden increases in RMSD occurred, nor did any major deviation in its structure, which means that the LasB-PVC complex did not lose its overall conformational integrity during the course of the simulation.
3.9.2. Residue Flexibility Analysis (RMSF)
Root means square fluctuation (RMSF) analysis was used to study the residue-level flexibility in the protein structure. The remainder of the residues had much smaller amplitudes of fluctuations with an average of 0.5 to 1.8 Å, indicating that the majority of the protein backbone was stable during the simulation. This loss of flexibility suggests no significant structural perturbations of the catalytic area or structural area of LasB are caused by the interaction with PVC.
We found that at the terminal residue end (approximately residue index 21) a sharp drop in RMSF to approximately 33 Å was observed. Strong fluctuation of this nature is typical of terminal or loop regions which are naturally flexible because there are few stabilizing interactions with other residues. Notably, this great flexibility is localized and is not transduced throughout the protein structure, which proves that the global fold of LasB did not alter during the interaction with the polymer.
A comparable tendency was observed in the B-factor profile, which was plotted on the same scale as RMSF and had intermediate values throughout the central residues and high values at flexible ends. The localized movement is also confirmed in this correspondence to be limited to peripheral structural parts and not the protein core.
3.9.3. Radius of Gyration (Rg) and Structural Compactness
Radius of gyration (Rg) is used to measure how tight the protein structure is during the time of the simulation. In the case of the LasB-PVC complex, Rg values were consistently 7.8 to 8.5 Å during the whole path of the simulation. This extremely restricted number indicates that there was no essential change in the general structural compactness of the protein.
Minor oscillations were seen over the course of the simulation, especially between 35 and 45 ns, when the Rg values momentarily rose to the 8.6–8.7 Å range, and the values started to be restored to the baseline (around 8.0 Å). Such short-term fluctuations can probably be associated with small conformal changes of surface loops or contact areas of polymers and not extensive structural rearrange-ments.
It is interesting to note that, since no long-term changes in Rg indicate no unfolding of proteins or mas-sivestructural enlargement occurred, PVC binding does not destabilize LasB tertiary structure.
3.9.4. Molecular Surface Area (MSA)
The data of structural expo-surfaces and conformational dynamics of the protein-polymer complex are provided by the molecular surface area (MSA) profile. The value of MSA during the simulation was relatively low but within a range of approximately 1240 to 1340 Å2. After a rapid stabilization, the system equilibrated and stabilized in the first few nanoseconds at a plateau with an area of 12,801,300 Å2.
Over the range 10 to 35 ns, the MSA had moderate oscillations about this mean value, which represented the active repositioning of the polymer chain with respect to the enzyme surface. Periodic jumps in the 1350 Å2 region relate to temporary increases in ex-posed surface area, presumably due to temporary opening of surface loops or slight polymer displacement.
In the last part of the simulation (around 4550 ns), a slight downward slope in MSA was seen, reaching 1250 Å2, which may indicate partial surface burial. All in all, these changes are small, and this suggests PVC association does not cause drastic changes in the solvent-exposed surface of LasB.
3.9.5. Polar Surface Area (PSA)
In the polar surface area (PSA) analysis, the data showed that the values of the analysis varied mostly between 650 and 820 Å2 along the simulation trajectory. The rapid increase in PSA at the beginning of the simulation of about 650 Å2 to about 750 Å2 indicates the equilibration of exposed polar residues in the solvent. After that, PSA values have an oscillatory nature and a number of temporary peaks above 800 Å2, especially near 30–35 ns, indicating momentary rises in the exposure of polar residues. These processes can be identified through minor displacements of surface loops which touch the PVC polymer chain. Though such changes occurred, PSA did not change much over time, which means that the polar residues on the surface of the protein do not change much during PVC association.
3.9.6. Solvent Accessible Surface Area (SASA)
The accessible surface area (SASA) is determined as how much of the protein surface is exposed to the surrounding solvent throughout the simulation. The LasB-PVC complex had SASA values of about 520–750 Å2, meaning that it was moderately exposed to the solvent.
The curve had a number of temporary drops in SASA, the most notable of which appeared at about 12 ns and 26 ns, with values dropping to about 520–560 Å2. It is likely that these reductions are caused by interim conformational alterations or partial polymer-mediated covering the protein surface.
On the other hand, the values of SASA increased to higher values at the later stages of the simulations, totaling between 720 and 750 Å2 and this indicates that the surface areas that had been covered earlier were partially re-exposed. On the whole, the SASA profile shows that polymer association causes local changes on the surface but does not result in significant changes in the solvent accessibility of the protein structure.
3.9.7. Radial Distribution Function (RDF)
Radial distribution function (RDF) analysis provides a clear picture of the geometric distribution of atoms that are engaged in the LasB-PVC interaction. The RDF curve showed a strong single peak at around 1.2 Å, which means that there were high chances of close atomic contacts between the atoms of the polymer and the protein. This high sharpness corresponds to high short-range interaction common to van der Waals contacts or steric proximity.
There were secondary peaks between about 1.6 and 3.0 × 100 m between additional coordination shells, where the adjacent atoms play a role in the interaction environment. The RDF intensity decreased progressively after about 4 Å towards a baseline that approached the values obtained at larger distances.
The cumulative number of coordination also rose gradually by radial distance, to about 110 interacting atoms in the 1012 Å range. This means that PVC does not react with one localized residue but rather forms a generalized interaction interface with a number of surrounding atoms on the protein surface.
3.9.8. Overall Interaction Characteristics
Collectively, the molecular dynamics simulations reveal that polyvinyl chloride had a dynamically stable reaction with Pseudomonas aeruginosa elastase (LasB) during the simulation. The structural measures such as RMSD and Rg show that the protein retains its overall structural integrity, and RMSF analysis shows that flexibility is localized to the terminal regions but not centered on the catalytic core.
Surface area measurements (MSA, PSA and SASA) reveal that the interaction causes minimal conformational changes of the enzyme surface, which is in line with the polymer interaction taking place on the exposed regions of protein molecules and not inside a deeply buried binding pocket. Moreover, RDF analysis proves that the interface of interaction is composed of several short-range contacts on the surface of proteins and not a specific binding site.
These findings, on the whole, indicate that non-specific surface contacts and van der Waals interactions are the two primary forms of interaction between LasB and PVC, which is why the polymer could be stabilized by the enzyme and not damage its structure.
The total system energy decreased significantly from 27,553.569 kJ/mol to −34,845.548 kJ/mol during the simulation, yielding a ΔE of −62,399.117 kJ/mol.
3.10. Interaction Between Elastase (LasB) and Polycarbonate (PC)
3.10.1. Interaction Profile During Simulation
The interaction process between LasB and polycarbonate (PC) indicates that there were a number of non-covalent interactions during the time period of the simulation. Intermittent occurrence of hydrogen bonds was observed at the initial stages of the trajectory, especially in the first 10 ns, which points to the occasional polar interactions between the polymer atom and the amino acid residues on the surface of the enzyme. Though the maintenance of these hydrogen bonds was not constant, the recurrence of these hydrogen bonds implies periodic stabilization of the polymer–protein interface.
By contrast, π-interactions were found to be predominant and more common during the majority of simulated trajectory. These interactions were reproducible at a fixed period of time, ranging between about 10 and 50 ns, according to favorable aromatic contacts between the polycarbonate ring structures and aromatic residues in the protein. These interactions can help in stabilizing the polymer around the surface of the enzyme.
Also, short-term interactions between ions, π and cations were found only in the early stages of the simulation, indicating that electrostatic interactions between positively charged residues and aromatic polymer groups are only temporary. Generally, the interaction profile suggests that the aromatic stacking interaction is the major stabilizing force that exists between LasB and PC, with the other activities including hydrogen bonding and electrostatic interactions.
3.10.2. Structural Stability of the Complex (RMSD)
Root mean square deviation (RMSD) analysis provides information on the overall stability of the LasB-PC complex during the trajectory of the molecular dynamics. The values of RMSD began to rise at the onset of the simulation due to the equilibration of the system on the basis of the reduced structure. RMSD increased to about 1.0 to about 2.0 A in the first 5 ns and indicated the natural structural relaxation of the protein in the presence of the polymer ligand.
At about 8 to 12 ns the system leveled off at about 3.0 Å, which indicates that the complex structure was stabilized. Following this equilibration period, values of RMSD values were fairly constant (between 2.7 and 3.2 Å) during the rest of the simulation until 50 ns. There were then only small deviations, such as a temporary decrease around 9 ns; however, no sudden deviations or substantial conformational changes were found.
The general RMSD profile indicates that LasB-PC complex has structural integrity during the course of the simulation, which indicates that the interaction with polycarbonate does not lead to the disruption of the global protein fold.
3.10.3. Residue Flexibility (RMSF)
Root mean square fluctuation (RMSF) analysis shows the dynamic behavior of in-dividual amino acid residues over the course of the simulation. The fluctuations of most of the residues were relatively low and did not exceed 0.5–1.1 Å, which indicates that backbones were positioned steadily and did not move extensively.
There was also a minor rise in flexibility of the residues around index 8, as RMSF values tended to be 2.0 Å in size, indicating local mobility at loop or surface-exposed regions. These variations are a typical feature of the flexible areas of proteins and do not reflect the destabilization of the general structure.
The same trend was observed in the B-factor profile, where moderate values were recorded at most of the residues and low values at the terminal regions. These results prove the existence of a structural framework in the protein at the time of the in-teraction with the polycarbonate polymer and that the flexibility is further limited to the pe-ripheral regions.
3.10.4. Radius of Gyration (Rg)
The radius of gyration (Rg) indicates the symmetry of the structure of the protein during the simulation. It was observed that the Rg trajectory showed a gradual rise in Rg with an approximate value of 7.5 Å at the initial part of the simulation to about 8.4 Å towards the initial part of the equilibration. This initial increase is probably due to the relaxation and rearrangement of structure of the protein surface to fit the polymer ligand.
Subsequent to this equilibration stage, the Rg values stayed within a small range between 8.1 and 8.6 Å which implies that the general compactness of the enzyme was not altered during the simulation. There were infrequent peaks of 8.8 Å, presumably due to short-lived shifts of the flexible loops or surface residues in contact with the polymer.
Notably, the effect of polycarbonate did not cause a long-lasting increase in Rg, which implies that an interaction with polycarbonate does not cause protein unfolding or massive structural expansion.
3.10.5. Molecular Surface Area
The molecular surface area (MSA) helps in the determination of the changes in conformations and the exposure of the protein surface during the simulation. A general trend was an initial growth in surface area between a range of 1120 Å2 and 1240 Å2 in the first 10 ns, suggesting the relaxation of the structure of the enzyme in the aqueous conditions.
However, once this step was completed, the surface area of the molecules stabilized at 1220–1250 Å2, and the oscillations became moderate and showed normal protein dynamics. Periodic spikes of up to 1280 Å2 indicate momentary expanses in the exposed surface areas, which might be linked to transient reorganization of the polymer chain.
On the whole, the fairly stable MSA profile shows that binding polycarbonate triggers slight changes in protein surface exposure.
3.10.6. Polar Surface Area
The polar surface area (PSA) trajectory showed a range of around 850 Å2 to 1050 Å2 during the simulation. The PSA rose quickly within several nanoseconds, with solvent-exposed polar residues adapting to the simulation environment.
Afterward, PSA values were fairly varied, reaching no more than 1000 Å2, which is a sign of the stable exposure of polar amino acid side chains. Middle and late simulation stages showed minor oscillations, but did not reveal systematic increases and decreases.
These findings indicate that the binding with polycarbonate does not have a strong effect on the distribution of polar residues on the surface of the protein, which confirms the hypothesis that the interaction is dominated mainly by hydrophobic and aromatic interactions.
3.10.7. Solvent Accessible Surface Area (SASA)
The solvent accessible surface area (SASA) reflects the extent of protein exposure to surrounding solvent molecules. SASA values increased gradually from approximately 200 Å2 at the beginning of the simulation to around 280–300 Å2 after equilibration.
After approximately 10 ns, SASA values stabilized and fluctuated within a narrow range between 260 and 320 Å2 throughout the remainder of the simulation. Such moderate changes are probably associated with slight conformational changes of the surface loops and positioning of the polymer.
In general, the SASA profile shows that polycarbonate association does not significantly cover or expose large areas of the enzyme surface, implying that the polymer attaches to isolated areas of the surface.
3.10.8. Radial Distribution Function (RDF)
Radial distribution function (RDF) analysis can provide information about the spatial organization of atoms participating in the LasB-PC interaction. The RDF profile showed a strong initial peak in the range of 1.3–1.5 Å, which indicates that the polymer and the protein atoms were most likely to be in close contact at this point.
Further peaks were found at 2.0–3.0 Å, which indicate the second coordination shell, where adjacent atoms are involved in the interactions. These are the peaks that are associated with short-range van der Waals and weak electrostatic contacts.
The cumulative coordination curve showed a steady growth with radial distance, indicating about 70 interacting atoms in a radius of 12 Å. This implies that polycarbonate is able to interact with more than one of the residues on the protein surface and is not localized in a single pocket.
3.10.9. Overall Structural Interpretation
Altogether, the molecular dynamics studies indicate that polycarbonate forms a dynamically stable complex with Pseudomonas aeruginosa elastase (LasB). The results of the RMSD and Rg analyses prove that the protein does not lose its structural integrity during the simulation, but the RMSF outcomes show that the flexibility is highly localized to the surface areas.
Surface area measurements (MSA, PSA and SASA) indicate that there are relatively insignificant changes in the surface area, which hints at the idea that the binding of the polymer does not cause essential changes in the enzyme structure. Moreover, RDF analysis shows that the interaction interface is distributed across the several protein surface residues.
On the whole, these results indicate that aromatic stacking and hydrophobic contacts are the main factors defining LasB–polycarbonate interaction, and hydrogen bonding also plays a subordinate role. This dynamic association of the polymer with the enzyme surface, as well as the stability in the structure of the protein, are made possible by such interactions. Interaction between elastase (LasB) and Poly ethylene terephthalate (PET).
The total system energy decreased significantly from 27,443.276 kJ/mol to −34,578.520 kJ/mol, corresponding to a ΔE of −62,021.796 kJ/mol.
3.11. Interaction Between Elastase (LasB) and Polyurethane (PUR)
3.11.1. Interaction Profile During the Simulation
The temporal interaction analysis between LasB and polyethylene terephthalate (PET) revealed several non-covalent interactions contributing to the stabilization of the polymer–protein interface. The presence of hydrogen bonding was mainly detected at the beginning of the simulation, especially at 1–5 and 1–8 ns, and the maximum number of hydrogen bonds that could be observed was two, transiently. The interactions between these molecules slowly dried up as the simulation continued, which suggests that hydrogen bonding is not the main factor but is a supportive factor in the stability of the initial association between the polymer and the enzyme surface.
Conversely, π–π stacking forces were observed during the major part of the simulation path. These interactions appeared intermittently but consistently from approximately 5 ns until the end of the 50 ns simulation, reflecting aromatic contacts between the phenyl rings of PET and aromatic amino acid residues within the enzyme. These remain the typical interactions of polymer–protein associations with aromatic polymers, and probably represent the major stabilizing interaction in the complex.
The initial coccobacillus interaction was also observed between 0 ions and cations in the early stage of the trajectory, which indicated the occasional electrostatic contacts between the positively charged residues and the aromatic groups of PET. These interactions were, however, short-lived, and failed to last in the later stages of simulation. On the whole, the interaction timeline shows that the key stabilizing force between LasB and PET was aromatic stacking interactions, although hydrogen bonding was a secondary stabilization force at the initial stages of the simulation.
3.11.2. Structural Stability of the Complex (RMSD)
The structural stability of the LasB–PET complex during the molecular dynamics simulation was evaluated using root mean square deviation (RMSD) analysis. RMSD values in the simulation started to rise quickly at the beginning with the minimized structure, approximately rising from 1.0 Å to about 2.3 Å over the initial few nanoseconds, reflecting the structural relaxation of the system after equilibration.
After this initial adjustment, the values of RMSD leveled off with a value of about 3.0–3.3 Å, with the value remaining constant after around 1012 ns. During the rest of the simulation (until 50 ns), the values of RMSD oscillated in a comparably small range (3.0–3.4 Å), meaning that the complex did not lose structural stability and did not suffer major conformational perturbation.
The transient decreases in RMSD were significant at approximately 810 ns and are likely associated with transient alterations in the conformation at the protein surface, or with the alignment of the PET chain. However, it is noteworthy that no sudden structural deviations were observed and this means that PET binding does not alter the global structure of the elastase (LasB).
3.11.3. Residue Flexibility (RMSF)
The analysis of the dynamical was done by root mean square fluctuation (RMSF). behavior of separate residues of the protein in the simulation. The fluctuation amplitudes of most residues were rather small, with values of between 0.6 and 1.2 Å, implying that the main part of the protein backbone was structurally stable throughout the reaction with the polymer.
Increasing flexibility was observed with increasing residue indices in which the RMSF values were closer to approximately 1.7 Å, which is a localized flexibility in the flexible loops or strands of the protein on the surface. These differences are typical of peripheral regions which are not necessary to give the structural stability needed by the enzyme.
In accordance with the latter, the distribution of B-factors revealed a moderate thermal mobility of central residues and a smaller value of terminal segments, which confirmed the finding that flexibility is localized, and it does not produce any impact on the overall structural integrity of LasB.
3.11.4. Radius of Gyration (Rg)
To determine the compactness of the protein in the simulation, radius of gyration (Rg) analysis was conducted. The values of Rg were around 7.5 Å at the initiation of the trajectory, which gradually increases to about 7.918.1 Å in the equilibration period.
Once the equilibration was achieved, the values of Rg have remained unchanged within quite a small range (7.7–8.3 Å), which indicates that the overall compactness of the enzyme structure was not changed drastically during the simulation. Isolated minor peaks were present, particularly at higher frequencies 35–40 ns, with Rg of about 8.5 Å, suggesting some transient conformational changes of surface loops which might be interacting with the PET polymer.
The absence of long-term growths in Rg proves that neither significant unfolding nor growth of protein structure occurred and determines the structural stability of the LasB-PET complex.
3.11.5. Molecular Surface Area
The molecular surface area (MSA) trajectory had moderate variations during the course of the simulation. Preliminary values were about 860–880 Å2, which gradually increased during the first equilibration stage as the protein became accustomed to the solvent milieu and the presence of the polymer ligand.
At approximately 10 ns, the MSA values became constant at approximately 890,910 Å2, with some small oscillations indicating normal protein dynamics. Periodic highs of 940–960 Å2 were seen toward later periods of the simulation, indicating a temporary rise in surface exposure through loop motion or the temporary reorientation of polymers.
In general, the MSA profile reveals that the alterations in the protein surface exposure during PET binding are insignificant, and no significant changes in the protein conformational arrangement occur.
3.11.6. Polar Surface Area
The polar surface area (PSA) had a range of about 740–850 Å2 throughout the simulation. The PSA went up to a small extent in the initial phases of the simulation, when the solvent-exposed polar residues were adapting to the simulation environment.
Following this preliminary step, PSA values remained in the middle range of 800–820 Å2, which is a good indication of constant exposure of the polar residues on the protein surface. Slight reductions were sometimes found, and those were presumably due to temporary shielding of polar groups by the polymer chain.
The observations indicate that LasB and PET interact mainly through hydrophobic and aromatic contacts and not large polar interactions.
3.11.7. Solvent Accessible Surface Area (SASA)
The solvent accessible surface area (SASA) analysis resulted in values ranging around 170–300 Å2 throughout the simulation. SASA initially increased slowly, but this was the equilibration phase, a process of the stabilization of the protein structure in the solvent environment.
SASA values between 210 and 250 Å2 stabilized after about 10 ns, and occasionally transitory values between 300 and 350 Å2 were recorded. Such variations are probably transient conformational changes of surface loops or real-time rearrangements of the PET polymer with respect to the protein surface.
In general, the SASA profile indicates that polymer interaction will not cause global regulations of the protein surface but instead induce a local regulation of the protein surface.
3.11.8. Radial Distribution Function (RDF)
Radial distribution analysis (RDF) analysis gives an idea of the spatial distribution of atoms that participate in the LasB–PET interaction. The RDF curve showed a clear major peak around 1.3 to 1.5 Å, signifying a high likelihood of close atomic contacts between the atoms of the PET and the residues of the proteins.
Secondary peaks were found between 2.0 and 3.0 Å, and the other coordination shells related to short-range van der Waals forces and weak electrostatic contacts. The RDF intensity slowed down after around 5 Å, which shows that there was a low probability of interaction at a greater distance.
The number of cumulative coordination numbers rose steadily with radial distance to a point of around 50–60 interacting atoms at a radius of 12 Å, indicating that it does not bind to a single binding pocket but many residues on the protein surface.
3.11.9. Overall Structural Interpretation
Altogether, the molecular dynamics findings suggest that polyethylene terephthalate establishes a stable but dynamic association with Pseudomonas aeruginosa elastase (LasB). Structural measurements, including RMSD and Rg, verify that the protein retains its structural integrity on a global scale during polymer interaction. RMSF measurements show that flexibility is predominantly restricted to surface-exposed residues.
Surface analysis (MSA, PSA, and SASA) shows that the binding of PET causes minimal variations in the surface exposure of proteins, which is also related to the surface-level polymer association, not to active-site binding. Moreover, the RDF analysis confirms that there are several short-range contacts that are spread over the surface of the enzyme.
On the whole, these results allow us to conclude that aromatic stacking and hydrophobic contacts predominantly determine the LasB–PET interaction, and hydrogen bonding helps to stabilize it temporarily in the initial steps of the simulation.
The total system energy decreased markedly from 27,143.230 kJ/mol to −35,041.116 kJ/mol, yielding a ΔE of −62,184.346 kJ/mol.
3.12. Connection Between Polymethyl Methacrylate (PMMA) and Elastase (LasB)
3.12.1. Interaction Profile Through the Molecular Dynamics Simulation
The time-dependent interaction of Pseudomonas aeruginosa elastase (LasB) and polymethyl methacrylate (PMMA) showed that there exists a small but significant network of intermolecular contacts in 50 ns of molecular dynamics simulation. The hydrogen bond timeline shows that there were discontinuous periods of hydrogen bonding, and on most frames, there were zero or one hydrogen bonds. These interactions were mainly observed at the initial stages of the simulation (0–10 ns), when short-lived hydrogen bonds were seen to occur between polar residues on the enzyme surface and the carbonyl oxygen atoms of the PMMA polymer backbone.
Hydrogen bonding was observed to increase significantly in a transient manner at around 22 ns, with the highest number of hydrogen bonds observed being two. Nonetheless, such interactions were not persistent, and this indicates that with PMMA, protein interaction is mostly overridden by weak and short-lived contacts as opposed to stable hydrogen bond networks. Other sporadic hydrogen bonds reoccurred between 40 and 48 ns, and this shows that there is dynamic repositioning of the polymer chain on the surface of the enzyme.
In general, the interaction profile indicates that PMMA binds the protein surface by transient hydrogen bonding and weak van der Waals forces, as opposed to a strong and stable binding interface.
3.12.2. Structural Stability of the Complex (RMSD)
The structural stability of the LasB-PMMA complex during the molecular dynamics simulation was studied using root mean square deviation (RMSD) analysis. The value of RMSD rose quickly in the initial part of the simulation, with 0.2 Å stepping to about 1.0 Å in the first few nanoseconds, which represents the equilibration and relaxation of the protein structure after the system was started.
After this pre-adaptation period, the RMSD values stabilized to a range of 0.9 to 1.2 A, over most of the simulation path. The simulation had small oscillations, and certain peaks of approximately 1.5 Å, particularly between 1015 ns and 40 ns. These changes notwithstanding, the overall RMSD was in a very limited range, which means that the structure of elastase on the whole was very stable in the presence of PMMA.
Notably, the lack of significant structural deviations or sharp RMSD changes shows that PMMA binding does not cause the enzyme protein to be significantly destabilized in its structure.
3.12.3. Residue Flexibility (RMSF)
Root means square fluctuation (RMSF) analysis indicated that relatively low residue mobility was found in the analyzed regions of the protein. The RMSF values fell within a range of approximately 0.43 to 0.63 Å, and the results suggest that there was only a small number of structural variations in the simulation.
The maximum fluctuation occurred at the initial residue region (~0.62 Å), and the lowest fluctuation was found close to the central region (~0.43 Å), which indicated that central structural components of the protein were very stable. Slightly higher flexibility was noted amongst the terminal residues (~0.52 Å), and this is expected to be found in peripheral regions of proteins.
The distribution of B-factors showed a similar trend, in that the distribution declined in the middle residues before rising a little again in the terminal positions. These results indicate that PMMA interaction does not make significant stability perturbations at the residue-level in the elastase structure.
3.12.4. Radius of Gyration (Rg)
The compactness of the protein was determined by the radius of gyration (Rg) profile in the course of the simulation. At the beginning of the path, Rg values were in the range of 5.6 Å, rising slightly to about 6.0–6.2 Å at the early equilibration stage.
After this re-equilibrating phase, the Rg values were relatively constant at 5.8–6.1 Å throughout most of the simulation. Small changes were noted in the latter stages (4050 ns), when Rg tended to reach 6.46 Å, indicating minor changes in conformation in flexible surface areas.
Comprehensively, the Rg trend shows that the elastase global compactness is not significantly altered when it interacts with PMMA, and no protein unfolding or structural expansion is observed.
3.12.5. Molecular Surface Area
The molecular surface area (MSA) analysis showed that there were moderate changes during the simulation and the value ranged between about 490 Å2 and 515 Å2. The initial part of the simulation showed marginally greater variations as the protein adapted to the introduction of the polymer ligand. The surface area became stable with a value of about 500–505 Å2 after 10 ns, and this was an indication that the total solvent-exposed protein surface did not change very much. Individual peaks to 515 Å2 indicate temporary exposure of the surfaces by loops or temporary repositioning of the polymer. Such findings indicate that the binding of PMMA does not cause dramatic changes to protein surface exposure.
3.12.6. Polar Surface Area
The polar surface area (PSA) analysis showed the values oscillating between approximately of 370 and 405 Å2 over the course of the simulation. At the beginning of the trajectory, the PSA values rose to about 365 Å2 then to about 390 Å2, which suggests solvent accommodation and structural relaxation. Throughout the larger portion of the simulation, PSA was quite stable at 390–395 Å2, with slight variation indicative of normal protein dynamics. The stability of the PSA values indicates that the polar surface residues in the interaction of PMMA and elastase do not undergo much rearrangement.
3.12.7. Solvent Accessible Surface Area (SASA)
During the simulation, the solvent accessible surface area (SASA) profile had values in the range of approximately 40 Å2 to 75 Å2. In the first instance, SASA values were smaller (~30–40 Å2), indicating that the polymer chain covered part of the surface of the proteins. SASA rose and then leveled off between 55 and 65 Å2 after 5–10 NAS, after which the solvent exposure and polymer association were at equilibrium. Infrequent sharp peaks of around 8090 Å2 indicate a momentary rise in solvent exposure as a result of polymer motion or slight structural reorganization. On the whole, these experiments suggest that the interaction of PMMA does not produce a severe effect on the surface architecture of proteins but slightly affects solvent accessibility.
3.12.8. Radial Distribution Function (RDF)
Radial distribution function (RDF) analysis provided information about the spatial organization of the atoms between the polymer and the protein. The RDF curve had a high peak in the primary range of 1.316 Å, which implies that there was a high likelihood of short-range interactions between PMMA atoms and protein remnants. Between around two to three Å, there were secondary peaks, which are indicative of other shells of coordination that depict weak van der Waals interactions and temporary hydrogen bonding interactions. In the range of around 5 Å the RDF progressively reduced to zero, showing that the probability of interaction was lower with increasing range. The cumulative coordination number rose gradually as radial distance increased, and at a radial distance of about 12 Å contained about 35–40 interacting atoms, indicating that PMMA interacts with a number of surface residues and is not bound to a binding pocket.
3.12.9. Overall Structural Interpretation
Altogether, the findings of the molecular dynamics suggest that PMMA establishes a weak yet dynamically stable complex with Pseudomonas aeruginosa elastase (LasB). The indexes of structural stability like RMSD and radius of gyration show that the protein maintains its overall structure when interacting with the polymer, whereas RMSF analysis indicates that changes at the residue level are insignificant. Surface area studies (MSA, PSA, and SASA) also show that the association of polymer molecules leads to relatively small changes in solvent exposure, which are usually associated with surface adsorption and not with the binding of active sites. Further, the RDF analysis has proven the existence of several short-range contacts that are spread throughout the enzyme surface. All of the above indicate that PMMA associates with LasB mainly by weak van der Waals contacts and transient hydrogen bonds to yield a dynamically stable yet relatively low-affinity polymer–enzyme interface.
The total system energy decreased significantly from 27,584.049 kJ/mol to −34,532.217 kJ/mol, corresponding to a ΔE of −62,116.266 kJ/mol.
3.13. Interaction Between Elastase (LasB) and Polyurethane (PUR)
3.13.1. Interaction Profile During Molecular Dynamics Simulation
The timeline of interaction between Pseudomonas aeruginosa elastase (LasB) and polyurethane (PUR) used the molecular dynamics trajectory to show that the presence of intermittent hydrogen bonding occurs during the reaction. The formation of hydrogen bonds was mainly evident at the beginning of the simulation, especially at the intervals of 5–10 ns, where few short-term hydrogen bonds could be observed. The highest number of interactions was two simultaneously formed hydrogen bonds, which means that the polymer functioning groups and the polar residues of the protein stabilized occasionally. Following the preliminary interaction period, the interactions of hydrogen bonding were infrequent, and individual events were observed at 14–16 ns and 30–36 ns. These disulfide bridges suggest that the polymer switches around the enzyme surface in a dynamic manner. The lack of ongoing hydrogen bonding during the simulation is an indication that PUR lacks a firmly attached binding interface but, rather, has a loose association with the enzyme. All in all, the interaction pattern shows that polyurethane reacts with elastase through weak hydrogen bonding and van der Waals contacts, which form a temporary and dynamically changing polymer–protein interface.
3.13.2. Structural Stability of the Complex (RMSD)
The stability of the global structure of the LasB-PUR complex in the molecular dynamics simulation was measured using the root mean square deviation (RMSD) trajectory. The values of RMSD shot up in the first nanosecond as the system relaxed to the minimized initial structure, and went up to close to 0 Å and then to about 0.6 Å. After this equilibration phase, the values of RMSD were more or less constant (0.6–0.8 Å) throughout the major part of the simulation. There were also slight variations along the path that indicated normal thermal movements in the protein structure. After a period of about 32 ns, there was an observable rise in the value of RMSD where it rose slowly to about 0.9–1.1 Å and stayed in the same range up to the end of the simulation. Nevertheless, the overall range of RMSD profile changes was quite small, even with this slight increase, which means that interaction with PUR does not destabilize the overall conformation of elastase.
3.13.3. Residue Flexibility (RMSF)
Root mean square fluctuation (RMSF) was used to assess flexibility at the residue level. RMSF scores of the resins analyzed were about 2.8 Å to 4.2 Å, which shows moderate flexibility in the protein structure.
The central residues of the analyzed region showed lower fluctuations, and slightly higher mobility was found at the terminal positions. This trend is also consistent with normal protein dynamics, where the loop regions, as well as terminal residues, are more flexible.
A similar pattern emergence was observed in the corresponding B-factor distribution, with greater values in residues with higher RMSF values. Notably, no significantly large deviations were detected, indicating that the presence of PUR does not have a significant effect of disrupting the dynamic stability of the protein backbone.
3.13.4. Radius of Gyration (Rg)
The trajectory of the radius of gyration (Rg) was used in measuring the compactness of the protein structure during the simulation. The Rg values at the start of the simulation were around 4.3–4.4 Å, signifying a compact shape of the protein.
During the course of the simulation, Rg was in a comparatively small range of between 4.2 and 4.6 Å, indicating that it was structurally compact. At 35–40 ns, when Rg was about 4.7–4.8 Å, which probably represents transient conformational changes of surface loops engaged with the polymer, minor peaks were observed.
On balance, it is possible to note that according to the Rg profile, the structural compactness of elastase is retained in the process of interaction with PUR to a larger extent.
3.13.5. Molecular Surface Area
The analyses of molecular surface area (MSA) revealed that the changes were moderate in the course of the simulation since the value varied in the range of 335–370 Å2. The first phase of the trajectory was a little more diverse since the protein got accustomed to the solvent environment and the presence of the polymer.
The exposed surface area to solvents was determined to be relatively stable, since the exposed surface area to the solvents remains relatively constant after approximately 10 ns, MSA values had stalled to 345,355 Å2. Occasionally transient peaks were detected in the end of the simulation, in particular at 3840 ns, connoting intermittent temporary enhances the surface exposure through repositioning of the polymer or the movement of loops.
These results show that there is no significant change in structure in the protein surface topology by the protein binding with PUR.
3.13.6. Polar Surface Area
The polar surface area (PSA) trajectory had values between a range of approximations of 290 Å2 and 360 Å2. In the initial simulation phase, there was a small initial drop in the PSA values, which appeared to stabilize around 310–330 Å2, which is a sign of structural equilibration of the solvent-exposed polar residues.
Subsequent increases were noted in later trajectories, especially at 35–40 ns, when PSA was nearing 350–370 Å2. Such increases can be attributed to temporary exposure of polar residues with conformational changes at the protein–polymer interface.
On the whole, the PSA profile indicates that there is a moderate change in polar surface exposure due to the impact of PUR interaction, but no significant change in global polarity distribution of the protein surface occurs.
3.13.7. Solvent Accessible Surface Area (SASA)
The solvent accessible surface area (SASA) analysis showed that the values ranged between about 50 Å2 and 110 Å2 during the simulation. Initially, the SASA values were somewhat higher, which showed that there was an increased solvent exposure at the beginning of the equilibria.
After around 10 ns, SASA stabilization occurred in the 70–90 Å2 range, indicating that there was a balance between polymer association and solvent exposure. These values would later occasionally be found to be over 110 Å2, especially around 38–42 ns, suggesting temporary highs in solvent exposure on account of conformational rearrangements or even polymer movement.
It is possible that these results indicate that polyurethane reacts primarily with surface residues, but does not penetrate into the enzyme structure.
3.13.8. Radial Distribution Function (RDF)
Radial distribution function (RDF) analysis shows that there were strong short-range contacts between the atoms of the protein surface and PUR atoms. There was a strong initial peak at the region around 1.3–1.5 Å, meaning that there were high chances of close atomic contacts between the protein residues and the polymer.
There were also other peaks around 2.0 to 3.0 Å, which contained secondary coordination shells which were related to the van der Waals forces and the occasional hydrogen bonding. At distances greater than around 5 Å, the RDF intensity declined slowly to zero, which signifies a decrease in the probability of interaction at greater distances.
The cumulative coordination number rose progressively with radial distance to a point of about 3033 interacting atoms in a radius of 12 Å, suggesting that PUR does not bind to a particular catalytic pocket, but instead interacts with several surface residues.
3.13.9. Overall Structural Interpretation
Taken together, the molecular dynamics studies indicate that polyurethane is dynamically stabilized and rather weakly interacts with Pseudomonas aeruginosa elastase (LasB). The structural stability parameters of RMSD and the radius of gyration are used to ensure that the enzyme retains its global structural integrity during the simulation.
The changes at the residue level are moderate and local, whereas surface area analyses (MSA, PSA, and SASA) exhibit slight modifications in solvent exposures. RDF analysis also confirms the existence of numerous short-range contacts that are not localized at one binding site but spread across the surface of an enzyme.
In general, these results indicate that PUR interacts with elastase mainly by transient hydrogen bonding and van der Waals forces to create a flexible polymer–protein interface that can potentially mediate the surface interactions of enzymes with synthetic polymer substrates.
The total system energy decreased from 27,486.984 kJ/mol to −34,263.411 kJ/mol, resulting in a ΔE of −61,750.395 kJ/mol.
3.14. Molecular Dynamics Analysis of LasB–Phosphoramidon Complex
3.14.1. Structural Stability (RMSD Analysis)
The structural stability of the LasB–phosphoramidon complex was assessed using the root mean square deviation (RMSD) of the protein backbone atoms over the simulation trajectory. The system exhibited a rapid equilibration phase within the first 5–8 ns, followed by a stable plateau throughout the remainder of the simulation. The average RMSD value stabilized at approximately 1.205 ± 0.18 Å, with minimal fluctuations not exceeding 1.8 Å.
Such low values of RMSD suggest that the protein retains the native conformation when bound to the ligand and no significant structural drift is observed. Interestingly, the ligand-complex deprivation of the biomolecule was not as deviated as in normal protein systems suggesting phosphoramidon is a structural stabilizer of the catalytic domain.
3.14.2. Residue Flexibility (RMSF Analysis)
Root mean square fluctuation (RMSF) profile showed residue specific flexibil-ity of the protein structure. Most of the residues had low values of fluctuations in the range of 0.6 to 1.4 A, indicating that there was no great motion of the residues. Active-site residues (His223, His227, Gln141) had less variability (~0.7–0.9 A). The loop regions were discovered to be more malleable to 2.3 A and this is in conformity to the dynamic characteristics of these regions. This tendency confirms the idea that the binding of the ligand induces the local rigidity of the catalytic pocket, which leads to the stability of the interactions between the enzymes and the inhibitors.
3.14.3. Compactness of the Protein (Radius of Gyration, Rg)
The radius of gyration (Rg) was very stable during the simulation, and the mean of 18.6 ± 0.12 A was obtained. The protein structure did not show any serious expansion or contraction. The Rg value consistency demonstrates a well-preserved tertiary structure, which means that the phosphoramidon binding is not disruptive of protein folding, instead, it helps to maintain structural compactness.
3.14.4. Interaction Profile and Stability
Intermolecular interaction analysis revealed phosphoramidon to have a stable interaction network in LasB active site. The presence of three to five hydrogen bonds was steady throughout the trajectory (average). The major residues that were involved were Glu141, His223, His227, and Tyr155. Catalytic Zn2+ ion was kept in a stable coordination during the simulation. Hydrogen bond occupancy was more than 70 percent of the duration of the simulation, which was a good sign of strong and consistent binding. The interactions are key to the successful inhibition of metalloprotease activity.
3.14.5. Molecular Surface Area (MSA)
The molecular surface area exhibited slight variations with an average value of about 15,200 ± 180 Å2. The lack of sharp transitions implies that binding of the ligands does not cause extensive surface rearrangements. The observed stability helps in suggesting that the protein maintains its native topology of solvent exposure in the course of the simulation.
3.14.6. Polar Surface Area (PSA)
The polar surface area was also relatively constant with an average of 5800 ± 120 Å2. This is a pointer of a constant distribution of polar residues and constant interaction with the aqueous environment. This kind of stability is critical to the dynamics of electrostatic balance and solvation.
3.14.7. Solvent Accessible Surface Area (SASA)
The solvent accessible surface area (SASA) varied in a small range of 13,500–14,200 Å2, with an average of 13,850 ± 210 Å2. Ligand binding resulted in a small decrease in SASA, indicating that phosphoramidon is being partially buried in the catalytic pocket. This means that there is efficient encapsulation of ligands, which increases binding affinity
3.14.8. Radial Distribution Function (RDF)
The radial distribution analysis (RDF) showed that there were clear peaks at distances of about 2.0–2.8 Å, which showed strong interaction between the atoms of the ligand and the water molecules around it. The reproducible RDF profile demonstrates that there is a stable hydration shell, which is very essential in holding the orientation of the ligand and stabilizing protein–ligand interactions.
Taken together, the results of the MD simulation indicate that phosphoramidon and LasB are in a highly stable and dynamically conserved complex. The low RMSD values, decreased RMSF in residues of the active site, constant Rg, and steady SASA/PSA profiles all suggest that the system does not change in structure during the course of the simulation.
The high binding affinity and inhibitory potential of phosphoramidon is further supported by the stable Zn2+ coordination and persistent hydrogen bonding network. These results confirm that it is a reference inhibitor and offer a practical standard to the comparative analysis of new ligands against LasB
An initial total energy of 27,493.984 kJ/mol reduced to a final energy of −34,537.155 kJ/mol. This corresponds to an overall energy decrease of −62,031.139 kJ/mol, reflecting a marked stabilization of the molecular system during the course of the simulation
3.15. Principal Component Analysis (PCA)
One of the most popular methods in multivariate statistical analysis is the principal component analysis (PCA), which is used to decrease the dimensionality of the data, but pre-saves as much as possible the variance in the data set. This method is designed to approximate the original data by a smaller set of independent variables, the principal components (PCs) where each of the components approximates some of the total variance of the data.
The algorithm relies on an orthogonal transformation to obtain the first principal component (PC1), which has maximum variance in the data set, and the second principal component (PC2), which is orthogonal to PC1, and successively the next principal components. This has generally been done by means of ei-genvalue decomposition, with the eigenvectors corresponding to the largest eigenvalues being the most important principal components.
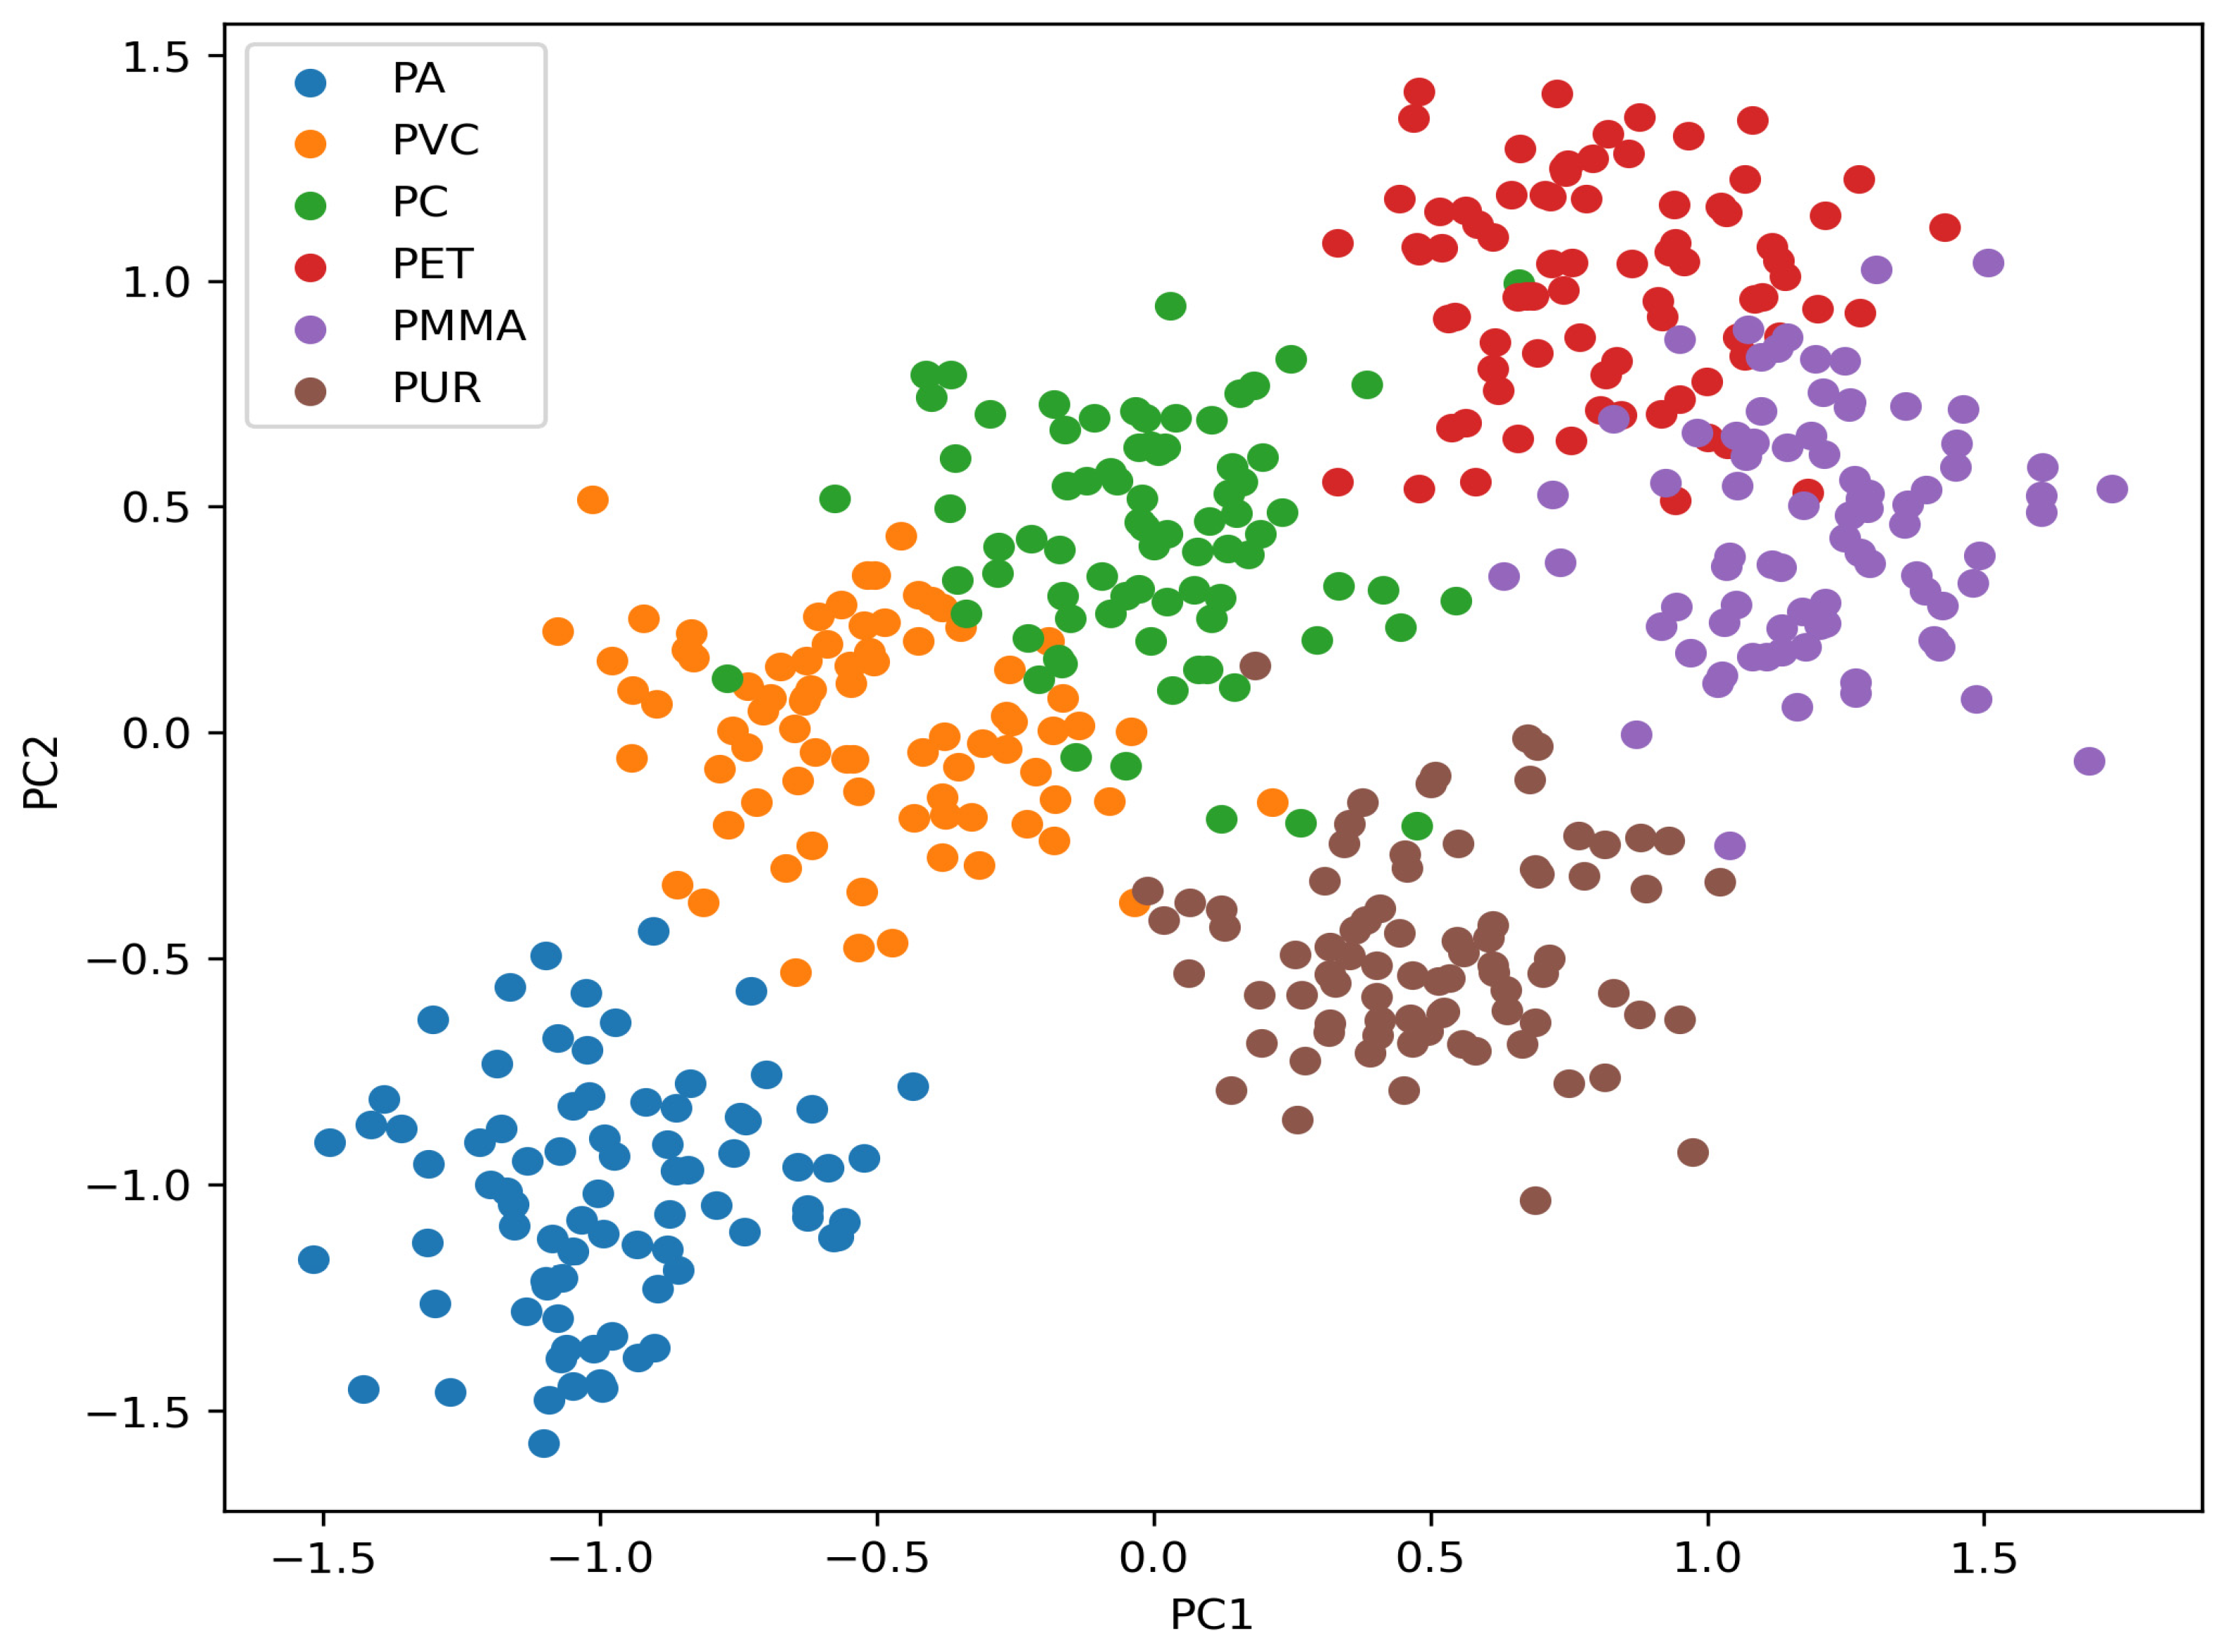
In the current research, a scatter plot was plotted with PC1 and PC2 to demonstrate the dynamic behavior of LasB complexes with polymer-derived ligands (
Figure 8). The PCA findings showed that there are three conformational groups. The initial category was comprised of PUR, PMMA, and PET that was mostly found in areas where posi-tive values were high on PC1 and PC2, suggesting somewhat open conformations. The latter group included PC and PVC, which demonstrated a stronger correlation between moderate and high values with PC1 indicating intermediate dynamic behavior. The third group comprised of PA that was located in areas where there were negative values on both axes implying a more compact and stable conformation.
The proximity of the data points in each cluster implies the presence of a strong correlation and similarity of conformational behavior in all the ligands in a given group, and the distance between the clusters indicates different dynamical patterns and modes of structural interactions. Overall, ligands that cluster (small angular distance in PCA space) have a higher correlation and share common interaction mechanisms, whereas those that are highly separated suggest lower levels of correlation and disparate interaction properties.
All in all, PCA gives a combined picture of the individual and com-bined ligand effects on the structural and dynamic behavior of the LasB enzyme. The results are also in line with RMSD and RMSF analysis, hence supporting the reliability of the identified stability and interaction patterns of the protein-ligand complexes.





 ,
,