Article

Carbon Metabolic Profiling as a Response to Previous Plant Mycotrophy and Soil Disturbance in Wheat Growth

1
Federal University of Recôncavo of Bahia, Santo Antônio de Jesus 44574-490, BA, Brazil
2
MED—Mediterranean Institute for Agriculture, Environment and Development & CHANGE—Global Change and Sustainability Institute, University of Évora, Pólo da Mitra, 7006-554 Évora, Portugal
3
Department of Microbiology, State University of Londrina, Londrina 86051-990, PR, Brazil
*
Authors to whom correspondence should be addressed.
Appl. Microbiol. 2024, 4(4), 1661-1676; https://doi.org/10.3390/applmicrobiol4040113
Submission received: 10 November 2024 / Revised: 6 December 2024 / Accepted: 7 December 2024 / Published: 11 December 2024
(This article belongs to the Special Issue Microbiome in Ecosystem, 3rd Edition)

Abstract

:
Soil microorganisms play a significant role in the dynamic regulation of organic matter in soils. To assess the influence of agricultural practices on soil functional profiling, we examined the effect of soil disturbance and plant sequence with different levels of mycotrophy on wheat microbiomes metabolism. Soil samples were analyzed with community-level physiological profiles (CLPP) using Biolog™ Ecoplates. The results of average well color development (AWCD) showed that the degree of mycotrophy of preceding crop and soil disturbance affected the soil microbiome, although no impact on Shannon Evenness Index was observed during the experiment. The Shannon–Wiener Diversity Index showed variations among the different preceding plants, but not in wheat analysis. The pattern of the C sources metabolism also changed differentially regarding plant type and soil disturbance during the experiment, being also different within the highly mycotrophic plants (legume and grass). In the legume, an increase in the metabolism of amine/amides and phenolic acids was observed, whilst in the grass, an increase in the metabolism of phosphate-carbons (P carbon) and carbohydrates was more evident. Principal component analysis showed that a grouping in the distinct phases of the experiment correlated with the widening of the metabolism of amino acids, carboxylic acids, and carbohydrates. The results indicate that soil functional community structure reflects soil agricultural practice conditions. Previous plant types and soil disturbance impacted the soil microbiome metabolic response (AWCD) in wheat, generating different patterns of carbon metabolism related to previous plant mycotrophy.

1. Introduction

The soil is a complex and dynamic ecosystem composed of several abiotic and biotic components that constantly interact with each other. Microorganisms regulate and influence important soil ecosystem processes and properties, playing a crucial role in maintaining and facilitating geochemical cycles. Abiotic and biotic factors can change microbial community structure and their ecosystem function; in turn, soil microbial communities are affected by inherent soil properties and conditions, crop management approaches, and aboveground vegetation presence and type [1,2,3]. Carbon is a key factor driving microbial growth in soil, and functional aspects related to substrate utilization can provide valuable information of soil functional diversity [4]. Rhizodeposition is a major source of soil organic carbon released by plant roots that drives soil microbial growth. The composition of root exudates, which is under host-genetic control, likely defines the assembly of plant-specific root and rhizosphere microbial communities and mediates plant–microbe interactions and, thereby, regulates plant growth, development, and yield. The exudation of bioactive metabolites varies substantially between different plant species, and they mainly consist of carbon-based compounds that comprehend low-molecular-weight compounds such as amino acids, organic acids, sugars, phenolics, and an array of secondary metabolites [5,6].
It has been hypothesized that fungal hyphae act as a super-highway for microbes to move to soil patches that can provide a source of inorganic nutrients to the AMF and can also exude labile C sources that may stimulate the decomposition of organic matter by free-living soil saprotrophs and, consequently, increase nutrient availability. In other words, hyphal exudation can trigger (analogous to the rhizosphere priming effect of root exudates) a hyphosphere priming effect [7,8]. In addition, mutualistic symbiosis between certain soil microbes and plants also affects plant growth. Some of these beneficial interactions include the fixation of atmospheric nitrogen through root nodule formation by rhizobia in legume plants. Another symbiotic interaction with soil arbuscular mycorrhizal fungi (AMF) can be accrued to have positive impacts in plants by improving P and other nutrients uptake and providing bio-protection against biotic and abiotic stresses [9,10].
Mycotrophic plants have been shown to impact AMF symbiosis establishment and the growth and productivity of succeeding crops, particularly when the soil is kept undisturbed [11,12]. The extra radicular mycelium (ERM) network formed during the preceding culture, when kept intact, acts as the preferential source of propagules for the succeeding crop, allowing for an early and faster root colonization and improving crop yield [13]. However, agronomic soil management practices are a critical factor in determining short- and long-term soil functional status. The microbial community structure may change under different soil cultivation practices and residue management [14]. Soil community diversity and response to disturbance are highly nuanced and vary with the type and severity of disturbance, the timescale studied, and the starting identity of the initial community [15]. Shifts in soil microbial diversity after conventional tillage regimes have been documented, where soil mobilization can decrease [16] or increase [17] this diversity. A possible explanation for an increase in diversity may involve the impacts of soil disturbance in the short term, where tillage may increase nutrient availability and open niches for colonization that may otherwise have been inaccessible due to competitive exclusion [18].
The Biolog® system has been widely used for environmental research, allowing for the monitoring of changes in the population of soil microorganisms under the influence of a range of factors [19]. The advantages of community-level physiological profiling (CLPP) over cell culture and molecular-level RNA/DNA amplification-based techniques are the simplicity of the protocol and the greatly reduced cost. However, many limitations in the use of this approach for complex environmental samples have been previously reported. The potential preference for fast-growing bacteria in the assay, the need to ensure equivalence of inoculum sample size, the incubation time, the data analysis, and the interpretation of the CLPP results should be standardized to enable suitable results [20]. Although CLPP involves inoculating plates with mixed samples of microbes, of which only a small percentage are culturable, this analysis could be effective at detecting spatial and temporal changes in soil communities and providing information regarding functional aspects of soil communities [3].
The use of CLPP techniques to study the soil microbiome could indicate changes in soil status or shifts caused by biotic and abiotic effects. Thus, based on carbon source metabolization by soil microbial communities, significant differences in the soil metabolic diversity can be detected [21]. Therefore, this study focused on assessing the shifts in carbon metabolic profiling during a greenhouse pot experiment analyzing the effect of plant sequence with diverse levels of mycotrophy combined with or without soil disturbance on the rhizospheric microbiome of wheat as the last plant of the succession.

2. Materials and Methods

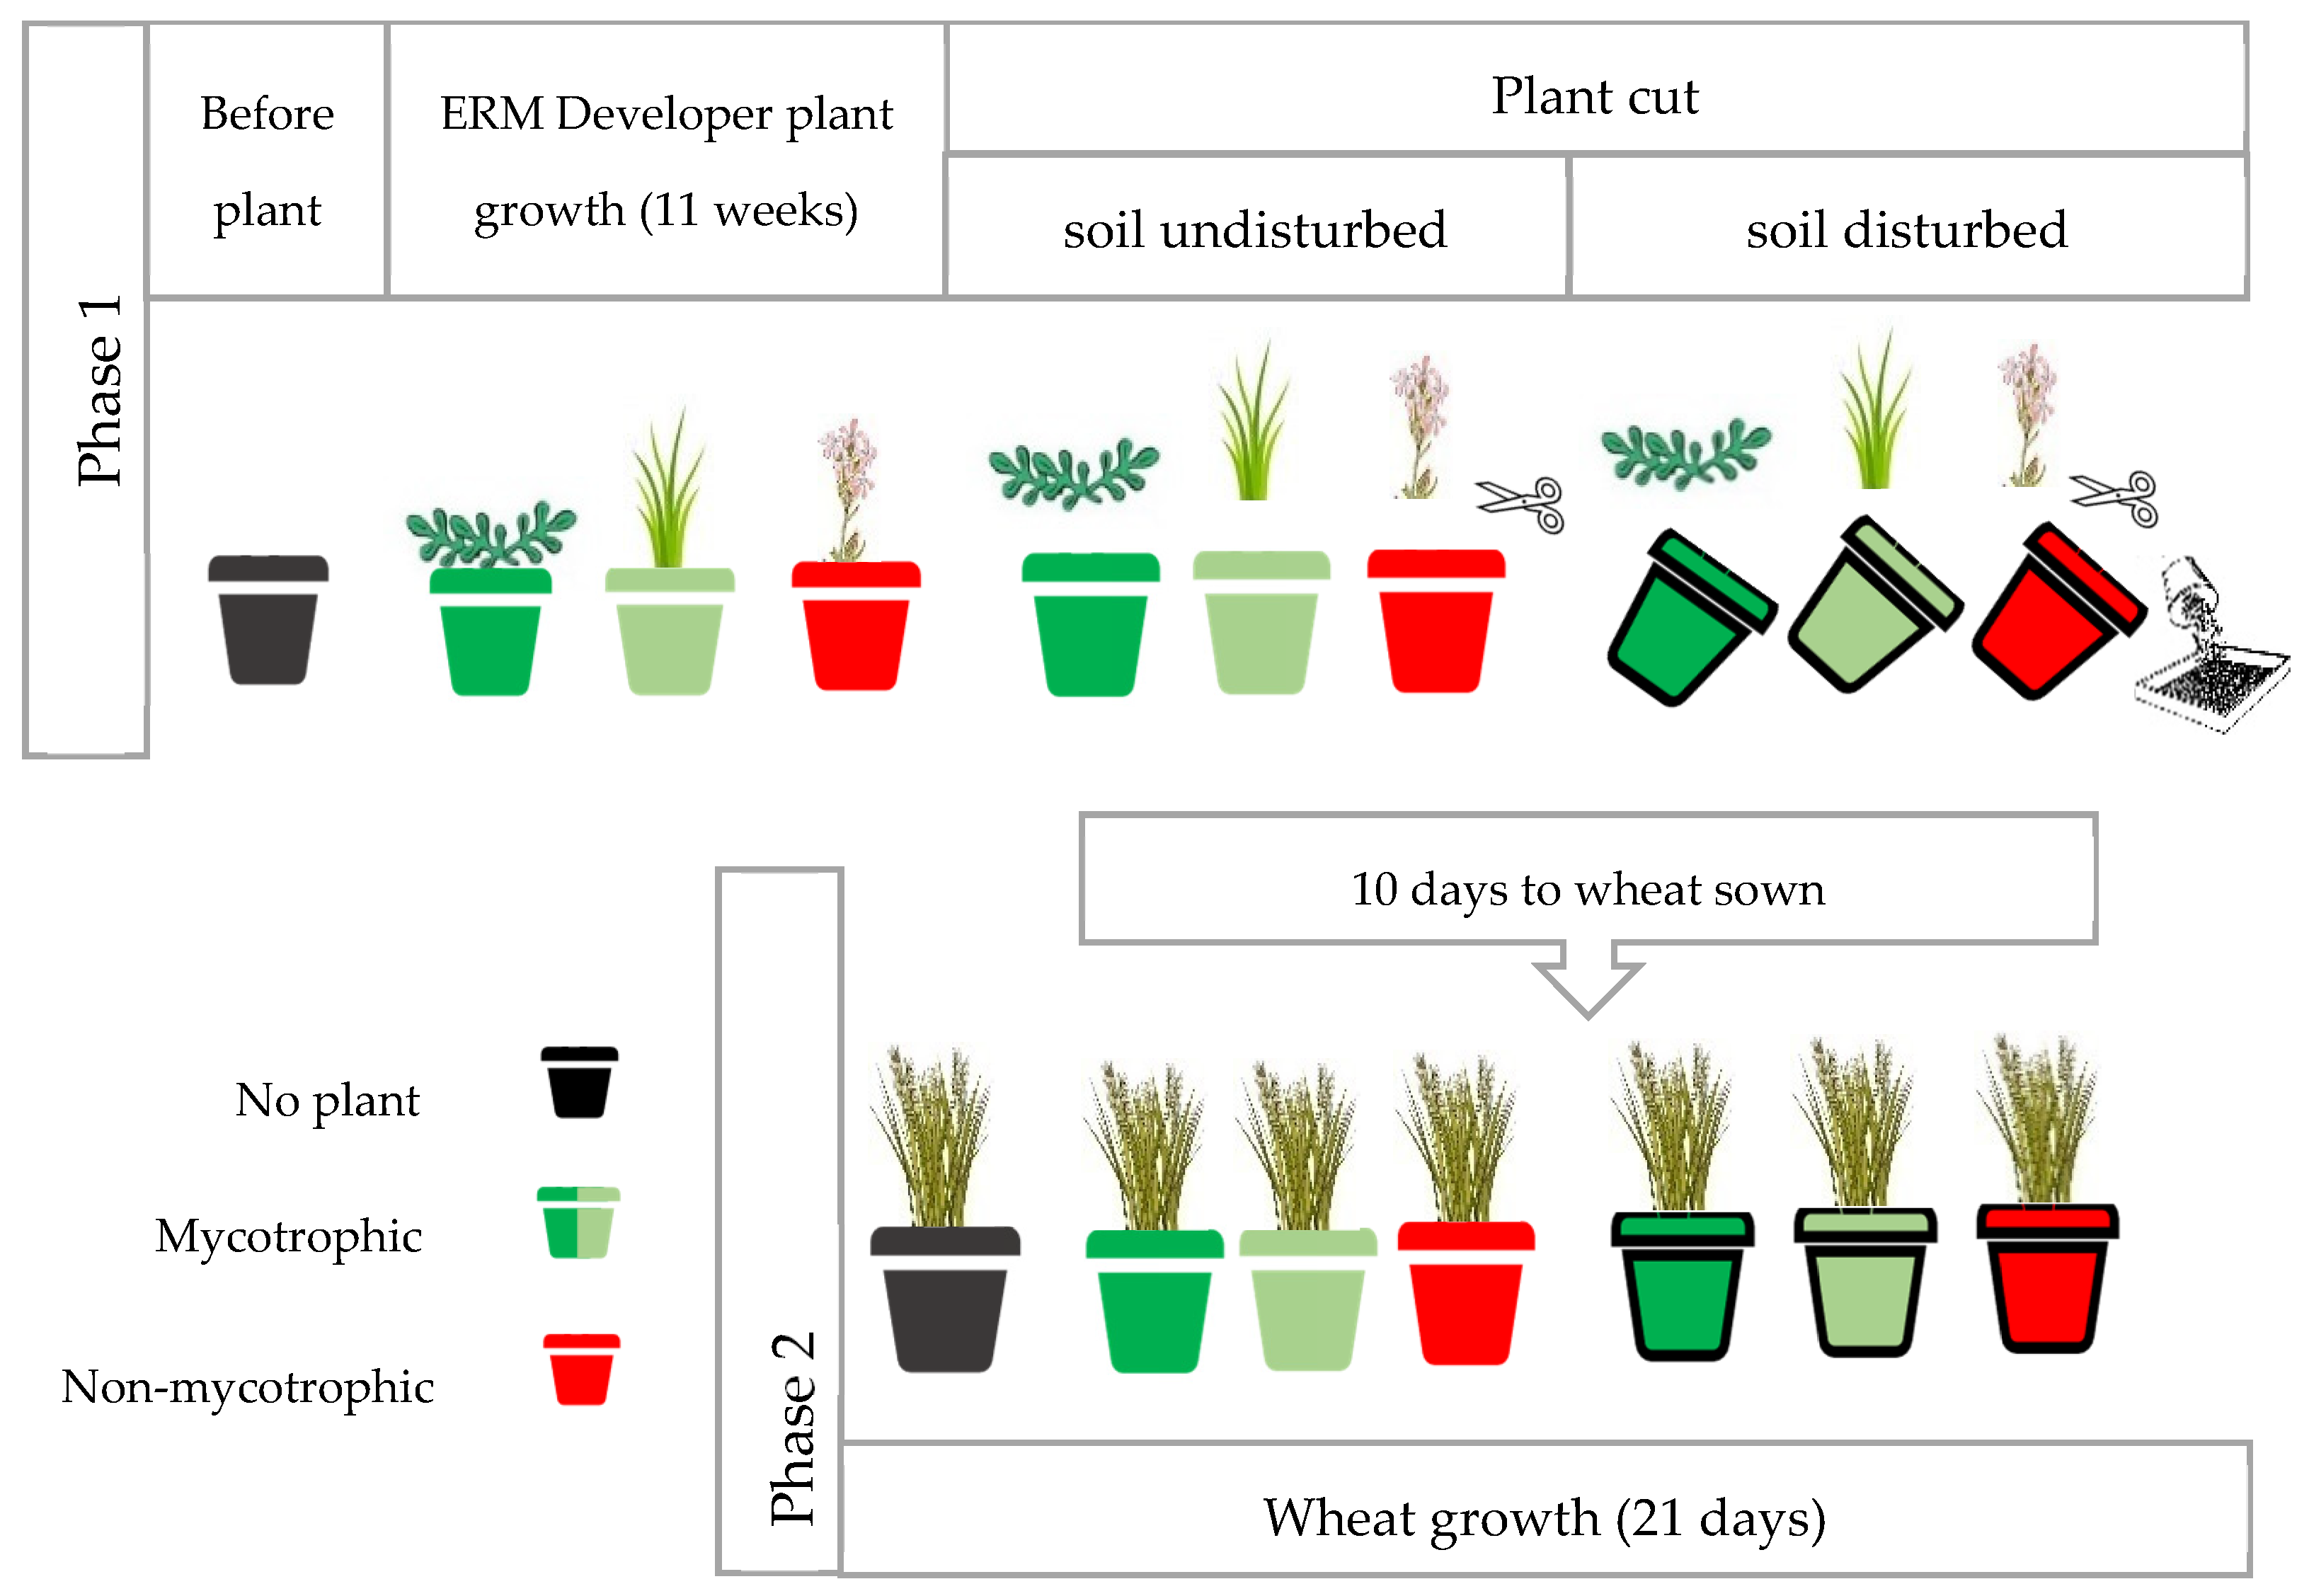
2.1. Experimental Design

A greenhouse pot experiment was performed under controlled conditions from January to April 2019. A sandy loam acidic soil described by [22] was collected from the first 20 cm of a natural pasture at Herdade da Mitra, University of Évora, Alentejo, Portugal (38°32′ N; 08°00′ W), with an organic C content of 10.5 g·kg−1 and a pH of 4.8 in water, and the ammonium acetate exchangeable manganese content at a pH of 7 was 29 ± 4 µg·g−1 [22]. This soil has been used in previous experiments and characterized by a high AMF diversity [23] and manganese toxicity [24]. The soil was homogenized by sieving to guarantee initial identical conditions in all treatments and packed into 8 kg pots, and a two-phase experiment was conducted (Figure 1). In phase 1, three plants, which occurred naturally in the field where the soil was collected, were grown: one being non-mycotrophic (Silene gallica) and two highly mycotrophic (Ornithopus compressus, a legume and Lolium rigidum, a grass) and able to develop an ERM in the soil. Daily control of weeds to avoid any confounding effects was carried out by hand, and all the pots were watered approximately to field capacity (0.17 g·g−1) by weight. The plants grew for 11 weeks, after which their aerial parts were severed from the roots in all pots. For the disturbed treatment, the soil of half of the pots of each species was subjected to mechanical disturbance by passing through a 4 mm sieve. The soil and roots were mixed and repacked into the same pots, and the shoot material was returned to the soil surface. The remainder of the pots of each species formed the undisturbed treatment, and the shoot material was also returned to the soil surface. These treatments allowed us to create two different ERM conditions, intact and broken, and, thus, to affect the mycorrhizal colonization of the wheat that followed. All pots were then left to rest for 10 days. In phase 2, wheat (Triticum aestivum L., var. Ardila) was planted in all 24 pots from phase 1 plus 4 control pots that did not receive any plants in phase 1 and allowed to grow for 21 days. The soil was sampled at three stages in phase 1: the first before planting (before plant), the second 11 weeks after the ERM developer plant growth to study the effect of plant type, and the third sampling 10 days after soil sieving to study the effects of soil disturbance. In phase 2, the soil was sampled from all the pots after wheat growth to evaluate differences among the disturbed and undisturbed treatments compared with the control pots and the effect of the previous plant on the metabolic activity of the wheat rhizospheric microbiome.

2.2. Bacterial Count Estimation

The heterotrophic bacteria were estimated according to the protocols described in [25]. Briefly, 10 g of soil from each treatment was suspended in 90 mL of ¼ Ringer solution. A tenfold dilution was prepared, and 0.1 mL from each tube was inoculated in TSA (Tryptic Soy Agar) in duplicate. The plates were incubated at 28 °C for 48 h, and then the colony-forming units (CFUs) were determined.

2.3. BIOLOGTM Ecoplates

The Biolog™ Ecoplates consists of a plate containing 96 wells having 31 different carbon sources and a blank arranged in triplicate. The assay was conducted by adding 2.5 g of each of four replicates per treatment (10 g in total) in 90 mL of ¼ Ringer solution. We used the same Ringer solution used in the microbial counting to ensure the same conditions in all the experiment. The soil suspensions were agitated for 30 min, at 220 rpm, and at room temperature, and they were allowed to rest for 1 h to decant. Then, 1 mL of the supernatant was diluted to 10−3 according to the results found in the bacterial counting estimation (~105 CFU/g), and 120 µL was inoculated in each well. The plates were incubated at 28 °C, and the absorbance (λ = 590 nm) was read every 24 h for 4 days [26,27]. The capability of microorganisms to utilize different carbon sources was measured by average well color development (AWCD), and treatments with larger rates were thought to have more efficient use of carbon sources. The calculation formula for the AWCD was
A W C D = i = 1 n C i R 31
where Ci is the absorbance value of each reaction well at 590 nm, and R is the absorbance value of the control well.
The Shannon–Wiener Diversity Index (H′) was used as a functional diversity index to investigate the diversity of soil communities and the Shannon Evenness Index (E) to characterize the utilization patterns of the carbon source by microorganisms. The formulas to calculate the Shannon Diversity and Shannon Evenness Indices are as follows:
Shannon–Wiener Diversity Index:
H = P i   l n P i  
P i = 3 C i R C i R
In the formula, Pi represents the ratio of the absorbance value in the ith (1 to 31) well to the total absorbance values of all wells.
Shannon Evenness Index:
E = H l n S 4
Considering S as the number of wells with positive activity within the replica.
A time point of 72 h was chosen to calculate the average well color development (AWCD) and Shannon Diversity (H′) and Evenness (E) Indices. A threshold was set in which the AWCD less than 0.06 was considered zero [28,29]. To perform the analysis, the 31 carbon sources were also grouped into 7 carbon types [26]: 1—amines (amines, amides phenylethylamine, and putrescine), 2—amino acids (L-arginine, L-asparagine, L-serine, L-threonine, L-phenylalanine, and Glycyl L-glutamic acid), 3—carboxylic acids (pyruvic acid methyl ester, D-glucosaminic acid, D-galactonic acid γ-lactone, D-galacturonic acid, γ-hydroxybutyric acid, itaconic acid, α-ketobutyric acid, and D-malic acid), 4—phenolic acids (2-hydroxy benzoic acid and 4-hydroxy benzoic acid), 5—phosphate-carbons (glucose-1-phosphate and D, L-α-glycerol phosphate), 6—carbohydrates (D-cellobiose, α-D-lactose, β-methyl-D-glucoside, D-xylose, i-erythritol, D-mannitol, and N-acetyl-D-glucosamine), and 7—polymers (tween 40, tween 80, α-cyclodextrin, and glycogen).

2.4. Statistical Analysis

The experiments were organized in a randomized block design with fourfold replication and factorial combination. ANOVA was performed based on the two factors of the study using a generalized linear model. For phase 1, the ERM developer plants were considered as one factor (with three levels) and the status of the ERM (before plant, after plant, and after disturbance), with three levels, as the second factor. In phase 2, the first factor was also the previous ERM developer plant in which the wheat grew, but with four levels (including control without any previous plants), and the second factor was soil disturbance (with two levels—disturbed and undisturbed). Tukey’s test was applied to mean comparisons at a p ≤ 0.05 significance level.
The AWCD values were used in the Principal Component Analysis (PCA) and to construct the heat maps for an overall metabolic view of the experiment. All the analyses were conducted using Minitab 21® software statistics.

3. Results

3.1. Metabolic Differences in Phase 1

In phase 1 of the experiment (Table 1), the average well color development (AWCD) and Shannon Diversity Index (H′) were minor in the soil before ERM developer plants and increased after the plant growth and soil disturbance. AWCD was also greater for mycotrophic plants compared to the non-mycotrophic one, and the legume (O. compressus) presented the greatest H’ throughout the experiment.
Among the mycotrophic plants, the legume (O. compressus) showed greater AWCD and H’ after plant growth and also greater AWCD after soil disturbance when compared to the grass (L. rigidum). The disturbance of the soil caused an increase in AWCD, but not for the non-mycotrophic plant (S. gallica).
Although functional diversity (H′) increased after disturbance, it was only significant for L. rigidum. No significant differences were observed regarding the Shannon Evenness Index (E).
The soil disturbance affected the soil microbiome metabolism of the different carbon types depending on the plant mycotrophy (Figure 2). Among mycotrophic plants, it increased the metabolism of all carbon types except for amines and amides for O. compressus and phosphate–carbon for L. rigidum. Under the non-mycotrophic plant S. gallica, the effect of the soil disturbance caused a decrease in the metabolism of the soil microbiome metabolism of most C-types, especially amines and amides, amino acids, and polymers, but it did not affect the metabolism of carbohydrates. Also, in S. gallica, there was no metabolism of phosphate–carbons, neither after plant growth nor after disturbance.
Regarding the metabolism of the different C sources, the soil disturbance increased the metabolism of pyruvic acid for all plants. In O. compressus and L. rigidum, the soil disturbance caused an increase in the metabolism of L-asparagine, L-threonine, β-methyl-D-glucoside, D-cellobiose, D-mannitol, and N-acetyl-D glucosamine. In particular, a shift in the metabolism of D-malic acid and tween 80 was found after O. compressus. After L. rigidum, an increase, specifically in D-galactonic acid γ-lactone, D-galacturonic acid, and glucose-1-phosphate, was noted (Figure 3).

3.2. Metabolic Differences in Phase 2

In phase 2 of the experiment, the results of soil microbiome carbon metabolism found 21 days after wheat growth showed statistically significant differences in AWCD regarding previous plant and soil disturbance (Table 2). Although the mean of AWCD was greater when wheat grew after disturbed soil, the greater AWCD was observed when wheat grew after the legume (O. compressus) in the undisturbed soil.
After wheat growth, the Diversity and Evenness Indices of the soil microbiome were not affected either by the previous plant or by the soil disturbance treatments.
The mycotrophy of the plants that grew before wheat and the previous soil disturbance differentially affected the metabolism of the diverse C-types. The soil microbiome under wheat that grew after the non-mycotrophic plant and in disturbed soil presented an increased metabolism of all C-types when compared to undisturbed soil (Figure 2). The effect was diverse among the wheat that grew after mycotrophic plants. After mycotrophic plants, an increased metabolism of amines and amides was observed in the soil microbiome under wheat that grew in the undisturbed soil when compared with the disturbed one. When L. rigidum was the precedent plant, the greater soil microbiome metabolism was observed in the disturbed soil, except for polymers. However, when O. compressus was the precedent plant, the greater soil microbiome metabolism was observed in the undisturbed soil, though this difference was not so evident for carboxylic acids, phenolic acids, and polymers.
Although the previous soil disturbance decreased most of the carbon metabolism when O. compressus was the precedent plant, the soil microbiome under wheat that grew after this legume with ERM disrupted (disturbed treatment) presented an increased metabolism of tween 40 and glycogen. In contrast, when L. rigidum was the precedent plant, it was in the disturbed treatment (ERM disrupted) that the soil microbiome under wheat presented the greater carbon metabolism, especially of L-serine, L-threonine, 4-hydroxy benzoic acid, γ-hydroxybutyric acid, D-malic acid, glucose-1-phosphate, β-methyl-D-glucoside, and D-xylose. When wheat grew after the non-mycotrophic plant, it was in the disturbed treatment that we found the greater soil microbiome metabolism of the C sources, notably of L-serine, D-galactonic Acid γ-Lactone, 4-hydroxy benzoic acid, β-methyl-D-glucoside, tween 80, and glycogen (Figure 3).

3.3. Overall Metabolic Profile

Comparatively, the carbon metabolic activity associated with different C-types was broadened in phase 2 of the experiment after wheat growth (Figure 2) for all plants. The high metabolism of phosphate-carbons, specifically glucose-1-phosphate, observed under L. rigidum after disturbance in phase 1 of the experiment remained after wheat growth (phase 2) in these conditions (Figure 3). The lowest metabolism of the phosphate-carbons was found after S. gallica, and it was absent in phase 1 and low under wheat that grew after this non-mycotrophic plant, regardless of the soil treatment.
The pattern of carbon-type metabolism associated with O. compressus shifted between phase 1 and phase 2 but remained similar for amines, amides, and phenolic acids. In contrast, the carbon type metabolism associated with L. rigidum changed for amines, amides, phenolic acids, and polymers when phase 1 and phase 2 were compared, remaining similar for amino acids, carboxylic acids, phosphate-carbon, and carbohydrates. And for S. gallica, a shift was observed for all the carbon types.
Greater values of γ-hydroxybutyric acid metabolism in all phases were associated with mycotrophic plants, regardless of soil disturbance. Despite the enhanced metabolism of carbohydrates after phase 2 of the experiment, the greatest AWCD of most carbon sources such as D-cellobiose, D-mannitol, N-acetyl-D-glucosamine, and β-methyl-D-glucoside was observed in the soil microbiome under mycotrophic plants after soil disturbance in phase 1 (Figure 3 and Figure 4). The soil microbiome under wheat that grew after the non-mycotrophic plant showed that the AWCD of D-malic, D-galacturonic, and D-glucosaminic acids (Figure 3) increased in phase 2.
Some similarities could be found among mycotrophic plants when comparing the two phases of the experiment. An increased soil microbiome metabolism of malic acid associated with O. compressus and soil disturbed from phase 1 remained in phase 2, but when the greater metabolism of tween 80 was found in phase 1, it was observed in phase 2 for tween 40. When L. rigidum was the precedent plant and the soil was disturbed, an increased soil microbiome metabolism was observed for L-threonine, pyruvic acid, glucose-1-phosphate, D-cellobiose, and β-methyl-D-glucoside, and it remained after wheat growth.
Principal component analysis using all 31 carbon sources revealed a separation of soil samples, indicating the different patterns of potential C use and, therefore, different microbial communities. The time selected for analysis was 72 h, and two forms of C metabolization were considered. The first one was related to 7 types of carbon (C-type) and the second to the 31 sources of carbon (C source) in the Ecoplate. Two principal components (PCs) were selected to be retained from a screen plot. For the C-type, the first principal component (PC1) explained 73.5% and the second 11.9% of the total variance of the data (Figure 4a), and both were plotted against each other (Figure 4b). For the C source, PC1 explained 46.1% and PC2 20.7% of the total variance of the data (Figure 5a), and they were plotted against each other (Figure 5b).
The principal component analysis (PCA) regarding the C-type and C source indicated that the carbon metabolism profiles between phases 1 and 2 were different. Regarding the C-type (Figure 4), the PCA confirmed higher results of C metabolism at the wheat phase (phase 2) compared to the initial phase (phase 1) of the experiment. PC1 showed a positive relation with an increase in amino acids, carboxylic acids, and carbohydrates metabolism. The C-type metabolism associated with L. rigidum after soil disturbance in phase 1 differed metabolically from the wheat that grew after these same treatments in PC2 having higher values of phosphate-carbons metabolism. Conversely, phase 2 of the experiment, after wheat growth, showed greater values of phenolic acids and amines and amides metabolism (Table 3A). According to the PCA (Figure 4), the microbiome metabolism under the mycotrophic O. compressus in the disturbed treatment is metabolically similar to the microbiome under wheat that grew after this treatment. In this analysis, the C metabolism of the wheat that grew after non-mycotrophic plant in the undisturbed treatment was less intense than the disturbed treatment, even compared with the wheat that grew after no previous plants.
In the PCA of the C source (Figure 5), the PC1 also showed that in phase 1 of the experiment, there was less metabolic activity than in the second. Notably, there was an exception again for the mycotrophic plants (L. rigidum and O. compressus) after disturbance, indicating higher values of C source metabolism, which were comparatively similar to the microbiome after wheat growth. The increase in C source metabolism regarding PC1 was mostly in L-arginine, L-serine, and L-phenylalanine (amino acids); D-glucosaminic, D-galacturonic, and D-malic acids (carboxylic acids); 4-hydroxy benzoic acid (phenolic acid); D, L-α-glycerol phosphate (phosphate-carbons); D-cellobiose, D-mannitol, and N-acetyl-D-glucosamine (carbohydrates). The metabolic differences among the microbiomes of mycotrophic plants after disturbance and the microbiomes under wheat that grew after mycotrophic plants mentioned previously were more evident in PC2, and they were positively related to the metabolism of L-threonine and pyruvic acid and negatively to phenylethylamine, α-ketobutyric acid, and D-xylose (Table 3B).

4. Discussion

Plant development more than doubled microbial activity and significantly increased functional diversity when compared to bulk soil (soil before planting) in phase 1 of the experiment conveying the relevancy of plant roots and their exudates in the activation of soil microbiome. The greatest microbial activity (AWCD) and functional diversity (H′) were associated with the plant that performs both mutualist symbiose with mycorrhiza and rhizobia (O. compressus), highlighting the importance of favorable niches for microbial diversity and interaction.
In addition, soil disturbance impacts soil microaggregates, water content, and aeration, exposing the soil organic matter (SOM) and making it easily degradable and available to microbial consumption [30,31]. In phase 1 of the experiment, upon soil disturbance, habitat niches established by plant growth were lost, the ERM of mycotrophic plants was broken, and plant roots were fragmented, becoming more readily usable organic matter (OM). Additionally, the incorporation of oxygen shapes growth conditions for a wide range of soil microorganisms. As a result, differences in functional diversity among different plants were lost and microbial activity increased, although the latest just for the mycotrophic plants, where ERM accounts for an additional OM source for heterotrophic soil bacteria. Changes in SOM pools could reflect the balance between the synthesis and degradation of the pools by the microbial biomass in relation to the species-specific root exudates. The rate at which each SOM metabolism responds to changes in management or other perturbation is likely to vary considerably between plant types and, therefore, to the nature of organic inputs [32,33]. The results also indicated that soil disturbance had different impacts on the C metabolism under O. compressus and L. rigidum in phase 1 (Table 1). Legume plant residues decompose rapidly due to their low C/N ratio, as they have high nitrogen and water-soluble carbon contents. Grass, on the other hand, is characterized by a high C/N ratio in plant residues and longer persistence on the soil surface as a result of low decomposition rate [32,34]. This may explain the decrease in AWCD in the disturbed treatment of phase 2 compared to the undisturbed treatment (Table 2) following O. compressus. The SOM content from that disturbed treatment seemed to be decomposed sooner than the other previous plants and, therefore, had a lower metabolic activity.
Biolog® indices are related to the metabolic activity, number, variety, and diversity of bacteria, including diversity within and between functional groups, being affected by agricultural practices and C-inputs in the agro-ecosystem [35]. From the results of phase 2 (Table 2), the significant increase in bacterial metabolic activity (AWCD) observed after soil disturbance in phase 1 persisted after wheat growth, indicating that the mineralization process was still taking place at a faster rate than in undisturbed soil, with the exception of the legume in which it decreased (as discussed above). The soil disturbance treatment homogenized the functional diversity (H′) created by the antecedent plant, and wheat development did not affect it, nor the predominance of a few metabolic groups of bacteria (E). Substrate diversity indices may be used to initially assess the functional diversity of soil [36]. However, this tool was not sensitive enough to establish differences in the microbial metabolic profiling of the disturbed treatments in phase 2, where the confounding effects of soil management may hinder the emergence of clear differences. Studies of soil microbiomes metagenomic are foreseen to assess the qualitative differences within the treatments.
The ERM formed by mycotrophic plants in phase 1 seemed to serve as an additional niche of metabolic activity for the soil microbiome. The disruption of this ERM imposed by soil disturbance changed the functional profile of specific carbon sources linked to biological processes involving mycotrophic plant responses to stress, such as malic acid and glucose-1-phosphate. The disturbance increased the malic acid metabolism, and the malate synthesis is hypothesized to be involved in soil Mn detoxification by some plants, including legumes and grass [37,38]. In addition, the malic acid solubilizes the fixed inorganic P by lowering the soil pH for adsorption sites in the soil. This phosphorus solubilization by mycotrophic plants is an effective and sustainable approach to enhance the P availability for the following plants and reduce dependence on unsustainable, costly synthetic fertilizer sources [39]. In turn, glucose-1-phosphate can be correlated with the mechanisms of grass to cope with phosphorus deficiency [40]. The soil disturbance also increased the metabolism of N-acetyl-D-glucosamine and mannitol, carbon sources that take part in the fungal cell. N-acetyl-D-glucosamine is a chitin monomer, an abundant polysaccharide found in the cell walls of fungi [41], and mannitol has been reported as a cell storage for carbohydrates translocated into the mycelia [42], and its metabolism could be associated with the destruction of the fungal cell imposed by ERM disruption.
Comparing the results of C metabolism with the functional bacterial counts for this experiment, the higher metabolic activity of amines and amides (Figure 3) observed in the wheat phase and in O. compressus after disturbance (from phase 1) agrees with the higher counts of ammonifier bacteria found in the same experiment [43]. As indicated by [44], in acid soils, the nitrification rate is lower than in neutral soils, and plants adapted to acid soils may prefer NH4 as a source of N assimilation. In turn, ammonium ions are a direct product of the bacterial degradation of nitrogen compounds such as amines and amides [45,46]. Significantly, the metabolism of phenolic acids also contributes to this clustering in the PCA (Table 3A). The primary sources of phenolic acids in soil are root exudates and decomposition of lignin in plant residues [47]. Consequently, its higher metabolism could be a direct effect of shoot remains and organic matter input from phase 1, jointly with wheat exudates. Phenolic acids are also known to play multifunctional roles in rhizospheric plant–microbe interactions, acting as signaling molecules in the initiation of legume–rhizobia symbioses [48], hence the presence of O. compressus (from phase 1) in that cluster.
Soil disturbance may increase the microbial oxidation process, while contributing to reduced microbial biomass (and microbial functional diversity) due to insufficient substrates for anabolic and catabolic functions [36]. Generally, in long-term field experiments, soil mobilization is known to impact microbial diversity by decreasing it [49,50]. However, our results showed that the soil disturbance increased diversity, particularly after L. rigidum at 10 days after the soil disturbance. This result can also be interpreted in the context of the disturbance–diversity models. Intermediate Disturbance Hypothesis (IDH) predicts that disturbance can increase community diversity up to a certain level of disturbance strength or frequency, after which diversity will decrease. The dynamic equilibrium model (DEM) predicts that the dynamic balance of populations in soil microbial community can also undergo changes influenced by beneficial and/or antagonistic interactions between microorganisms, therefore shifting the composition of the community and its diversity [51]. From that perspective, higher levels of labile organic carbon due to the disturbance were available, increasing the level of C source reachability for microorganisms and, therefore, promoting functional diversity [52,53]. Further studies, including time sampling extended after soil disturbance, are needed to verify which hypothesis could be applied.

5. Conclusions

Irrespective of the type, plant development greatly increased the soil metabolic activity. However, different AWCD profiles were a direct effect of plant exudate release, which is species-specific. That was also observed after wheat growth, where its growth seemed to dilute the differences in microbiome functional diversity (H′) irrespective of previous soil disturbance. Plants exhibiting the tripartite symbiosis presented greater metabolic activity and diversity of substrates used (H′) and showed a completely different pattern when compared to the other mycotrophic plant. The use of diversified cropping systems with mycotrophic cover crops associated with no-tillage management promotes a more propitious environment for the following cultures by enhancing soil microbial diversity and metabolism, ultimately contributing to a more sustainable agriculture. In addition, some patterns of metabolism associated with mycotrophic plants remained after wheat growth for some carbon sources.
The soil disturbance affected the C metabolism profile in different ways due to more forms of C sources available to be readily consumed, and an increase in the diversity of substrates used was observed. Upon soil disturbance, the mycotrophy of the plant had a marked effect on the metabolic profile. After mycotrophic plants, there was a more efficient use of carbon sources when compared to the non-mycotrophic one, probably due to the bacteria associated with the fungi mycelia. Integrating mycotrophic cover crops into agricultural systems cultivates a diverse array of metabolic activities among soil microbes, synergistically enhancing ecosystem services and bolstering soil health for sustainable and productive farming practices.
Further research is underway to determine the changes in soil microbial community composition under the studied conditions to detail the results of Diversity and Evenness Indices found in this study using NGS. The present results demonstrate that changes in the patterns of substrate utilization and metabolic diversity by the Biolog-culturable soil microbial community are sensitive indicators of agricultural management-induced effects on soil biological properties and, hence, changes in soil microbial status and diversity.

Author Contributions

I.B. designed the experiment. T.C. conducted the experimental analysis and the statistics. T.C., I.B. and G.A. performed the data analysis. T.C. wrote the article under the supervision of G.A. and I.B. All authors have read and agreed to the published version of the manuscript.

Funding

This research received no external funding.

Data Availability Statement

Dataset available on request from the authors.

Acknowledgments

The authors acknowledge the contribution of Michael Goss for helping design the experiment.

Conflicts of Interest

The authors declare no conflicts of interest.

References

  1. Insam, H.; Goberna, M. Section 4 update: Use of Biolog® for the Community Level Physiological Profiling (CLPP) of environmental samples. In Molecular Microbial Ecology Manual; Kluwer Academic Publishers: Dordrecht, The Netherlands, 2008; pp. 2755–2762. [Google Scholar] [CrossRef]
  2. Gałązka, A.; Gawryjołek, K.; Grządziel, J.; Frąc, M.; Księżak, J. Microbial community diversity and the interaction of soil under maize growth in different cultivation techniques. Plant Soil Environ. 2017, 63, 264–270. [Google Scholar] [CrossRef]
  3. Adams, T.C.; Brye, K.R.; Savin, M.C.; Lee, J.A.; Gbur, E.E. Microbial carbon substrate utilization differences among high- and average-yield soybean areas. Agriculture 2017, 7, 48. [Google Scholar] [CrossRef]
  4. Lan, X.; Du, H.; Peng, W.; Liu, Y.; Fang, Z.; Song, T. Functional diversity of the soil culturable microbial community in eucalyptus plantations of different ages in Guangxi, South China. Forests 2019, 10, 1083. [Google Scholar] [CrossRef]
  5. Badri, D.V.; Vivanco, J.M. Regulation and function of root exudates. Plant Cell Environ. 2009, 32, 666–681. [Google Scholar] [CrossRef]
  6. Swamy, M.K.; Akhtar, M.S.; Sinniah, U.R. Root Exudates and Their Molecular Interactions with Rhizospheric Microbes. In Plant, Soil and Microbes; Springer International Publishing: Cham, Switzerland, 2016; pp. 59–77. [Google Scholar] [CrossRef]
  7. Jansa, J.; Bukovská, P.; Gryndler, M. Mycorrhizal hyphae as ecological niche for highly specialized hypersymbionts—Or just soil free-riders? Front. Plant Sci. 2013, 4, 134. [Google Scholar] [CrossRef]
  8. Toljander, J.F.; Lindahl, B.D.; Paul, L.R.; Elfstrand, M.; Finlay, R.D. Influence of arbuscular mycorrhizal mycelial exudates on soil bacterial growth and community structure. FEMS Microbiol. Ecol. 2007, 61, 295–304. [Google Scholar] [CrossRef]
  9. Goss, M.J.; Carvalho, M.; Brito, I. Challenges to Agriculture Systems. In Functional Diversity of Mycorrhiza and Sustainable Agriculture—Management to Overcome Biotic and Abiotic Stresses; Academic Press and Elsevier: London, UK, 2017; Chapter 1; p. 231. [Google Scholar]
  10. Canarini, A.; Kaiser, C.; Merchant, A.; Richter, A.; Wanek, W. Root exudation of primary metabolites: Mechanisms and their roles in plant responses to environmental stimuli. Front. Plant Sci. 2019, 10, 157. [Google Scholar] [CrossRef]
  11. Brito, I.; Goss, M.J.; Alho, L.; Brígido, C.; van Tuinen, D.; Félix, M.R.; Carvalho, M. Agronomic management of AMF functional diversity to overcome biotic and abiotic stresses. The role of plant sequence and intact extraradical mycelium. Fungal Ecol. 2019, 40, 72–81. [Google Scholar] [CrossRef]
  12. Carvalho, M.; Brito, I.; Alho, L.; Goss, M.J. Assessing the progress of colonization by arbuscular mycorrhiza of four plant species under different temperature regimes. J. Plant Nutr. Soil Sci. 2015, 178, 515–522. [Google Scholar] [CrossRef]
  13. Goss, M.J.; Carvalho, M.; Brito, I. The Significance of an Intact Extraradical Mycelium and Early Root Colonization in Managing Arbuscular Mycorrhizal Fungi. In Functional Diversity of Mycorrhiza and Sustainable Agriculture; Goss, M.J., De Carvalho, M., Brito, I., Eds.; Elsevier: Amsterdam, The Netherlands, 2017; Chapter 6; pp. 112–131. [Google Scholar]
  14. Rachwał, K.; Gustaw, K.; Kazimierczak, W.; Waśko, A. Is soil management system really important? Comparison of microbial community diversity and structure in soils managed under organic and conventional regimes with some view on soil properties. PLoS ONE 2021, 16, e0256969. [Google Scholar] [CrossRef]
  15. Smith, C.R.; Blair, P.L.; Boyd, C.; Cody, B.; Hazel, A.; Hedrick, A.; Kathuria, H.; Khurana, P.; Kramer, B.; Muterspaw, K.; et al. Microbial community responses to soil tillage and crop rotation in a corn/soybean agroecosystem. Ecol. Evol. 2016, 6, 8075–8084. [Google Scholar] [CrossRef] [PubMed]
  16. Guo, L.J.; Lin, S.; Liu, T.Q.; Cao, C.G.; Li, C.F. Effects of conservation tillage on topsoil microbial metabolic characteristics and organic carbon within aggregates under a rice (Oryza sativa L.)—Wheat (Triticum aestivum L.) cropping system in Central China. PLoS ONE 2016, 11, e0146145. [Google Scholar] [CrossRef] [PubMed]
  17. Hartman, K.; van der Heijden, M.G.A.; Wittwer, R.A.; Banerjee, S.; Walser, J.C.; Schlaeppi, K. Cropping practices manipulate abundance patterns of root and soil microbiome members paving the way to smart farming. Microbiome 2018, 6, 14. [Google Scholar] [CrossRef]
  18. Wipf, H.M.L.; Xu, L.; Gao, C.; Spinner, H.B.; Taylor, J.; Lemaux, P.; Mitchell, J.; Coleman-Derr, D. Agricultural Soil Management Practices Differentially Shape the Bacterial and Fungal Microbiomes of Sorghum bicolor. Appl. Environ. Microbiol. 2021, 87, e02345-20. [Google Scholar] [CrossRef]
  19. Gryta, A.; Frac, M.; Oszust, K. Genetic and metabolic diversity of soil microbiome in response to exogenous organic matter amendments. Agronomy 2020, 10, 546. [Google Scholar] [CrossRef]
  20. Lladó, S.; Baldrian, P. Community-level physiological profiling analyses show potential to identify the copiotrophic bacteria present in soil environments. PLoS ONE 2017, 12, e0171638. [Google Scholar] [CrossRef]
  21. Gajda, A.M.; Czyż, E.A.; Furtak, K.; Jończyk, K. Effects of crop production practices on soil characteristics and metabolic diversity of microbial communities under winter wheat. Soil Res. 2019, 57, 124–131. [Google Scholar] [CrossRef]
  22. Goss, M.J.; Carvalho, M. Manganese toxicity: The significance of magnesium for the sensitivity of wheat plants. Plant Soil 1992, 139, 91–98. [Google Scholar] [CrossRef]
  23. Brígido, C.; van Tuinen, D.; Brito, I.; Alho, L.; Goss, M.J.; Carvalho, M. Management of the biological diversity of AM fungi by combination of host plant succession and integrity of extraradical mycelium. Soil Biol. Biochem. 2017, 112, 237–247. [Google Scholar] [CrossRef]
  24. Brito, I.; Carvalho, M.; Alho, L.; Goss, M.J. Managing arbuscular mycorrhizal fungi for bioprotection: Mn toxicity. Soil Biol. Biochem. 2014, 68, 78–84. [Google Scholar] [CrossRef]
  25. Albino, U.B.; Andrade, G. Evaluation of the Functional Group of Microorganisms as Bioindicators on the Rhizosphere Microcosm. In Handbook of Microbial Biofertilizers; Rai, M.K., Ed.; Haworth: New York, NY, USA, 2007; Chapter 2; p. 532. [Google Scholar]
  26. Goulart, K.C.S. Perfil Metagenômico de Solo Sob Cultivo de Cana-de-Açúcar com Perspectiva na Produção de Bioenergia. Ph.D. Thesis, Universidade Estadual Paulista, Sao Paulo, Brazil, 2013. [Google Scholar]
  27. Souza, L.M.; Schlemmer, F.; Alencar, P.M.; Lopes, A.A.D.C.; Passos, S.R.; Xavier, G.R.; Fernandes, M.F.; Mendes, I.d.C.; Reis Junior, F.B.d. Estrutura metabólica e genética de comunidades bacterianas em solo de cerrado sob diferentes manejos. Pesqui. Agropecu. Bras. 2012, 47, 269–276. [Google Scholar] [CrossRef]
  28. Ge, Z.; Du, H.; Gao, Y.; Qiu, W. Analysis on metabolic functions of stored rice microbial communities by BIOLOG ECO microplates. Front. Microbiol. 2018, 9, 1375. [Google Scholar] [CrossRef] [PubMed]
  29. Xu, W.; Ge, Z.; Poudel, D.R. Application and Optimization of Biolog EcoPlates in Functional Diversity Studies of Soil Microbial Communities. MATEC Web Conf. 2015, 22, 04015. [Google Scholar] [CrossRef]
  30. Janušauskaite, D.; Kadžiene, G.; Auškalniene, O. The effect of tillage system on soil microbiota in relation to soil structure. Pol. J. Environ. Stud. 2013, 22, 1387–1391. [Google Scholar]
  31. Young, I.M.; Ritz, K. Tillage, habitat space and function of soil microbes. Soil Tillage Res. 2000, 53, 201–213. [Google Scholar] [CrossRef]
  32. Bending, G.D.; Putland, C.; Rayns, F. Changes in microbial community metabolism and labile organic matter fractions as early indicators of the impact of management on soil biological quality. Biol. Fertil. Soils 2000, 31, 78–84. [Google Scholar] [CrossRef]
  33. Marschner, P.; Yang, C.H.; Lieberei, R.; Crowley, D.E. Soil and plant specific effects on bacterial community composition in the rhizosphere. Soil Biol. Biochem. 2001, 33, 1437–1445. [Google Scholar] [CrossRef]
  34. Teixeira, R.A.; Soares, T.G.; Fernandes, A.R.; de Souza Braz, A.M. Grasses and legumes as cover crop in no-tillage system in northeastern Pará Brazil. Acta Amaz. 2014, 44, 411–418. [Google Scholar] [CrossRef]
  35. Sofo, A.; Ricciuti, P.; Fausto, C.; Mininni, A.N.; Crecchio, C.; Scagliola, M.; Malerba, A.D.; Xiloyannis, C.; Dichio, B. The metabolic and genetic diversity of soil bacterial communities depends on the soil management system and C/N dynamics: The case of sustainable and conventional olive groves. Appl. Soil Ecol. 2019, 137, 21–28. [Google Scholar] [CrossRef]
  36. Bucher, A.E.; Lanyon, L.E. Evaluating soil management with microbial community-level physiological profiles. Appl. Soil Ecol. 2005, 29, 59–71. [Google Scholar] [CrossRef]
  37. Bi, Y.; Xiao, L.; Liu, R. Response of arbuscular mycorrhizal fungi and phosphorus solubilizing bacteria to remediation abandoned solid waste of coal mine. Int. J. Coal Sci. Technol. 2019, 6, 603–610. [Google Scholar] [CrossRef]
  38. De La Luz Mora, M.; Rosas, A.; Ribera, A.; Rengel, Z. Differential tolerance to Mn toxicity in perennial ryegrass genotypes: Involvement of antioxidative enzymes and root exudation of carboxylates. Plant Soil 2009, 320, 79–89. [Google Scholar] [CrossRef]
  39. Ferreira, M.J.; Veríssimo, A.C.S.; Pinto, D.C.G.A.; Sierra-Garcia, I.N.; Granada, C.E.; Cremades, J.; Silva, H.; Cunha, Â. Engineering the Rhizosphere Microbiome with Plant Growth Promoting Bacteria for Modulation of the Plant Metabolome. Plants 2024, 13, 2309. [Google Scholar] [CrossRef] [PubMed]
  40. Byrne, S.L.; Foito, A.; Hedley, P.E.; Morris, J.A.; Stewart, D.; Barth, S. Early response mechanisms of perennial ryegrass (Lolium perenne) to phosphorus deficiency. Ann. Bot. 2011, 107, 243–254. [Google Scholar] [CrossRef] [PubMed]
  41. Liu, Z.; Gay, L.M.; Tuveng, T.R.; Agger, J.W.; Westereng, B.; Mathiesen, G.; Horn, S.J.; Vaaje-Kolstad, G.; van Aalten, D.M.F.; Eijsink, V.G.H. Structure and function of a broad-specificity chitin deacetylase from Aspergillus nidulans FGSC A4. Sci. Rep. 2017, 7, 1746. [Google Scholar] [CrossRef] [PubMed]
  42. Meena, M.; Prasad, V.; Zehra, A.; Gupta, V.K.; Upadhyay, R.S. Mannitol metabolism during pathogenic fungal-host interactions under stressed conditions. Front. Microbiol. 2015, 6, 1019. [Google Scholar] [CrossRef]
  43. Conceição, T.A.; Andrade, G.; Brito, I. Influence of Intact Mycelium of Arbuscular Mycorrhizal Fungi on Soil Microbiome Functional Profile in Wheat under Mn Stress. Plants 2022, 11, 2598. [Google Scholar] [CrossRef]
  44. Marschner, H. Mechanisms of adaptation of plants to acid soils. Plant Soil 1991, 134, 1–20. [Google Scholar] [CrossRef]
  45. Arora, P.K. Bacterial degradation of monocyclic aromatic amine. Front. Microbiol. 2015, 6, 820. [Google Scholar] [CrossRef]
  46. González-Moro, M.B.; González-Moro, I.; de la Peña, M.; Estavillo, J.M.; Aparicio-Tejo, P.M.; Marino, D.; González-Murua, C.; Vega-Mas, I. A Multi-Species Analysis Defines Anaplerotic Enzymes and Amides as Metabolic Markers for Ammonium Nutrition. Front. Plant Sci. 2021, 11, 632285. [Google Scholar] [CrossRef]
  47. Wilhelm, R.C.; DeRito, C.M.; Shapleigh, J.P.; Madsen, E.L.; Buckley, D.H. Phenolic acid-degrading Paraburkholderia prime decomposition in forest soil. ISME Commun. 2021, 1, 4. [Google Scholar] [CrossRef] [PubMed]
  48. Mandal, S.M.; Chakraborty, D.; Dey, S. Phenolic acids act as signaling molecules in plant-microbe symbioses. Plant Signal. Behav. 2010, 5, 359–368. [Google Scholar] [CrossRef] [PubMed]
  49. Sofo, A.; Ciarfaglia, A.; Scopa, A.; Camele, I.; Curci, M.; Crecchio, C.; Xiloyannis, C.; Palese, A.M. Soil microbial diversity and activity in a Mediterranean olive orchard using sustainable agricultural practices. Soil Use Manag. 2014, 30, 160–167. [Google Scholar] [CrossRef]
  50. Lupwayi, N.Z.; Rice, W.A.; Clayton, G.W. Soil microbial diversity and community structure under wheat as influenced by tillage and crop rotation. Soil Biol. Biochem. 1998, 30, 1733–1741. [Google Scholar] [CrossRef]
  51. Robin Svensson, J.; Lindegarth, M.; Jonsson, P.R.; Pavia, H. Disturbance-diversity models: What do they really predict and how are they tested? Proc. R. Soc. B Biol. Sci. 2012, 279, 2163–2170. [Google Scholar] [CrossRef]
  52. Bongiorno, G.; Bünemann, E.K.; Brussaard, L.; Mäder, P.; Oguejiofor, C.U.; de Goede, R.G.M. Soil management intensity shifts microbial catabolic profiles across a range of European long-term field experiments. Appl. Soil Ecol. 2020, 154, 103596. [Google Scholar] [CrossRef]
  53. Zhang, X.; Johnston, E.R.; Barberán, A.; Ren, Y.; Wang, Z.; Han, X. Effect of intermediate disturbance on soil microbial functional diversity depends on the amount of effective resources. Environ. Microbiol. 2018, 20, 3862–3875. [Google Scholar] [CrossRef]
Figure 1. Experimental design; ERM: extra radicular mycelium.
Applmicrobiol 04 00113 g001
Figure 2. Heat map of optical density (O.D.) of C-type. Phase 1 from 1 to 7: 1—Soil before plant, 2—O. compressus after plant, 3—L. rigidum after plant, 4—S. gallica after plant, 5—O. compressus after disturbance, 6—L. rigidum after disturbance, and 7—S. gallica after disturbance. Phase 2 from 8 to 14: 8—wheat growth after O. compressus in soil undisturbed, 9—wheat growth after O. compressus in soil disturbed, 10—wheat growth after L. rigidum in soil undisturbed, 11—wheat growth after L. rigidum in soil disturbed, 12—wheat growth after S. gallica in soil undisturbed, 13—wheat growth after S. gallica in soil disturbed, and 14—wheat growth with no previous plants.
Applmicrobiol 04 00113 g002
Figure 3. Heat map of optical density (O.D.) of C source. Phase 1 from 1 to 7: 1—Soil before plant, 2—O. compressus after plant, 3—L. rigidum after plant, 4—S. gallica after plant, 5—O. compressus after disturbance, 6—L. rigidum after disturbance, and 7—S. gallica after disturbance. Phase 2 from 8 to 14: 8—wheat growth after O. compressus in soil undisturbed, 9—wheat growth after O. compressus in soil disturbed, 10—wheat growth after L. rigidum in soil undisturbed, 11—wheat growth after L. rigidum in soil disturbed, 12—wheat growth after S. gallica in soil undisturbed, 13—wheat growth after S. gallica in soil disturbed, and 14—wheat growth with no previous plants. For the full names of the carbon sources please check Table 3.
Applmicrobiol 04 00113 g003
Figure 4. (a) Score plot of the principal component analysis (PCA) of the C-type and (b) biplot of the PCA showing the C-type. Soil samples: BS—soil before plant; AP—after plant; AD—after disturbance; AWU—after wheat undisturbed treatment; AWD—after wheat disturbed treatment, and NPW—no plant before wheat. Plants: L—L. rigidum; O—O. compressus; S—S. gallica.
Applmicrobiol 04 00113 g004
Figure 5. (a) Score plot of the principal component analysis (PCA) of the C source and (b) biplot of the PCA showing the C source. Soil samples: BS—soil before plant; AP—after plant; AD—after disturbance; AWU—after wheat undisturbed treatment; AWD—after wheat disturbed treatment, and NPW—no plant before wheat. Plants: L—L. rigidum; O—O. compressus; S—S. gallica.
Applmicrobiol 04 00113 g005
Table 1. Effect of previous plant type and soil disturbance in the AWCD, Shannon Diversity Index, and Shannon Evenness Index in phase 1 of the experiment (ERM developers’ growth).
AWCDShannon Diversity (H′)Shannon Evenness (E)
Soil SamplingMean Plant Soil SamplingMean PlantSoil SamplingMean Plant
PlantsBPAPAD BPAPAD BPAPAD
O. compressus0.19g0.75c1.09a0.68A2.60c3.22a3.29a3.04A0.920.970.960.95
L. rigidum0.47e1.05b0.57B2.78bc3.21a2.87B0.910.960.93
S. gallica0.61d0.43f0.41C2.82bc3.02ab2.81B0.940.940.94
Mean soil sampling0.19C0.61B0.86A 2.60C2.94B3.17A 0.920.940.95
Values sharing different letters indicate significant differences between treatments at the 5% level (Tukey’s t-test). Abbreviations: AWCD: Average well color development; BP: Before planting; AP: After plant growth; AD: After soil disturbance.
Table 2. Effect of plant type and soil disturbance in the AWCD, Shannon Diversity Index, and Shannon Evenness Index in phase 2 of the experiment (after wheat growth).
AWCDShannon Diversity (H′)Shannon Evenness (E)
Soil SamplingMean Plant Soil SamplingMean PlantSoil SamplingMean Plant
PlantsUD UD UD
O. compressus1.06a0.90c0.98A3.433.363.391.000.970.98
L. rigidum0.65e1.01b0.83D3.363.423.390.980.990.99
S. gallica0.78d1.02b0.90C3.303.413.360.970.990.98
No Plant0.91 c0.91B3.373.370.990.99
Mean soil sampling0.85B0.96A 3.373.39 0.980.99
Values sharing different letters indicate significant differences between treatments at the 5% level (Tukey’s t-test). AWCD: Average well color development; U: undisturbed; D: disturbed.
Table 3. Correlation between substrate utilization and two principal components (PCs) from EcoPlate analysis. (A) C-type metabolism; (B) C source metabolism.
(A)
Variable C-TypePC1PC2
1Amines and amides0.3330.498
2Amino acids0.4130.036
3Carboxylic acids0.422−0.167
4Phenolic acids0.3280.457
5P_Cabon0.371−0.542
6Carbohydrates0.400−0.390
7Polymers0.3680.261
(B)
Variable C SourcePC1PC2
1phenylethylamine0.174−0.254
1putrescine0.199−0.049
2L-arginine0.183−0.219
2L-asparagine0.1480.189
2L-serine0.204−0.178
2L-threonine0.0820.305
2L-phenylalanine0.201−0.210
2glycyl-L-glutamic acid0.1680.120
3pyruvic acid methyl ester0.0250.333
3D-glucosaminic acid0.193−0.213
3D-galactonic acid γ-lactone0.1950.115
3D-galacturonic acid0.2380.047
3γ-hydroxybutyric acid0.156−0.020
3itaconic Acid0.1040.257
3α-ketobutyric acid0.134−0.267
3D-malic acid0.213−0.005
42-hydroxy benzoic acid0.190−0.118
44-hydroxy benzoic acid0.187−0.057
5glucose-1-phosphate0.2030.176
5D,L-α-glycerol phosphate0.227−0.057
6D-cellobiose0.2030.188
6α-D-lactose0.2030.191
6β-methyl-D-glucoside0.2070.173
6D-xylose0.169−0.274
6i-erythritol0.173−0.046
6D-mannitol0.1900.199
6N-acetyl-D-glucosamine0.2310.125
7tween 400.1430.082
7tween 800.0920.108
7α-cyclodextrin0.1700.083
7glycogen0.181−0.216
Disclaimer/Publisher’s Note: The statements, opinions and data contained in all publications are solely those of the individual author(s) and contributor(s) and not of MDPI and/or the editor(s). MDPI and/or the editor(s) disclaim responsibility for any injury to people or property resulting from any ideas, methods, instructions or products referred to in the content.

