Article

Multi-Omics Analysis of Mouse Fecal Microbiome Reveals Supplier-Dependent Functional Differences and Novel Metagenome-Assembled Genomes

by
Zachary L. McAdams
1,†,
Susheel Bhanu Busi
2,3,†,
Kevin L. Gustafson
4,
Nathan Bivens
5,
Craig L. Franklin
1,6,7,
Paul Wilmes
3,8 and
Aaron C. Ericsson
1,5,7,*
1
Molecular Pathogenesis and Therapeutics Program, University of Missouri, Columbia, MO 65201, USA
2
UK Centre for Ecology and Hydrology, Wallingford OX10 8BB, UK
3
Luxembourg Centre for Systems Biomedicine, University of Luxembourg, 6 Avenue du Swing, L-4367 Belvaux, Luxembourg
4
Department of Veterinary Pathobiology, University of Missouri, Columbia, MO 65201, USA
5
University of Missouri Genomics Technology Core Facility, University of Missouri, Columbia, MO 65201, USA
6
University of Missouri Metagenomics Center, University of Missouri, Columbia, MO 65201, USA
7
University of Missouri Mutant Mouse Resource and Research Center, University of Missouri, Columbia, MO 65201, USA
8
Department of Life Sciences and Medicine, University of Luxembourg, 6, Avenue du Swing, L-4367 Belvaux, Luxembourg
*
Author to whom correspondence should be addressed.
These authors contributed equally to this work.
Appl. Microbiol. 2024, 4(4), 1600-1615; https://doi.org/10.3390/applmicrobiol4040109
Submission received: 28 October 2024 / Revised: 26 November 2024 / Accepted: 28 November 2024 / Published: 30 November 2024
(This article belongs to the Special Issue Microbiome in Ecosystem, 3rd Edition)

Abstract

Host genetics and environmental factors have been associated with effects on the mouse fecal microbiome; however, the commercial source of mice remains the dominant factor. Increasing evidence indicates that supplier-specific microbiomes confer differences in disease susceptibility in models of inflammatory conditions, as well as baseline behavior and body morphology. However, current knowledge regarding the compositional differences between suppliers is based on targeted-amplicon sequencing data, and functional differences between these communities remain poorly defined. We applied a multi-omic (metagenomic and metatranscriptomic) approach to biomolecules extracted from murine feces representative of two U.S. suppliers of research mice, which differ in composition, and influence baseline physiology and behavior as well as disease severity in models of intestinal disease. We reconstructed high-quality metagenome-assembled genomes, frequently containing genomic content unique to each supplier. Transcriptional activity and pathway analyses revealed key functional differences between the metagenomes associated with each supplier including carbohydrate, fatty acid, and sulfite metabolism. These data provide a detailed characterization of the baseline differences in the fecal metagenome of mice from two U.S. commercial suppliers, suggesting that these functional differences are influenced by differences in the initial inoculum of colony founders, as well as additional taxa gained during growth of the production colony.

1. Introduction

Host-associated microbiomes, such as the gut microbiome (GM), exert strong effects on host physiology, susceptibility or resistance to various conditions, and response to treatment and dietary challenges. Investigations at the population level suggest that differences in the human GM are responsible for a large portion of the variability within individual host responses to a given dietary challenge [1,2] or medical treatment [3,4,5], implying that the GM is an important consideration in precision health and medicine strategies. Similarly, the GM of laboratory mice within the biomedical research community is highly variable due to numerous covariates (e.g., diet, bedding) [6,7], and these compositional differences have been associated with differences in host fitness in the context of uniform host genetics and environment [8,9,10,11,12]. One of the dominant factors contributing to the population-level variability in specific pathogen-free (SPF) mouse microbiomes is the commercial source of mice [13,14,15]. Previous studies have demonstrated reproducible differences in the GM richness and beta diversity, irrespective of host genotype (i.e., strain) within each supplier [12,13]. Specifically, the GM of mice supplied by The Jackson Laboratory and Inotiv (formerly Envigo) are characteristically of low and high richness, relative to each other, and each comprises unique taxa, in addition to an apparent core population of bacteria common to both sources. The latter includes members of the semi-standardized altered Schaedler flora (ASF) [16,17], reflecting the common procedures used to establish mouse production colonies on a commercial scale. Suppliers often surgically transfer embryos of the desired genotype to a pseudopregnant surrogate dam colonized with ASF, which then seeds the initial generation of offspring with that limited microbiome comprising eight to ten cultivable bacteria [18]. These mice are then used to establish multiple generations of filial mating to expand the colony, during which time mice are housed in large open-top caging systems and allowed to become colonized with additional bacteria from the environment. It is believed that subtle environmental differences are responsible for the reported supplier-origin differences, as well as the differences between multiple distribution facilities of the same supplier [13] or changes within a supplier over time [19,20].
However, GMs with different taxonomic compositions may possess qualitatively similar functional capacities [21,22]. It is therefore unclear whether the different GMs colonizing mice from The Jackson Laboratory and Inotiv are functionally different. Owing to the reported influence of these GMs in multiple mouse models of disease [23,24], we hypothesized that the compositional differences result in substantial functional differences, as evaluated by the metatranscriptome. Any detected differences in the functional capacity of the fecal microbiome could therefore be due to differences in the ASF isolates maintained by each institution, the environmental exposures during colony expansion, or both. As researchers continue to leverage the inherent differential effects of these complex GMs as a population-level model of human host–microbe interactions, it is important to understand the differences in the metagenome and transcriptional activity of mice from these different suppliers, and the origin of any detected differences. With those goals in mind, fecal samples from healthy adult CD-1 mice colonized with a The Jackson Laboratory-origin or Inotiv-origin GM (GMLow and GMHigh, respectively) were collected and used as the source of DNA and RNA for metagenomic and metatranscriptomic analyses using a re-iterative co-assembly procedure. We report here the identification of 86 high- and medium-quality novel and previously identified metagenome-assembled genomes (MAGs), analyzed and compared in the context of the two source GMs, and a detailed description of the functional differences between mice from these two commercial sources of SPF mice.

2. Materials and Methods

2.1. Mice and Sample Collection

Mice contributing fecal samples were eight-week-old, female, CD-1 mice produced by breeding colonies maintained at the MU Mutant Mouse Resource and Research Center (Columbia, MO, USA) in accordance with the Guide for the Care and Use of Laboratory Animals approved by the University of Missouri Institutional Animal Care and Use Committee (IACUC, protocol 9587). Mice colonized with GMLow or GMHigh [24] were housed in microisolator polycarbonate cages on individually ventilated racks, under positive pressure. All husbandry was performed in accordance with barrier conditions, including the use of autoclaved, irradiated chow, autoclaved, acidified water, and autoclaved bedding. Biweekly cage changes occurred in a laminar flow hood using bead-sterilized forceps to transfer mice between cages, by personnel wearing bleach-disinfected latex gloves. Mice were on a 12:12 light/dark cycle and were determined to be free of all known pathogens based on comprehensive quarterly sentinel testing through IDEXX BioAnalytics.
Fecal samples were collected by placing each mouse into an empty, autoclaved, microisolator cage, allowing the mouse to defecate normally, and collecting the pellet into a sterile 1 mL cryovial using an autoclaved wooden toothpick. Cryovials were then sealed and flash-frozen in liquid nitrogen. Separate fecal pellets were collected from each mouse for DNA and RNA extraction.

2.2. Power Analysis

A sample size of three mice per GM was selected to attain a power of 0.8 and a 5% alpha error rate. There are currently no published data similar to the present study on which to base sample size estimations; thus, we followed the recommendations of de Neis et al. [25] which used a similar sequencing approach and study design. Additionally, we relied upon previous targeted-amplicon sequencing analyses of GMLow and GMHigh which have revealed significant differences in beta diversity with a large effect size (ω2 = 0.467) [26].

2.3. DNA Extraction

Fecal DNA was extracted using PowerFecal kits (Qiagen, Hilden, Germany) per the manufacturer’s protocol, with the exception that the initial sample disaggregation was performed with a TissueLyser II (Qiagen), operated at 30 Hz. DNA yields were eluted in 50 µL sterile water, quantified using Qubit 2.0 fluorometer and Quant-iT dsDNA Broad Range (BR) Assay kits, and diluted to a uniform volume and concentration.

2.4. RNA Extraction

Fecal RNA was extracted using MagMAX mirVana Total RNA Isolation kits (Thermo Fisher, Waltham, MA, USA) per the manufacturer’s protocol. RNA yields were eluted in 50 µL sterile water, quantified using Qubit 2.0 fluorometer and Quant-iT RNA Broad Range Assay kits, and diluted to a uniform volume and concentration.

2.5. Metagenomic Library Preparation

Metagenomic libraries were generated from genomic DNA (250 ng) per the manufacturer’s protocol with reagents supplied in the Illumina DNA Prep, Tagmentation Kit (Illumina, San Diego, CA, USA). The sample concentration was determined using the Qubit dsDNA high-sensitivity (HS) assay kit (Thermo Fisher). Genomic DNA was fragmented, and short adapter sequences ligated to the ends by bead-link transposomes. Tagmented DNA was amplified using a minimum number of PCR cycles [5] to complete adapter sequences required for cluster generation and the addition of unique dual indexes. Final libraries were purified by addition of Axyprep Mag PCR Clean-up beads (Corning, Tewksbury, MA, USA). The final construct of each purified library was evaluated using the Fragment Analyzer, quantified using the Qubit HS dsDNA assay kit, and diluted according to Illumina’s standard sequencing protocol.

2.6. Metatranscriptomic Library Preparation

Metatranscriptomic libraries were generated from total RNA (800 ng) per the manufacturer’s protocol with reagents supplied in NEBNext® rRNA Depletion Kit (Bacteria; New England Biolabs, Ipswich, MA, USA) followed by fragmentation and synthesis of cDNA using the Illumina Stranded mRNA Prep, Ligation Kit. The sample concentration was determined using the Qubit RNA HS assay kit, and the RNA integrity checked using the Agilent Fragment Analyzer automated electrophoresis system. The rRNA was first removed from total RNA by hybridization probes using the NEBNext kit instead of poly-A RNA enrichment. The rRNA-depleted samples were then precipitated and fragmented, and double-stranded cDNA was generated from fragmented RNA, and short adapter sequences ligated to the ends. The cDNA constructs were amplified using a minimum number of PCR cycles [10] to complete adapter sequences required for cluster generation and the addition of unique dual indexes. The final libraries were purified by addition of Axyprep Mag PCR Clean-up beads. The final construct of each purified library was evaluated using the Fragment Analyzer, quantified using the Qubit HS dsDNA assay kit, and diluted according to Illumina’s standard sequencing protocol. Paired-end 150 base pair-length reads were sequences using an Illumina NovaSeq 6000 instrument (Illumina, San Diego, CA, USA). All six metagenomic and six metatranscriptomic libraries were pooled to yield approximately 40 Gb per metagenomic library and 190 million paired end reads per metatranscriptome library.

2.7. Meta-Omic Preprocessing, Assembly, Binning, and Analyses

For processing metagenomic sequence data, we used the Integrated Meta-omic Pipeline (IMP) workflow [27] to process paired forward and reverse reads using version 3.0 (commit# 9672c874; available at https://git-r3lab.uni.lu/IMP/imp3; Accessed on 15 January 2021). IMP includes pre-processing, assembly, genome reconstructions, and additional functional analysis of genes based on custom databases in a reproducible manner. Briefly, adapter trimming was followed by filtering the reads against the mouse reference genome (GRCm38, https://www.ncbi.nlm.nih.gov/assembly/GCF_000001635.20/; Accessed on 15 January 2021) to remove any reads mapping to the host, i.e., mice. Thereafter, an iterative co-assembly of both the metagenomic and metatranscriptomic reads using MEGAHIT v1.2.9 [28] was performed. Concurrently, MetaBAT2 v2.12.1 [29], MaxBin2 v2.2.7 [30], and binny [31] were used for binning the assembly, for reconstructing metagenome-assembled genomes (MAGs). Upon completion of binning, we used DASTool [32] to select a non-redundant set of MAGs using a recommended threshold score of 0.7. Furthermore, CheckM v1.1.3 [33] was used to assess the quality of the MAGs, and the GTDB-toolkit [34] was used to assign the taxonomy per MAG. To estimate the overall abundances of eukaryotes, EUKulele v1.0.5 [35] was used on the assemblies, with both the MMETSP and the PhyloDB databases. Each of the databases were run separately to confirm the detected eukaryotic profiles, whereby conflicts in assigned taxonomy were resolved by selecting the best hit score. To understand the overall metabolic and functional potential of the metagenome and reconstructed MAGs we used MANTIS [36] which annotates both assemblies and MAGs alike using several databases such as KEGG [37,38], PFAM [39], and CAZyme [40]. All the parameters, databases, and relevant code for the analyses described above are openly available at https://github.com/susheelbhanu/mice_multiomics_mmrrc (Accessed on 15 January 2021) and included in the Code availability section.

2.8. Phylogenomics, Pangenome Construction and Differential Analyses

To perform the pangenome analyses, bins with the same level of taxonomic resolution, i.e., genus or family level, were collected. They were subsequently subjected to the pangenome workflow as described here http://merenlab.org/2016/11/08/pangenomics-v2 (Accessed on 15 January 2021), by Meren et al. within the anvi’o [41] ecosystem. For the Saccharibacteria pangenome analysis, two existing genomes (accession IDs: CP040003 and CP040004.1) from Genbank were downloaded. The pangenome was run using the --min-bit 0.5, --mcl-inflation 10, and --min-occurrence 2 parameters, excluding the partial gene calls. A phylogenomic tree was built using MUSCLE v3.8.1551 [42] and FastTree2 v2.1.10 [43] on all single-copy gene clusters in the pangenome that were present in at least 30 genomes and had a functional homogeneity index below 0.9, and geometric homogeneity index above 0.9. The phylogenomic tree was used to order the genomes, the frequency of gene clusters (GC) to order the GC dendrogram. For the Saccharibacteria phylogenetic tree, we used the Entrez Direct tools available at https://www.ncbi.nlm.nih.gov/books/NBK179288/ (Accessed on 15 January 2021), to fetch all genomes labelled as ‘Saccharibacteria’, within NCBI. Following this, the genomes were input to the GToTree v1.5.51130 [44] pipeline with the -D parameter, allowing us to retrieve taxonomic information for the NCBI accessions, where the tree was built using ‘Bacteria and Archaea’ marker genes. Briefly, HMMER3 v3.3.2 [45] was used to retrieve the single-copy genes after gene-calling with Prodigal v2.6.3 [46] and aligned using TrimAl v1.4.rev15 [47]. The entire workflow is based on GNU Parallel v20210222134.

2.9. Data Analyses and Figures

The heatmaps were generated using the ggplot2 package while the volcano plots were built using the EnhancedVolcano package found at https://github.com/kevinblighe/EnhancedVolcano (Accessed on 15 January 2021). The correlation matrices were generated using the corrplot package. Furthermore, for the differential analyses, we used DESeq2 [48] with FDR and multiple-testing adjustments to assess enriched KOs, pathways, and expression levels. For the Saccharibacteria tree visualization the following packages from the R environment were used: ape, ggree, ggtreeExtra, and treeio.

3. Results

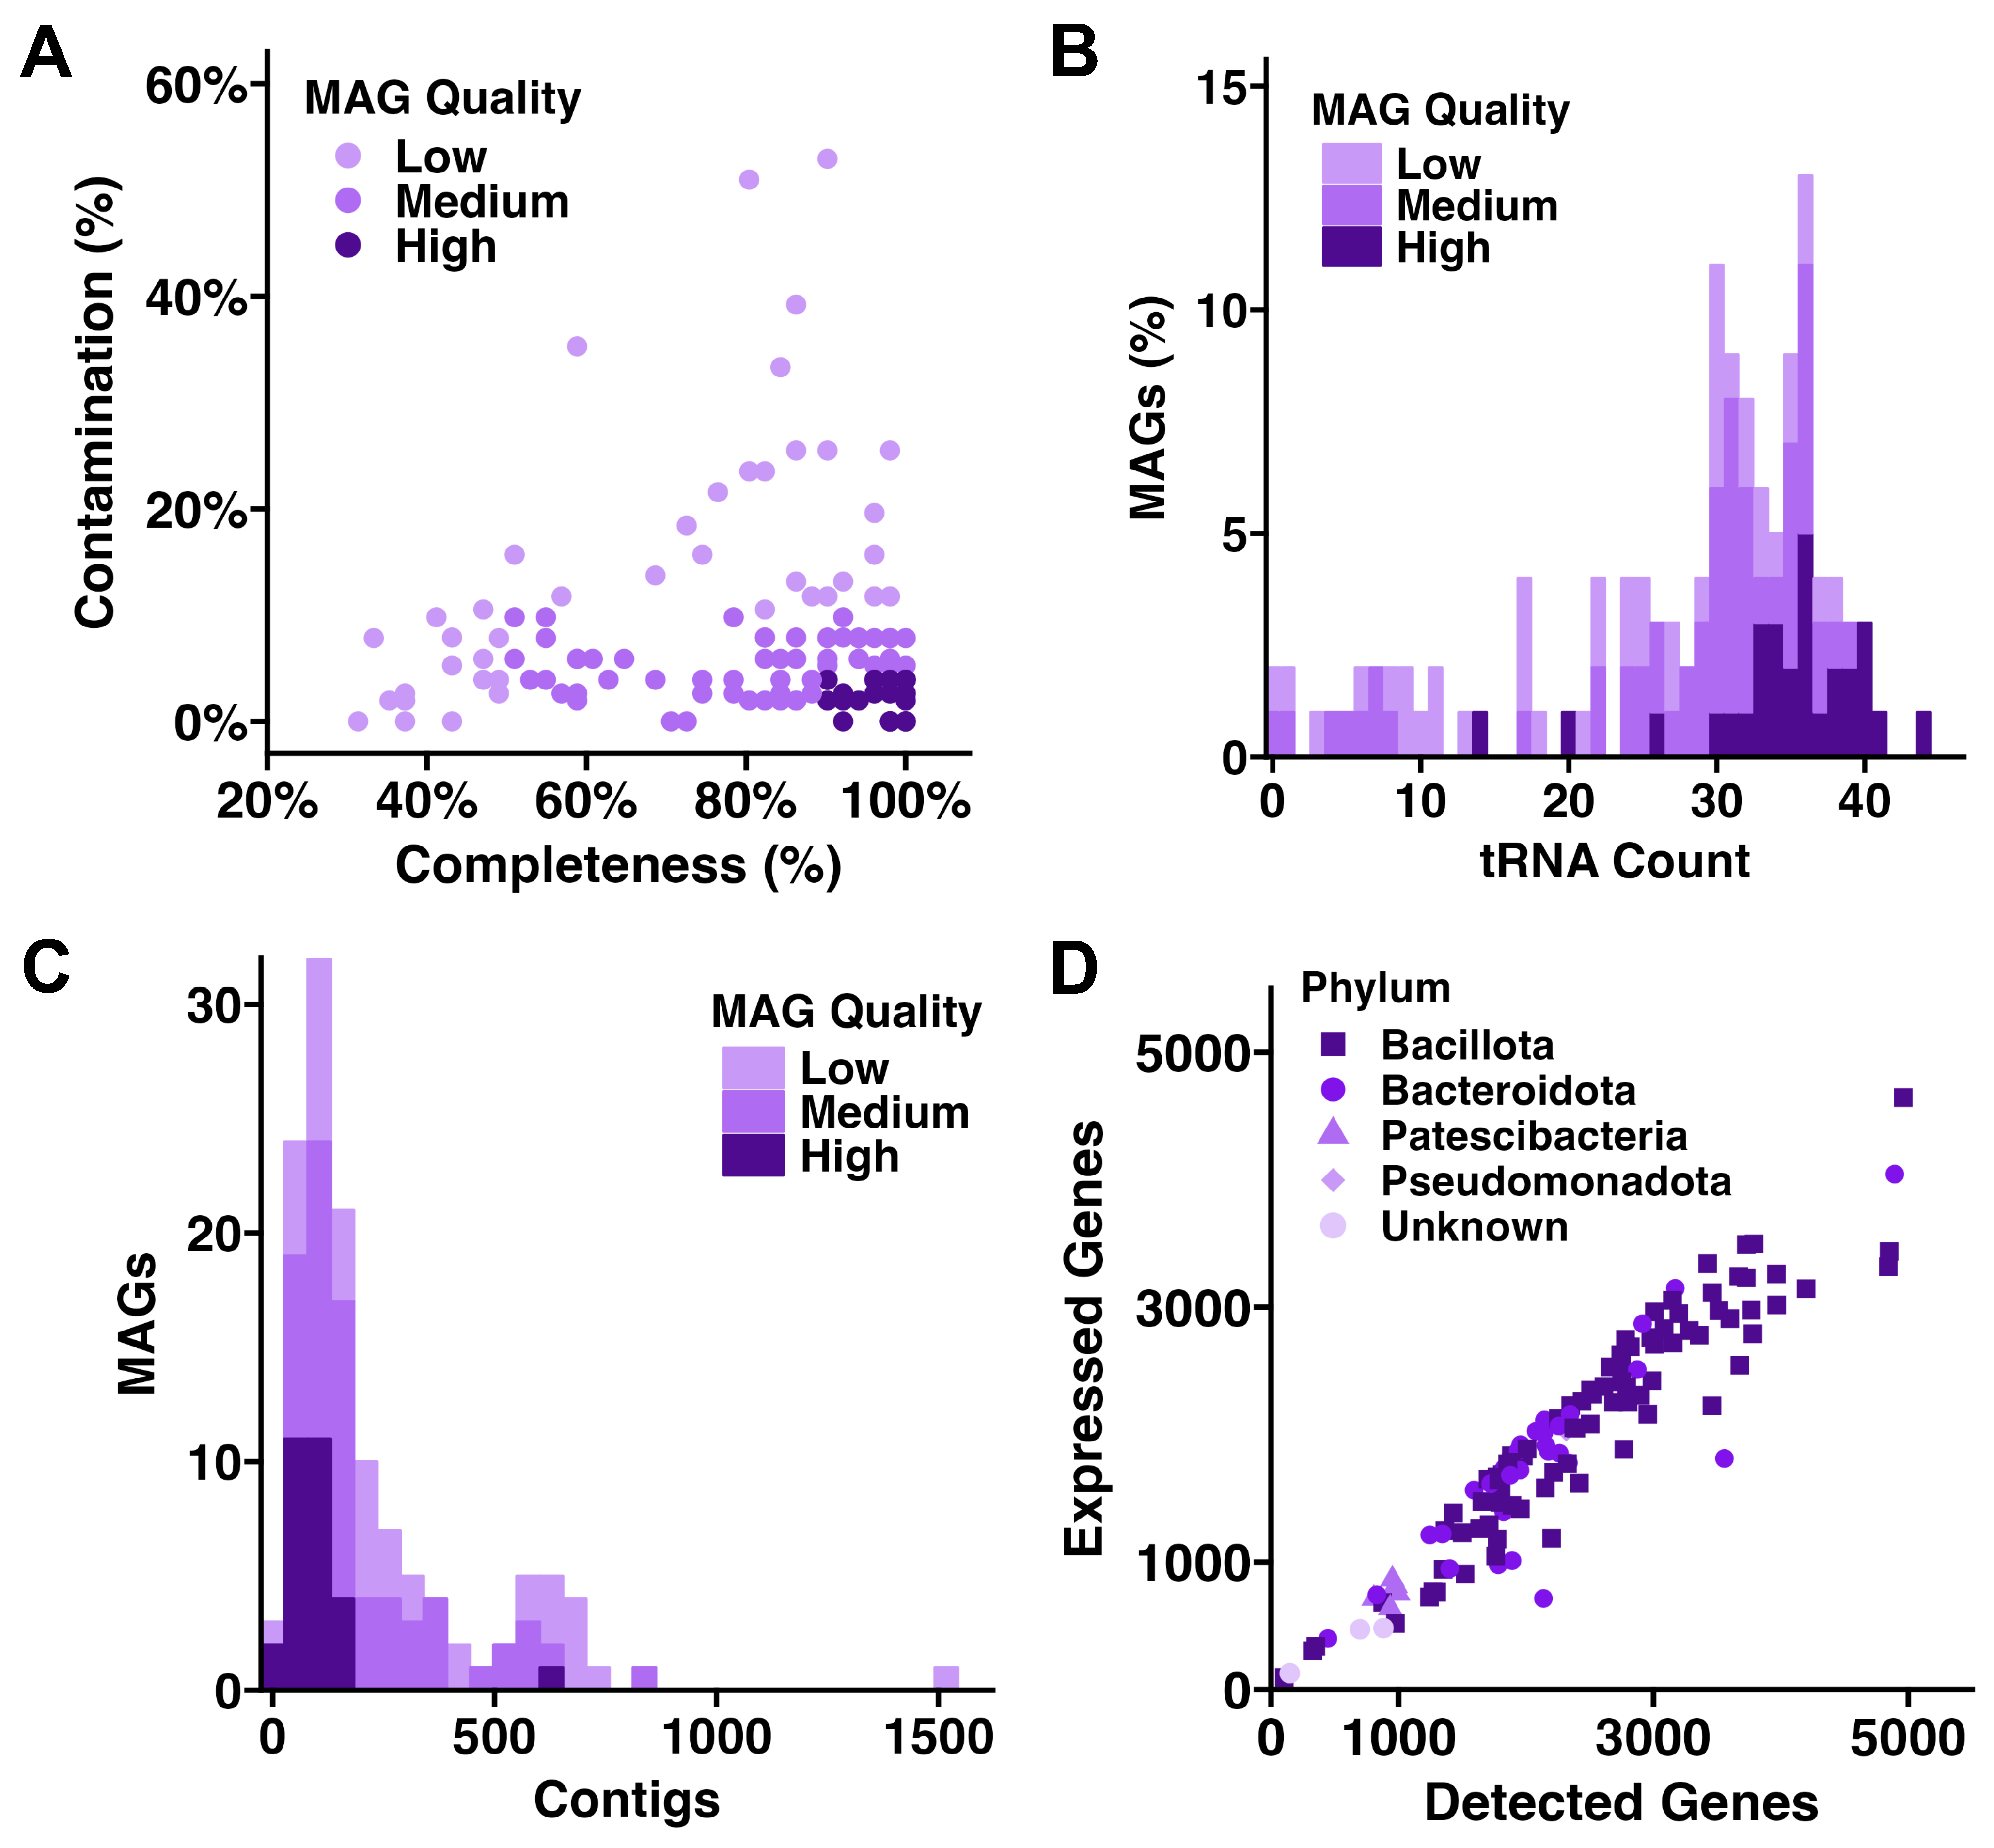
3.1. Metagenomic, Metatranscriptomic, and Taxonomic Summary

To establish a taxonomic and functional profile, using IMP [49] (v3, commit #9672c874; available at https://git-r3lab.uni.lu/IMP/imp3; Accessed on 15 January 2021), 2.09 × 10⁹ metagenomic and metatranscriptomic reads were co-assembled and binned into MAGs. Subsequently, the completeness and contamination were assessed using CheckM. Per established criteria in the field [50], 29 high-quality (>90% completion and <5% contamination) MAGs were identified in the entire dataset (Figure 1A). An additional 35 medium-quality (>80% completion and <10% contamination) MAGs, 22 medium-quality MAGs with completeness >50%, 17 low-quality (partial) MAGs with between 31% and 49% completeness, and 25 MAGs with >50% completeness but >10% contamination were identified (Figure 1A). A complete list of the 128 identified MAGs is provided as Supplementary Table S1. Over 75% of MAGs contained greater than 20 tRNA-encoding genes, with over half encoding 30 or more tRNA genes (Figure 1B). Over 75% of the 128 assembled MAGs had an average coverage of 10× or greater (median 24.4×, range 2.1× to 1540×; Supplementary Table S1) and roughly 65% of MAGs (including the majority of high-quality MAGS) were assembled from less than 200 scaffolds (Figure 1C). Comparison of metagenomic composition and the metatranscriptome revealed a strong correlation, suggesting transcriptional activity of the majority of detected genes (Figure 1D). As expected, there was also a strong correlation between the number of genes detected and the total size of the assembled MAGs (Supplementary Figure S1).
Of the 64 high- and medium-quality MAGs with >80% completion and <10% contamination listed in Supplementary Table S1, over one third (23/64) were identified as members of the Gram-positive family Lachnospiraceae (phylum Bacillota). The second most common family was the Gram-negative Muribaculaceae, within the phylum Bacteroidota. Other MAGs within the phylum Bacillota included several members of the Ruminococcaceae, Clostridiacae, Bacillaceae, and Lactobacillaceae, among others. Additional MAGs within the Bacteroidota included members of the genera Alistipes, Bacteroides, Parabacteroides, Odoribacter, and Prevotella. Six of the high- and medium-quality 64 MAGs in Supplementary Table S1 were external to either of those two dominant phyla, including one identified as Parasutterella excrementihominis (Burkholderiaceae within phylum Pseudomonadota), and five identified as members of the family Saccharimonadaceae (phylum Patescibacteria).

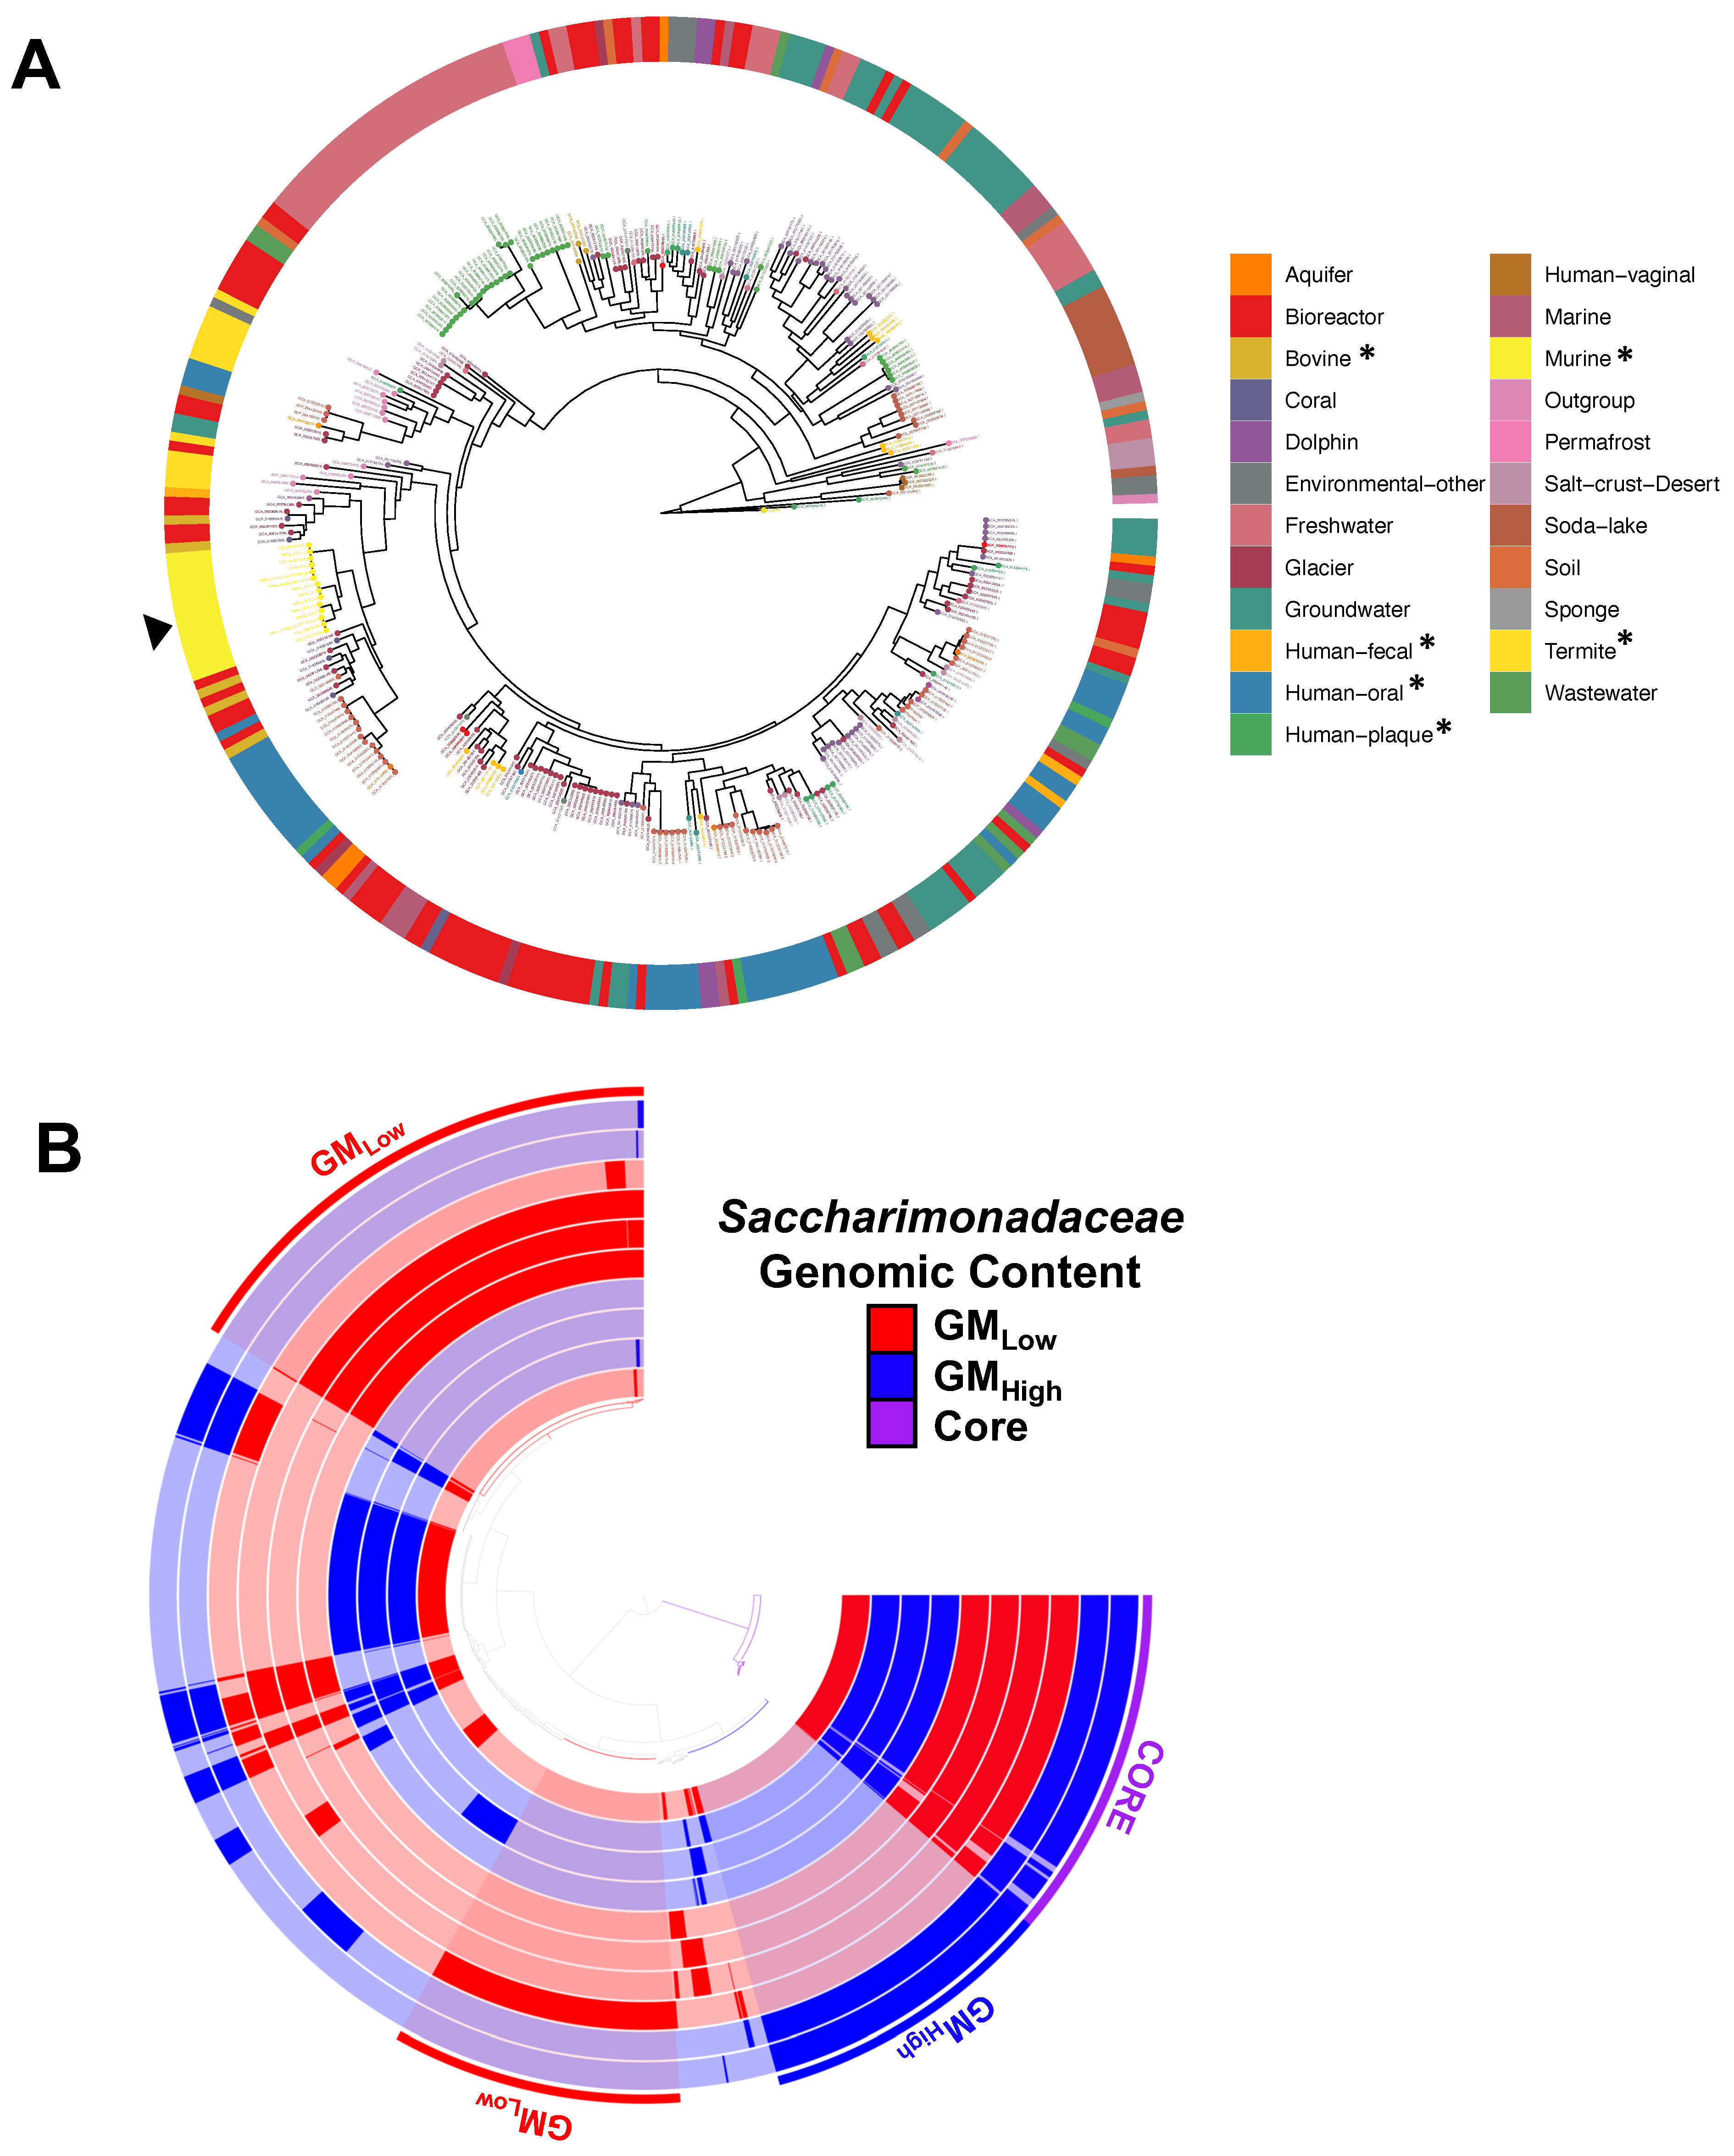
3.2. Candidate Phyla Radiation Taxa Demonstrate Strain-Level Differences Between Vendors

As newly recognized epibionts within the candidate phylum radiation (CPR), the Saccharimonadaceae were of particular interest since their reports in laboratory mouse strains are limited. MAGs identified as Saccharimonadaceae have been found in diverse environmental samples including deep sea hydrothermal vents, glacial-fed stream biofilms [51], and petrochemical plant sludge [52]. Regarding host-associated samples, Saccharimonadaceae are most commonly identified in human oral cavity samples [53,54], although a handful of rumen [55] and fecal [56] samples have also yielded MAGs. A thorough search of the National Center for Biotechnology Information Sequence Read Archive found 321 MAGs within this phylum, including four MAGs from mouse feces. Comparison of the phylogenetic relationship of the newly generated five MAGs within Saccharimonadaceae revealed similarity to other host-associated isolates, and particularly the mouse-origin MAGs (Figure 2A). Construction of a Saccharimonadaceae pangenome from the current data revealed portions of highly conserved core genomic content, and regions of genomic material specific to MAGs from either of the two supplier-dependent microbiomes (Figure 2B), suggesting that the vendors each harbor distinct strains of this taxonomy, with distinct functional capacities. These data also suggested the co-evolution and transfer of genetic material between bacterial strains within each source.

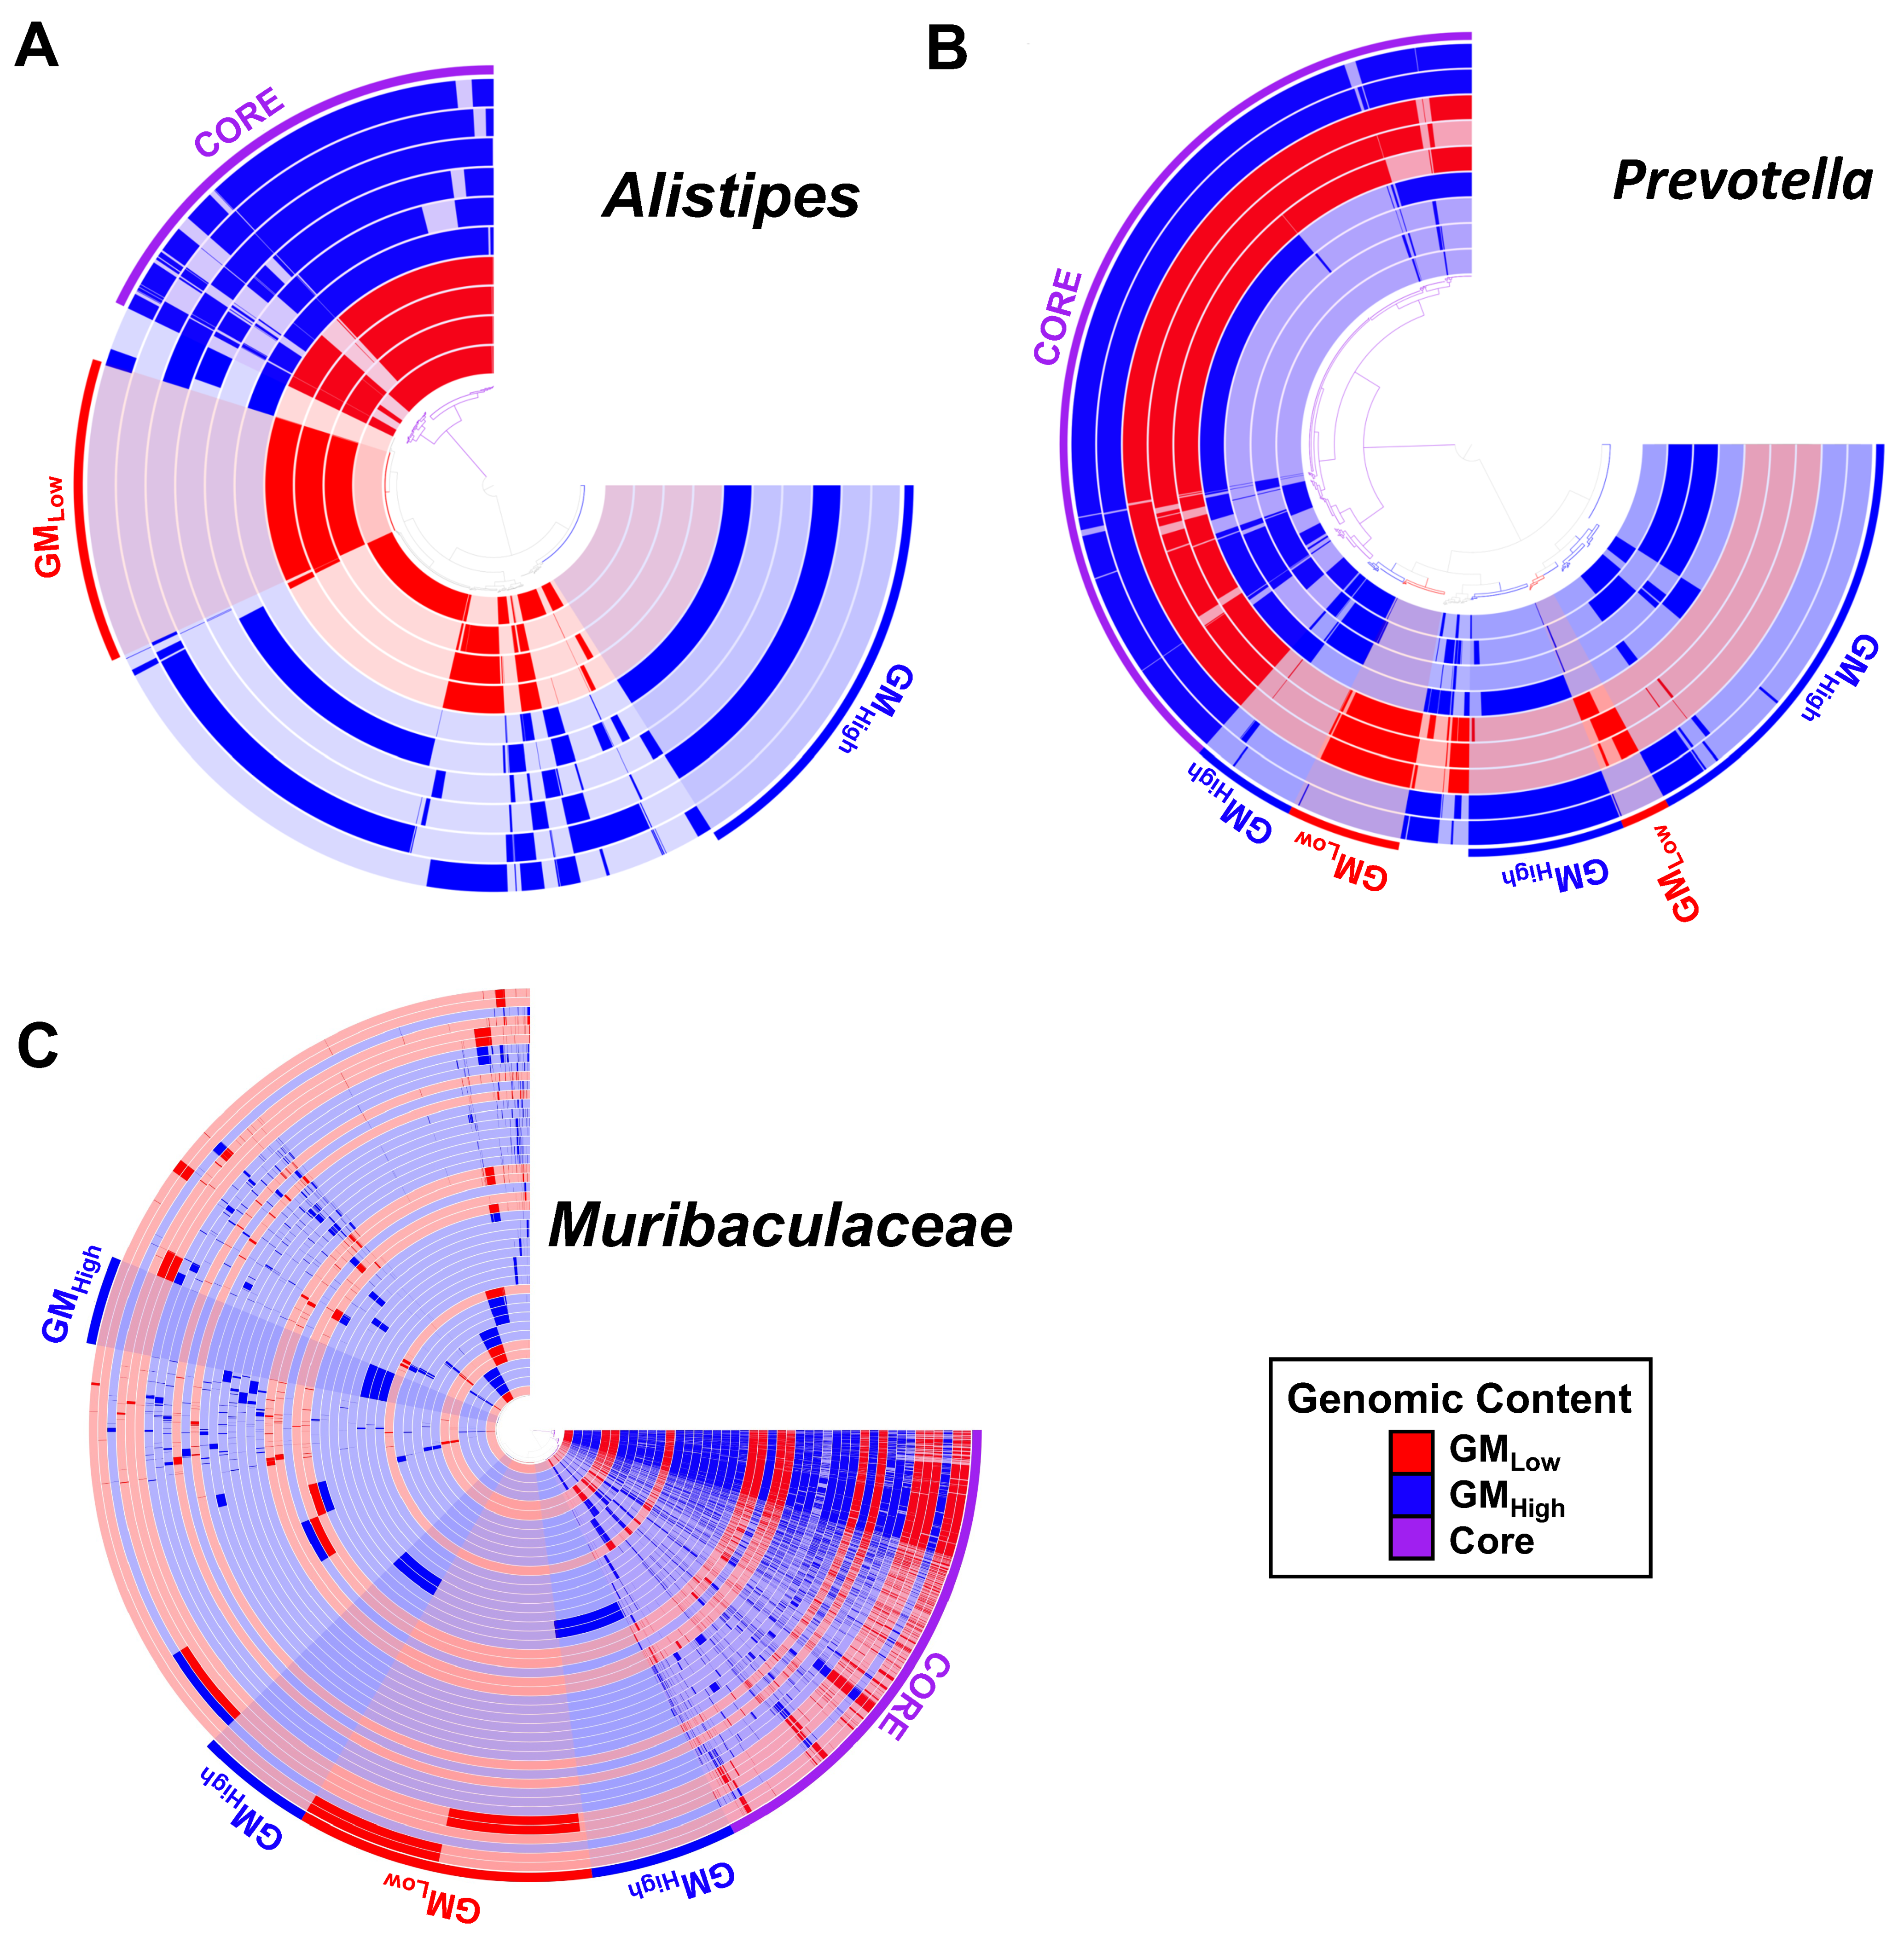
3.3. Distinct Source-Dependent MAGs Within Multiple Taxonomies

To further investigate the genomic heterogeneity within other common taxonomies, separate pangenomes were created for various members of the Gram-negative phylum Bacteroidota, including Alistipes spp. (10 MAGs, Figure 3A), Prevotella spp. (9 MAGs, Figure 3B), and family Muribaculaceae (17 MAGs, Figure 3C). As in the Saccharimonadaceae pangenome comparison, each genus or family revealed regions of genomic content conserved between multiple MAGs from each of the supplier-origin microbiomes, along with conserved core genomic content encoding for single copy gene (SCG) clusters, suggesting that the transfer of genetic material is an ongoing process within each of these taxonomies, at each production source. Similarly, pangenomes from members of the phylum Bacillota revealed conserved genomic content as well as source-dependent differences in the genomic content of MAGs, which may be interpreted as evidence of distinct lineages of taxonomies in mice from each supplier. Collectively, these data indicate the presence of substantial differences in the functional capacity of the dominant bacterial families detected in the microbiome of mice from different suppliers.

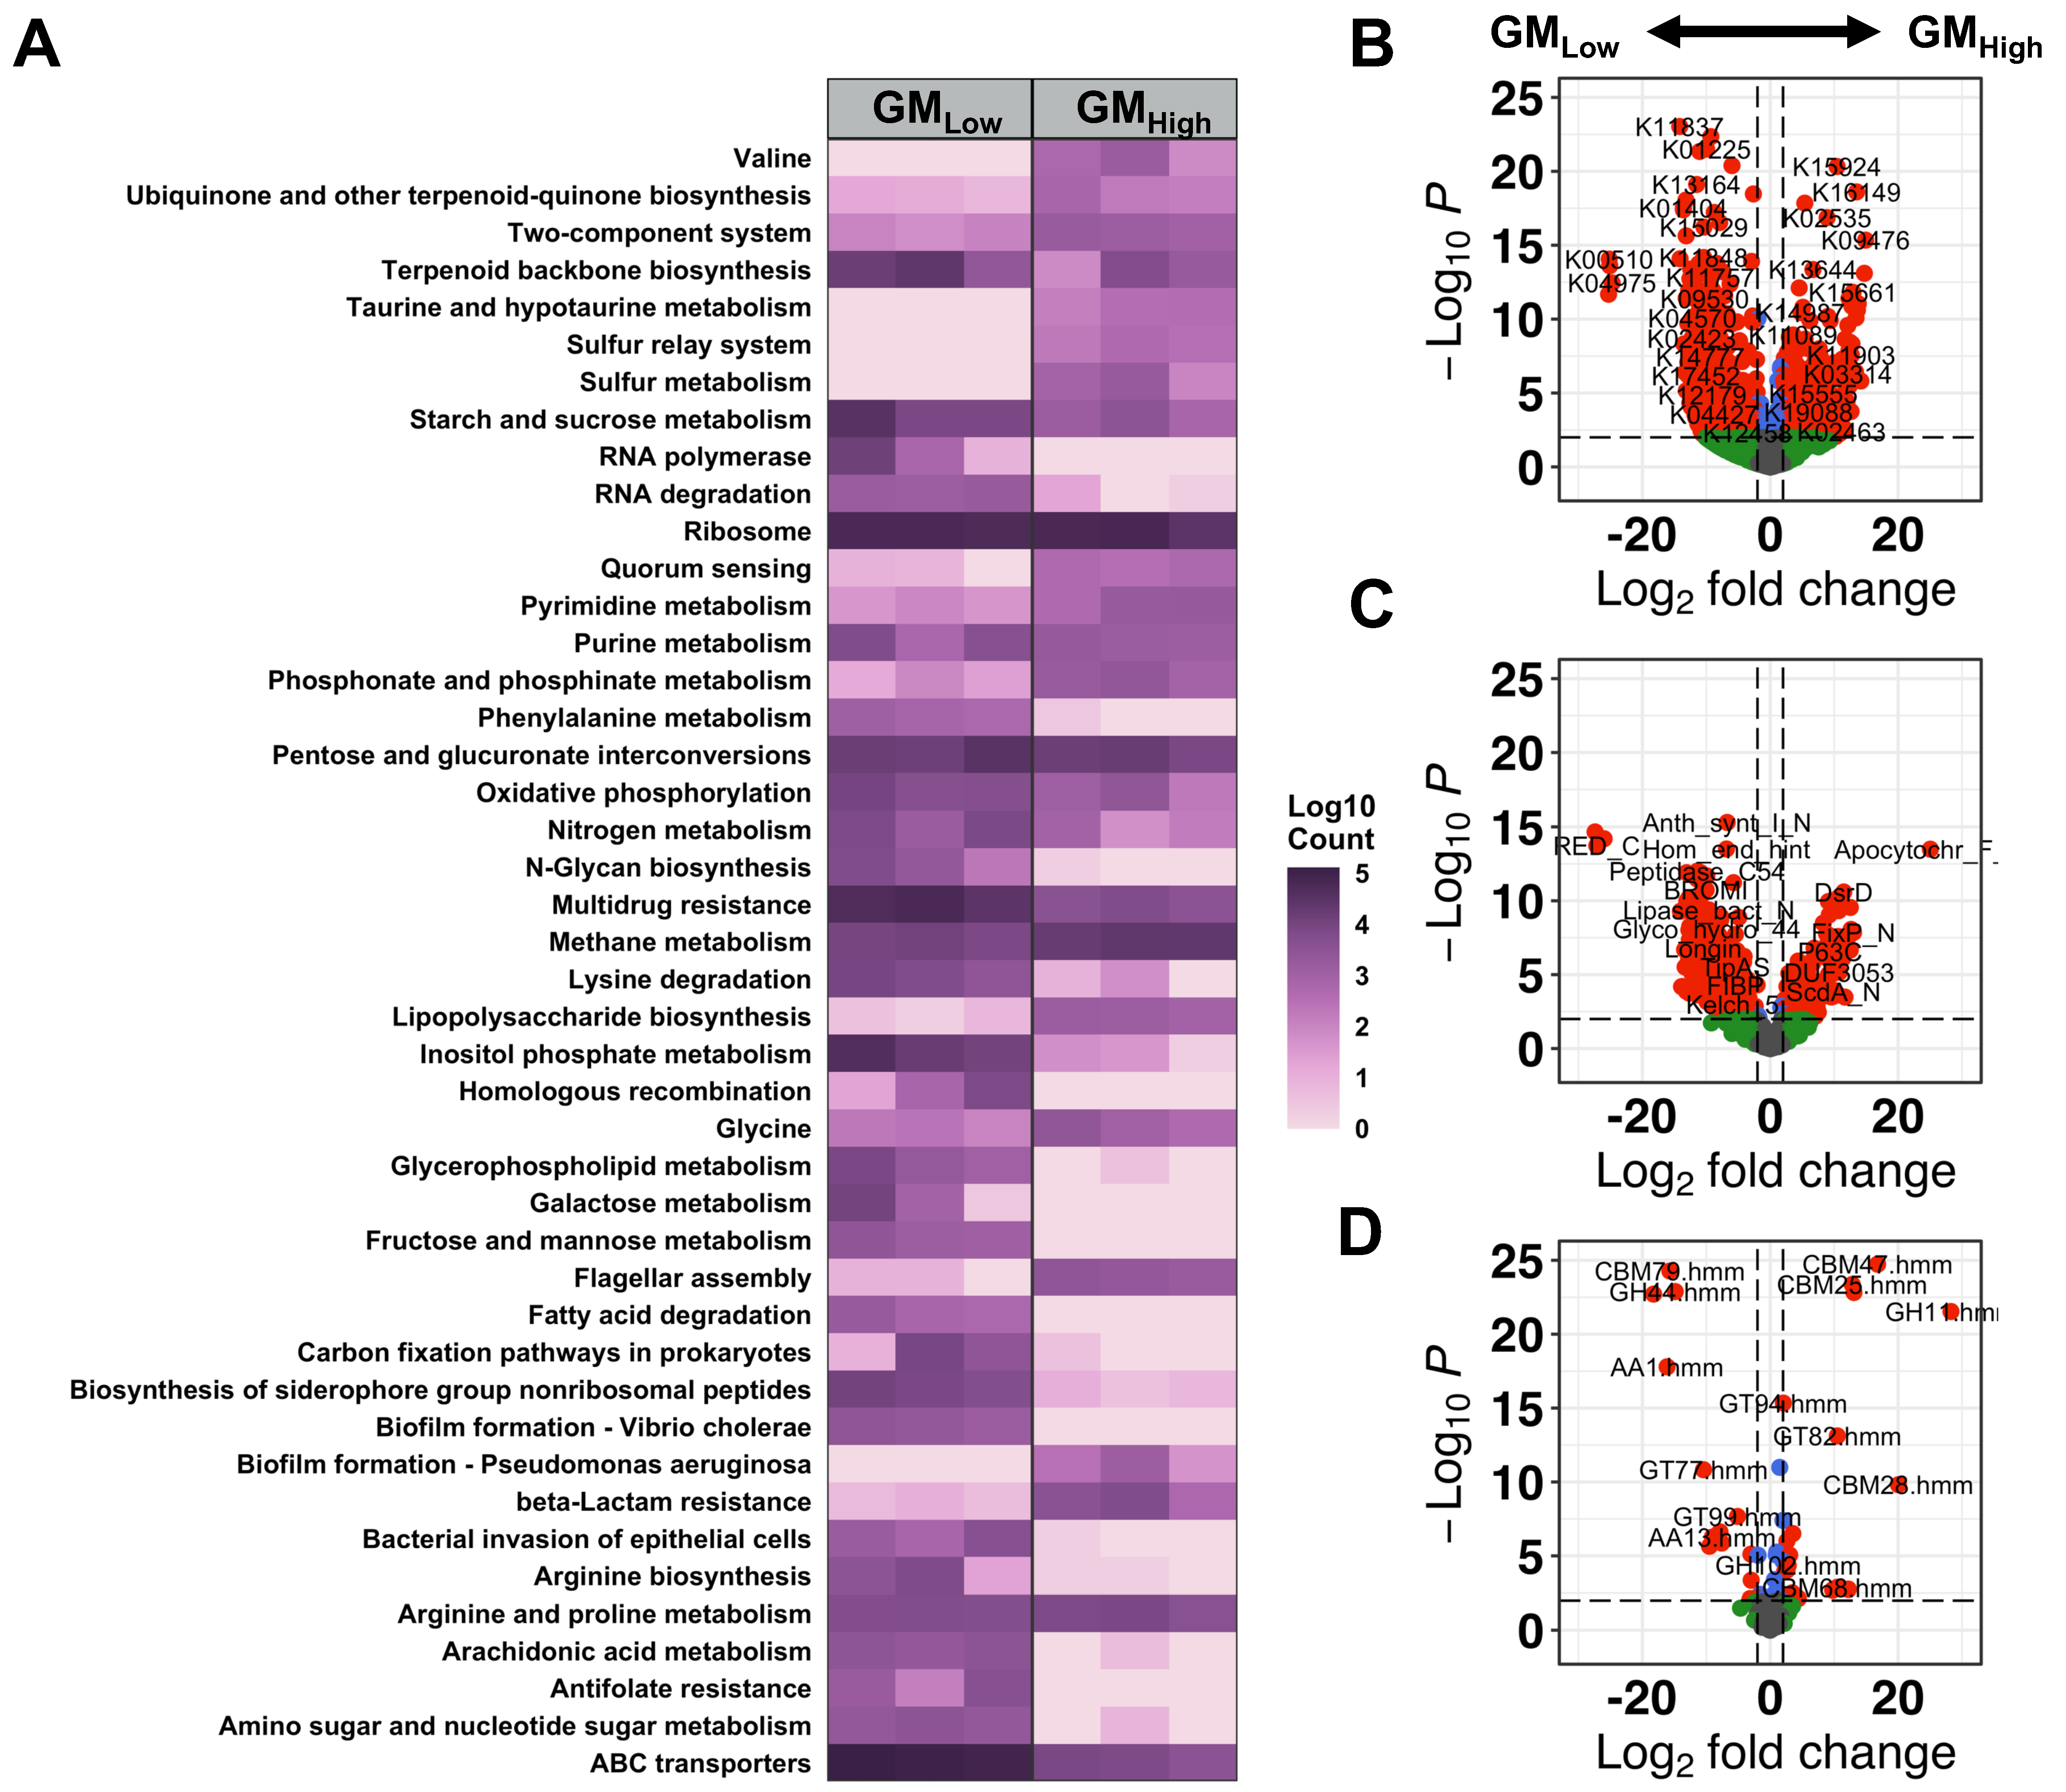
3.4. Functional Differences Between Source-Dependent GM

Based on the above observations and our original hypothesis, the metatranscriptome was compared between GM profiles to determine if the detected differences in metagenomic content were also associated with differences in transcriptional activity. Transcripts were compared to (and cross-referenced against) multiple databases, including the Kyoto Encyclopedia of Genes and Genomes (KEGG) [37,38], the Protein family (Pfam) database [39], and the CAZy database [40] of carbohydrate active enzymes and accessory molecules. Figure 4A shows KEGG-identified microbial-associated pathways comprising a multitude of differentially expressed KEGG orthologs (Figure 4B). A list of differentially expressed KEGG-identified host-associated pathways is shown in Supplementary Figure S2. Similarly, comparison of the bulk metatranscriptome annotations against the Pfam (Figure 4C) and CAZy (Figure 4D) databases resulted in many differences, with greater transcriptional activity of different genes in each GM. Supplementary File S1 lists all significantly differing KEGG, Pfam, and CAZyme annotations as determined by DESeq2 [48] (p < 0.05).
Source-dependent differences within the KEGG annotations included several GMLow- and GMHigh-specific genes involved in a wide range of functions. To increase our ability to discern biologically meaningful differences in the function of these GMs, the top 25% most significant KEGG IDs (lowest p values identified by DESeq2) found to significantly differ between GMLow and GMHigh were manually reviewed and curated to identify multiple KEGG IDs within a pathway, and thus likely representing true differences in the functional activity of that pathway (Figure 4A,B). Several GMLow-specific genes involved in diverse metabolic functions were identified including starch and sucrose (CBH1, K01225; SI, K01203), fructose and mannose (algG, K01795; mtlK, K00045), arachidonic acid (EPHX2, K08726), and phenylalanine (mhpF, K04073; DDC, K1593) metabolism.
Source-dependent differences within the KEGG annotations also included several GMHigh-specific genes involved in numerous functions, including flagellar assembly (flgH, K02393; flgI, K02394, flgA, K02386), quorum sensing (srfATE, K15657), lipopolysaccharide biosynthesis (lpxC, K02535; lpxI, K09949), and sulfur metabolism (dsrA, K11180). Pfam annotations also identified increased expression of genes within the dissimilatory sulfite reduction pathway (DsrC, DsrD, and FdhE) and chemotactic responses (CheZ, TarH) by bacteria within GMHigh. Among the many genes found to be differentially expressed, patterns emerged suggesting increased activity of certain pathways in GMHigh, including the tricarboxylic acid (TCA) cycle and cytochrome c oxidase activity. Increased TCA cycle activity is suggested by increased expression of enzymes within the TCA cycle (succinate dehydrogenase D; sdhD); enzymes involved in acetyl-CoA production (malonyl-CoA/succinyl-CoA reductase; mcr); three different ccb-type cytochrome c oxidase subunits (I, II, and III) and the fixS cytochrome c oxidase maturation protein; and the cytochrome c-type biogenic protein ccmE. Additionally, GMHigh had increased expression of enzymes associated with acetate (acetoacetate decarboxylase, adc), propanoate (methylmalonyl-CoA mutase, mcmA1), and butanoate production (mcr) using TCA cycle compounds, suggesting that the increased release of stored energy by the GM may be associated with increased production of compounds beneficial to the host such as short chain fatty acids (SCFAs).
Lastly, numerous source-dependent differences in carbohydrate active enzymes (CAZymes) and accessory molecules were identified (Figure 4D). The glycoside hydrolase (GH) family 48 (GH48.hmm), including chitinase and cellulobiohydrolases enzymes was differentially expressed in GMLow using both CAZyme and Pfam (Glyco_hydro_48) annotations. Other GMLow-associated CAZyme molecules included the auxiliary activities (AA) of multicopper oxidases (AA1.hmm) and glycosyltransferase (GT) families that bind the LPS inner core polysaccharide [57] (GT99.hmm) and the host-produced extracellular polysaccharide heparan [58] (GT64.hmm). GMHigh-associated CAZymes included multiple non-catalytic carbohydrate binding motifs (CBMs) with diverse targets including β-1,3-glucan and LPS (CBM39.hmm), cyclodextrins (CBM20.hmm), lactose (CBM71.hmm), and fucose (CBM47.hmm). CBMs specific to cellulose and chitin were identified in both GMLow (CBM2.hmm, CBM72.hmm) and GMHigh (CBM28.hmm). Collectively, these data demonstrate extensive differences in the baseline transcriptional activity at the enzyme and pathway levels of supplier-origin gut microbiomes.

3.5. Supplier-Origin GMs Indicate Variable Levels of Enzymatic Activity Associated with Eukaryotes

While most studies focus on bacterial abundances and differences, we observed eukaryotic organisms present within each GM (Methods). The largest portion of the eukaryotes identified belonged to the phylum Ochrophyta, followed by Dinoflagellata and Chlorophyta, all within the kingdom Protista (Supplemental Figure S3). Eukaryotes identified within the kingdom Fungi were constrained to the phylum Ascomycota with limited taxonomic resolution. No significant differences in the relative abundance of eukaryotic phyla were observed between GMs. Interestingly, while no differences in the relative abundance of eukaryotic phyla were observed between GMLow and GMHigh (Supplemental Figure S3), glycoside hydrolase CAZyme expression was negatively correlated with GMLow eukaryotes, while it was positively correlated to GMHigh eukaryotes (Supplemental Figure S4). Lastly, we identified several genes with increased expression in GMLow previously associated with a wide range of host metabolism and disease pathways (Supplementary Figure S2); however, the biological significance of the differential expression of these pathways remains unclear.

4. Discussion

GMLow and GMHigh influence many host phenotypes including intestinal inflammation [10], colonization resistance [23], and behavior and body morphology [26]. The robust taxonomic differences between these supplier-origin GMs influencing phenotypic differences have previously been identified using targeted amplicon (e.g., 16S rRNA) sequencing. However, this approach yields limited taxonomic resolution of detected amplicons, and a complete lack of information regarding functional capacity or transcriptional activity. Using an iterative co-assembly procedure, we combined metagenomic and metatranscriptomic sequencing of the fecal microbiome of laboratory mice to provide a valuable resource describing the baseline metagenomic and transcriptional differences of GMLow and GMHigh. The current data build upon earlier reports of differences in the composition of the GM in mice from different suppliers [23,24,59] by providing a more detailed assessment of those differences as well as functional differences.
Many of those functional differences were attributable to differences in bacteria associated with the ancestral ASF used in the colony founders, including Lactobacillus murinus (ASF361) and L. intestinalis (ASF360). These differences could therefore ostensibly be controlled or changed during the initiation of new production colonies. An additional notable aspect of the source-dependent differences in Lactobacillus function is the growing body of evidence supporting Lactobacillus spp. as a source of psychobiotics [60], or live organisms capable of conferring benefits to mental health when ingested. Recent studies have demonstrated differences in anxiety-related behavior and spontaneous locomotor and exploratory behavior between isogenic mice harboring GMLow or GMHigh [26] and L. intestinalis and related species have both been shown to confer vagus nerve-dependent effects on behavior [61,62,63]. Differences in the genomic content of these MAGs provides one possible explanation for the host phenotypic differences.
Numerous differentially expressed KEGG orthologs representing several microbial- and host-associated pathways were identified between the supplier-origin GMs (Figure 4A,B, Supplemental Figure S2). Consistent with the previously reported differences in Pseudomonadota [13] of GMLow relative to GMHigh, GMLow was associated with decreased expression of genes related to lipopolysaccharide biosynthesis and flagellar assembly. Low richness microbiomes have been associated with increased body weight, growth [64], and intestinal inflammation [10]. Here we have identified that, in addition to fatty acid degradation, multiple carbohydrate metabolic pathways including starch and sucrose, galactose, and fructose metabolism were increased in the low-richness GM. The differential expression of these metabolic pathways may increase energy availability to the host, likely contributing to the GMLow-associated increase in body weight and growth [26] and increased intestinal inflammation in models of intestinal disease [10,65,66].
A differentially expressed KEGG pathway in GMHigh that can be linked to previously recognized compositional differences is the dissimilatory sulfite reduction pathway, expressed by sulfate-reducing bacteria such as Desulfovibrio and Bilophila spp. These taxa, identified as unique GMHigh-associated features [67], are responsible for the production of H2S, a compound with biphasic effects on inflammation, hypertension, and tumorigenesis depending on its intra- and extracellular concentrations [68,69,70,71,72,73,74]. Thus, augmentation of intracellular H2S production by luminal sulfate-reducing bacteria may result in the low levels adequate to confer protective effects in certain scenarios, or sufficiently high to adversely influence disease susceptibility in others.
These data are also of interest from an evolutionary perspective, as they provide a glimpse of the short-term evolutionary landscape within the GM at each supplier. Pathogenic bacteria frequently undergo rapid evolution within a host organism through recombination and mutation [75,76], and the same events occur between and within commensal members of the microbiota [77,78]. Moreover, pathobionts can arise from commensal organisms through the same mechanisms [79]. In the data presented here, the consistent finding of source-specific genomic content within genera suggests separate evolutionary trajectories at each supplier, occurring in all dominant taxonomies with multiple closely related members. Notably, this feature was particularly evident in the relatively small pangenome of Saccharimonadaceae. These findings are in agreement with the recent study from Yilmaz et al. demonstrating the long-term evolution of microbiota and development of multiple co-existing substrains of bacteria within individual taxonomies [80].
Lastly, we were surprised to recover a large number of high-quality MAGs associated with the family Saccharimonadaceae (formerly known as TM7), epibionts [81,82] which were unrecognized until their identification using molecular methods. Successful culture requires co-culture with the cognate host bacteria, including Actinomyces odontolyticus and other members of the human oral cavity [82,83]. That being said, these highly auxotrophic epibionts with extremely limited genomes are found in virtually all environmental conditions while being surprisingly scarce in metagenomic data from fecal microbiomes. Our analysis agrees with that by Dinis et al. [84], which demonstrated that the vast majority of host-associated MAGs from this phylum were from human oral cavity samples or rumen contents, with much fewer fecal samples represented. It is unclear which bacteria serve as the host for fecal members of Saccharibacteria.
Despite these valuable findings, this work is not without limitation. These data were generated using untargeted metagenomic and metataxonomic sequencing of three female CD-1 mice colonized with one of two vendor-origin microbiomes. The sample size was selected based on the previously observed differences in beta diversity observed between the two communities using 16S rRNA sequencing [26], and indeed, we observed many robust differences in gene expression between these microbiomes (Figure 4). Future investigations will incorporate both sexes to account for potential sex-associated effects on microbial gene content or expression. However, given that the vendor-origin microbiomes are consistent between the sexes, similar differences in functional capacity and transcriptional activity are expected between them [26]. These data were also captured at a single timepoint in adult mice. Future investigations may incorporate longitudinal data to characterize the functional maturation of the host gut from birth to adulthood associating microbial metabolic features with key periods of host development.

5. Conclusions

Detecting differences in microbial diversity and composition between GMLow and GMHigh has previously relied upon targeted amplicon sequencing of the 16S rRNA gene [13,26]. While informative, this approach is limited by taxonomic resolution and does not provide the baseline functional capacity or transcriptional activity of these GMs. Our metagenomic and metatranscriptomic sequencing of GMLow and GMHigh has established that distinct differences in both the functional capacity and baseline transcriptional activity at the gene and metabolic pathway levels exist amongst the dominant taxa within supplier-origin GMs. Pursuing the contribution of the microbial functional differences associated with vendor-origin microbiomes may reveal novel microbiome-mediated mechanisms influencing animal models of health and disease. In doing so, these communities could be leveraged to discover novel microbiome-mediated therapeutics that may ultimately be translated into humans. Collectively, these data will serve as a valuable resource to leverage the host–microbiome relationship in mouse models of disease and behavior in future.

Supplementary Materials

The following supporting information can be downloaded at: https://www.mdpi.com/article/10.3390/applmicrobiol4040109/s1: Supplemental Figure S1. Dot plot representing the significant correlation between the number of detected genes and assembled MAG size (Mb). Supplementary Figure S2. Heatmaps of host-associated pathways differentially expressed in fecal metatranscriptomic data in Jackson (GMLow)- and Inotiv (GMHigh)-origin microbiomes. Supplementary Figure S3. Relative abundance heatmaps of phyla representing greater than 1% of eukaryotes in Jackson (GMLow)- and Envigo (GMHigh)-origin microbiomes. Supplementary Figure S4. Heatmaps demonstrating correlations between classes of CAZyme molecules and detected eukaryotes in GMLow and GMHigh. Supplementary File S1. Tables of differentially expressed KEGG, Pfam, and CAZyme genes. Supplementary Table S1. Complete list of 128 metagenome-assembled genomes detected in this study. Supplementary Table S2. List of BioSample accession IDs for each sample.

Author Contributions

Conceptualization, C.L.F. and A.C.E.; Data curation, Z.L.M., K.L.G., and N.B.; Formal analysis, Z.L.M., S.B.B., P.W., and A.C.E.; Investigation, S.B.B., K.L.G., N.B., and C.L.F.; Methodology, S.B.B., K.L.G., P.W., and A.C.E.; Resources, C.L.F. and P.W.; Software, P.W.; Visualization, Z.L.M. and S.B.B.; Writing—original draft, Z.L.M., S.B.B., and A.C.E.; Writing—review & editing, Z.L.M., S.B.B., K.L.G., N.B., C.L.F., P.W., and A.C.E. All authors have read and agreed to the published version of the manuscript.

Funding

This work was supported by the National Institutes of Health (NIH) under Grants R03 OD028259 and U42 OD010918. ZM was supported by the NIH under T32 GM008396. This project has received funding from the European Research Council (ERC) under the European Union’s Horizon 2020 research and innovation program (grant agreement No. 863664).

Data Availability Statement

Raw sequencing data samples and the MAGs are available at NCBI’s sequence read archive under BioProject accession PRJNA876568. The detailed code for the downstream analyses including the assemblies using IMP is available at https://github.com/susheelbhanu/mice_multiomics_mmrrc (Accessed 15 January 2021). The code used to generate the Figure 4 and Supplemental Figures S1–S3 is available at https://github.com/ericsson-lab/metaG_metaT (Accessed 15 January 2021).

Acknowledgments

We would like to thank the MMRRC for the donation of GMLow and GMHigh CD-1 mice.

Conflicts of Interest

The authors declare no conflicts of interest.

References

  1. Korem, T.; Zeevi, D.; Zmora, N.; Weissbrod, O.; Bar, N.; Lotan-Pompan, M.; Avnit-Sagi, T.; Kosower, N.; Malka, G.; Rein, M.; et al. Bread Affects Clinical Parameters and Induces Gut Microbiome-Associated Personal Glycemic Responses. Cell Metab. 2017, 25, 1243–1253.e5. [Google Scholar] [CrossRef] [PubMed]
  2. Zeevi, D.; Korem, T.; Zmora, N.; Israeli, D.; Rothschild, D.; Weinberger, A.; Ben-Yacov, O.; Lador, D.; Avnit-Sagi, T.; Lotan-Pompan, M.; et al. Personalized Nutrition by Prediction of Glycemic Responses. Cell 2015, 163, 1079–1094. [Google Scholar] [CrossRef] [PubMed]
  3. Matson, V.; Fessler, J.; Bao, R.; Chongsuwat, T.; Zha, Y.; Alegre, M.L.; Luke, J.J.; Gajewski, T.F. The Commensal Microbiome Is Associated with Anti-PD-1 Efficacy in Metastatic Melanoma Patients. Science 2018, 359, 104–108. [Google Scholar] [CrossRef] [PubMed]
  4. Routy, B.; Chatelier, E.L.; Derosa, L.; Duong, C.P.M.; Alou, M.T.; Daillere, R.; Fluckiger, A.; Messaoudene, M.; Rauber, C.; Roberti, M.P.; et al. Gut Microbiome Influences Efficacy of PD-1-Based Immunotherapy against Epithelial Tumors. Science 2018, 359, 91–97. [Google Scholar] [CrossRef] [PubMed]
  5. Gopalakrishnan, V.; Spencer, C.N.; Nezi, L.; Reuben, A.; Andrews, M.C.; Karpinets, T.V.; Prieto, P.A.; Vicente, D.; Hoffman, K.; Wei, S.C.; et al. Gut Microbiome Modulates Response to Anti-PD-1 Immunotherapy in Melanoma Patients. Science 2018, 359, 97–103. [Google Scholar] [CrossRef]
  6. Franklin, C.L.; Ericsson, A.C. Microbiota and Reproducibility of Rodent Models. Lab Anim. 2017, 46, 114–122. [Google Scholar] [CrossRef]
  7. Ericsson, A.C.; Gagliardi, J.; Bouhan, D.; Spollen, W.G.; Givan, S.A.; Franklin, C.L. The Influence of Caging, Bedding, and Diet on the Composition of the Microbiota in Different Regions of the Mouse Gut. Sci. Rep. 2018, 8, 4065. [Google Scholar] [CrossRef]
  8. Sofi, M.H.; Gudi, R.; Karumuthil-Melethil, S.; Perez, N.; Johnson, B.M.; Vasu, C. PH of Drinking Water Influences the Composition of Gut Microbiome and Type 1 Diabetes Incidence. Diabetes 2014, 63, 632–644. [Google Scholar] [CrossRef]
  9. Wolf, K.J.; Daft, J.G.; Tanner, S.M.; Hartmann, R.; Khafipour, E.; Lorenz, R.G. Consumption of Acidic Water Alters the Gut Microbiome and Decreases the Risk of Diabetes in NOD Mice. J. Histochem. Cytochem. 2014, 62, 237–250. [Google Scholar] [CrossRef]
  10. Hart, M.L.; Ericsson, A.C.; Franklin, C.L. Differing Complex Microbiota Alter Disease Severity of the IL-10−/− Mouse Model of Inflammatory Bowel Disease. Front. Microbiol. 2017, 8, 792. [Google Scholar] [CrossRef]
  11. Zhao, Y.; Tarbell, K.V. Comment on Sofi et al. PH of Drinking Water Influences the Composition of Gut Microbiome and Type 1 Diabetes Incidence. Diabetes 2014;63:632-644. Diabetes 2015, 64, e19. [Google Scholar] [CrossRef] [PubMed]
  12. Guo, Y.; Wang, Q.; Li, D.; Onyema, O.O.; Mei, Z.; Manafi, A.; Banerjee, A.; Mahgoub, B.; Stoler, M.H.; Barker, T.H.; et al. Vendor-specific Microbiome Controls Both Acute and Chronic Murine Lung Allograft Rejection by Altering CD4+Foxp3+ Regulatory T Cell Levels. Am. J. Transpl. 2019, 19, 2705–2718. [Google Scholar] [CrossRef] [PubMed]
  13. Ericsson, A.C.; Davis, J.W.; Spollen, W.; Bivens, N.; Givan, S.; Hagan, C.E.; McIntosh, M.; Franklin, C.L. Effects of Vendor and Genetic Background on the Composition of the Fecal Microbiota of Inbred Mice. PLoS ONE 2015, 10, e0116704. [Google Scholar] [CrossRef] [PubMed]
  14. Rasmussen, T.S.; de Vries, L.; Kot, W.; Hansen, L.H.; Castro-Mejia, J.L.; Vogensen, F.K.; Hansen, A.K.; Nielsen, D.S. Mouse Vendor Influence on the Bacterial and Viral Gut Composition Exceeds the Effect of Diet. Viruses 2019, 11, 435. [Google Scholar] [CrossRef]
  15. Hufeldt, M.R.; Nielsen, D.S.; Vogensen, F.K.; Midtvedt, T.; Hansen, A.K. Variation in the Gut Microbiota of Laboratory Mice Is Related to Both Genetic and Environmental Factors. Comp. Med. 2010, 60, 336–347. [Google Scholar]
  16. Orcutt, R.P.; Gianni, F.J.; Judge, R.J. Development of an “Altered” Schaedler Flora for NCI Gnotobiotic Rodents. Microecol. Ther. 1987, 17, 59. [Google Scholar]
  17. Schaedler, R.W.; Dubos, R.; Costello, R. The Development of the Bacterial Flora in the Gastrointestinal Tract of Mice. J. Exp. Med. 1965, 122, 59–66. [Google Scholar] [CrossRef]
  18. Dewhirst, F.E.; Chien, C.C.; Paster, B.J.; Ericson, R.L.; Orcutt, R.P.; Schauer, D.B.; Fox, J.G. Phylogeny of the Defined Murine Microbiota: Altered Schaedler Flora. Appl. Environ. Microb. 1999, 65, 3287–3292. [Google Scholar] [CrossRef]
  19. Mandal, R.K.; Denny, J.E.; Waide, M.L.; Li, Q.; Bhutiani, N.; Anderson, C.D.; Baby, B.V.; Jala, V.R.; Egilmez, N.K.; Schmidt, N.W. Temporospatial Shifts within Commercial Laboratory Mouse Gut Microbiota Impact Experimental Reproducibility. BMC Biol. 2020, 18, 83. [Google Scholar] [CrossRef]
  20. Hoy, Y.E.; Bik, E.M.; Lawley, T.D.; Holmes, S.P.; Monack, D.M.; Theriot, J.A.; Relman, D.A. Variation in Taxonomic Composition of the Fecal Microbiota in an Inbred Mouse Strain across Individuals and Time. PLoS ONE 2015, 10, e0142825. [Google Scholar] [CrossRef]
  21. Huttenhower, C.; Gevers, D.; Knight, R.; Abubucker, S.; Badger, J.H.; Chinwalla, A.T.; Creasy, H.H.; Earl, A.M.; FitzGerald, M.G.; Fulton, R.S.; et al. Structure, Function and Diversity of the Healthy Human Microbiome. Nature 2012, 486, 207–214. [Google Scholar] [CrossRef]
  22. Turnbaugh, P.J.; Hamady, M.; Yatsunenko, T.; Cantarel, B.L.; Duncan, A.; Ley, R.E.; Sogin, M.L.; Jones, W.J.; Roe, B.A.; Affourtit, J.P.; et al. A Core Gut Microbiome in Obese and Lean Twins. Nature 2009, 457, 480–484. [Google Scholar] [CrossRef] [PubMed]
  23. Velazquez, E.M.; Nguyen, H.; Heasley, K.T.; Saechao, C.H.; Gil, L.M.; Rogers, A.W.L.; Miller, B.M.; Rolston, M.R.; Lopez, C.A.; Litvak, Y.; et al. Endogenous Enterobacteriaceae Underlie Variation in Susceptibility to Salmonella Infection. Nat. Microbiol. 2019, 4, 1057–1064. [Google Scholar] [CrossRef] [PubMed]
  24. Hart, M.L.; Ericsson, A.C.; Lloyd, K.C.K.; Grimsrud, K.N.; Rogala, A.R.; Godfrey, V.L.; Nielsen, J.N.; Franklin, C.L. Development of Outbred CD1 Mouse Colonies with Distinct Standardized Gut Microbiota Profiles for Use in Complex Microbiota Targeted Studies. Sci. Rep. 2018, 8, 10107. [Google Scholar] [CrossRef]
  25. de Nies, L.; Busi, S.B.; Tsenkova, M.; Halder, R.; Letellier, E.; Wilmes, P. Evolution of the Murine Gut Resistome Following Broad-Spectrum Antibiotic Treatment. Nat. Commun. 2022, 13, 2296. [Google Scholar] [CrossRef]
  26. Ericsson, A.C.; Hart, M.L.; Kwan, J.; Lanoue, L.; Bower, L.R.; Araiza, R.; Lloyd, K.C.K.; Franklin, C.L. Supplier-Origin Mouse Microbiomes Significantly Influence Locomotor and Anxiety-Related Behavior, Body Morphology, and Metabolism. Commun. Biol. 2021, 4, 716. [Google Scholar] [CrossRef] [PubMed]
  27. Narayanasamy, S.; Jarosz, Y.; Muller, E.E.L.; Heintz-Buschart, A.; Herold, M.; Kaysen, A.; Laczny, C.C.; Pinel, N.; May, P.; Wilmes, P. IMP: A Pipeline for Reproducible Reference-Independent Integrated Metagenomic and Metatranscriptomic Analyses. Genome Biol. 2016, 17, 260. [Google Scholar] [CrossRef]
  28. Li, D.; Liu, C.-M.; Luo, R.; Sadakane, K.; Lam, T.-W. MEGAHIT: An Ultra-Fast Single-Node Solution for Large and Complex Metagenomics Assembly via Succinct de Bruijn Graph. Bioinformatics 2015, 31, 1674–1676. [Google Scholar] [CrossRef]
  29. Kang, D.D.; Li, F.; Kirton, E.; Thomas, A.; Egan, R.; An, H.; Wang, Z. MetaBAT 2: An Adaptive Binning Algorithm for Robust and Efficient Genome Reconstruction from Metagenome Assemblies. PeerJ 2019, 7, e7359. [Google Scholar] [CrossRef]
  30. Wu, Y.-W.; Simmons, B.A.; Singer, S.W. MaxBin 2.0: An Automated Binning Algorithm to Recover Genomes from Multiple Metagenomic Datasets. Bioinformatics 2016, 32, 605–607. [Google Scholar] [CrossRef]
  31. Hickl, O.; Queirós, P.; Wilmes, P.; May, P.; Heintz-Buschart, A. Binny: An Automated Binning Algorithm to Recover High-Quality Genomes from Complex Metagenomic Datasets. bioRxiv 2022. [Google Scholar] [CrossRef] [PubMed]
  32. Sieber, C.M.K.; Probst, A.J.; Sharrar, A.; Thomas, B.C.; Hess, M.; Tringe, S.G.; Banfield, J.F. Recovery of Genomes from Metagenomes via a Dereplication, Aggregation and Scoring Strategy. Nat. Microbiol. 2018, 3, 836–843. [Google Scholar] [CrossRef] [PubMed]
  33. Parks, D.H.; Imelfort, M.; Skennerton, C.T.; Hugenholtz, P.; Tyson, G.W. CheckM: Assessing the Quality of Microbial Genomes Recovered from Isolates, Single Cells, and Metagenomes. Genome Res. 2015, 25, 1043–1055. [Google Scholar] [CrossRef] [PubMed]
  34. Chaumeil, P.-A.; Mussig, A.J.; Hugenholtz, P.; Parks, D.H. GTDB-Tk: A Toolkit to Classify Genomes with the Genome Taxonomy Database. Bioinformatics 2019, 36, 1925–1927. [Google Scholar] [CrossRef]
  35. Krinos, A.; Hu, S.; Cohen, N.; Alexander, H. EUKulele: Taxonomic Annotation of the Unsung Eukaryotic Microbes. J. Open Source Softw. 2021, 6, 2817. [Google Scholar] [CrossRef]
  36. Queirós, P.; Delogu, F.; Hickl, O.; May, P.; Wilmes, P. Mantis: Flexible and Consensus-Driven Genome Annotation. Gigascience 2021, 10, giab042. [Google Scholar] [CrossRef]
  37. Kanehisa, M.; Furumichi, M.; Tanabe, M.; Sato, Y.; Morishima, K. KEGG: New Perspectives on Genomes, Pathways, Diseases and Drugs. Nucleic Acids Res. 2017, 45, D353–D361. [Google Scholar] [CrossRef]
  38. Kanehisa, M.; Goto, S. KEGG: Kyoto Encyclopedia of Genes and Genomes. Nucleic Acids Res. 2000, 28, 27–30. [Google Scholar] [CrossRef]
  39. Finn, R.D.; Coggill, P.; Eberhardt, R.Y.; Eddy, S.R.; Mistry, J.; Mitchell, A.L.; Potter, S.C.; Punta, M.; Qureshi, M.; Sangrador-Vegas, A.; et al. The Pfam Protein Families Database: Towards a More Sustainable Future. Nucleic Acids Res. 2016, 44, D279–D285. [Google Scholar] [CrossRef]
  40. Cantarel, B.L.; Coutinho, P.M.; Rancurel, C.; Bernard, T.; Lombard, V.; Henrissat, B. The Carbohydrate-Active EnZymes Database (CAZy): An Expert Resource for Glycogenomics. Nucleic Acids Res. 2009, 37, D233–D238. [Google Scholar] [CrossRef]
  41. Eren, A.M.; Esen, Ö.C.; Quince, C.; Vineis, J.H.; Morrison, H.G.; Sogin, M.L.; Delmont, T.O. Anvi’o: An Advanced Analysis and Visualization Platform for ‘omics Data. PeerJ 2015, 3, e1319. [Google Scholar] [CrossRef] [PubMed]
  42. Edgar, R.C. MUSCLE: A Multiple Sequence Alignment Method with Reduced Time and Space Complexity. BMC Bioinform. 2004, 5, 113. [Google Scholar] [CrossRef] [PubMed]
  43. Price, M.N.; Dehal, P.S.; Arkin, A.P. FastTree 2—Approximately Maximum-Likelihood Trees for Large Alignments. PLoS ONE 2010, 5, e9490. [Google Scholar] [CrossRef] [PubMed]
  44. Lee, M.D. GToTree: A User-Friendly Workflow for Phylogenomics. Bioinformatics 2019, 35, 4162–4164. [Google Scholar] [CrossRef]
  45. Eddy, S.R. Accelerated Profile HMM Searches. PLoS Comput. Biol. 2011, 7, e1002195. [Google Scholar] [CrossRef]
  46. Hyatt, D.; Chen, G.-L.; LoCascio, P.F.; Land, M.L.; Larimer, F.W.; Hauser, L.J. Prodigal: Prokaryotic Gene Recognition and Translation Initiation Site Identification. BMC Bioinform. 2010, 11, 119. [Google Scholar] [CrossRef]
  47. Capella-Gutiérrez, S.; Silla-Martínez, J.M.; Gabaldón, T. TrimAl: A Tool for Automated Alignment Trimming in Large-Scale Phylogenetic Analyses. Bioinformatics 2009, 25, 1972–1973. [Google Scholar] [CrossRef]
  48. Love, M.I.; Huber, W.; Anders, S. Moderated Estimation of Fold Change and Dispersion for RNA-Seq Data with DESeq2. Genome Biol. 2014, 15, 550. [Google Scholar] [CrossRef]
  49. Heintz-Buschart, A.; May, P.; Laczny, C.C.; Lebrun, L.A.; Bellora, C.; Krishna, A.; Wampach, L.; Schneider, J.G.; Hogan, A.; de Beaufort, C.; et al. Integrated Multi-Omics of the Human Gut Microbiome in a Case Study of Familial Type 1 Diabetes. Nat. Microbiol. 2016, 2, 16180. [Google Scholar] [CrossRef]
  50. Bowers, R.M.; Kyrpides, N.C.; Stepanauskas, R.; Harmon-Smith, M.; Doud, D.; Reddy, T.B.K.; Schulz, F.; Jarett, J.; Rivers, A.R.; Eloe-Fadrosh, E.A.; et al. Minimum Information about a Single Amplified Genome (MISAG) and a Metagenome-Assembled Genome (MIMAG) of Bacteria and Archaea. Nat. Biotechnol. 2017, 35, 725–731. [Google Scholar] [CrossRef]
  51. Busi, S.B.; Bourquin, M.; Fodelianakis, S.; Michoud, G.; Kohler, T.J.; Peter, H.; Pramateftaki, P.; Styllas, M.; Tolosano, M.; Staercke, V.D.; et al. Genomic and Metabolic Adaptations of Biofilms to Ecological Windows of Opportunity in Glacier-Fed Streams. Nat. Commun. 2022, 13, 2168. [Google Scholar] [CrossRef] [PubMed]
  52. Antunes, T.C.; Marconatto, L.; Borges, L.G.d.A.; Giongo, A.; Sand, S.T.V.D. Analysis of Microbial Community Biodiversity in Activated Sludge from a Petrochemical Plant. Rev. Ambient. Água—Interdiscip. J. Appl. Sci. 2021, 16, 1–22. [Google Scholar] [CrossRef]
  53. Lima, C.P.V.; Grisi, D.C.; Guimarães, M.D.C.M.; Salles, L.P.; Kruly, P.d.C.; Do, T.; Borges, L.G.D.A.; Dame-Teixeira, N. Enrichment of Sulphate-Reducers and Depletion of Butyrate-Producers May Be Hyperglycaemia Signatures in the Diabetic Oral Microbiome. J. Oral Microbiol. 2022, 14, 2082727. [Google Scholar] [CrossRef]
  54. Saito, D.; Lemos, L.N.; Ferreira, A.T.R.N.; Saito, C.P.B.; de Oliveira, R.F.; Cannavan, F.d.S.; Tsai, S.M. Draft Genome Sequences of Five Putatively Novel Saccharibacteria Species Assembled from the Human Oral Metagenome. Microbiol. Resour. Announc. 2022, 11, e00246-22. [Google Scholar] [CrossRef]
  55. Mousavi, S.H.; Motahar, S.F.S.; Salami, M.; Kavousi, K.; Mamaghani, A.S.A.; Ariaeenejad, S.; Salekdeh, G.H. In Vitro Bioprocessing of Corn as Poultry Feed Additive by the Influence of Carbohydrate Hydrolyzing Metagenome Derived Enzyme Cocktail. Sci. Rep. 2022, 12, 405. [Google Scholar] [CrossRef]
  56. Chen, Y.-F.; Hsieh, A.-H.; Wang, L.-C.; Huang, Y.-J.; Tsai, Y.-C.; Tseng, W.-Y.; Kuo, Y.-L.; Luo, S.-F.; Yu, K.-H.; Kuo, C.-F. Fecal Microbiota Changes in NZB/W F1 Mice after Induction of Lupus Disease. Sci. Rep. 2021, 11, 22953. [Google Scholar] [CrossRef]
  57. Lodowska, J.; Wolny, D.; Węglarz, L. The Sugar 3-Deoxy-d-Manno-Oct-2-Ulosonic Acid (Kdo) as a Characteristic Component of Bacterial Endotoxin—A Review of Its Biosynthesis, Function, and Placement in the Lipopolysaccharide Core. Can. J. Microbiol. 2013, 59, 645–655. [Google Scholar] [CrossRef]
  58. Cartmell, A.; Lowe, E.C.; Baslé, A.; Firbank, S.J.; Ndeh, D.A.; Murray, H.; Terrapon, N.; Lombard, V.; Henrissat, B.; Turnbull, J.E.; et al. How Members of the Human Gut Microbiota Overcome the Sulfation Problem Posed by Glycosaminoglycans. Proc. Natl. Acad. Sci. USA 2017, 114, 7037–7042. [Google Scholar] [CrossRef]
  59. Ivanov, I.I.; Atarashi, K.; Manel, N.; Brodie, E.L.; Shima, T.; Karaoz, U.; Wei, D.; Goldfarb, K.C.; Santee, C.A.; Lynch, S.V.; et al. Induction of Intestinal Th17 Cells by Segmented Filamentous Bacteria. Cell 2009, 139, 485–498. [Google Scholar] [CrossRef]
  60. Sarkar, A.; Lehto, S.M.; Harty, S.; Dinan, T.G.; Cryan, J.F.; Burnet, P.W.J. Psychobiotics and the Manipulation of Bacteria-Gut-Brain Signals. Trends Neurosci. 2016, 39, 763–781. [Google Scholar] [CrossRef]
  61. Wang, S.; Ishima, T.; Zhang, J.; Qu, Y.; Chang, L.; Pu, Y.; Fujita, Y.; Tan, Y.; Wang, X.; Hashimoto, K. Ingestion of Lactobacillus Intestinalis and Lactobacillus Reuteri Causes Depression- and Anhedonia-like Phenotypes in Antibiotic-Treated Mice via the Vagus Nerve. J. Neuroinflamm. 2020, 17, 241. [Google Scholar] [CrossRef] [PubMed]
  62. Bravo, J.A.; Forsythe, P.; Chew, M.V.; Escaravage, E.; Savignac, H.M.; Dinan, T.G.; Bienenstock, J.; Cryan, J.F. Ingestion of Lactobacillus Strain Regulates Emotional Behavior and Central GABA Receptor Expression in a Mouse via the Vagus Nerve. Proc. Natl. Acad. Sci. USA 2011, 108, 16050–16055. [Google Scholar] [CrossRef] [PubMed]
  63. Liang, S.; Wang, T.; Hu, X.; Luo, J.; Li, W.; Wu, X.; Duan, Y.; Jin, F. Administration of Lactobacillus Helveticus NS8 Improves Behavioral, Cognitive, and Biochemical Aberrations Caused by Chronic Restraint Stress. Neuroscience 2015, 310, 561–577. [Google Scholar] [CrossRef] [PubMed]
  64. Chatelier, E.L.; Nielsen, T.; Qin, J.; Prifti, E.; Hildebrand, F.; Falony, G.; Almeida, M.; Arumugam, M.; Batto, J.-M.; Kennedy, S.; et al. Richness of Human Gut Microbiome Correlates with Metabolic Markers. Nature 2013, 500, 541–546. [Google Scholar] [CrossRef]
  65. Vila, A.V.; Imhann, F.; Collij, V.; Jankipersadsing, S.A.; Gurry, T.; Mujagic, Z.; Kurilshikov, A.; Bonder, M.J.; Jiang, X.; Tigchelaar, E.F.; et al. Gut Microbiota Composition and Functional Changes in Inflammatory Bowel Disease and Irritable Bowel Syndrome. Sci. Transl. Med. 2018, 10, eaap8914. [Google Scholar] [CrossRef]
  66. Schirmer, M.; Garner, A.; Vlamakis, H.; Xavier, R.J. Microbial Genes and Pathways in Inflammatory Bowel Disease. Nat. Rev. Microbiol. 2019, 17, 497–511. [Google Scholar] [CrossRef]
  67. Moskowitz, J.E.; Andreatta, F.; Amos-Landgraf, J. The Gut Microbiota Modulates Differential Adenoma Suppression by B6/J and B6/N Genetic Backgrounds in Apc(Min) Mice. Mamm. Genome Off. J. Int. Mamm. Genome Soc. 2019, 30, 237–244. [Google Scholar] [CrossRef]
  68. Blachier, F.; Andriamihaja, M.; Larraufie, P.; Ahn, E.; Lan, A.; Kim, E. Production of Hydrogen Sulfide by the Intestinal Microbiota and Epithelial Cells and Consequences for the Colonic and Rectal Mucosa. Am. J. Physiol.-Gastrointest. Liver Physiol. 2021, 320, G125–G135. [Google Scholar] [CrossRef]
  69. Attene-Ramos, M.S.; Wagner, E.D.; Plewa, M.J.; Gaskins, H.R. Evidence That Hydrogen Sulfide Is a Genotoxic Agent. Mol. Cancer Res. MCR 2006, 4, 9–14. [Google Scholar] [CrossRef]
  70. Guo, F.F.; Yu, T.C.; Hong, J.; Fang, J.Y. Emerging Roles of Hydrogen Sulfide in Inflammatory and Neoplastic Colonic Diseases. Front. Physiol. 2016, 7, 156. [Google Scholar] [CrossRef]
  71. Flannigan, K.L.; Agbor, T.A.; Motta, J.P.; Ferraz, J.G.; Wang, R.; Buret, A.G.; Wallace, J.L. Proresolution Effects of Hydrogen Sulfide during Colitis Are Mediated through Hypoxia-Inducible Factor-1alpha. FASEB J. Off. Publ. Fed. Am. Soc. Exp. Biol. 2015, 29, 1591–1602. [Google Scholar] [CrossRef]
  72. Motta, J.P.; Flannigan, K.L.; Agbor, T.A.; Beatty, J.K.; Blackler, R.W.; Workentine, M.L.; Silva, G.J.D.; Wang, R.; Buret, A.G.; Wallace, J.L. Hydrogen Sulfide Protects from Colitis and Restores Intestinal Microbiota Biofilm and Mucus Production. Inflamm. Bowel Dis. 2015, 21, 1006–1017. [Google Scholar] [CrossRef] [PubMed]
  73. Wallace, J.L.; Blackler, R.W.; Chan, M.V.; Silva, G.J.D.; Elsheikh, W.; Flannigan, K.L.; Gamaniek, I.; Manko, A.; Wang, L.; Motta, J.P.; et al. Anti-Inflammatory and Cytoprotective Actions of Hydrogen Sulfide: Translation to Therapeutics. Antioxid. Redox Signal. 2015, 22, 398–410. [Google Scholar] [CrossRef] [PubMed]
  74. Hsu, C.N.; Hou, C.Y.; Chang-Chien, G.P.; Lin, S.; Tain, Y.L. Maternal N-Acetylcysteine Therapy Prevents Hypertension in Spontaneously Hypertensive Rat Offspring: Implications of Hydrogen Sulfide-Generating Pathway and Gut Microbiota. Antioxidants 2020, 9, 856. [Google Scholar] [CrossRef]
  75. Feil, E.J.; Holmes, E.C.; Bessen, D.E.; Chan, M.S.; Day, N.P.; Enright, M.C.; Goldstein, R.; Hood, D.W.; Kalia, A.; Moore, C.E.; et al. Recombination within Natural Populations of Pathogenic Bacteria: Short-Term Empirical Estimates and Long-Term Phylogenetic Consequences. Proc. Natl. Acad. Sci. USA 2001, 98, 182–187. [Google Scholar] [CrossRef]
  76. Duchene, S.; Holt, K.E.; Weill, F.X.; Hello, S.L.; Hawkey, J.; Edwards, D.J.; Fourment, M.; Holmes, E.C. Genome-Scale Rates of Evolutionary Change in Bacteria. Microb. Genom. 2016, 2, e000094. [Google Scholar] [CrossRef]
  77. Didelot, X.; Walker, A.S.; Peto, T.E.; Crook, D.W.; Wilson, D.J. Within-Host Evolution of Bacterial Pathogens. Nat. Rev. Microbiol. 2016, 14, 150–162. [Google Scholar] [CrossRef]
  78. Garud, N.R.; Good, B.H.; Hallatschek, O.; Pollard, K.S. Evolutionary Dynamics of Bacteria in the Gut Microbiome within and across Hosts. PLoS Biol. 2019, 17, e3000102. [Google Scholar] [CrossRef]
  79. Young, B.C.; Wu, C.H.; Gordon, N.C.; Cole, K.; Price, J.R.; Liu, E.; Sheppard, A.E.; Perera, S.; Charlesworth, J.; Golubchik, T.; et al. Severe Infections Emerge from Commensal Bacteria by Adaptive Evolution. eLife 2017, 6, e30637. [Google Scholar] [CrossRef]
  80. Yilmaz, B.; Mooser, C.; Keller, I.; Li, H.; Zimmermann, J.; Bosshard, L.; Fuhrer, T.; de Aguero, M.G.; Trigo, N.F.; Tschanz-Lischer, H.; et al. Long-Term Evolution and Short-Term Adaptation of Microbiota Strains and Sub-Strains in Mice. Cell Host Microbe 2021, 29, 650–663.e9. [Google Scholar] [CrossRef]
  81. Bor, B.; Poweleit, N.; Bois, J.S.; Cen, L.; Bedree, J.K.; Zhou, Z.H.; Gunsalus, R.P.; Lux, R.; McLean, J.S.; He, X.; et al. Phenotypic and Physiological Characterization of the Epibiotic Interaction Between TM7x and Its Basibiont Actinomyces. Microb. Ecol. 2016, 71, 243–255. [Google Scholar] [CrossRef] [PubMed]
  82. He, X.; McLean, J.S.; Edlund, A.; Yooseph, S.; Hall, A.P.; Liu, S.Y.; Dorrestein, P.C.; Esquenazi, E.; Hunter, R.C.; Cheng, G.; et al. Cultivation of a Human-Associated TM7 Phylotype Reveals a Reduced Genome and Epibiotic Parasitic Lifestyle. Proc. Natl. Acad. Sci. USA 2015, 112, 244–249. [Google Scholar] [CrossRef] [PubMed]
  83. Soro, V.; Dutton, L.C.; Sprague, S.V.; Nobbs, A.H.; Ireland, A.J.; Sandy, J.R.; Jepson, M.A.; Micaroni, M.; Splatt, P.R.; Dymock, D.; et al. Axenic Culture of a Candidate Division TM7 Bacterium from the Human Oral Cavity and Biofilm Interactions with Other Oral Bacteria. Appl. Environ. Microbiol. 2014, 80, 6480–6489. [Google Scholar] [CrossRef] [PubMed]
  84. Dinis, J.M.; Barton, D.E.; Ghadiri, J.; Surendar, D.; Reddy, K.; Velasquez, F.; Chaffee, C.L.; Lee, M.C.; Gavrilova, H.; Ozuna, H.; et al. In Search of an Uncultured Human-Associated TM7 Bacterium in the Environment. PLoS ONE 2011, 6, e21280. [Google Scholar] [CrossRef]
Figure 1. Dot plot showing the completeness (%) and contamination (%) among the 128 metagenome-assembled genomes (MAGs) recovered from all six samples, legend in inset, dot size correlates to the number (1 to 6) MAGs represented (A); bar charts showing the number of tRNAs found in low-, medium-, and high-quality MAGs (B), and the number of contigs used to construct MAGs (C); and dot plot showing the number of expressed genes in relation to total detected genes in each MAG (D).
Applmicrobiol 04 00109 g001
Figure 2. Phylogenetic tree (ignoring branch lengths) showing the relationship between the newly identified Saccharimonadaceae MAGs and 321 MAGs within the NCBI Sequence Read Archive (SRA) annotated to the Saccharimonadaceae family, asterisk (*) represents gut-associated samples (A); and pangenome of novel Saccharimonadaceae MAGs showing genomic content specific to MAGs from each source (B). Black arrow identifies clustering of novel Saccharimonadaceae MAGs with murine-associated MAGs in NCBI.
Applmicrobiol 04 00109 g002
Figure 3. Pangenomes of Alistipes (A), Prevotella (B), and family Muribaculaceae (C) constructed from the present data, each showing the conserved core genomic content, and additional genomic content, common to multiple MAGs from each supplier.
Applmicrobiol 04 00109 g003
Figure 4. Heat map of differentially expressed select KEGG pathways (A) and volcano plots of individual KEGG (B), Pfam (C), and CAZyme (D) IDs between GMLow and GMHigh microbiomes. Red dots indicate Log2FC > 1 and p < 0.05. Blue dots indicate Log2FC < 1 and p < 0.05. Green dots indicate Log2FC > 1 and p > 0.05. Gray dots indicate Log2FC < 1 and p > 0.05 Differential abundance testing was performed using DESeq2 with p < 0.05 considered significant.
Applmicrobiol 04 00109 g004
Disclaimer/Publisher’s Note: The statements, opinions and data contained in all publications are solely those of the individual author(s) and contributor(s) and not of MDPI and/or the editor(s). MDPI and/or the editor(s) disclaim responsibility for any injury to people or property resulting from any ideas, methods, instructions or products referred to in the content.

