Article

In Vitro Modelling of a Typical Dietary Intake in Restrictive Anorexia Nervosa Results in Changes to Gut Microbial Community and Metabolites

1
The Food Microbial Science Unit (FMSU), Department of Food and Nutritional Sciences, University of Reading, Reading RG6 6UR, UK
2
School of Psychology and Clinical Language Sciences, University of Reading, Reading RG6 6ES, UK
*
Author to whom correspondence should be addressed.
Appl. Microbiol. 2024, 4(4), 1642-1660; https://doi.org/10.3390/applmicrobiol4040112
Submission received: 25 November 2024 / Revised: 3 December 2024 / Accepted: 6 December 2024 / Published: 10 December 2024
(This article belongs to the Special Issue Applied Microbiology of Foods, 2nd Edition)

Abstract

:
Anorexia nervosa (AN) is a psychiatric illness with harmful physical consequences. Studies have observed differences in the faecal microbiota of patients with AN compared to healthy controls. Diet has an impact on the gut microbiota, facilitating an altered community, such changes could impact the gut–brain axis. In this study, a three-stage gut model system that mimics the luminal microbiology of the large intestine was conducted to identify relationships between diet and gut microbiota. A microbial medium was developed to provide nutrients more appropriate to restricting subtype AN (R-AN). The model was inoculated with faeces and samples were taken to compare differences in the microbiota and end products following the fermentation of healthy control medium (HC) compared to R-AN medium. Then, 16S amplicon sequencing along with flow cytometry–fluorescence in situ hybridisation were used to ascertain changes in the microbiota. Gas chromatography (GC) was used to assess changes in microbial metabolites. There were reduced levels of SCFA following the fermentation of R-AN medium. The fermentation of R-AN media led to fewer total bacteria numbers, along with less bifidobacteria and Rumincoccus proximally, but more Clostridium and Enterobacteriaceae. Nutrient-deficient medium resulted in reduced neurotransmitter-producing bacteria, reduced butyrate-producing bacteria, and increased protein-utilising bacteria, all of which could be maintaining factors in AN. The model system provides a novel tool for exploring how extreme dietary changes impact the microbiota and could therefore could be useful for assessing appropriate gut–brain targeted treatments.

1. Introduction

Anorexia nervosa (AN) is a psychiatric illness with harmful physical consequences and pathophysiological mechanisms that are yet to be fully elucidated [1,2,3]. Some studies have highlighted gut microbial differences in people with AN compared to healthy controls. Such differences have led to suggestions that the microbiota may have a role to play in AN, particularly when considering that the microbiota could impact mental wellbeing through the gut–brain axis [4,5,6,7]. However, a lack of standardised approaches in current research makes it difficult to firmly establish the gut microbiota as a key component in AN [8,9,10,11]. The restricting subtype of AN (R-AN) is characterised by the restriction of energy intake and the absence of binge-eating or purging behaviour [12]. Diet has an impact on the gut microbiota composition and richness during both restrictive and refeeding phases [13,14]. Metagenomic studies on AN have provided insight into how diet and nutrition can alter the gut microbiome, making it possible to understand more about this modifiable factor of the disease [15]. However, there is still much to learn about how the microbiota and associated metabolites could be implicated in the pathophysiology of R-AN. With growing interest in the gut–brain axis, this leads clear research questions as to whether changing this microbial community could help in supporting recovery.
Healthy human intestinal microbiota are dominated by bacteria from two phyla: Firmicutes (including the genera Lactobacillus, Clostridium, and Enterococcus) and Bacteroidetes (including Bacteroides), which together account for over 90% of the known genetic categories of the intestinal system [16]. Other bacteria, such as representatives from the phyla Actinobacteria (Bifidobacterium), Proteobacteria (Escherichia coli), Fusobacteria, Verrucomicrobia, and Cyanobacteria, are present to a lesser extent [17]. However, the proportion in their representation differs depending on many external factors. It has been noted that gut microbiota composition plays a crucial role in the development of several pathologies [18,19,20]. For example, the Firmicutes/Bacteroidetes (F/B) ratio is higher in obese people compared to lean people and tends to decrease with weight loss [21,22], with lower levels of Firmicutes also reported in AN [4,23]. Additionally, AN pathophysiology also involves an autoimmune component that may be related to gut bacterial antigens, such as Caseinolytic protease B (ClpB), an anorexigenic bacterial protein produced by Enterobacteriaceae [24]. CIpB may be able to stimulate Peptide YY (PYY) production, thus suppressing appetite by impacting on hormone secretion and satiety [25].
Within the gastrointestinal (GI) tract, there are differences in physiology, digestion, the retention time of food, substrate availability, host secretions, pH, and oxygen tension between different anatomical regions [26]. The large intestine is the most intensely inhabited area of the human microbiome [17]. It is characterised by a slow flow rate ranging from 0.3 to 20 mL/min, which can vary depending on whether a person is fasting or has eaten [27,28] and where pH ranges from acidic to neutral, and is dominated by specialised obligate anaerobes. Important differences in the intestinal environment occur between proximal, transverse, and distal regions and more locally between the intestine cavity and surface [26]. By considering these factors, it is possible to model this complex microbial community
A three-stage continuous culture system was validated by Macfarlane et al., 1998 [29]. This system was designed to mimic nutritional and physiochemical conditions of microbiota in the large intestine and was determined by measuring contents of the human large intestine obtained from sudden death victims [29]. The main substrates available to microorganisms growing in the large intestine were undigested foods, along with host-derived substrates [30,31]. Originally the constituents of culture medium were determined on the basis of large intestine contents [26]. By manipulating this medium, it might be possible to study how the microbial community might react in the presence of different nutrients. Studying this microbial community could be of great importance. For example, the GI microbiota can respond to changes in nutrients in the lumen and impact on neuron and hormone signals of the gastrointestinal tract, a process that influences appetite and food intake [32]. Therefore, in the following study, original, healthy gut model medium was altered to develop a medium based on the dietary intake of individuals with R-AN. This medium was used within a three-stage continuous culture system to determine the likely impact of these large nutritional changes on the gut microbial community and its end products, compared to the healthy control medium. Therefore, the aims of the current study were to (1) establish a three-stage continuous culture gut model system based on nutrient intake and gastrointestinal transit times appropriate for R-AN patients and (2) compare changes observed within this system to existing data of AN patients. Overall, this should result in the development of a tool to better study the dynamics of the gut microbial community associated with R-AN. The relevance of microbial changes can therefore be considered alongside the pathophysiology of the illness. This tool can then be used when considering how dietary modulations could impact the microbiota during treatment.

2. Materials and Methods

2.1. Modelling Dietary Intake R-AN and HCs

To establish an R-AN gut model system, a medium was developed based on dietary information reported in restrictive AN individuals [33] (restricted diet = 12, quartile 1) (Table 1), and mineral intake data were obtained from a study by Jauregui et al. (2009) [34]. These data were used to contrast the dietary intake of healthy adults obtained from British Nutrition Foundation (BNF) guidelines [35]. This information was used with the existing gut model medium recipe of Macfarlane et al. (1997) to determine the likely composition of nutrient components to reach the large intestine [36]. The diets were compared, and a new medium was developed based on the differences between the macronutrient and micronutrient content of the diets. A table detailing medium development compared to the healthy control can be found in a previous publication [37]. Details of the two media can be found in Table 2.

2.2. Three-Stage Continuous Culture System

A three-stage continuous culture system was conducted in quadruplet, modelling the proximal (V1, 80 mL, pH = 5.5), transverse (V2, 100 mL, pH = 6.2), and distal colonic regions (V3, 120 mL, pH = 6.8), as a scaled-down version of the original gut model system [29]. The systems were held under anaerobic conditions by sparging with N2 (15 mL/min) and held at a continuous temperature of 37 °C. A 20% faecal slurry was made in anaerobic phosphate-buffered saline (PBS solution: 0.1 mol/L; pH 7.4) using a faecal sample obtained from a healthy female donor who had not taken antibiotics within 6 months and was not a regular consumer of prebiotic or probiotic supplements. The systems were inoculated to give a final concentration of 6% faecal slurry. The faecal donors were four healthy females (aged 25–43 years). The experiment was conducted 4 times with a stool sample from a different faecal donor for each run. Initially, the system was allowed to stabilise for 24 h before starting the flow at a rate that enabled 300 mL to pass through the system in 64 h, as appropriate for AN [39]. The system was run with the HC medium until equilibrium was reached (steady state 1 (SS1)), determined by the stabilisation of SCFA over 3 days; this was after 512 h (8 full-volume turnovers). The medium was changed over to R-AN, and the model was continued until a second equilibrium was reached (steady state 2 (SS2)) after a further 512 h. At each steady state, samples were taken from the three vessels of the models to determine the microbial community and metabolites associated with the HC media or the R-AN media.

2.3. Total Bacteria and SCFA Analysis

For total bacterial community analysis, a 750 μL supernatant of gut model fluid was centrifuged at 13,000× g for 5 min. The pellet was then resuspended in 375 μL filtered 0.1 M PBS and fixed with 1125 μL filtered paraformaldehyde (PFA 4% v/v) for 4 to 8 h at 4 °C. The sample was washed twice with 1 mL PBS to remove PFA and resuspended in filtered 600 μL ethanol–PBS (1:1, v/v). The samples were kept at −20 °C prior to fluorescence in situ hybridisation–flow cytometry (FISH-FCM) analysis. For FISH-FCM, positive and negative control probes were used to establish a threshold of brightness so only hybridised cells containing the relevant probe were included in the quantification. The methods used to analyse FISH-FCM and SCFA/BCFA production are reported in detail elsewhere [37]. In SCFA/BCFA analysis, an internal standard was used within each sample to ensure appropriate quantification after sample derivitisation. Additionally, an external standard solution was used to obtain an accurate quantification of these metabolites.

2.4. DNA Extraction, Quantification, and Qualification

A 1 mL gut model sample was centrifuged at 13,000× g for 10 min, and the pellet was stored at −20 °C until DNA extraction. DNA extraction was conducted using a QIAamp® Fast DNA Stool Mini Kit (QIAGEN, Hilden, Germany) according to the manufacturer’s instructions with some modifications. Cell pellets were defrosted on ice and washed with 0.5 mL PBS. Each pellet was resuspended in 1 mL of InhibitEX buffer, and the suspension was transferred to a new tube with acid-washed glass beads (≤100 μm) (Sigma Aldrich, Dorset, UK). Samples were subjected to a bead beater (FastPrep-24™ 5G) for 60 s and put on ice for 60 s. This step was repeated 3 times. The sample was then vortexed for 1 min and centrifuged at 13,000× g for 1 min, 0.6 mL of supernatant was transferred to a fresh tube with 25 μL of Proteinase K, and 0.6 mL of AL buffer was added before vortexing for 15 s. Samples were incubated at 70 °C for 10 min; 0.6 mL of ethanol (99.9%) was added to the lysate, and this was vortexed to mix, and 0.6 mL of the lysate was added to a QIAamp spin column. Samples were centrifuged at 13,000× g for 1 min, and the tubes containing the filtrate were discarded. The spin column was placed into a new 2 mL collection tube. The previous step was repeated until all of the lysate was loaded onto the spin column. The spin column for each tube was opened, and 0.5 mL of buffer AW1 was added before centrifuging at 13,000× g for 1 min. The filtrate was discarded. Spin columns were then placed in a new 2 mL collection tube, and 0.5 mL of AW2 buffer was added. The tubes were centrifuged for 3 min at 13,000× g and the collection tubes containing the filtrate were discarded. In new 2 mL collection tubes, the spin columns were placed and centrifuged for 3 min at 13,000× g. The QIAamp spin columns were then transferred into a new set of 1.5 mL microcentrifuge tubes, and 0.03 mL of distilled water was added. These tubes were incubated at room temperature for 1 min and then centrifuged at 13,000× g for 1 min. The microcentrifuge tubes with the filtrate were discarded, the spin column was placed into a new 1.5 mL microcentrifuge tube, and the previous step was repeated to elute the DNA. The DNA concentration of the final product was evaluated using a NanoDrop ND-1000 spectrophotometer (NanoDrop technologies, Wilmington, DE, USA). A 2 μL volume of sample was placed on the Nanodrop pedestal, and the DNA quantity was assessed. Each sample was diluted in ddH2O to provide a concentration within the range of 10 to 50 ng/μL.

2.5. 16S rRNA Gene-Based Next-Generation Sequencing (NGS) and Bioinformatics

16S rRNA sequencing was carried out by Eurofins (Ebersberg, Germany; project NG-27480). Briefly, 16S rRNA gene sequences were amplified from extracted DNA samples, within the V3-V4 region (forward, 349F: 5′-GYGCASCAGKCGMGAAW-3′; reverse, 806R: 5′-GGACTACVSGGGTATCTAAT-3′) of the 16S rRNA gene by polymerase chain reaction (PCR), as previously described [40]. After sequencing, the de-multiplexing of the data based on the Illumina index reads was performed, and raw data were converted to FASTQ files. Illumina adapters were removed using the FASTP program, and error correction was performed where two reads overlapped. Raw paired end reads were subjected to quality filtering using software before paired end read assembling with Fast Length Adjustment of short reads (FLASh) software (2.2.00 version). For precise Operational Taxonomic Unit (OTU) analysis, data containing sequence errors (i.e., merged sequences shorter than 458 bp, raw reads with ambiguous base cells, chimeric sequences) were removed. The remaining representative reads from non-chimeric clusters were clustered de novo into OTUs (97% similarity threshold) using the Cluster Database at High Identify with Tolerance (CD-HIT) software program Version 4.6 (University of California, San Diego, CA, USA) based on 99% similarity accounting for PCR and sequencing errors of less than 1%. After pre-clustering [41], the trimmed reads were also checked, and chimeric sequences were removed using an implementation of the UCHIME program (version 4.2.40).

2.6. Data Processing and Bioinformatic Analysis

The pooled libraries were paired-end read sequenced on a MiSeq System (Illumina Inc., San Diego, CA, USA). OTU clustering and taxonomic information was converted to FASTQ files and processed using CLC Genomics Workbench version 21.0.4 and the CLC Microbial Genomics Module (QIAGEN Bioinformatics) (Aarhus, Denmark). Sequences were first trimmed, merged, and then clustered into OTUs at a 99% sequence similarity level using the Amplicon-Based OTU clustering tool. The creation of new OTUs was allowed considering 99% taxonomic similarity. The most abundant sequences were selected as representative of each cluster and then assigned to a taxonomy level using CLC Microbial Genomics default values and the SILVA Database September 2016 release.

2.7. Statistical Analysis

2.7.1. 16S Metagenomic Sequencing and Analysis

The classification of 16S rRNA forward sequence reads was performed using CLC Genomics Workbench version 21.0.4. The OTU log-fold change between healthy and anorexic model conditions was statistically analysed using FDR correction and Kruskal–Wallis test. The false discovery rate (FDR) was determined to correct p-values. Fold change (FC) > 1.5 and FDR-adjusted p-value < 0.05 were considered for miRNAs with healthy conditions versus anorexic conditions.

2.7.2. 16S rRNA Gene-Based Next-Generation Sequencing (NGS) and Bioinformatics

Data from FISH-FCM and gas chromatography (GC) were analysed with SPSS version 27 (IBM Corp., Armonk, NY, USA). Changes in total bacteria and SCFA/BCFA production were assessed between the 2 steady states using one-way analysis of variance (ANOVA). Significant differences were assessed with a post hoc Tukey HSD (Honestly Significant Difference) test. Statistical significance was set at p < 0.05.

3. Results

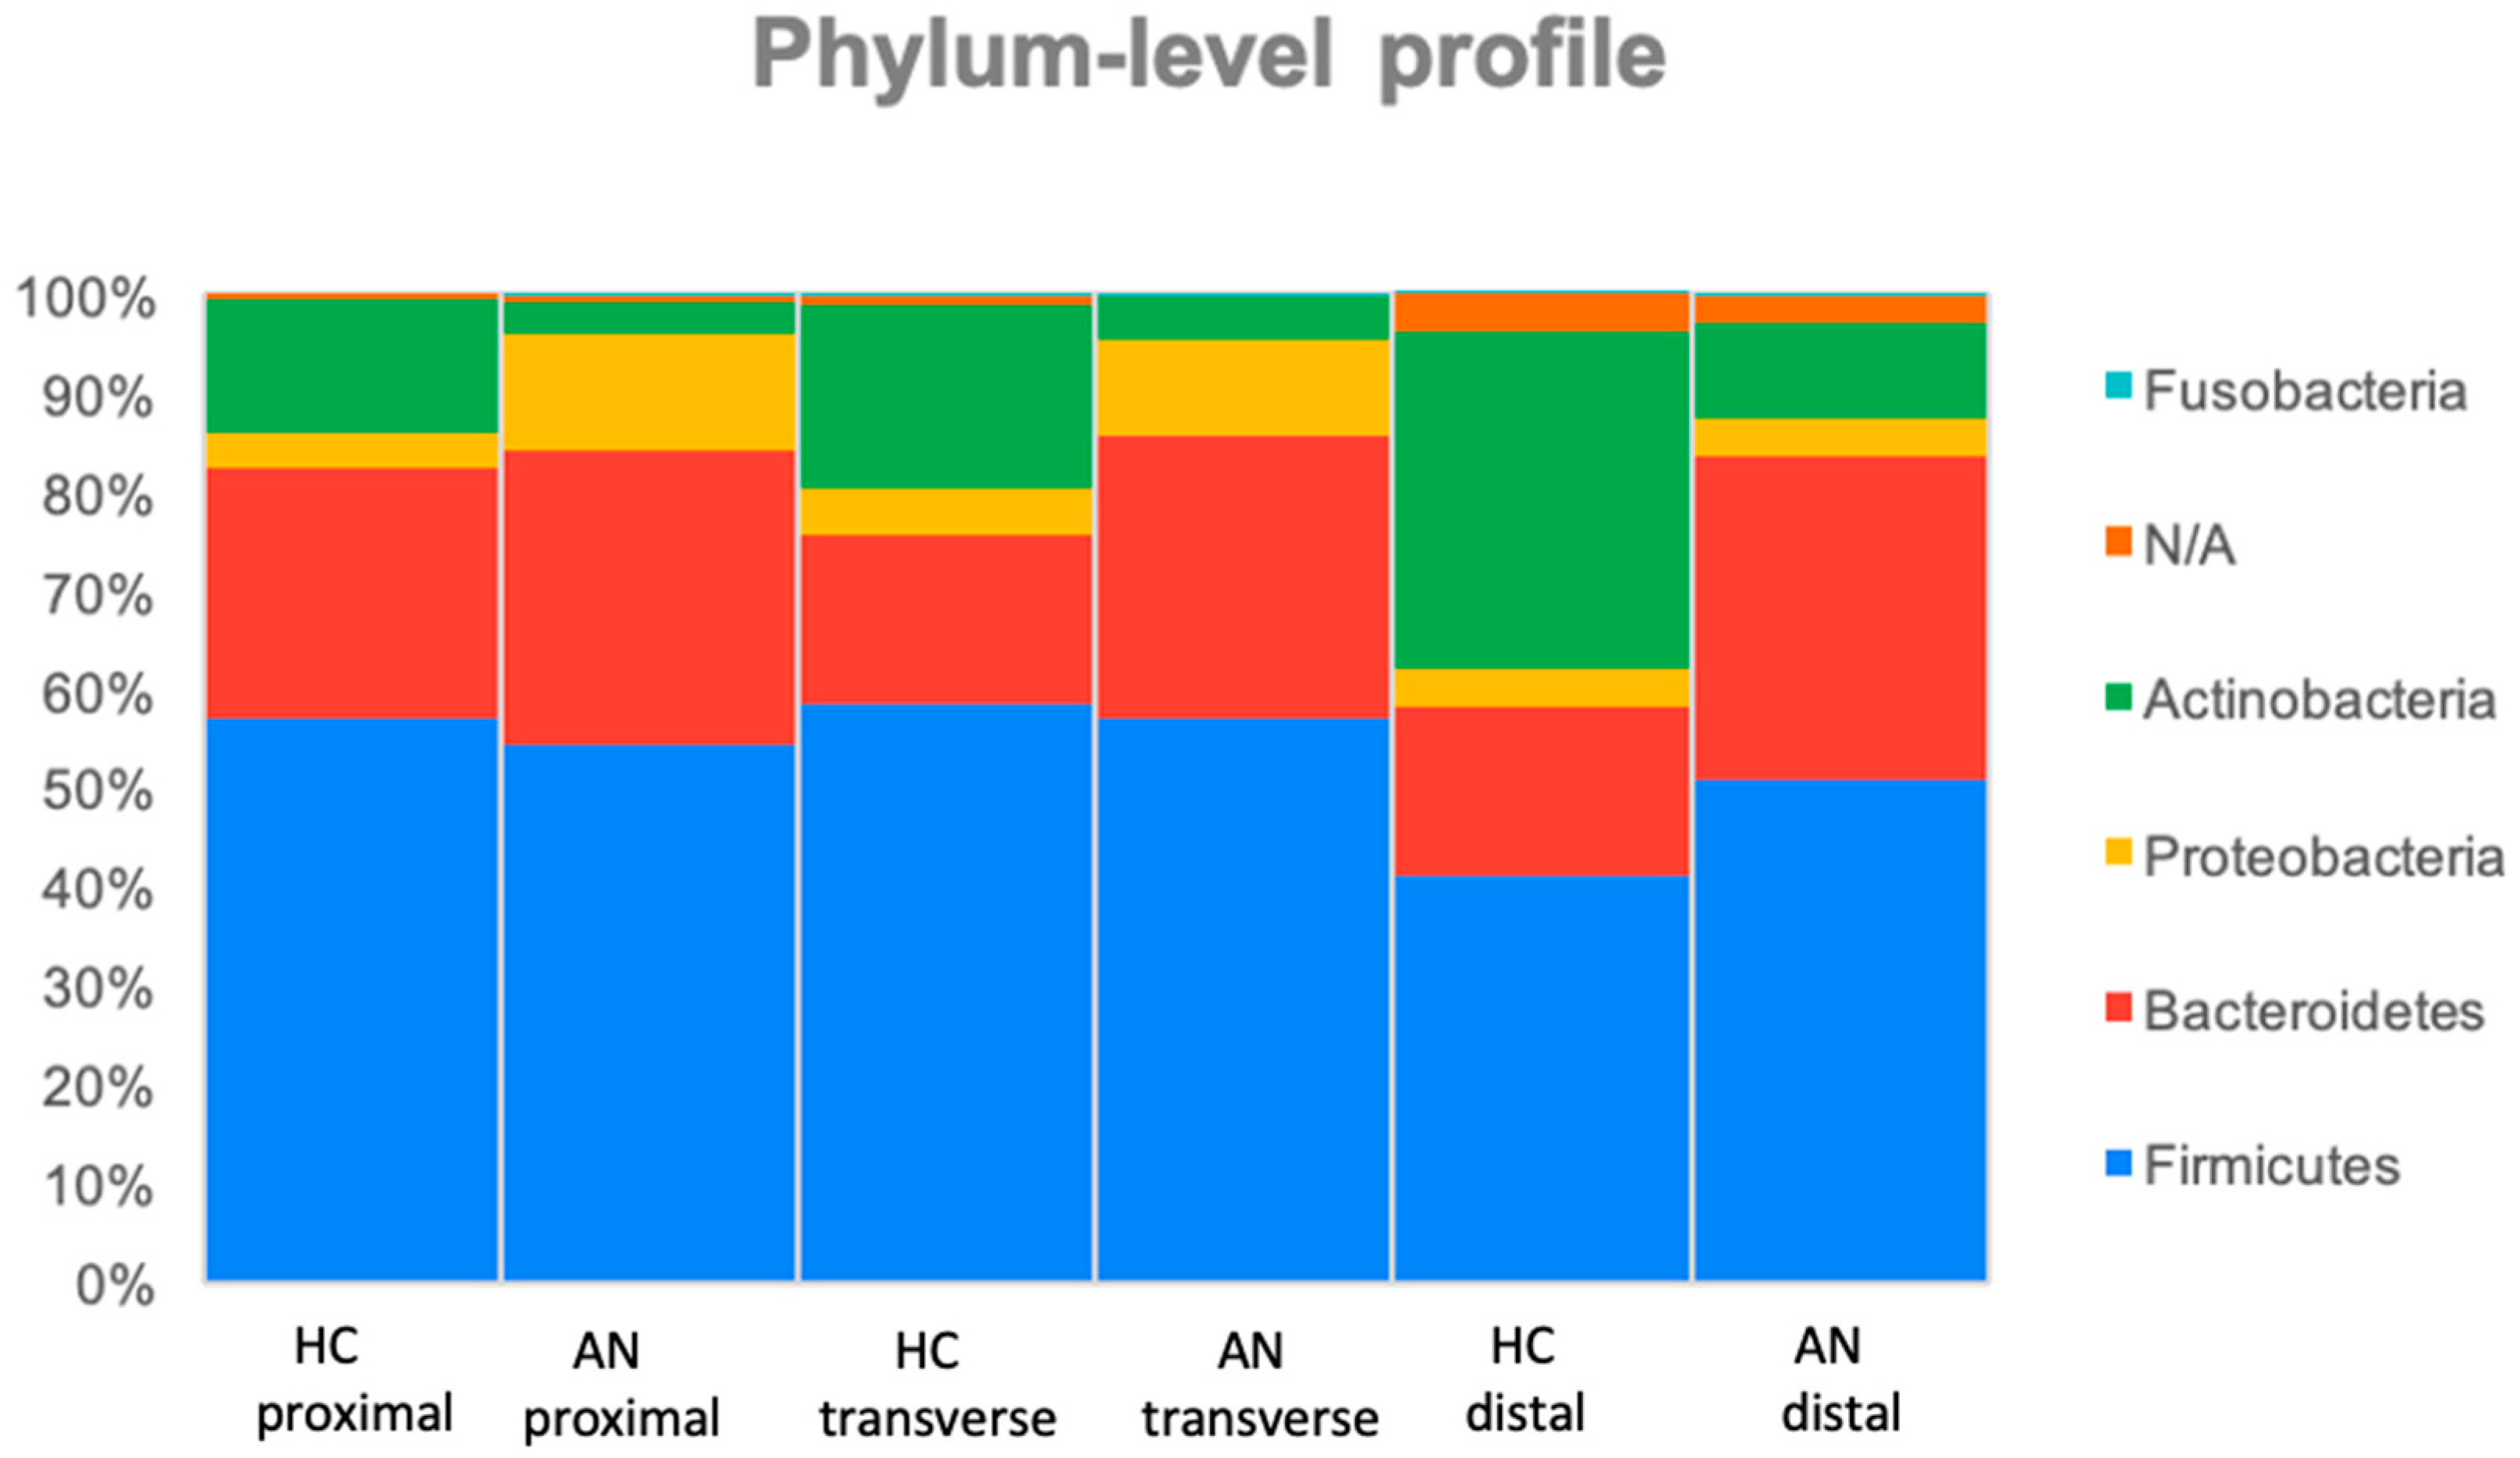
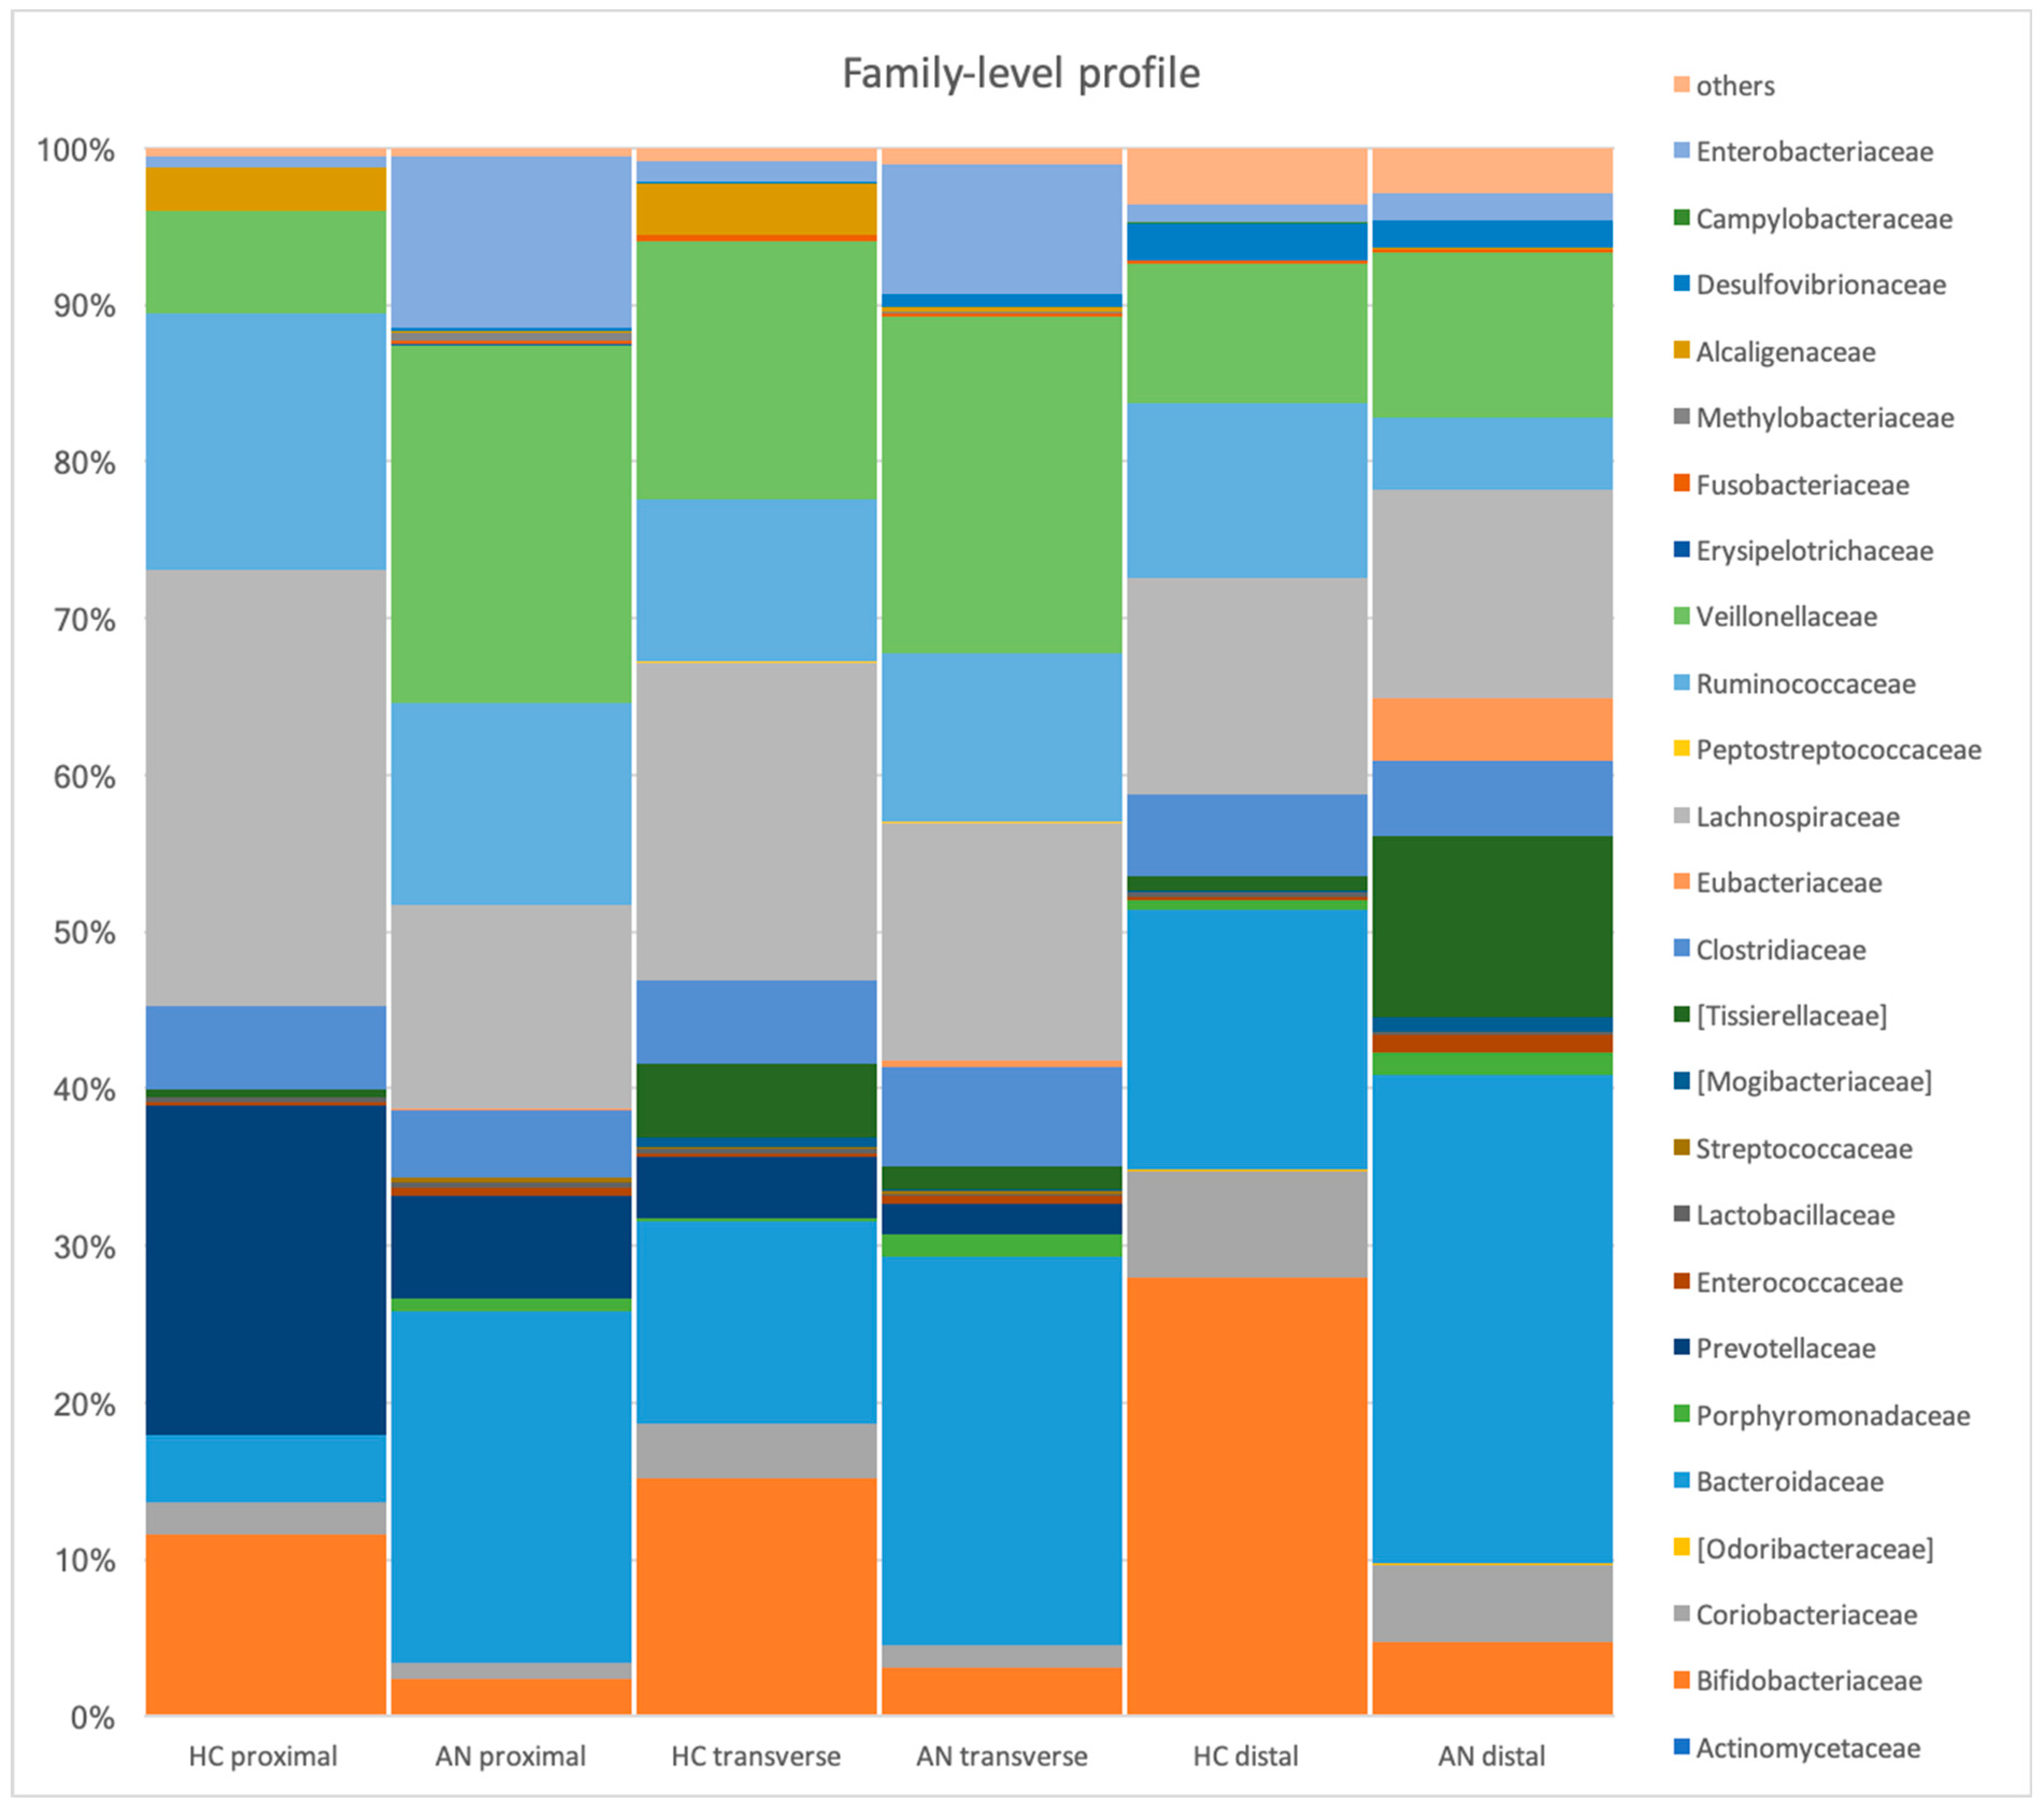
3.1. Microbial Profiles in the Stimulation of Proximal, Transverse, and Distal Colon (HC Versus R-AN)

The faecal-derived microbial communities in the different gut model vessels following the fermentation of HC and R-AN media were profiled. The composition of the intestinal microbiota was significantly influenced by R-AN medium at every taxonomic level (p < 0.05) (Figure 1). At the phylum level, the predominant bacterial taxa were Firmicutes and Bacteroidetes followed by Actinobacteria, Proteobacteria, and Fusobacteria. When compared to the microbial phylum profile between the fermentation of HC and R-AN media, the relative abundance of Firmicutes and Actinobacteria showed an increasing trend following fermentation of HC medium. However, after R-AN fermentation, there was an increase in the relative abundance of Bacteroidetes, Proteobacteria, and Fusobacteria, although the former two did not reach significance. Significant differences in phylum levels between R-AN and HC are reported in Table 3.
At the family level (Figure 2), Actinomycetaceae was only observed following the fermentation of HC media in the distal colon, being undetectable following R-AN medium fermentation (p < 0.05). The family Campylobacteraceae was also only observed following HC medium fermentation (transverse and distal colon) (p < 0.05 and p < 0.01, respectively). In contrast, some families were undetectable in the HC medium and only significantly increased after R-AN medium fermentation. For example, the relative abundance of Methylobacteriaceae significantly increased in all vessels (proximal, p < 0.005; transverse, p < 0.05; and distal, p < 0.05) after the fermentation of R-AN medium. The abundance of the families of Fusobacteriaceae and Desulfovibrionaceae significantly increased in V1 (proximal, both p < 0.001) after the fermentation of R-AN medium. The families of Barnesiellaceae and Oxalobacteraceae significantly increased after the fermentation of R-AN medium in V2 (transverse, p < 0.05) and V3 (distal, p < 0.05). The abundance of Dethiosulfovibrionaceae significantly increased in V2 and V3 (transverse and distal colon, both p < 0.05) following the fermentation of R-AN medium.
At the genus level (Figure 3), some genera were only observed in the HC model, whilst the R-AN medium was unable to support the growth of these. On the contrary, compared to the HC medium, there were some genera only detectable following the fermentation of R-AN medium. Significant differences at the phylum, family, and genus levels post the fermentation of AN and HC media are reported in Table 3 and Table 4.

3.2. Total Bacteria, SCFA, and BCFA Production

There were fewer total bacteria following the fermentation of R-AN media, along with lower levels of SCFA. Changes in total bacteria, SCFA, and BCFA concentrations are shown in Table 5.

4. Discussion

An in vitro model system represents an innovative tool that allows the dynamic microbial communities of the gastrointestinal tract to be studied, permitting adjustments to a variety of parameters, including nutrients, temperature, pH, and retention time. Manipulating these factors can enable the modelling of physiologically relevant conditions, reducing the requirement for human intervention studies [29,42,43]. In this study, a three-stage gut model was developed to investigate the effect of a modelled R-AN diet on the microbial community. The drastic changes in diet, modelled as a change in nutrient medium, led to extensive microbial differences following fermentation of HC medium and R-AN medium. The current study provides experimental evidence to support what has been observed in patients with AN in vivo.
At the phylum level, when comparing the microbiota following fermentation of HC medium compared to AN medium, it was observed that there was an increased relative abundance of Proteobacteria in the proximal regions of the model following R-AN medium fermentation. Similarly, in 2017, Borgo et al. analysed stool samples from 15 AN patients compared to healthy controls and noted increased abundance of Proteobacteria in individuals with AN [4]. Whilst this observation has not been made in other AN studies, a high abundance of Proteobacteria has been related to dysbiosis in hosts with metabolic or inflammatory disorders with potentially detrimental effects on gut microbiota composition and immune function [44,45]. It is therefore likely that this phylum may have a similar effect in AN.
The F/B ratio of the proximal, transverse, and distal colon following the fermentation of R-AN medium was lower than following HC medium fermentation, although this change was not significant. The most abundant bacteria in human gut microbiota are Firmicutes and Bacteroidetes phylum members. However, across three previous studies, the average F/B ratio was lower in AN individuals than in healthy groups [6,46,47]. It is worth noting that the F/B ratio is frequently reported to be increased in obese people compared to lean people and decreases with weight loss [21,48], suggesting that these microbial groups are likely to be sensitive to dietary changes. As such, the microbial change in the F/B ratio observed here would make sense in the context of R-AN.
Actinobacteria are a phylum associated with the maintenance of gut homeostasis [49] and include Bifidobacterium as a key member. Mack et al. (2016) and Morita et al. (2015) reported the microbial profile of AN patients compared to healthy controls, observing that Actinobacteria were elevated in AN patients and remained this way following weight regain [5,23]. The increase in this phylum during AN is likely to relate to the increased fibre ratio relative to other macronutrients [50]. In contrast, within the current model system, a reduction in Actinobacteria was observed following R-AN medium fermentation. However, the reduced Actinobacteria in the current study was only observed in the proximal regions; thus, this change might not translate to faeces, although it might be reasonable to expect higher Actinobacteria levels more distally following the fermentation of R-AN media. Reasons for this discrepancy could be due to the reduced levels of FOS in the R-AN medium, reducing the available substrate to the AN microbiota; alteration in the FOS levels of the medium may help to better model this. It is also worth noting that an increase in Actinobacteria has been observed in faeces of individuals with obesity [51]. This is also likely to be a result of enhanced levels of carbohydrates reaching the large intestine. Carbohydrates commonly include dietary ingredients that promote the growth of the Actinobacteria phyla, specifically Bifidobacterium [52,53,54]. A difference in the expected result highlights the fact that the dietary intake of each person with AN will differ, resulting in a different microbial profile, but through modulating the medium, a model that more closely relates to the microbiota typically associated with AN may be reached.
The observation of significantly increased Enterobacteriaceae in the proximal and transverse regions following the fermentation of R-AN medium revealed similar differences to those observed by Borgo et al. (2017) and Fan et al. (2023) when comparing persons with AN with healthy controls [4,48]. This observation makes sense when considering several characteristics of AN. The family Enterobacteriaceae are associated with gut inflammation, which favours bacterial translocation, promoting systemic inflammation [55]. A study has reported Enterobacteriaceae to play a role in eating disorders (EDs), where species of Escherichia coli are capable of producing small-protein sequence ClpB [56]. ClpB appears to interfere with a melanocyte-stimulating hormone (a-MSH) involved in anxiety and satiety signalling as an appetite regulator [57]. Higher levels of Enterobacteriaceae are associated with AN and also the gut–brain axis [56]. Furthermore, Borgo et al. (2017) also identified higher levels of Enterobacteriaceae in individuals with AN [4]. Increased Enterobacteriaceae have been associated with higher levels of lipopolysaccharides (LPSs) in blood, molecules linked to systemic inflammation that have been linked to symptoms of depression and anxiety [58]. Increased LPS levels imply a possible common inflammatory pathway shared by AN and mood disorders [56,57]. Consistent with this observation, an increase in this family may be associated with a higher production of neuropeptide ClpB, which may have a role to play in GBA communication in individuals with AN.
In the current study, the relative abundance of Fusobacteria was higher in all three colon segments following fermentation of AN medium compared to that of HC, particularly within the proximal region. Whilst this result has not been previously observed in AN, it is noteworthy because Fusobacteria are more frequently cultured from Kwashiorkor, an acute form of protein malnutrition [59]. In a study by Smith et al. (2013), faecal samples from children with kwashiorkor were transferred to germ-free mice, leading to drastic weight loss and metabolic abnormalities compared to the control group that received transplants from healthy children. This indicates that gut microbial community during starvation may play a role in body weight regulation [60]. Although malnutrition secondary to AN develops more chronically, it is plausible that microbial communities selected by a low-energy gut environment may perpetuate in individuals with AN and could have an impact on weight loss and behaviour [61].
An additional observation of the in vitro model was that Dethiosulfovibrionaceae significantly increased in the transverse and distal regions following AN medium fermentation, whereas it was undetectable after the fermentation of HC media. Whilst a link between AN and Dethiosulfovibrionaceae has not previously been observed, a study found that Dethiosulfovibrionaceae significantly increased in obese woman during a phase of rapid weight and body fat mass loss following bariatric surgery [62]. The study considered the potential of bacteria changes to be associated with changes in appetite, and it is therefore possible that this group of bacteria could have a role to play in the maintenance of AN and other eating problems. At the genus level, compared to the HC medium, the current study observed a significant decreased relative abundance of Lactobacillales in all three colon regions following R-AN medium fermentation, although the levels in the HC model were below 0.1% abundance. A study conducted by Armougoum et al. showed reduced Lactobacillus in AN compared to patients with obesity [63], suggesting that sufficient nutrients may not be available to support the growth of this genus in this mixed microbial community. Lactobacillus has been linked to a reduced anxiety response, the alleviation of depression, and increased resilience to stress [64,65,66,67]. Furthermore, γ-Aminobutyric acid (GABA), an inhibitory neurotransmitter present throughout the central nervous system, has been shown to be secreted by a number of bacteria, including Lactobacillus and Bifidobacterium [68]. Therefore, it is possible that a particular probiotic strain intervention could significantly affect GABA modulation through neurotransmitter production.
Compared to in the HC medium, the relative abundance of Clostridium significantly increased in all three colon regions following the fermentation of R-AN medium, which is consistent with studies on AN patients when compared to HC groups [7,20,47], contrasting the findings of Borgo et al. (2017), which suggested a reduced relative abundance of Clostridium in AN faecal samples [4]. However, as Clostridium is a large genus of microbes, changes based on species may vary. For example, a study by Queipo-Ortuno et al. observed increased Clostridium group IV levels in the rat model of R-AN following exercise [69], and a study conducted by Mack et al. (2016) indicated higher levels of Clostridium cluster I and cluster XI in faeces of individuals with AN when compared to healthy participants [23]. The use of 16S amplicon sequencing provides good resolution for genus distinction, but it is difficult to comment further on the species resolution of the data.
Coriobacteriaceae were significantly increased within the R-AN medium distal region, consistent with a study by Kleiman et al. (2015) in faecal samples of AN patients. It is worth noting that Mortia et al., 2015, did not observe any change in this microbial group, which could relate to the difference in the macronutrient intake within AN patients [70]. However, Morkl et al. (2017) observed Coriobacteriaceae as the only enriched phylotype in faeces of AN patients compared to in other microbial groups [71]. Coriobacteriaceae colonise the GI tract and are implicated in bile salt conversion and lipid metabolism [72]. As such, it is possible that this genus gains a competitive advantage with this state of limited nutrients and is therefore able to proliferate in the colons of those with AN.
The Roseburia genus identified by this study was significantly reduced following distal AN media fermentation; this reduction has also been observed in the faecal samples of individuals with AN [4,23,47,73]. This difference was well mirrored within the in vitro model system, and such a change is of interest because Roseburia are carbohydrate-degrading bacteria and key butyrate producers [29,74]. Decreased levels of Roseburia have also been found in patients with inflammatory bowel diseases [75]. Low-grade inflammation and altered gut permeability have been observed in an AN animal model [76,77], which could be in part driven by the reduced levels of butyrate, suggesting a putative role in AN’s pathophysiology. As such, a future direction of this research could look for using novel Roseburia probiotics to determine if this can help to counter some of the negative associations mentioned.
Compared to the HC model, Atopobium was significantly increased in all three colon regions of the AN model. However, a study indicated that the level of the Atopobium genus in patients with AN is not significantly different to participants without AN [5]. However, Atopobium has been observed to be elevated in major depressive disorder (MDD) and bipolar disorder [78]. Given significant comorbidity with AN and both MDD and bipolar disorder [78,79,80,81], the in vitro findings relating to the Atopobium genus might be a link between shared mechanisms of eating and mood disorders. Similarly, the family Desulfovibrionaceae was significantly increased in the proximal and transverse colon of the AN model. Desulfovibrionaceae were elevated in an AN study [82]; this family produce hydrogen sulphide, a pro-inflammatory agent that may disrupt gut barrier function. Desulfovibrionaceae have also been linked to depression and may contribute to shared pathophysiological mechanisms between gut inflammation and mood disorders [83]. Using in vitro models to determine ways to counter these effects could help in finding ways to readdress the microbial balance, whilst determining possible links with the gut–brain axis.
Methylobacteriaceae were detected only following the fermentation of AN media including the proximal, transverse, and distal regions with an increasing trend when compared to the HC media. There are no previous observations regarding AN’s faecal microbial status related to levels of Methylobacteriaceae, although this family may have a negative effect on immunocompromised hosts as they have been reported to cause infections post colonisation, including symptoms of fever, bloodstream infections, peritonitis, and pneumonia [80,84].
Another aspect worth considering is that in much AN research, the number of mucin-degrading bacteria is enhanced in AN samples [23]. In the current model, the mucin concentrations were the same in the HC and AN models, which may result in mucin becoming a key source of substance for the existing bacteria. In the current model, an increase in mucin utilisers in the AN model was not observed, suggesting that the concentration of mucin relative to the other nutrients needs consideration. Furthermore, the source of mucin of the in vitro model (being porcine) may not be optimal. Gastric III porcine mucin exhibits distinct glycosylation patterns compared to MUC2, the primary mucin in the large intestine. MUC2 contains complex O-glycans unique to the gut environment, which support the growth of specific mucin-degrading bacteria such as the Akkermansia muciniphila and Bacteroides species. In contrast, the simpler glycan structures in PGM III reduce its ability to effectively support these bacterial populations [85,86]. Thus, through optimising the mucin in vitro, a better model may be obtained.
Within the current model, there were significantly decreased total bacteria in AN medium within the proximal, transverse, and distal regions, which is in line with findings of Morita et al. (2015), who found lower total bacteria in the faces of those with AN when compared to healthy subjects [Morita et al., 2015]. Previous studies that measured faecal samples in AN individuals reported decreased levels of SCFAs when compared to healthy subjects [4,5,23,87], likely as a result of reduced carbohydrate intake, thus reducing substrate available for conversion to SCFA [87]. Furthermore, a depletion in carbohydrate-fermenting Roseburia could result in decreased propionate production [74]. Studies by Bailey et al. (2011) and Borgo et al. (2017) observed that butyrate concentration was negatively correlated with depression and anxiety scores [4,88]. In agreement with the above findings, in the current model, the levels of total bacteria and SCFA were significantly reduced upon fermentation of AN media when compared to HC media.
The increased concentration of total BCFAs, particularly iso-butyrate and iso-valerate, has been observed in stool samples of patients with AN [23]. BCFAs are typically markers of protein fermentation. In the current study, the AN model resulted in decreased levels of BCFAs when compared to the HC model; there was, however, a tendency for more BCFA distally, but this did not reach significance. This result may be due to limited protein availability in the anorexic medium. Furthermore, as SCFA and BCFA are largely absorbed, the faecal concentrations do not accurately reflect production within the GI tract.
It is worth noting that there are some limitations associated with the AN medium formulation. In this study, the AN medium was designed based on data from a specific group of twelve individuals with restrictive-type anorexia (BMI: 17.3 ± 0.3; age: 22 ± 1 years), so this AN medium recipe was stratified according to subtype and quartiles of extreme lower dietary nutrient intake compared to the age-specific Dietary Reference Intake levels. However, a recent meta-analysis suggested that the average protein daily intake for AN was 53.7 g, which is similar to the recommended dietary intake [89]. Therefore, it is important to note that the model system designed here is specific for restrictive AN at the extreme lower end of intake, and other medium variations would be necessary if modelling different conditions. Within this study, there were many observations that made sense to be occurring in the AN microbiota but had not previously been observed. This could be because the current model was an extreme system, whilst the publications on AN microbiota have represented a range of individuals, not all at the same extreme end of low nutritional intake. Nevertheless, the links of the in vitro gut model findings with physiological observations of AN suggest that the data generated are of importance and the model did appropriately indicate microbial changes in an extremely low nutrient diet.
As such, this study highlights how dietary restrictions can impact the microbial community. The in vitro system also provides insight into possible differences between the HC and AN microbiome in the proximal, transverse, and distal colonic regions, i.e., further up the GI tract than would normally be studied. Concentrating only on faecal samples may neglect significant region-specific microbial changes that are impacted by restricted diet in AN patients. Several findings of this study are considered alongside with previous observations, including the gut microbiome in AN, MDD, and malnutrition, and further confirm that nutritional deficiency is associated with profound alterations in the bacterial community structure [5,23,63,90].
As such, it seems that the fermentation of the AN medium mimics core features of restricting dietary AN, resulting in several changes in the intestinal microbial ecosystem, some common and others that map well to changes that might be expected in AN. Whilst no two persons with AN will have the same dietary intake, an approximation based on reports allows typical intakes of persons with R-AN to be modelled as a useful approach for studying microbial aspects of this condition. AN is, however, a multifaceted and complex condition, but these models provide an innovative technological tool that is less restricted by ethical concerns. As such, with these models, it may be possible to study likely effects of interventions on R-AN gut microbiota. Such approaches could be useful for optimising re-feeding approaches, when also considering the microbiota and the gut–brain axis.

5. Conclusions

Within this study, a medium was created to approximate the likely dietary nutrients available in the colon of those with R-AN. When compared to the gut model validated for healthy individuals, the restricted approach led to large differences in microbiota concentrations and SCFA concentrations. These included reduced microbial numbers and lower levels of health-associated bifidobacteria and SCFA-producing Ruminococcus. Conversely, there were higher levels of bacteria that include potentially pathogenic organisms; e.g., Enterobacteriacae and groups containing proteolytic genera, such as Clostridium. When considered alongside changes to the faecal microbiota reported in the faeces of persons with AN, similar increases in proteolytic microorganisms and lower levels of SCFAs were observed. As such, the R-AN medium within gut model systems could be a useful tool for studying AN. The model was based on R-AN patients within the lower quartile for nutritional intake, so the results may not translate perfectly to all AN situations. Nevertheless, useful links associated with reduced nutrient intake were identified. When considering therapies that implicate the microbiota, the gut model system enables a clear way to model the microbiota and their end products, minimising the need to test in patients. Such a system is likely to be of great value when considered alongside the GBA for developing dietary interventions to support recovery.

Author Contributions

Conceptualization, L.L., P.E.J. and G.E.W.; methodology, L.L., G.E.W. and C.P.; software, L.L.; validation, L.L. and G.E.W.; formal analysis, L.L.; investigation, L.L. and C.P.; resources, L.L.; data curation, L.L., G.E.W., C.P. and I.I.; writing—original draft preparation, L.L. and G.E.W.; writing—review and editing, L.L., G.E.W., C.P., P.E.J. and I.I.; visualisation, P.E.J. and G.E.W.; supervision, G.E.W., C.P. and P.E.J.; project administration, L.L.; funding acquisition, L.L. All authors have read and agreed to the published version of the manuscript.

Funding

This research received no external funding.

Data Availability Statement

All data generated is presented in the manuscript.

Conflicts of Interest

The authors declare no conflicts of interest.

References

  1. Eddy, K.T.; Dorer, D.J.; Franko, D.L.; Tahilani, K.; Thompson-Brenner, H.; Herzog, D.B. Diagnostic crossover in anorexia nervosa and bulimia nervosa: Implications for DSM-V. Am. J. Psychiatry 2008, 165, 245–250. [Google Scholar] [CrossRef] [PubMed]
  2. Mehler, P.S.; Brown, C. Anorexia nervosa—Medical complications. J. Eat. Disord. 2015, 3, 11. [Google Scholar] [CrossRef] [PubMed]
  3. ICD-11 for Mortality and Morbidity Statistics. Available online: https://icd.who.int/browse11/l-m/en (accessed on 19 November 2023).
  4. Borgo, F.; Riva, A.; Benetti, A.; Casiraghi, M.C.; Bertelli, S.; Garbossa, S.; Anselmetti, S.; Scarone, S.; Pontiroli, A.E.; Morace, G.; et al. Microbiota in anorexia nervosa: The triangle between bacterial species, metabolites, and psychological tests. PLoS ONE 2017, 12, e0179014. [Google Scholar] [CrossRef] [PubMed]
  5. Morita, C.; Tsuji, H.; Hata, T.; Gondo, M.; Takakura, S.; Kawai, K.; Yoshihara, K.; Ogata, K.; Nomoto, K.; Miyazaki, K.; et al. Gut Dysbiosis in Patients with Anorexia Nervosa. PLoS ONE 2015, 10, e0145274. [Google Scholar] [CrossRef]
  6. Monteleone, A.M.; Troisi, J.; Fasano, A.; Dalle Grave, R.; Marciello, F.; Serena, G.; Calugi, S.; Scala, G.; Corrivetti, G.; Cascino, G.; et al. Multi-Omics Data Integration in Anorexia Nervosa Patients Before and After Weight Regain: A Microbiome-Metabolomics Investigation. Clin. Nutr. 2021, 40, 1137–1146. [Google Scholar] [CrossRef]
  7. Prochazkova, P.; Roubalova, R.; Dvorak, J.; Kreisinger, J.; Hill, M.; Tlaskalova-Hogenova, H.; Tomasova, P.; Pelantova, H.; Cermakova, M.; Kuzma, M.; et al. The Intestinal Microbiota and Metabolites in Patients with Anorexia Nervosa. Gut Microbes 2021, 13, e1902771. [Google Scholar] [CrossRef]
  8. Fernandez-Aranda, F.; Pinheiro, A.P.; Tozzi, F.; Thornton, L.M.; Fichter, M.M.; Halmi, K.A.; Kaplan, A.S.; Klump, K.L.; Strober, M.; Woodside, D.B.; et al. Symptom profile of major depressive disorder in women with eating disorders. Aust. N. Z. J. Psychiatry 2007, 41, 24–31. [Google Scholar] [CrossRef]
  9. Garcia, N.; Gutierrez, E. Anorexia Nervosa and Microbiota: Systematic Review and Critical Appraisal. Eat. Weight Disord. 2023, 28, 1. [Google Scholar] [CrossRef]
  10. Godart, N.T.; Flament, M.; Perdereau, F.; Jeammet, P. Comorbidity between eating disorders and anxiety disorders: A review. Int. J. Eat. Disord. 2002, 32, 253–270. [Google Scholar] [CrossRef] [PubMed]
  11. Kaye, W.H.; Bulik, C.M.; Thornton, L.; Barbarich, N.; Masters, K.; PFC Group. Comorbidity of anxiety disorders with anorexia and bulimia nervosa. Am. J. Psychiatry 2004, 161, 2215–2221. [Google Scholar] [CrossRef]
  12. Diagnostic and Statistical Manual of Mental Disorders, 5th ed.; text rev.; DSM-5-TR; American Psychiatric Association: Washington, DC, USA, 2022.
  13. Baxter, N.T.; Schmidt, A.W.; Venkataraman, A.; Kim, K.S.; Waldron, C.; Schmidt, T.M. Dynamics of human gut microbiota and short-chain fatty acids in response to dietary interventions with three fermentable fibers. mBio 2019, 10, e02566-18. [Google Scholar] [CrossRef] [PubMed]
  14. Landini, L.; Dadson, P.; Gallo, F.; Honka, M.-J.; Cena, H. Microbiota in anorexia nervosa: Potential for treatment. Nutr. Res. Rev. 2023, 36, 372–391. [Google Scholar] [CrossRef] [PubMed]
  15. Kaelin, W.G., Jr.; McKnight, S.L. Influence of metabolism on epigenetics and disease. Cell 2013, 153, 56–69. [Google Scholar] [CrossRef] [PubMed]
  16. Eckburg, P.B.; Bik, E.M.; Bernstein, C.N.; Purdom, E.; Dethlefsen, L.; Sargent, M.; Gill, S.R.; Nelson, K.E.; Relman, D.A. Diversity of the human intestinal microbial flora. Science 2005, 308, 1635–1638. [Google Scholar] [CrossRef]
  17. Qin, J.; Li, R.; Raes, J.; Arumugam, M.; Burgdorf, K.S.; Manichanh, C.; Nielsen, T.; Pons, N.; Levenez, F.; Yamada, T.; et al. A human gut microbial gene catalogue established by metagenomic sequencing. Nature 2010, 464, 59–65. [Google Scholar] [CrossRef]
  18. Cristofori, F.; Dargenio, V.N.; Dargenio, C.; Miniello, V.L.; Barone, M.; Francavilla, R. Anti-Inflammatory and Immunomodulatory Effects of Probiotics in Gut Inflammation: A Door to the Body. Front. Immunol. 2021, 12, 578386. [Google Scholar] [CrossRef]
  19. Grau-Del Valle, C.; Fernández, J.; Solá, E.; Montoya-Castilla, I.; Morillas, C.; Bañuls, C. Association between gut microbiota and psychiatric disorders: A systematic review. Front. Psychol. 2023, 14, 1215674. [Google Scholar] [CrossRef]
  20. Roubalova, R.; Prochazkova, P.; Papezova, H.; Smitka, K.; Bilej, M.; Tlaskalova-Hogenova, H. Anorexia nervosa: Gut microbiota-immune-brain interactions. Clin. Nutr. 2020, 39, 676–684. [Google Scholar] [CrossRef]
  21. Sweeney, T.E.; Morton, J.M. The human gut microbiome: A review of the effect of obesity and surgically induced weight loss. JAMA Surg. 2013, 148, 563–569. [Google Scholar] [CrossRef]
  22. Koliada, A.; Syzenko, G.; Moseiko, V.; Budovska, L.; Puchkov, K.; Perederiy, V.; Gavalko, Y.; Dorofeyev, A.; Romanenko, M.; Tkach, S.; et al. Association between body mass index and Firmicutes/Bacteroidetes ratio in an adult Ukrainian population. BMC Microbiol. 2017, 17, 120. [Google Scholar] [CrossRef]
  23. Mack, I.; Cuntz, U.; Grämer, C.; Niedermaier, S.; Pohl, C.; Schwiertz, A.; Zimmermann, K.; Zipfel, S.; Enck, P.; Penders, J. Weight gain in anorexia nervosa does not ameliorate the fecal microbiota, branched-chain fatty acid profiles, and gastroin-testinal complaints. Sci. Rep. 2016, 6, 26752. [Google Scholar] [CrossRef] [PubMed]
  24. Fetissov, S.O.; Hökfelt, T. On the origin of eating disorders: Altered signaling between gut microbiota, adaptive immunity, and the brain melanocortin system regulating feeding behavior. Curr. Opin. Pharmacol. 2019, 48, 82–91. [Google Scholar] [CrossRef] [PubMed]
  25. Tennoune, N.; Chan, P.; Breton, J.; Legrand, R.; Chabane, Y.N.; Akkermann, K.; Jarv, A.; Ouelaa, W.; Takagi, K.; Ghouzali, I.; et al. Bacterial ClpB heat-shock protein, an antigen-mimetic of the anorexigenic peptide alpha-MSH, at the origin of eating disorders. Transl. Psychiatry 2014, 4, e458. [Google Scholar] [CrossRef] [PubMed]
  26. Flint, H.J.; Scott, K.P.; Duncan, S.H.; Louis, P.; Forano, E. Microbial degradation of complex carbohydrates in the gut. Gut Microbes 2012, 3, 289–306. [Google Scholar] [CrossRef]
  27. Cremer, J.; Segota, I.; Yang, C.Y.; Arnoldini, M.; Sauls, J.T.; Zhang, Z.; Gutierrez, E.; Groisman, A.; Hwa, T. Effect of flow and peristaltic mixing on bacterial growth in a gut-like channel. Proc. Natl. Acad. Sci. USA 2016, 113, 11414–11419. [Google Scholar] [CrossRef]
  28. Fine, K.D.; Santa Ana, C.A.; Porter, J.L.; Fordtran, J.S. Effect of changing intestinal flow rate on a measurement of intestinal permeability. Gastroenterology 1995, 108, 983–989. [Google Scholar] [CrossRef]
  29. Macfarlane, G.T.; Gibson, G.R. Validation of a three-stage compound continuous culture system for investigating the effect of retention time on the ecology and metabolism of bacteria in the human colon. Microb. Ecol. 1998, 35, 180–187. [Google Scholar] [CrossRef]
  30. Macfarlane, G.T.; Gibson, G.R. Metabolic activities of the normal colonic flora. In Human Health—The Contribution of Microorganisms; Gibson, S.A.W., Ed.; Springer: London, UK, 1994. [Google Scholar]
  31. Macfarlane, G.T.; Gibson, G. Microbiological Aspects of Short Chain Fatty Acid Production in the Large Bowel; Cambridge University Press: Cambridge, UK, 1995. [Google Scholar]
  32. Murphy, K.G.; Bloom, S.R. Gut hormones in the control of appetite. Exp. Physiol. 2004, 89, 507–516. [Google Scholar] [CrossRef]
  33. Raatz, S.K.; Jahns, L.; Johnson, L.K.; Crosby, R.; Mitchell, J.E.; Crow, S.; Peterson, C.; Le Grange, D.; Wonderlich, S.A. Nutritional adequacy of dietary intake in women with anorexia nervosa. Nutrients 2015, 7, 3652–3665. [Google Scholar] [CrossRef]
  34. Jauregui Lobera, I.; Bolanos Rios, P. Choice of diet in patients with anorexia nervosa. Nutr. Hosp. 2009, 24, 682–687. [Google Scholar]
  35. British Nutrition Foundation. Nutrition Requirements. Available online: https://www.nutrition.org.uk/nutritional-information/nutrient-requirements/ (accessed on 26 October 2019).
  36. Macfarlane, G.T.; Gibson, G.R. Carbohydrate Fermentation, Energy Transduction and Gas Metabolism in the Human Large Intestine. In Gastrointestinal Microbiology; Chapman & Hall Microbiology Series; Mackie, R.I., White, B.A., Eds.; Springer: Boston, MA, USA, 1997. [Google Scholar] [CrossRef]
  37. Liu, L.; Poveda, C.; Jenkins, P.E.; Walton, G.E. An In Vitro Approach to Studying the Microbial Community and Impact of Pre and Probiotics under Anorexia Nervosa Related Dietary Restrictions. Nutrients 2021, 13, 4447. [Google Scholar] [CrossRef] [PubMed]
  38. Harrison, M.; Miller, L.; AlEnazi, N.; Herron, D. Pregnancy and Weight Loss Surgery. In Handbook of Nutrition and Pregnancy, 2nd ed.; Lammi-Keefe, C., Couch, S., Kirwan, J., Eds.; Humana Press: Cham, Switzerland, 2018; pp. 421–428. [Google Scholar] [CrossRef]
  39. Kamal, N.; Chami, T.; Andersen, A.; Rosell, F.A.; Schuster, M.M.; Whitehead, W.E. Delayed gastrointestinal transit times in anorexia nervosa and bulimia nervosa. Gastroenterology 1991, 101, 1320–1324. [Google Scholar] [CrossRef] [PubMed]
  40. Klindworth, A.; Pruesse, E.; Schweer, T.; Peplies, J.; Quast, C.; Horn, M.; Glöckner, F.O. Evaluation of general 16S ribosomal RNA gene PCR primers for classical and next-generation sequencing-based diversity studies. Nucleic Acids Res. 2012, 41, e1. [Google Scholar] [CrossRef] [PubMed]
  41. Huse, S.M.; Welch, D.M.; Morrison, H.G.; Sogin, M.L. Ironing out the wrinkles in the rare biosphere through improved OTU clustering. Environ. Microbiol. 2010, 12, 1889–1898. [Google Scholar] [CrossRef]
  42. Nissen, L.; Casciano, F.; Gianotti, A. Intestinal fermentation in vitro models to study food-induced gut microbiota shift: An updated review. FEMS Microbiol. Lett. 2020, 367, fnaa097. [Google Scholar] [CrossRef]
  43. Williams, C.F.; Walton, G.E.; Jiang, L.; Plummer, S.; Garaiova, I.; Gibson, G.R. Comparative analysis of intestinal tract models. Annu. Rev. Food Sci. Technol. 2015, 6, 329–350. [Google Scholar] [CrossRef]
  44. Biagi, E.; Nylund, L.; Candela, M.; Ostan, R.; Bucci, L.; Pini, E.; Nikkïla, J.; Monti, D.; Satokari, R.; Franceschi, C.; et al. Through ageing, and beyond: Gut microbiota and inflammatory status in seniors and centenarians. PLoS ONE 2010, 5, e10667. [Google Scholar] [CrossRef]
  45. Moon, C.D.; Young, W.; Maclean, P.H.; Cookson, A.L.; Bermingham, E.N. Metagenomic insights into the roles of Proteobacteria in the gastrointestinal microbiomes of healthy dogs and cats. Microbiologyopen 2018, 7, e00677. [Google Scholar] [CrossRef]
  46. Fouladi, F.; Bulik-Sullivan, E.C.; Glenny, E.M.; Thornton, L.M.; Reed, K.K.; Thomas, S.; Kleiman, S.; Watters, A.; Oakes, J.; Huh, E.-Y.; et al. Reproducible changes in the anorexia nervosa gut microbiota following inpatient therapy remain distinct from non-eating disorder controls. Gut Microbes 2022, 14, 2143217. [Google Scholar] [CrossRef]
  47. Schulz, N.; Belheouane, M.; Dahmen, B.; Ruan, V.A.; Specht, H.E.; Dempfle, A.; Herpertz-Dahlmann, B.; Baines, J.F.; Seitz, J. Gut microbiota alteration in adolescent anorexia nervosa does not normalize with short-term weight restoration. Int. J. Eat. Disord. 2021, 54, 969–980. [Google Scholar] [CrossRef]
  48. Fan, Y.; Stoving, R.K.; Berreira Ibraim, S.; Hyotylainen, T.; Thirion, F.; Arora, T.; Lyu, L.; Stankevic, E.; Hansen, T.H.; Dechelotte, P.; et al. The gut microbiota contributes to the pathogenesis of anorexia nervosa in humans and mice. Nat. Micro-Biol. 2023, 8, 787–802. [Google Scholar] [CrossRef] [PubMed]
  49. Binda, C.; Lopetuso, L.R.; Rizzatti, G.; Gibiino, G.; Cennamo, V.; Gasbarrini, A. Actinobacteria: A relevant minority for the maintenance of gut homeostasis. Dig. Liver Dis. 2018, 50, 421–428. [Google Scholar] [CrossRef] [PubMed]
  50. Grundy, M.M.L.; Edwards, C.H.; Mackie, A.R.; Gidley, M.J.; Butterworth, P.J.; Ellis, P.R. Re-evaluation of the mechanisms of dietary fibre and implications for macronutrient bioaccessibility, digestion and postprandial metabolism. Br. J. Nutr. 2016, 116, 816–833. [Google Scholar] [CrossRef] [PubMed]
  51. Turnbaugh, P.J.; Gordon, J.I. The core gut microbiome, energy balance and obesity. J. Physiol. 2009, 587 Pt 17, 4153–4158. [Google Scholar] [CrossRef]
  52. Macfarlane, G.T.; Macfarlane, S. Fermentation in the human large intestine: Its physiologic consequences and the potential contribution of prebiotics. J. Clin. Gastroenterol. 2011, 45, S120–S127. [Google Scholar] [CrossRef]
  53. Roberfroid, M.; Gibson, G.R.; Hoyles, L.; McCartney, A.L.; Rastall, R.; Rowland, I.; Wolvers, D.; Watzl, B.; Szajewska, H.; Stahl, B.; et al. Prebiotic effects: Metabolic and health benefits. Br. J. Nutr. 2010, 104 (Suppl. S2), S1–S63. [Google Scholar] [CrossRef]
  54. Topping, D.L.; Clifton, P.M. Short-chain fatty acids and human colonic function: Roles of resistant starch and nonstarch polysaccharides. Physiol. Rev. 2001, 81, 1031–1064. [Google Scholar] [CrossRef] [PubMed]
  55. Winter, S.E.; Baumler, A.J. Dysbiosis in the inflamed intestine: Chance favors the prepared microbe. Gut Microbes 2014, 5, 71–73. [Google Scholar] [CrossRef]
  56. Breton, J.; Legrand, R.; Akkermann, K.; Jarv, A.; Harro, J.; Dechelotte, P.; Fetissov, S.O. Elevated Plasma Concentrations of Bacterial ClpB Protein in Patients with Eating Disorders. Int. J. Eat. Disord. 2016, 49, 805–808. [Google Scholar] [CrossRef]
  57. Adan, R.A.H.; Vink, T. Drug target discovery by pharmacogenetics: Mutations in the melanocortin system and eating disor-ders. Eur. Neuropsychopharmacol. 2001, 11, 483–490. [Google Scholar] [CrossRef]
  58. Markowiak-Kopeć, P.; Śliżewska, K. The Effect of Probiotics on the Production of Short-Chain Fatty Acids by Human Intesti-nal Microbiome. Nutrients 2020, 12, 1107. [Google Scholar] [CrossRef] [PubMed]
  59. Pham, T.-P.-T.; Tidjani Alou, M.; Bachar, D.; Levasseur, A.; Brah, S.; Alhousseini, D.; Sokhna, C.; Diallo, A.; Wieringa, F.; Mil-lion, M.; et al. Gut Microbiota Alteration is Characterized by a Proteobacteria and Fusobacteria Bloom in Kwashiorkor and a Bacteroidetes Paucity in Marasmus. Sci. Rep. 2019, 9, 9084. [Google Scholar] [CrossRef] [PubMed]
  60. Smith, M.I.; Yatsunenko, T.; Manary, M.J.; Trehan, I.; Mkakosya, R.; Cheng, J.; Kau, A.L.; Rich, S.S.; Concannon, P.; Mychaleckyj, J.C.; et al. Gut microbiomes of Malawian twin pairs discordant for kwashiorkor. Science 2013, 339, 548–554. [Google Scholar] [CrossRef] [PubMed]
  61. van de Wouw, M.; Schellekens, H.; Dinan, T.G.; Cryan, J.F. Microbiota-Gut-Brain Axis: Modulator of Host Metabolism and Appetite. J. Nutr. 2017, 147, 727–745. [Google Scholar] [CrossRef]
  62. Sanmiguel, C.P.; Jacobs, J.; Gupta, A.; Ju, T.; Stains, J.; Coveleskie, K.; Lagishetty, V.; Balioukova, A.; Chen, Y.; Dutson, E.; et al. Surgically Induced Changes in Gut Microbiome and Hedonic Eating as Related to Weight Loss: Prelimi-nary Findings in Obese Women Undergoing Bariatric Surgery. Psychosom. Med. 2017, 79, 880–887. [Google Scholar] [CrossRef]
  63. Armougom, F.; Henry, M.; Vialettes, B.; Raccah, D.; Raoult, D. Monitoring bacterial community of human gut microbiota reveals an increase in Lactobacillus in obese patients and Methanogens in anorexic patients. PLoS ONE 2009, 4, e7125. [Google Scholar] [CrossRef]
  64. Aizawa, E.; Tsuji, H.; Asahara, T.; Takahashi, T.; Teraishi, T.; Yoshida, S.; Ota, M.; Koga, N.; Hattori, K.; Kunugi, H. Possible association of Bifidobacterium and Lactobacillus in the gut microbiota of patients with major depressive disorder. J. Affect. Disord. 2016, 202, 254–257. [Google Scholar] [CrossRef]
  65. Cryan, J.F.; O’Riordan, K.J.; Cowan, C.S.M.; Sandhu, K.V.; Bastiaanssen, T.F.S.; Boehme, M.; Codagnone, M.G.; Cussotto, S.; Fulling, C.; Golubeva, A.V.; et al. The microbiota-gut-brain axis. Physiol. Rev. 2019, 99, 1877–2013. [Google Scholar] [CrossRef]
  66. Foster, J.A.; McVey Neufeld, K.A. Gut-brain axis: How the microbiome influences anxiety and depression. Trends Neurosci. 2013, 36, 305–312. [Google Scholar] [CrossRef]
  67. Yang, Z.; Li, J.; Gui, X.; Shi, X.; Bao, Z.; Han, H.; Li, M.D. Updated review of research on the gut microbiota and their relation to depression in animals and human beings. Mol. Psychiatry 2020, 25, 2759–2772. [Google Scholar] [CrossRef]
  68. Strandwitz, P.; Kim, K.H.; Terekhova, D.; Liu, J.K.; Sharma, A.; Levering, J.; McDonald, D.; Dietrich, D.; Ramadhar, T.R.; Lekbua, A.; et al. GABA-modulating bacteria of the human gut microbiota. Nat. Microbiol. 2019, 4, 396–403. [Google Scholar] [CrossRef] [PubMed]
  69. Queipo-Ortuño, M.I.; Seoane, L.M.; Murri, M.; Pardo, M.; Gomez-Zumaquero, J.M.; Cardona, F.; Casanueva, F.; Tinahones, F.J. Gut microbiota composition in male rat models under different nutritional status and physical activity and its association with serum leptin and ghrelin levels. PLoS ONE 2013, 8, e65465. [Google Scholar] [CrossRef] [PubMed]
  70. Kleiman, S.C.; Carroll, I.M.; Tarantino, L.M.; Bulik, C.M. Gut feelings: A role for the intestinal microbiota in anorexia nervosa? Int. J. Eat. Disord. 2015, 48, 449–451. [Google Scholar] [CrossRef] [PubMed]
  71. Morkl, S.; Lackner, S.; Muller, W.; Gorkiewicz, G.; Kashofer, K.; Oberascher, A.; Painold, A.; Holl, A.; Holzer, P.; Meinitzer, A.; et al. Gut microbiota and body composition in anorexia nervosa inpatients in comparison to athletes, overweight, obese, and normal weight controls. Int. J. Eat. Disord. 2017, 50, 1421–1431. [Google Scholar] [CrossRef]
  72. Clavel, T.; Charrier, C.; Braune, A.; Wenning, M.; Blaut, M.; Haller, D. Isolation of bacteria from the ileal mucosa of TNFdeltaARE mice and description of Enterorhabdus mucosicola gen. nov., sp. nov. Int. J. Syst. Evol. Microbiol. 2009, 59 Pt 7, 1805–1812. [Google Scholar] [CrossRef]
  73. Hanachi, M.; Manichanh, C.; Schoenenberger, A.; Pascal, V.; Levenez, F.; Cournede, N.; Dore, J.; Melchior, J.-C. Altered host-gut microbes symbiosis in severely malnourished anorexia nervosa (AN) patients undergoing enteral nutrition: An explicative factor of functional intestinal disorders? Clin. Nutr. 2019, 38, 2304–2310. [Google Scholar] [CrossRef]
  74. Louis, P.; Young, P.; Holtrop, G.; Flint, H.J. Diversity of human colonic butyrate-producing bacteria revealed by analysis of the butyryl-CoA:acetate CoA-transferase gene. Environ. Microbiol. 2010, 12, 304–314. [Google Scholar] [CrossRef]
  75. Imhann, F.; Vich Vila, A.; Bonder, M.J.; Fu, J.; Gevers, D.; Visschedijk, M.C.; Spekhorst, L.M.; Alberts, R.; Franke, L.; van Dul-lemen, H.M.; et al. Interplay of host genetics and gut microbiota underlying the onset and clinical presentation of inflammatory bowel disease. Gut 2018, 67, 108–119. [Google Scholar] [CrossRef]
  76. Jesus, P.; Ouelaa, W.; Francois, M.; Riachy, L.; Guerin, C.; Aziz, M.; Do Rego, J.C.; Dechelotte, P.; Fetissov, S.O.; Coeffier, M. Al-teration of intestinal barrier function during activity-based anorexia in mice. Clin. Nutr. 2014, 33, 1046–1053. [Google Scholar] [CrossRef]
  77. Belmonte, L.; Achamrah, N.; Nobis, S.; Guerin, C.; Riou, G.; Bole-Feysot, C.; Boyer, O.; Richard, V.; Do Rego, J.C.; Dechelotte, P.; et al. A role for intestinal TLR4-driven inflammatory response during activity-based anorexia. Sci. Rep. 2016, 6, 35813. [Google Scholar] [CrossRef]
  78. Abbate-Daga, G.; Buzzichelli, S.; Amianto, F.; Rocca, G.; Marzola, E.; McClintock, S.M.; Fassino, S. Cognitive flexibility in verbal and nonverbal domains and decision-making in anorexia nervosa patients: A pilot study. BMC Psychiatry 2011, 11, 162. [Google Scholar] [CrossRef] [PubMed]
  79. Calugi, S.; El Ghoch, M.; Conti, M.; Dalle Grave, R. Depression and treatment outcome in anorexia nervosa. Psychiatry Res. 2014, 218, 195–200. [Google Scholar] [CrossRef] [PubMed]
  80. Sanders, J.W.; Martin, J.W.; Hooke, M.; Hooke, J. Methylobacterium mesophilicum infection: Case report and literature review of an unusual opportunistic pathogen. Clin. Infect. Dis. 2000, 30, 936–938. [Google Scholar] [CrossRef] [PubMed]
  81. Thornton, L.M.; Welch, E.; Munn-Chernoff, M.A.; Lichtenstein, P.; Bulik, C.M. Anorexia Nervosa, Major Depression, and Suicide Attempts: Shared Genetic Factors. Suicide Life Threat. Behav. 2016, 46, 525–534. [Google Scholar] [CrossRef]
  82. Li, Z.; Bi, T. Causal effects of gut microbiota, metabolites, immune cells, liposomes, and inflammatory proteins on anorexia nervosa: A mediation joint multi-omics Mendelian randomization analysis. J. Affect. Disord. 2025, 368, 343–358. [Google Scholar] [CrossRef]
  83. Agus, A.; Clément, K.; Sokol, H. Gut microbiota-derived metabolites as central regulators in metabolic disorders. Gut 2021, 70, 1174–1182. [Google Scholar] [CrossRef]
  84. Lai, C.-C.; Cheng, A.; Liu, W.-L.; Tan, C.-K.; Huang, Y.-T.; Chung, K.-P.; Lee, M.-R.; Hsueh, P.-R. Infections Caused by Unusual Methylobacterium Species. J. Clin. Microbiol. 2011, 49, 3329–3331. [Google Scholar] [CrossRef]
  85. Martens, E.C.; Kelly, A.G.; Tauzin, A.S.; Brumer, H. The Devil Lies in the Details: How Variations in Polysaccharide Fi-ne-Structure Impact the Physiology and Evolution of Gut Microbes. J. Mol. Biol. 2014, 426, 3851–3865. [Google Scholar] [CrossRef]
  86. Tailford, L.E.; Crost, E.H.; Kavanaugh, D.; Juge, N. Mucin Glycan Foraging in the Human Gut Microbiome. Front. Genet. 2015, 6, 81. [Google Scholar] [CrossRef]
  87. Speranza, E.; Cioffi, I.; Santarpia, L.; Del Piano, C.; De Caprio, C.; Naccarato, M.; Marra, M.; De Filippo, E.; Contaldo, F.; Pasanisi, F. Fecal Short Chain Fatty Acids and Dietary Intake in Italian Women With Restrictive Anorexia Nervosa: A Pilot Study. Front. Nutr. 2018, 5, 119. [Google Scholar] [CrossRef]
  88. Bailey, M.T.; Dowd, S.E.; Galley, J.D.; Hufnagle, A.R.; Allen, R.G.; Lyte, M. Exposure to a social stressor alters the structure of the intestinal microbiota: Implications for stressor-induced immunomodulation. Brain Behav. Immun. 2011, 25, 397–407. [Google Scholar] [CrossRef] [PubMed]
  89. Jenkins, P.E.; Proctor, K.; Snuggs, S. Dietary intake of adults with eating disorders: A systematic review and me-ta-analysis. J. Psychiatr. Res. 2024, 175, 393–404. [Google Scholar] [CrossRef] [PubMed]
  90. Million, M.; Angelakis, E.; Maraninchi, M.; Henry, M.; Giorgi, R.; Valero, R.; Vialettes, B.; Raoult, D. Correlation between body mass index and gut concentrations of Lactobacillus reuteri, Bifidobacterium animalis, Methanobrevibacter smithii, and Escherichia coli. Int. J. Obes. 2013, 37, 1460–1466. [Google Scholar] [CrossRef] [PubMed]
Figure 1. Phylum-level profile. Relative abundance of common microbial taxa. Bar chart showing the relative abundance of the most represented microbial taxa, defined as having a mean relative abundance of >1% in gut model of proximal, transverse, and distal colon following the fermentation of healthy control (HC) medium and then restrictive anorexia (R-AN) medium (n = 4). N/A: data not available.
Applmicrobiol 04 00112 g001
Figure 2. Family-level profiles. Relative abundance of common microbial families. Bar charts showing the relative abundance of the most represented microbial taxa, defined as having a mean relative abundance of >1% in gut model of proximal, transverse, and distal colon following the fermentation of healthy control (HC) medium and then restrictive anorexia (R-AN); (n = 4).
Applmicrobiol 04 00112 g002
Figure 3. Taxonomic differences were detected between healthy control (HC) and restrictive anorexia (R-AN) using CLC workbench analysis (corrected p values). Only genera with significant differences in the relative abundance between HC controls and the R-AN condition are displayed.
Applmicrobiol 04 00112 g003
Table 1. Energy and nutrient intake reported by individuals with restrictive anorexia (R-AN) and comparison with British Nutrition Foundation (BNF) recommendations for estimated average requirements for adults.
Daily Dietary CompositionEstimated Average Requirement
for Adults (Normal Value)
R-AN Diet
(n = 12) [33]
Sites of Absorption [38]
Energy intakeKcal2175736-
Protein intakeg5033Ileum and colon
Carbohydrateg260110-
Dietary fibreg3012Colon
Fatg7017Ileum
Potassiummg35002600Ileum and colon
Chloridemg25001825Duodenum and colon
Sodiummg16001168Colon
Magnesiummg270227Duodenum
Phosphorusmg550607Jejunum
Calciummg700545Jejunum
Ironmg14.87.9Duodenum
Vitamin Kμg--Ileum and colon
Vitamin B12μg1.52.2Ileum
Thiaminmg0.80.704Jejunum
Riboflavinmg1.11.1Jejunum
Niacinmg138.6Duodenum
Folateμg200234Duodenum
Vitamin B6mg1.20.9Jejunum
Vitamin Amg600503Ileum
Vitamin Cmg4070Ileum
Vitamin Emg32.7Ileum
Vitamin Dμg101.7Ileum
Seleniumμg6039Duodenum
Zincmg75.4Jejunum
The UK set of Dietary Reference Values (DRVs) including estimated average requirements (EARs) and Reference Nutrient Intakes (RNIs). In this study, for the group of 18–60-year-old females, macronutrient requirements were based on EARs and micronutrient and protein requirements were based on RNIs.
Table 2. Healthy control (HC) and restrictive anorexia (R-AN) gut model media.
Medium IngredientHC Gut Model Medium (g/L) SS1 [29]R-AN Medium (g/L) SS2 [37]
Starch52.1
Peptone water53.3
Tryptone53.3
Yeast extract4.52.97
Casein31.98
Guar gum10.4
Inulin10.4
Pectin20.8
Arabinogalactan20.8
Xylan20.8
KCI4.53.28
NaCI4.53.28
NaHCO31.51.095
MgSO4·7H2O1.251.05
KH2PO40.50.55
K2HPO40.50.55
CaCI2·6H2O0.150.117
Hemin0.50.0265
FeSO4·7H2O0.00050.000795
Vitamin K10 μL6.68 μL
L-cystiene HCl0.80.8
Tween 801 mL1 mL
Resazurin (0.25 g/L)4 mL4 mL
Mucin (porcine gastric type III)44
Bile salts0.40.4
Table 3. Taxa significantly increased (+) or decreased (-) in abundance following fermentation of healthy control (HC) and restrictive anorexia (R-AN) medium (data are expressed as means ± standard deviation). AN, R-AN medium; HC, healthy control medium. n = 4.
Taxonomic LevelClassificationColon SiteHC Relative AbundanceAN Relative AbundanceANHC Versus AN p-Value
PhylumProteobacteriaProximal3.50 ± 3.8011.70 ± 18.80+0.04
ActinobacteriaProximal
Transverse
Distal
13.60 ± 7.80
18.60 ± 9.00
34.30 ± 25.90
3.40 ± 3.10
4.60 ± 4.80
9.60 ± 10.90
-
-
-
<0.001
0.01
0.01
FamilyEubacteriaceaeProximal
Transverse
Distal
0.00 ± 0.00
0.02 ± 0.04
0.00 ± 0.00
0.14 ± 0.23
0.42 ± 0.73
3.97 ± 4.93
+
+
+
0.01
0.03
0.001
TissierellaceaeTransverse
Distal
4.70 ± 11.50
0.91 ± 0.31
1.40 ± 1.70
11.60 ± 7.10
-
+
0.05
<0.001
MogibacteriaceaeTransverse
Distal
0.70 ± 1.50
0.13 ± 0.11
0.16 ± 0.30
0.94 ± 1.00
-
+
0.05
0.01
ActinomycetaceaeDistal0.01 ± 0.020.00-0.04
PorphyromonadaceaeProximal
Transverse
0.09 ± 0.009
0.24 ± 0.19
0.76 ± 0.76
1.40 ± 1.59
+
+
<0.001
0.01
LactobacillaceaeTransverse
Distal
0.30 ± 0.30
0.28 ± 0.09
0.13 ± 0.15
0.13 ± 0.03
-
-
0.02
0.01
DesulfovibrionaceaeProximal
Transverse
0.00
0.11 ± 0.15
0.16 ± 0.20
0.81 ± 0.83
+
+
<0.001
0.03
CampylobacteraceaeTransverse
Distal
0.03 ± 0.05
0.13 ± 0.19
0.00
0.00
-
-
0.02
0.003
EnterobacteriaceaeProximal
Transverse
0.70 ± 0.87
13.19 ± 18.88
10.97 ± 17.91
8.37 ± 12.74
+
-
0.05
0.03
BifidobacteriaceaeTransverse15.10 ± 9.703.10 ± 4.10-0.001
CoriobacteriaceaeTransverse3.50 ± 2.401.50 ± 0.80-0.006
VeillonellaceaeProximal6.62 ± 5.8722.90 ± 18.75+0.002
MethylobacteriaceaeProximal
Transverse
Distal
0.00
0.00
0.00
0.46 ± 0.82
0.13 ± 0.25
0.00 ± 0.00
+
+
+
0.004
0.003
0.003
FusobacteriaceaeProximal0.000.26 ± 0.74+<0.001
AlcaligenaceaeProximal2.74 ± 3.800.16 ± 0.16-0.00
DethiosulfovibrionaceaeTransverse
Distal
0.00
0.00
0.11 ± 0.14
0.09 ± 0.05
+
+
0.03
0.04
Table 4. Genus-level profile from each vessel V1, V2, and V3, mimicking the proximal, transverse, and distal colon of in vitro colonic model. Differences between healthy control (HC) and restrictive anorexia (R-AN) medium microbiome (HC microbiome versus R-AN microbiome). Only genera with significant differences in the relative abundance between HC and R-AN are displayed. Genera significantly increased (+) or decreased (-) in abundance following the fermentation of R-AN medium and HC medium (data are expressed as means ± standard deviation).
GenusColon SiteHC Relative AbundanceR-AN Relative AbundanceR-ANp Value
LachnospiraProximal
Transverse
2.39 ± 1.95
1.86 ± 2.05
0.12 ± 0.11
0.08 ± 0.08
-
-
<0.001
<0.001
MethylobacteriaceaeProximal
Transverse
Distal
0.00
0.00
0.00
0.41 ± 0.82
0.12 ± 0.24
0.00 ± 0.00
+
+
+
<0.001
<0.001
0.03
SutterellaProximal2.45 ± 3.800.14 ± 0.16-0.001
FusobacteriumProximal0.000.30 ± 0.74+0.002
ParabacteroidesProximal0.01 ± 0.010.64 ± 0.76+0.002
DesulfovibrioProximal0.000.12 ± 0.20+0.002
AtopobiumProximal
Transverse
Distal
0.00 ± 0.01
0.00
0.00
0.21 ± 0.04
0.36 ± 0.71
0.91 ± 1.22
+
+
+
0.01
<0.001
0.007
RuminococcusProximal13.09 ± 7.876.17 ± 4.71-0.02
PeptoniphilusProximal
Distal
0.53 ± 0.81
0.61 ± 0.56
0.02 ± 0.03
5.03 ± 6.51
-
+
0.03
0.005
ClostridiumProximal
Transverse
Distal
0.12 ± 0.18
4.92 ± 1.85
0.00
0.94 ± 1.23
6.49 ± 6.18
0.01 ± 0.01
+
+
+
0.04
0.01
0.02
BifidobacteriumProximal12.18 ± 7.562.69 ± 3.09-0.04
DialisterProximal5.16 ± 4.9024.65 ± 18.75+0.04
AnaerofustisProximal0.000.01 ± 0.00+0.04
LachnobacteriumProximal
Distal
0.45 ± 0.88
0.11 ± 0.12
0.01 ± 0.02
0.00 ± 0.01
-
-
0.05
0.01
LactobacillalesProximal
Transverse
Distal
0.01 ± 0.00
0.02 ± 0.04
0.09 ± 0.13
0.00
0.00
0.00
-
-
-
0.05
0.01
0.006
PorphyromonasTransverse0.00 ± 0.010.81 ± 1.61+0.01
CampylobacterTransverse
Distal
0.02 ± 0.05
0.13 ± 0.18
0.00
0.00
-
-
0.02
0.01
EnterobacteriaceaeTransverse0.25 ± 0.351.83 ± 2.95+0.03
FaecalibacteriumTransverse3.56 ± 6.435.45 ± 9.07+0.03
PyramidobacterTransverse0.000.10 ± 0.10+0.03
TepidimicrobiumDistal0.01 ± 0.012.67 ± 3.77+0.003
Pseudoramibacter_
Eubacterium
Distal0.003.46 ± 4.90+0.003
MitsuokellaDistal1.12 ± 1.570.02 ± 0.03-0.01
AlkaliphilusDistal0.000.18 ± 0.26+0.02
CoriobacteriaceaeDistal0.04 ± 0.050.08 ± 0.08+0.02
PyramidobacterDistal0.000.10 ± 0.14+0.03
MogibacteriaceaeDistal0.10 ± 0.070.83 ± 1.03+0.03
OxalobacterDistal0.000.07 ± 0.09+0.03
RoseburiaDistal0.11 ± 0.050.01 ± 0.02-0.04
Table 5. Total bacteria and short-chain fatty acid/branched-chain fatty acid (SCFA/BCFA) concentrations detected by fluorescence in situ hybridisation coupled with flow cytometry (FISH-FCM) (Log10 cells/mL) and gas chromatography (GC) (mM), respectively, from each vessel V1, V2, and V3, mimicking the proximal, transverse, and distal colon of within a pH-controlled in vitro faecal (6%) colonic model. Samples were collected at steady state 1 (SS1) (healthy control (HC) medium) and SS2 (restrictive anorexia (R-AN) medium). Data are expressed as means ± standard deviation. Not significant is referred to as n.s. Significant differences in each vessel between SS1 and SS2 are indicated. Total bacteria and SCFA/BCFA increased (+) or decreased (-) in amounts following the fermentation of R-AN medium compared to HC medium (data are expressed as means ± standard deviation).
Colon SiteHCR-ANR-ANp Value
Total bacteria
(log10 cells/mL)
Proximal8.50 ± 0.128.16 ± 0.05-0.0018
Transverse8.23 ± 0.237.73 ± 0.32-0.05
Distal8.00 ± 0.097.28 ± 0.40-0.01
Acetate (mM)Proximal30.02 ± 8.5916.79 ± 1.96-0.023
Transverse42.64 ± 17.1721.31 ± 9.98-n.s.
Distal46.83 ± 28.4431.94 ± 13.40-n.s.
Butyrate (mM)Proximal28.80 ± 3.2616.82 ± 5.98-0.012
Transverse37.37 ± 6.0817.16 ± 9.57-0.011
Distal36.61 ± 12.2020.29 ± 7.76-n.s.
Propionate (mM)Proximal17.54 ± 9.4014.27 ± 13.78-n.s.
Transverse28.82 ± 8.1115.03 ± 6.66-0.039
Distal27.44 ± 10.2119.54 ± 9.97-n.s.
BCFA (Iso-butyrate + Isovalerate) (mM)Proximal2.91 ± 3.382.67 ± 3.61-n.s.
Transverse6.11 ± 1.643.08 ± 1.86-0.05
Distal5.70 ± 1.847.06 ± 4.16+n.s.
Disclaimer/Publisher’s Note: The statements, opinions and data contained in all publications are solely those of the individual author(s) and contributor(s) and not of MDPI and/or the editor(s). MDPI and/or the editor(s) disclaim responsibility for any injury to people or property resulting from any ideas, methods, instructions or products referred to in the content.

