Article

Microalgae, in Spatial Assessment of the Drainage Basin, Influences on the Ecosystem of Lake Agmon, Israel

1
Institute of Evolution, University of Haifa, Abba Khoushi Ave 199, Mount Carmel, Haifa 3498838, Israel
2
Division of Math and Science, Arkansas State University Beebe, 1000 W Iowa St, Beebe, AR 72012, USA
3
M.G. Kholodny Institute of Botany, National Academy of Sciences of Ukraine, Tereshchenkivska st. 2, 01601 Kyiv, Ukraine
*
Author to whom correspondence should be addressed.
Appl. Microbiol. 2022, 2(1), 197-214; https://doi.org/10.3390/applmicrobiol2010014
Submission received: 29 December 2021 / Revised: 15 February 2022 / Accepted: 24 February 2022 / Published: 27 February 2022

Abstract

:
Based on the collected data on the diversity of microalgae and environmental indicators in dry and wet seasons during 2011–2018, from 45 samples, 59 species of microalgae were identified in the ornithological object—Lake Agmon in the Hula Valley. In the samples of periphyton and microphytobenthos, diatoms predominated. Bioindication analysis and statistical mapping revealed the most pronounced zones of influence on the lake ecosystem, as well as indicators of the environment and diversity that clearly demonstrate them. The correlation between the distribution of TDS of water over the lake surface and the distribution of green, diatom microalgae and cyanobacteria detected two areas of impact from the old channel of the Jordan River in the northwestern part and from the drainage channel in the northeastern parts of the lake. The area on the east coast, in contact with the resting fields of migratory birds, has provided nutrients that stimulate the development of green algae and cyanobacteria. This showed implicit links in the lake ecosystem using bioindicators make it possible to recommend them for monitoring in combination with statistical mapping, which visualizes the distribution of data and is easily accessible for the decision-making system for the management of a protected ornithological lake.

1. Introduction

The Agmon Hula Ornithology (Bird Watching) and Nature Park is situated in the Hula Valley, northern Israel. The valley is bordered by the Golan Heights to the east, and the Naphtali Range mountain ranges to the west. The lake is critically located in the center of the Afro-Syrian Rift Valley, one of the most significant bird migration routes in the world. During migration season (fall and spring), over 500 million birds from more than 400 species migrate in the skies above the Hula Valley. Thousands of birds remain in the Lake Agmon catchment area during the winter, and others choose to nest here during the spring and summer. The Agmon Lake area represents a unique ecosystem of regional and international importance. The park is a highly significant and prominent center for eco-tourism in Israel and throughout the world. It can be a model for cooperation between nature, tourism, and agriculture [1].
A microalgae biodiversity study in the Hula and Agmon lakes system was started in 1938 [2] and published in Hebrew. The second phytoplankton study was conducted in 1998 [3,4,5] without differentiation to lakes. A phytoplankton species list was compiled for Hula Lake [6] for the studies conducted during the last hundred years, whereas microalgae in periphyton and benthos in Lake Agmon were never studied before.
Because it is important to understand modern ecosystem sustainable, this can reveal trends in environment changes, and influential points from its catchment basin, which is our present work’s aim. We hypothesis that microalgae can reflect environmental changes and characterize the ecosystem sustainable with help of their bioindicator properties.

2. Materials and Methods

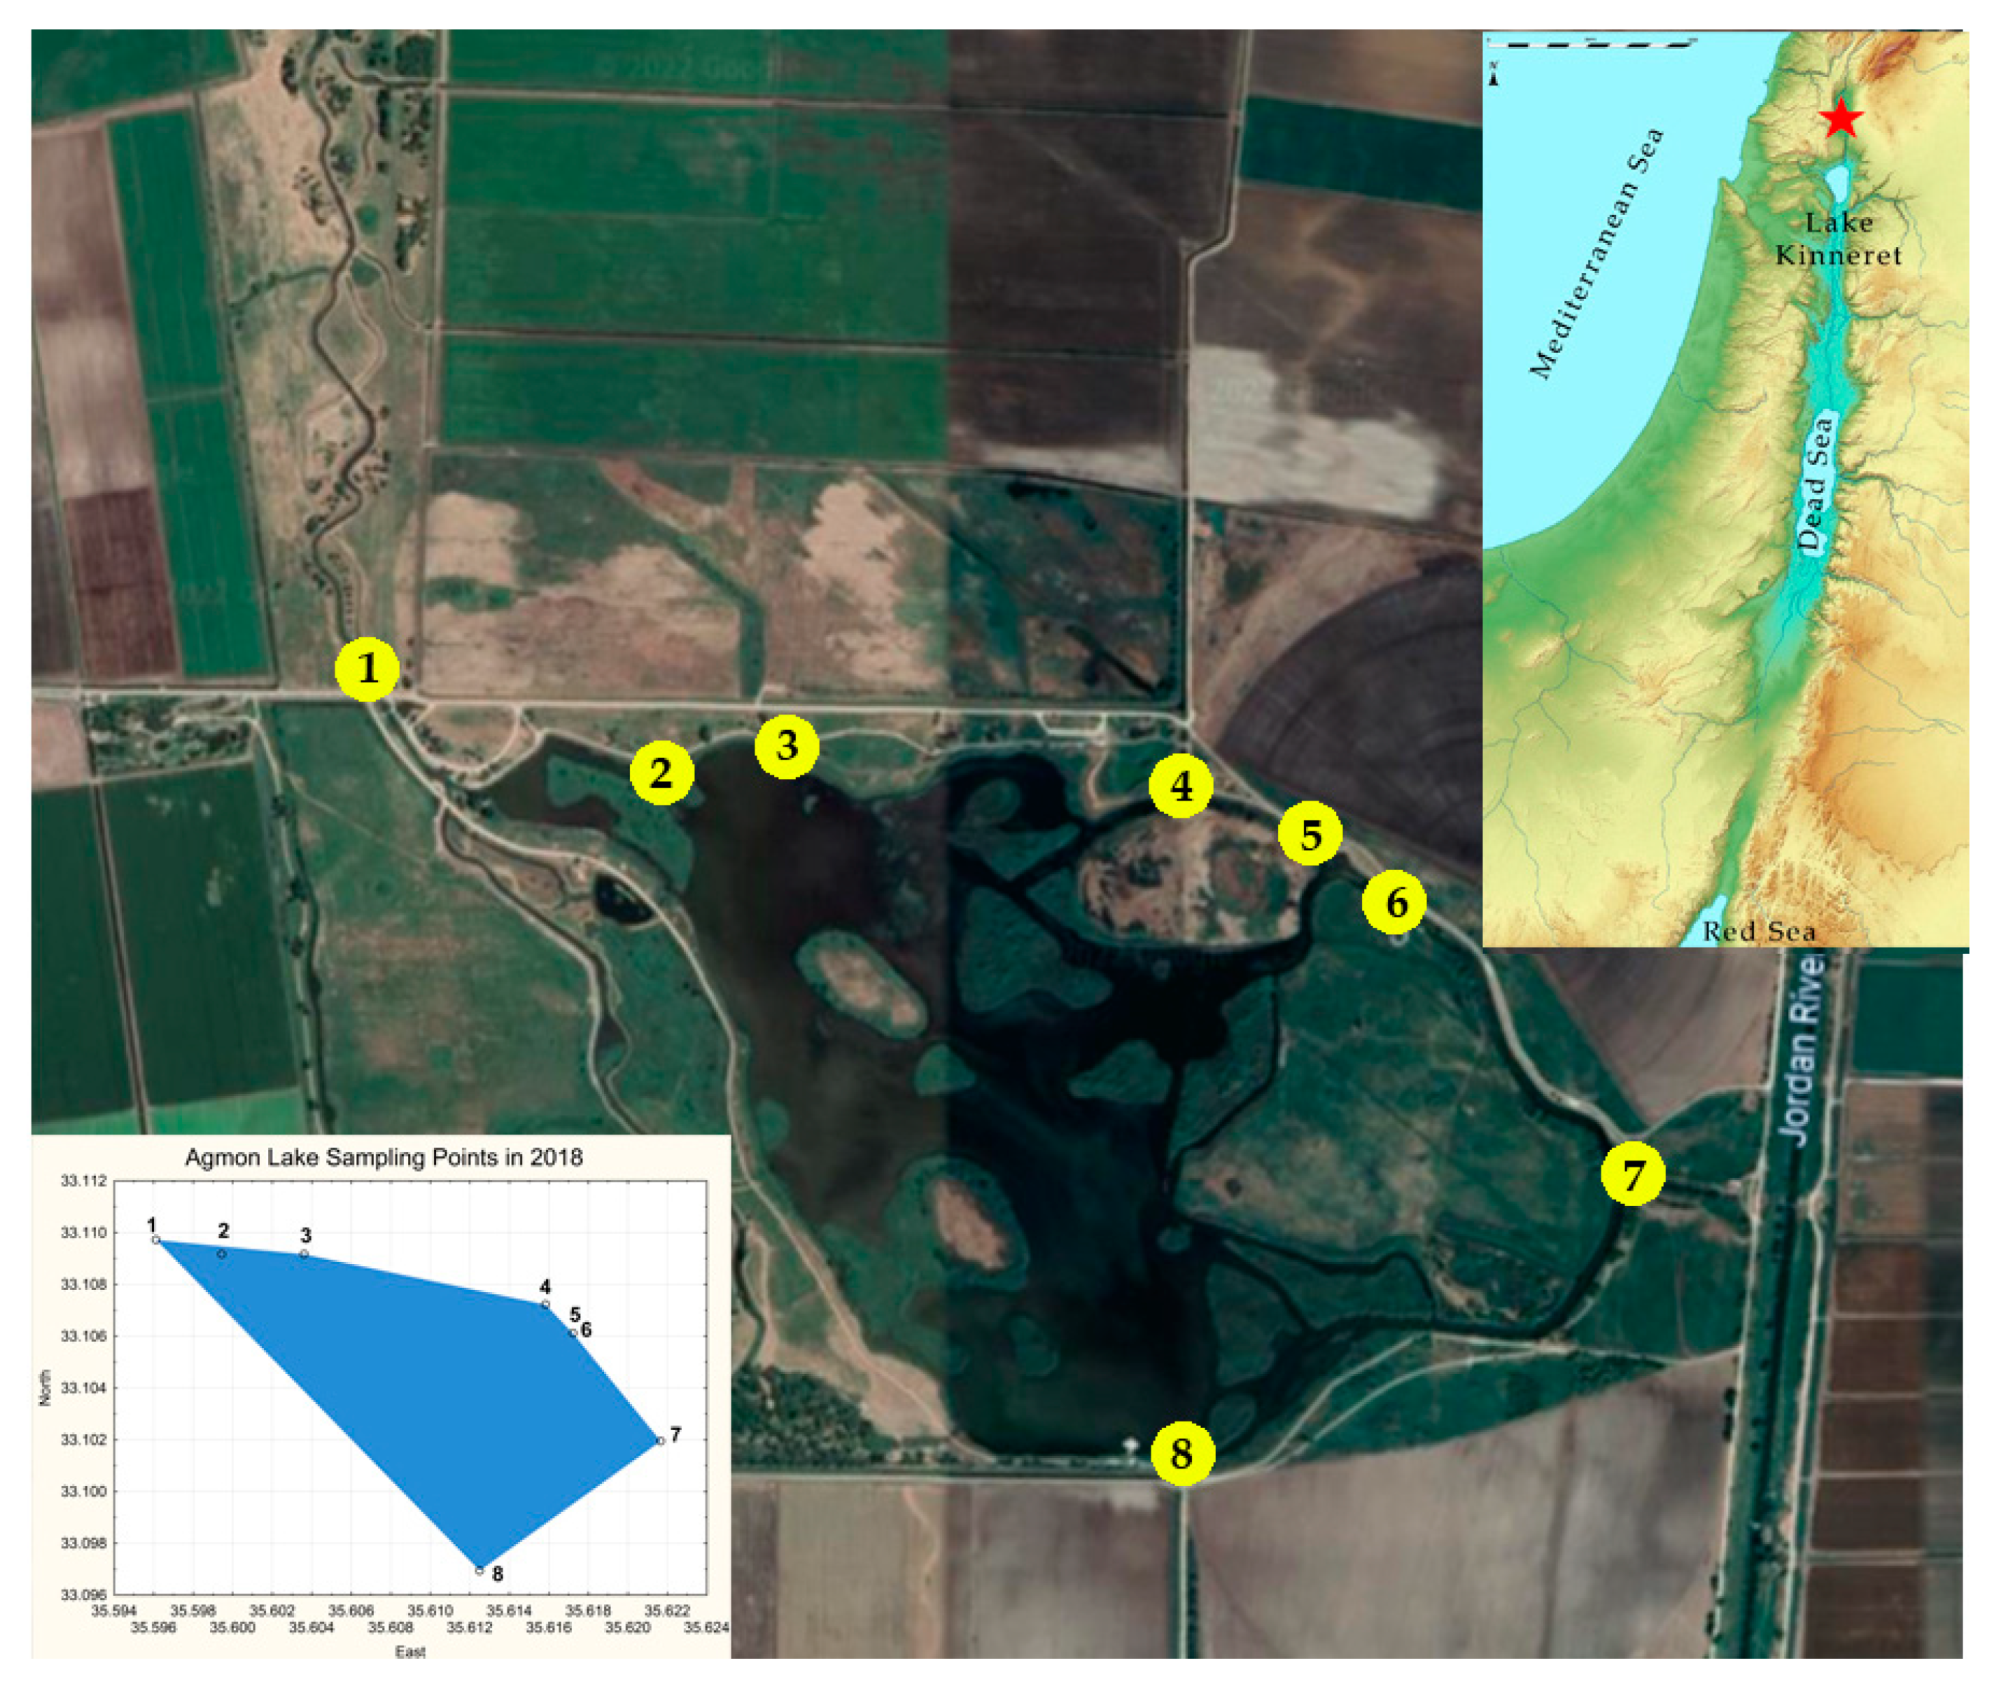
2.1. Description of Study Area

The Hula Valley covers an area of 177 square kilometers (25 km by 6–8 km). The climate of the Hula Valley today is Mediterranean, with hot, dry summers and cool, rainy winters [7]. Agmon Lake has a long history. Prior to its drainage in the 1950s, Lake Hula was 5.3 km long and 4.4 km wide, extending over 12–14 km2. It was about 1.5–3 m deep and was drained in order to increase the arable land area, to eradicate malaria, and to reduce evaporation losses. The drainage was achieved by two main engineering operations: the deepening and widening of the Jordan River downstream, and two newly dug peripheral canals diverting the Jordan at the north of the valley [3,8]. In the late 1980s, the Israeli government decided to find ways of halting soil erosion in the Hula Valley and reducing nutrient loading into Lake Kinneret. A restoration project was planned for the area. In April 1994, Jordan River water flowed once again into a reconstructed part of the drained area at the heart of the Hula as part of the first stage of the rehabilitation project, and a 110-hectare artificial lake was created called Lake Agmon [4,8]. This new lake is shallower and much smaller than the original lake and is placed at an altitude of 117 m b.s.l. (measured by us with GPS Navigator Garmin). It has an irregular shape, covering an area of one square kilometer with generally less than one meter in water depth. Several smaller islands were created in the middle of the lake to provide protection to bird nesting sites.

2.2. Collecting of Chemical Data

Data on the chemical composition of Lake Agmon water are minimal. Historically, in the process of observations during the transformation of Lake Hula and its catchment area, some indicators of water quality were determined [5]. These definitions were sporadic. As was described in 1998, water temperatures usually fluctuated between 12 and 27 °C, with low salinity at about 15–50 mg L−1, and low total dissolved solids (TDS) at 224–373 mg L−1, low alkaline with pH at about 7.2–8.6 and low ammonia concentration. These given data only convey a range of mentioned variables, but they were not defined to a single sampling location from the Hula or Agmon lakes where these variables were measured.
Our serial data were received from the sampling station of Agmon Lake (Figure 1) with GIS coordinates. The measurements were taken in four field trips in 2011, 2012 (Figure 2), and 2018, covering two seasons, summer and winter, because the Hula Valley climate can be divided into two climatic seasons—wet from December to May and dry from June to November. The temperature, conductivity, and pH of the water were measured at the time of sampling with HANNA Waterproof Portable pH/Temperature meter. Water samples for nitrate–nitrogen analysis were collected at the sampling point with plastic tubes of 50 mL volume and transported to the lab in an icebox. Nitrate–nitrogen concentration was measured with a HANNA kit by spectrophotometric method in the laboratory of the Institute of Evolution. GPS coordinates of sampling points were defined with GARNMIN GISMAP 64.

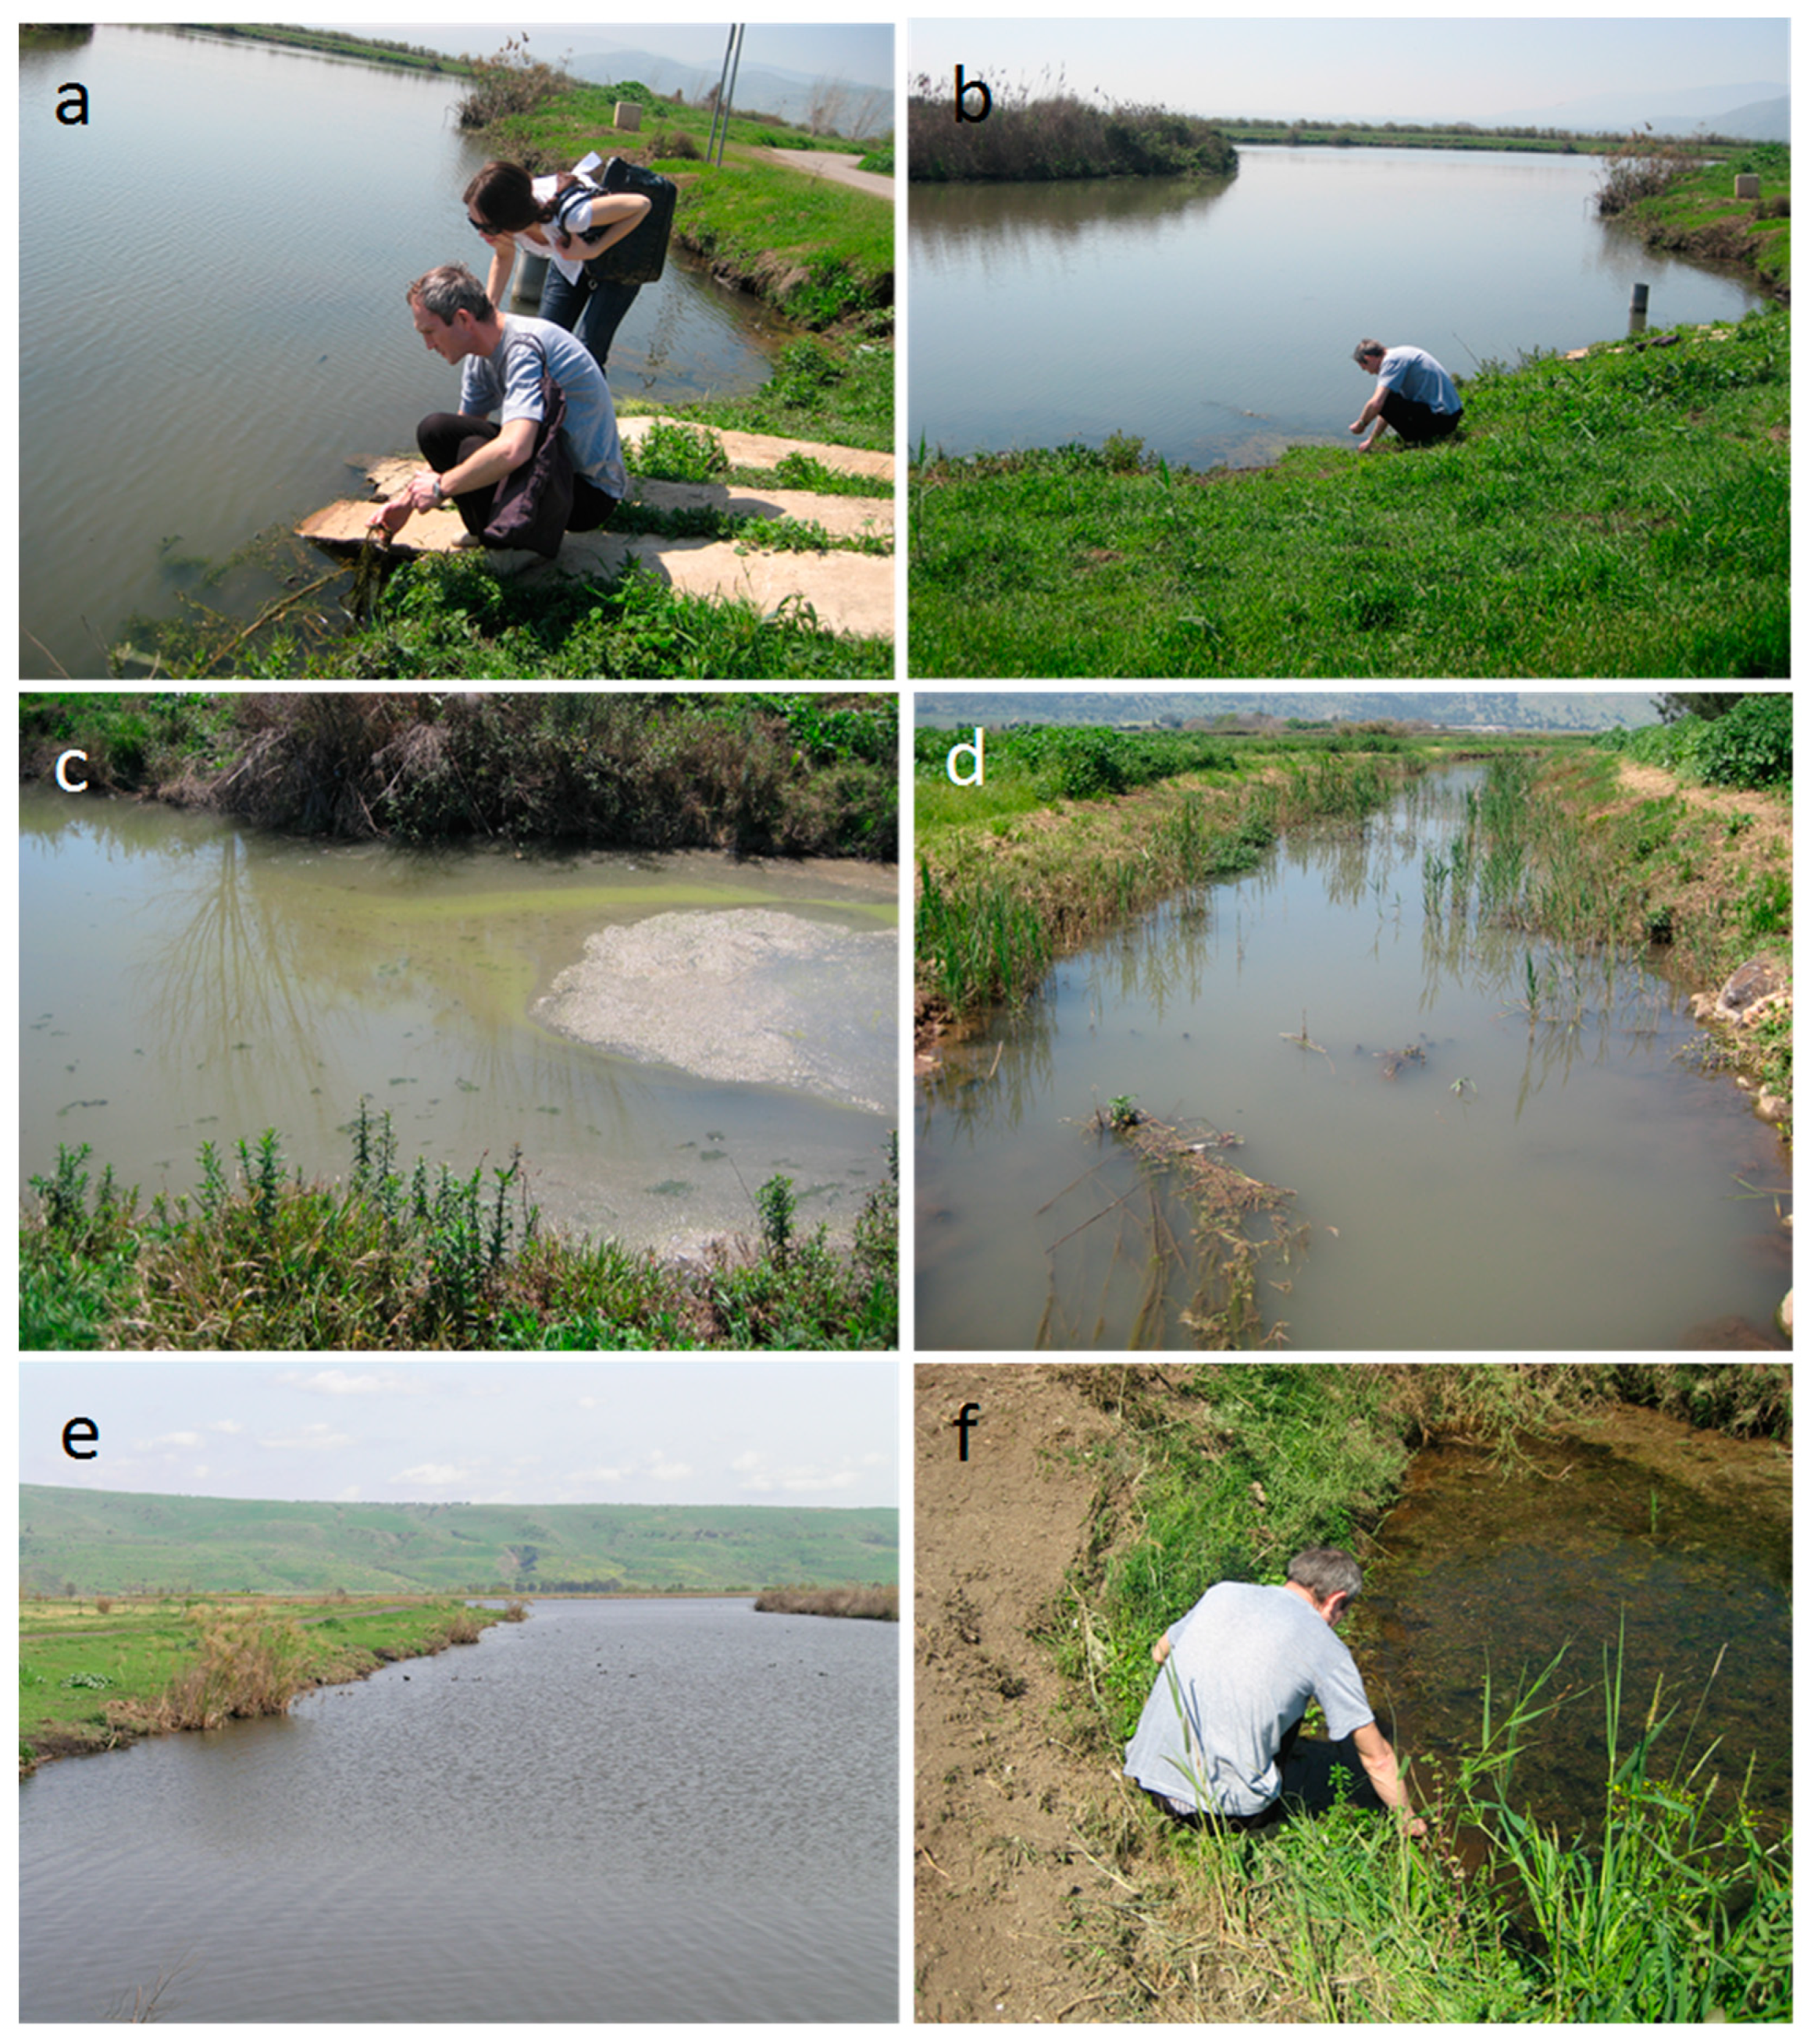
2.3. Sampling and Analysing of Biological Data
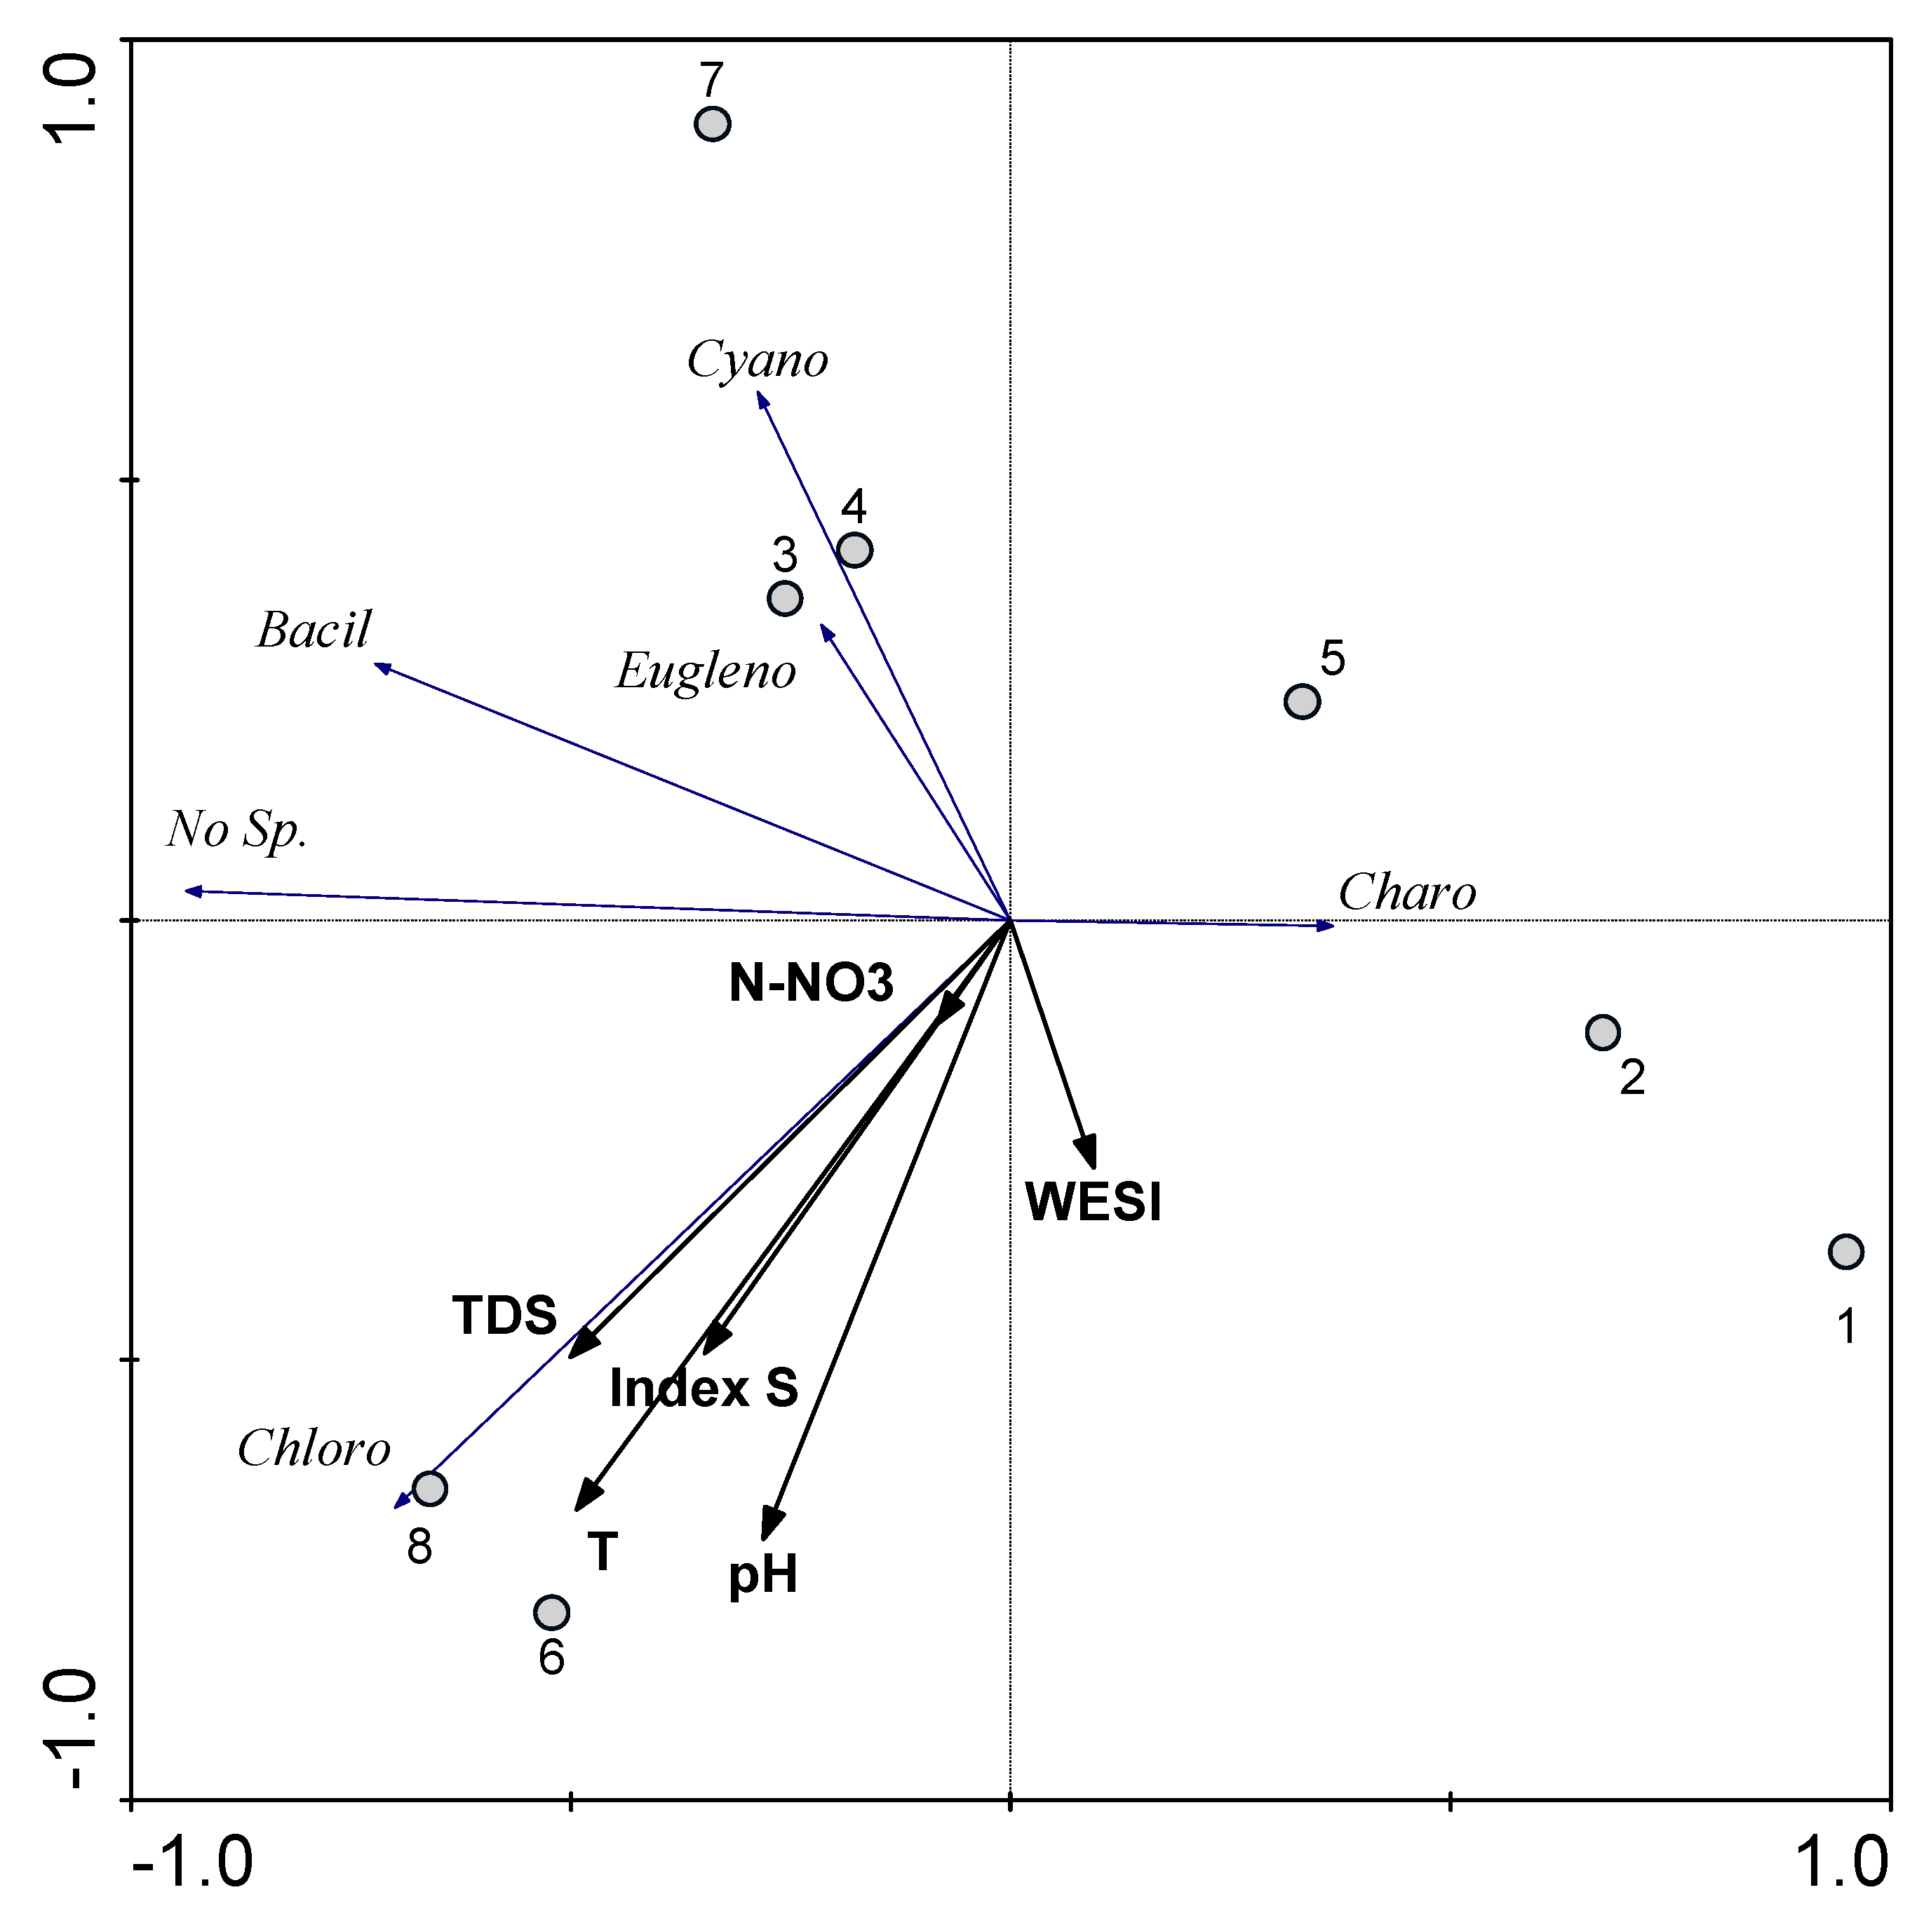
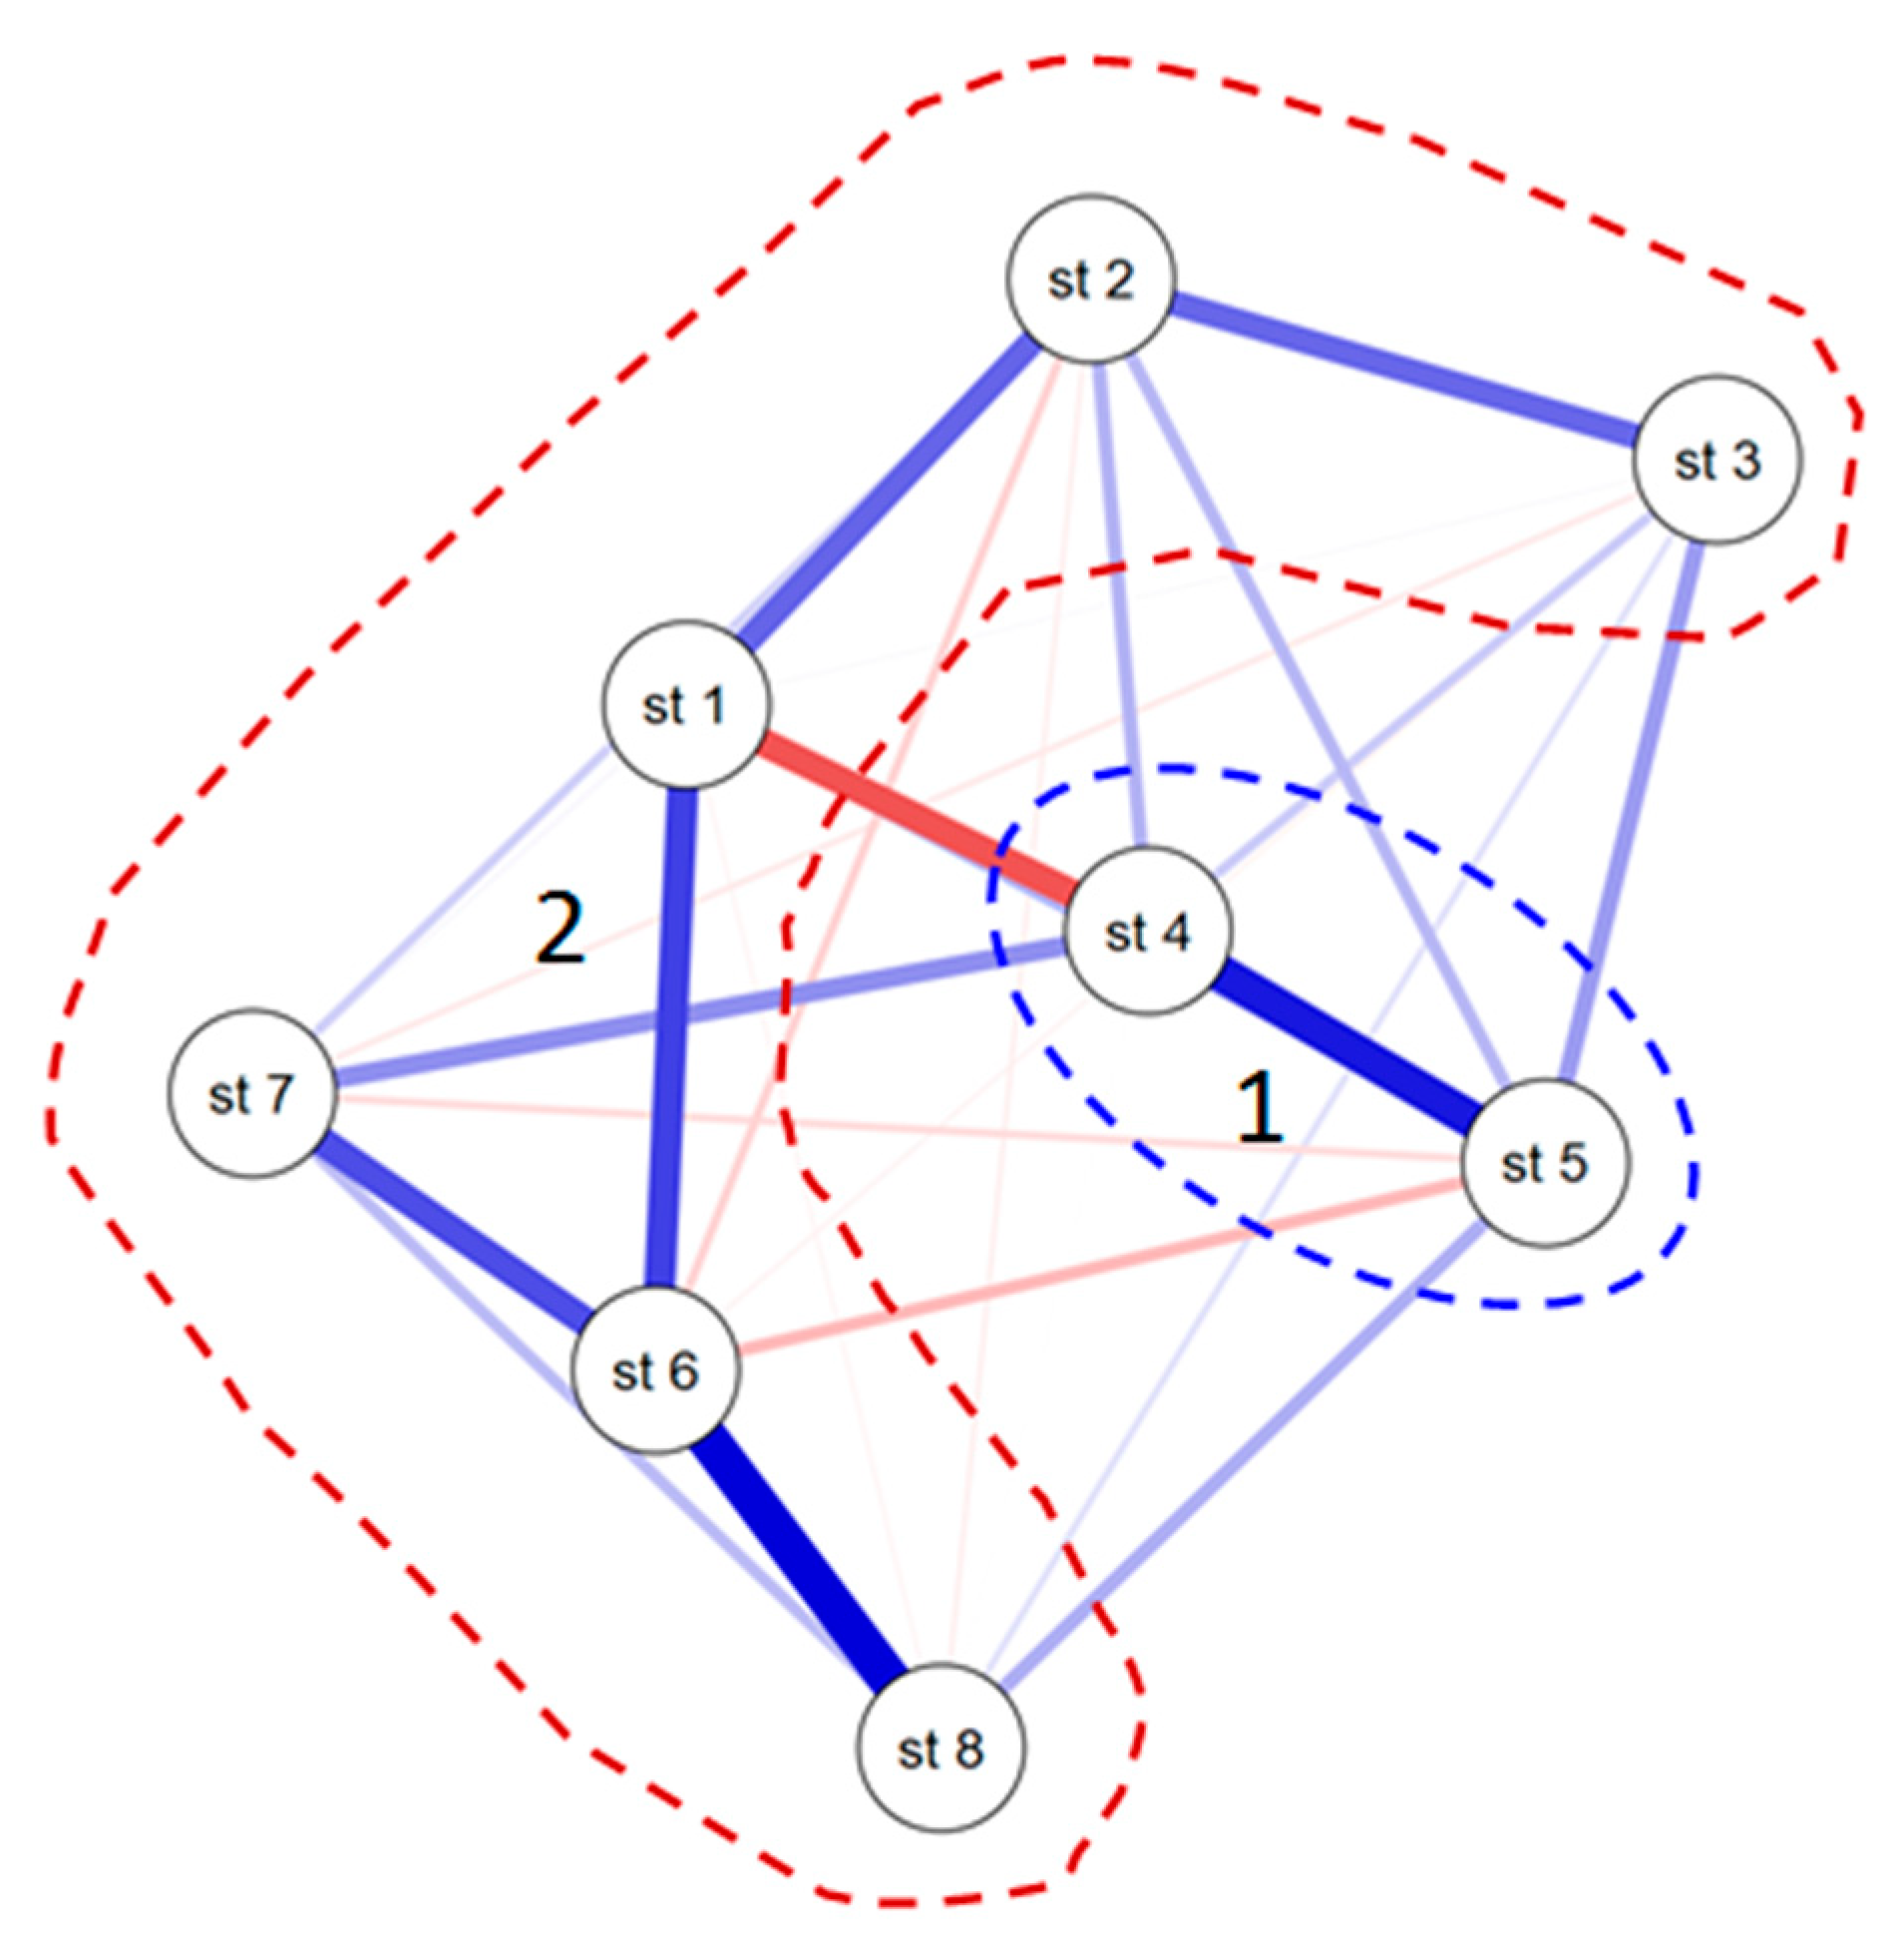
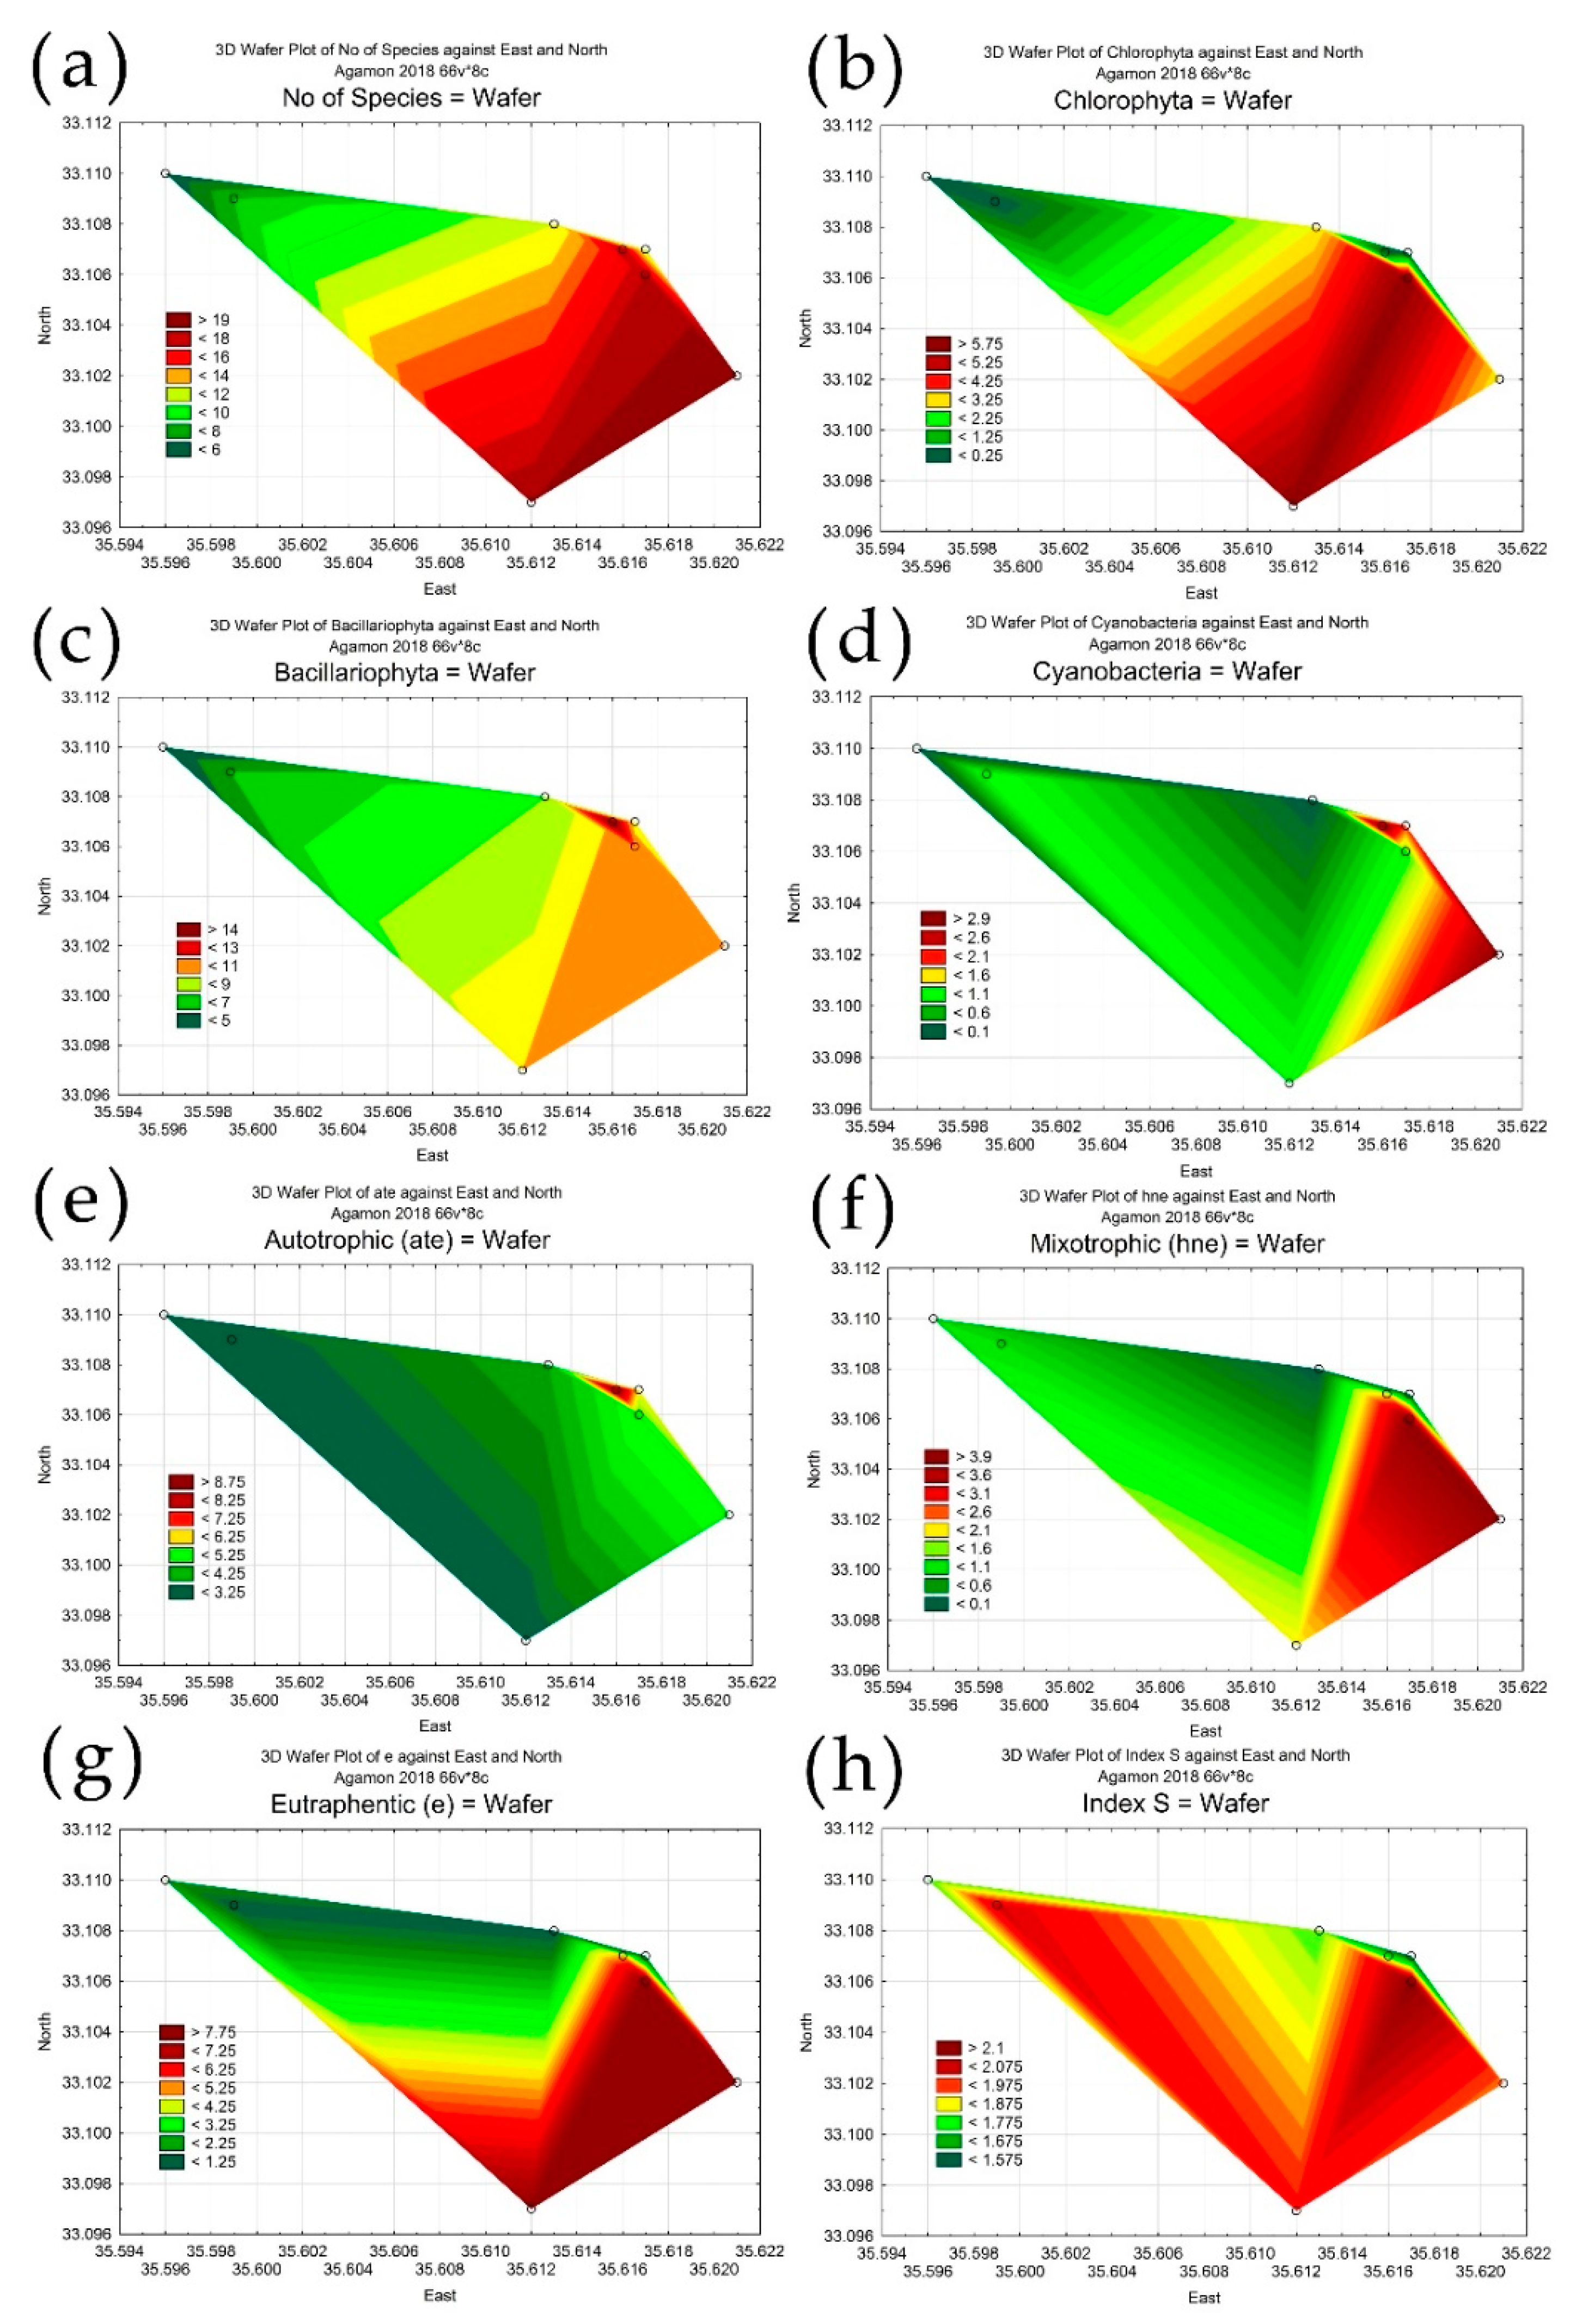
In order to assess the state of the ecosystem of Lake Agmon by microalgae, samples were collected during the summer period of 2018. Altogether, 45 samples of phytoperiphyton and phytobenthos were taken from submerged plants and stones by scratching and were fixed in 3% neutral formaldehyde solution. Twenty qualitative phytoplankton samples were taken with plankton net 20 mesh and fixed at the point with 3% neutral formaldehyde solution. Periphytonic and net samples were transported in an icebox to the Institute of Evolution, University of Haifa for microscopic studies. Samples were separated for study at the Arkansas State University Beebe (United States of America) and at the Institute of Botany (Ukraine). All species were recorded and ranked according to their relative abundance in the sample using the species frequencies six-score scale [9] (Table 1).
The collection and processing of algal material were carried out according to generally accepted methods in phycology. Diatom shells slides were prepared with peroxide technique [9]. All slides of soft and diatom algae were identified with a Leica DM2500 light microscope under 400–1000 magnification and photographed by OMAX 9.0 MP USB Digital Camera.
International handbooks were used to identify algae [10,11,12,13,14,15,16,17,18,19,20,21,22]. All taxa names are currently accepted taxonomically according to the Algaebase.org website [23].
The determination of saprobic indices was carried out according to the Pantle–Buck method in Sládeček’s modification [24]. Saprobity indices were obtained for each algal community as a function of the number of saprobic species and their relative abundances:
S = i = 1 n ( s i h i ) / i = 1 n ( h i )
where S is index of saprobity for algal community (unitless), s is species-specific saprobity index, and n is the cell density of each species (Table 1).
Similarity calculation was performed using the BioDiversity Pro 2.0 program. Correlation network analyses was performed in JASP on the botnet package in R Statistica [25]. Redundancy discriminant analysis of species and environmental variables relationships was performed with the CANOCO Program 4.5 [26]. Heat map was constructed in the ExStartR program [27]. Bioindicator analysis was performed with species-specific ecological preferences of revealed algae and cyanobacteria [28,29,30]. Statistical maps were constructed in Statistica 12.0 program according to [31]. Calculation of the Water Ecosystem State Index (WESI) was performed for definition of the environmental impact to the microalgae communities of sampling stations [28,29,32]. It was an important point of assessment if WESI was more than one and the aquatic ecosystem stayed in good condition, whereas for affected communities, index WESI was below one.

3. Results

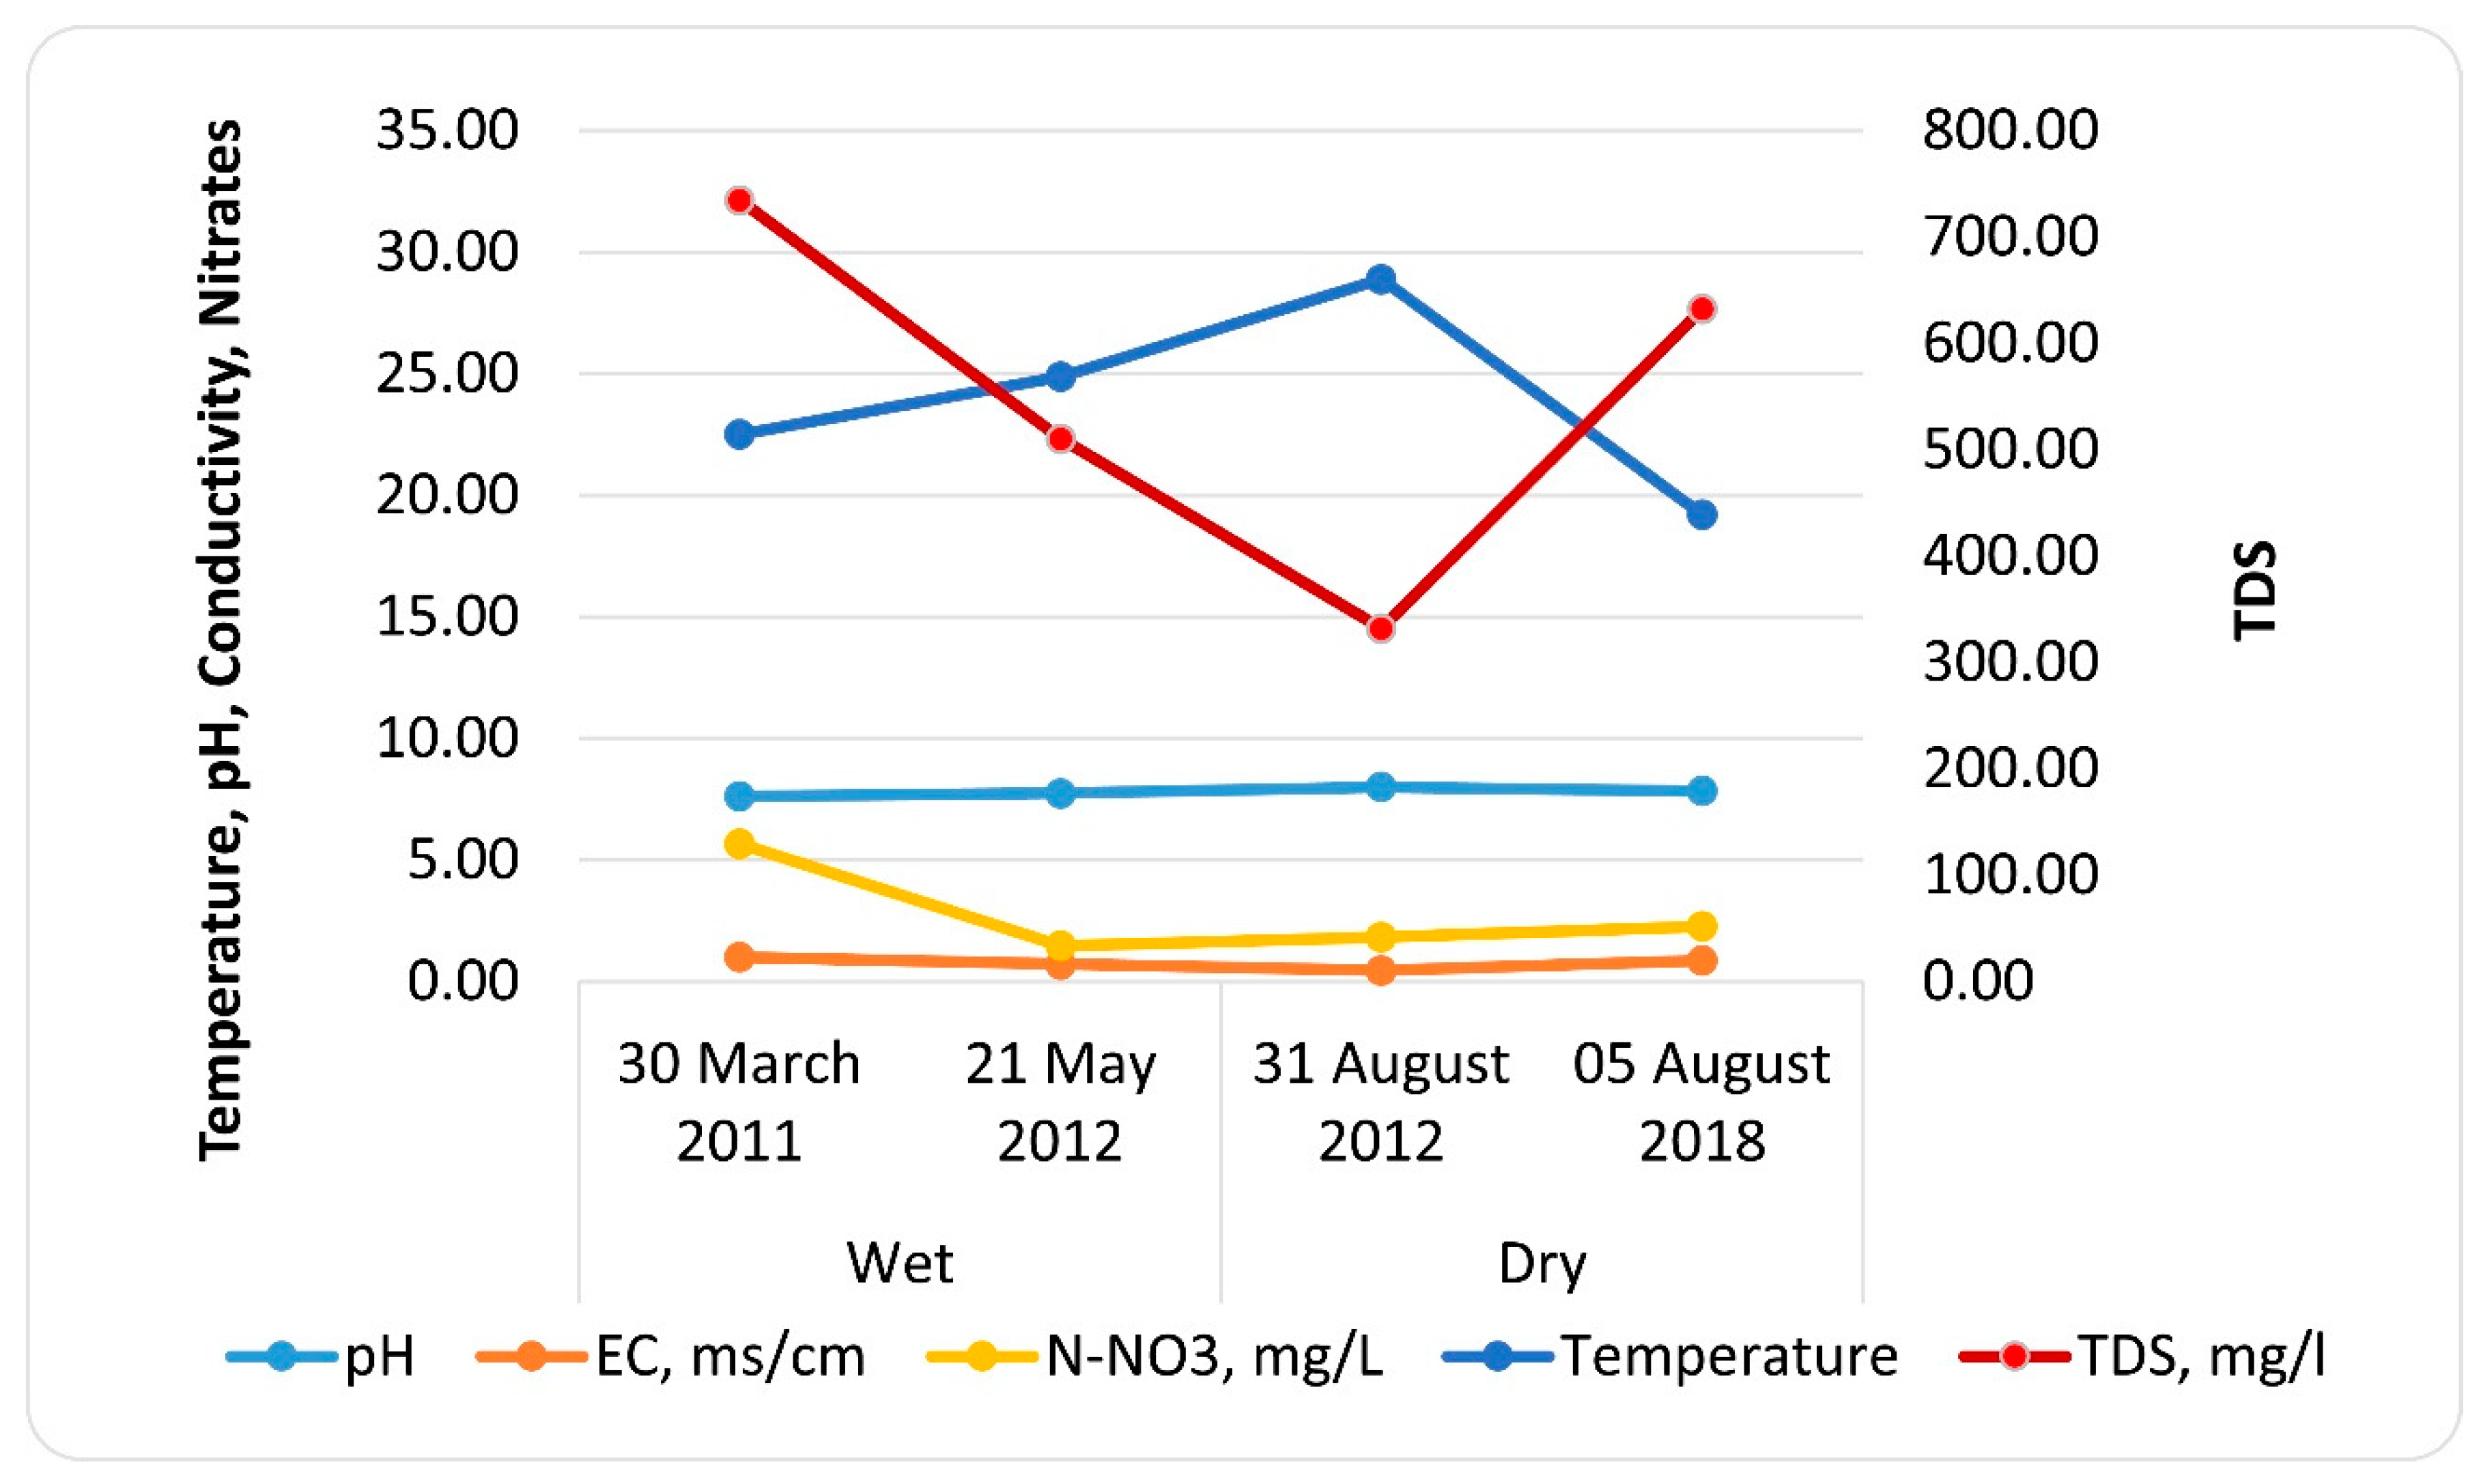
3.1. Chemical Variables

The averaged data measured on sampling stations are presented in Table 2. Water was low in alkaline with pH lowest in the wet season. Electrical conductivity decreased during the period of investigation from 1.01 to 0.87 ms cm−1. TDS and water temperature also fluctuated but without correlation to climatic seasons. Only nitrate–nitrogen definitely declined from 2011 to 2018. Comparison of changes in parameters over the observation period is shown in Figure 3. There is a recognized similar seasonal distribution of nitrate–nitrogen and TDS, but it is negatively correlated with water temperature.

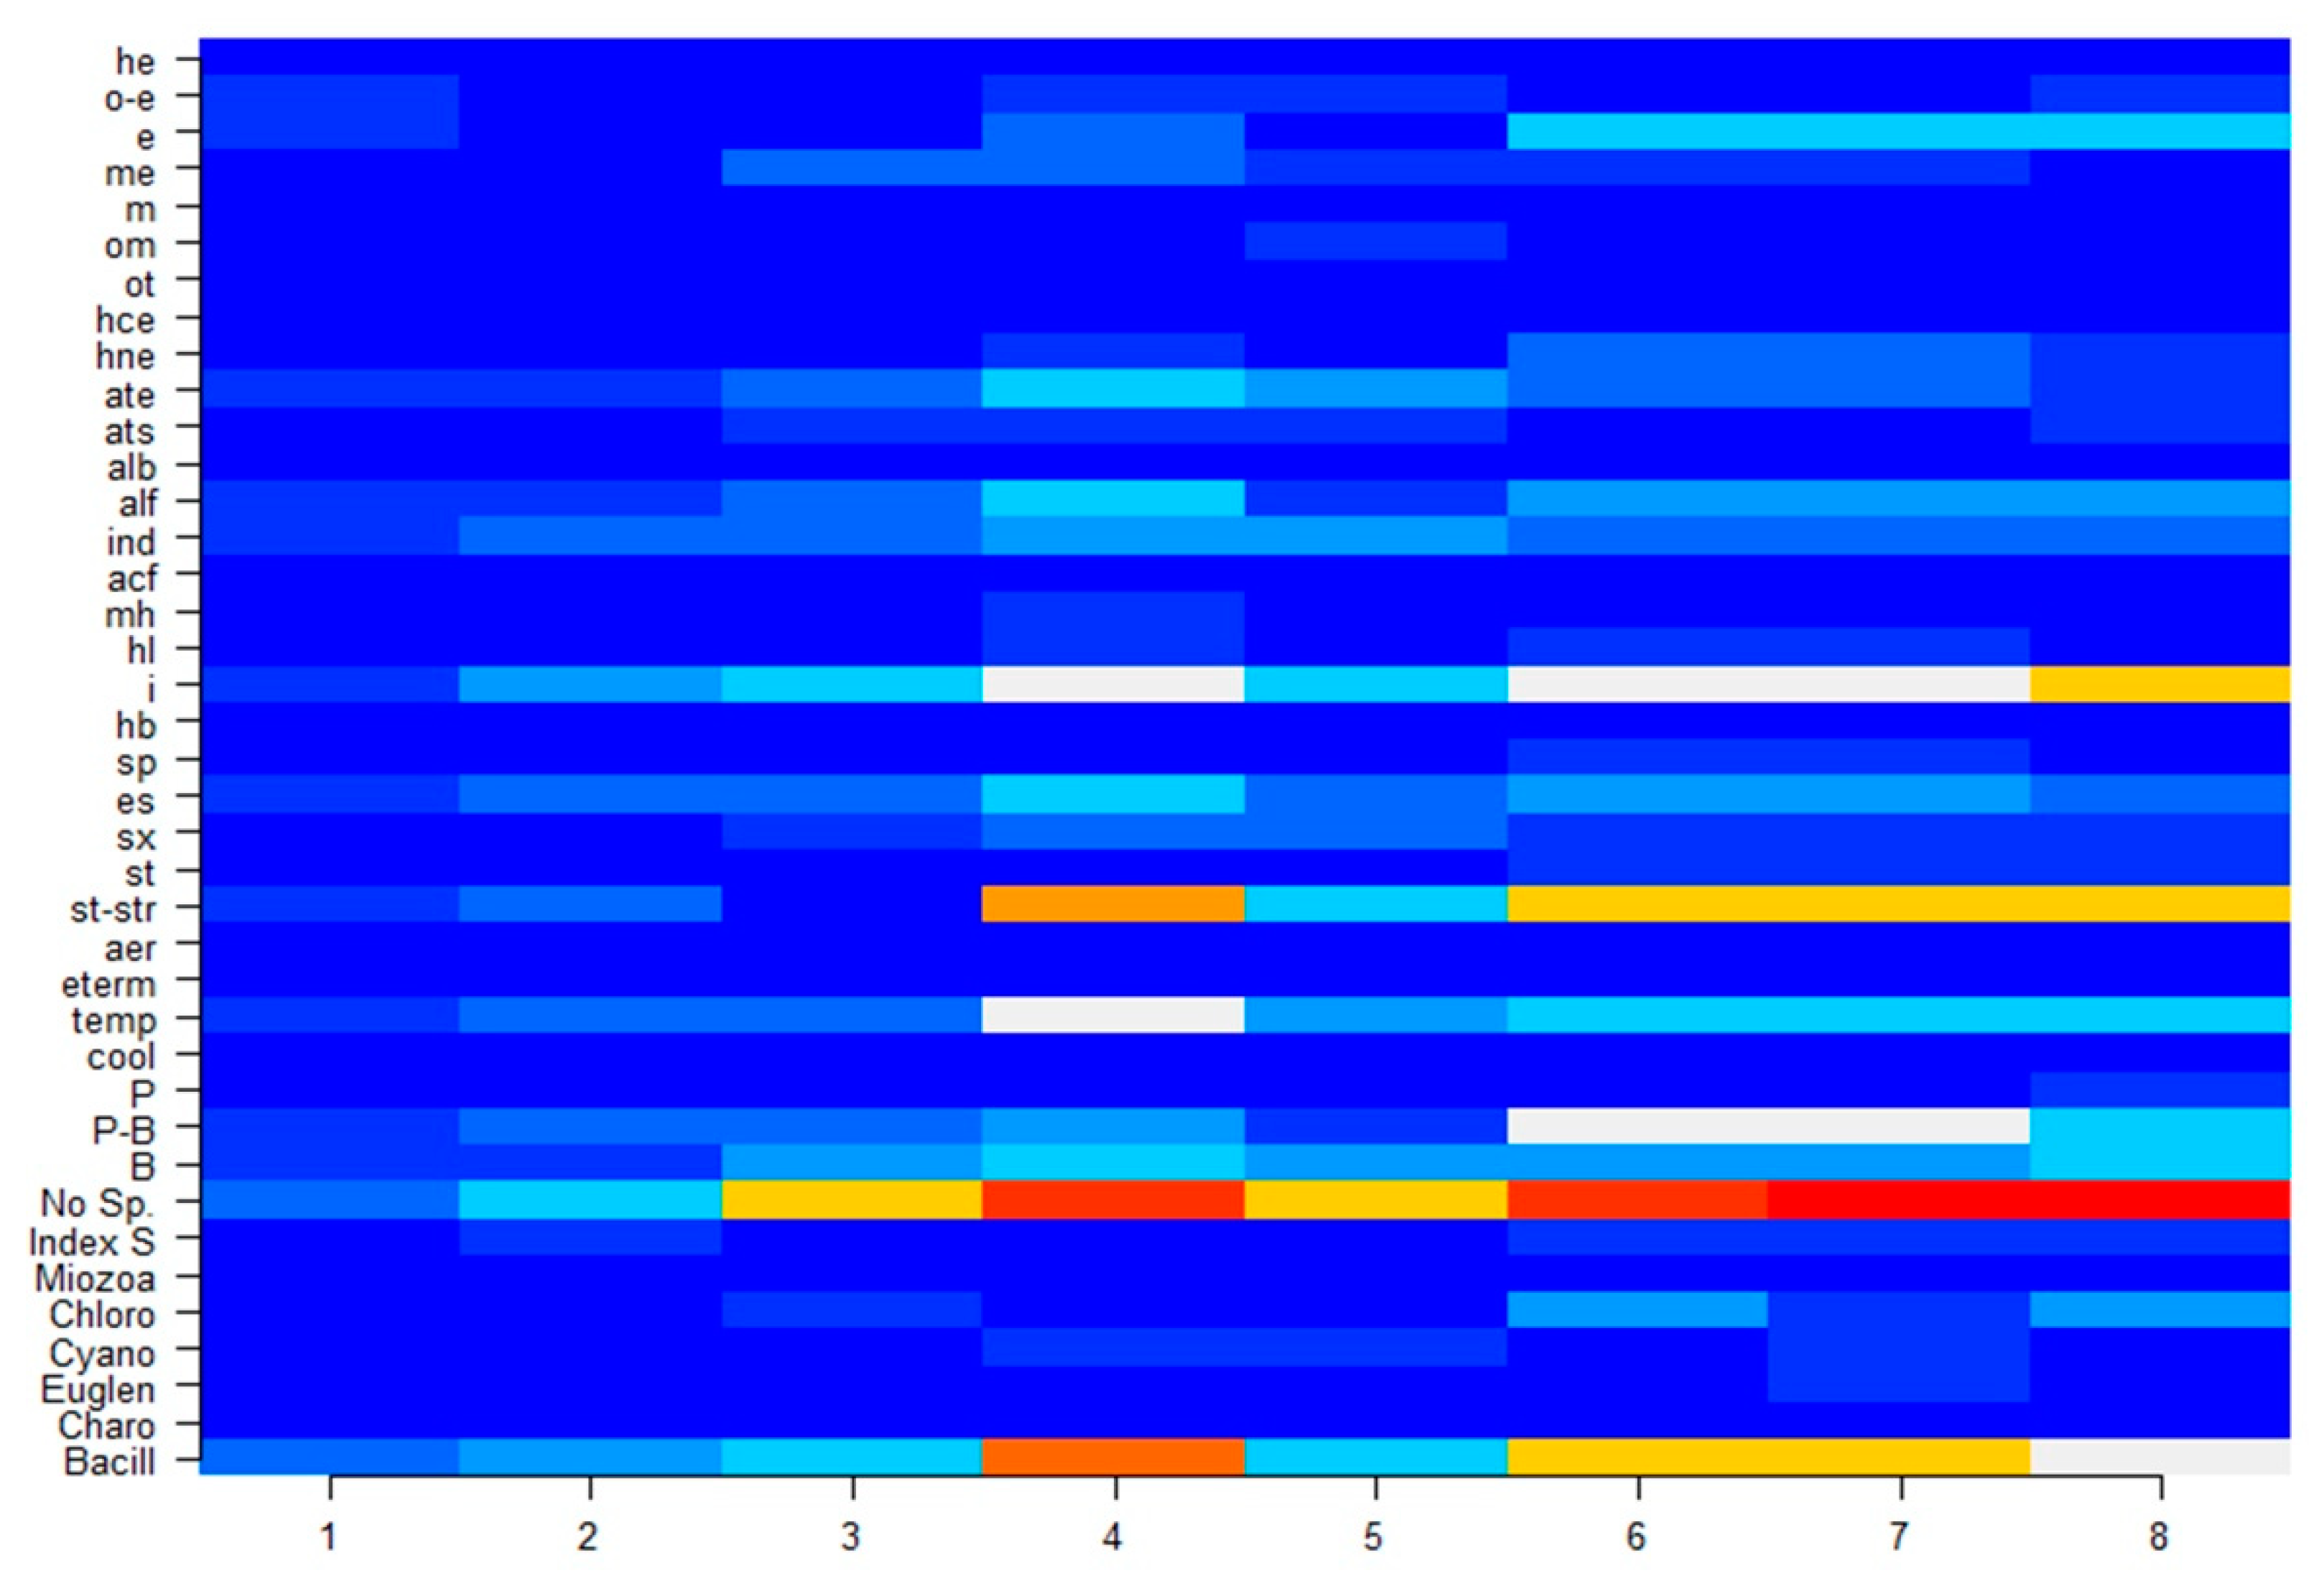
3.2. Microalgae Data

Altogether, 59 species of microalgae were revealed in eight station communities in August 2018 (Appendix A). Diatoms had the highest richness of species with 39 species; green algae was represented by nine species, cyanobacteria by five, Euglenozoa by three, and Miozoa by one species only. The most abundant species in the lake communities were Cyclotella meneghiniana Kützing, Encyonema minutum (Hilse) D.G.Mann, and Nupela impexiformis (Lange-Bertalot) Lange-Bertalot from phyla Bacillariophyta, as well as Pseudagloë polychloris (Pascher) K.I.Meyer from Chlorophyta, Leptolyngbya tenuis (Gomont) Anagnostidis & Komárek and Tychonema decoloratum (G.S.West) Anagnostidis & Komárek from Cyanobacteria. Charophyte species Spirogyra was defined up to genus level only. It dominated the community in the upper part of the lake.
The ecological properties of abundant species are represented in Appendix A, and they demonstrated preferences of inhabiting planktonic–benthic and benthic substrates in temperate temperature, medium oxygenation, low saline, and low alkaline eutrophic waters. Only one diatom species, Cyclotella meneghiniana, was an indicator of organic pollution with saprobity index 2.8, which inhabited the community on station 7 and had mixotrophic nutrition properties.
Distribution of environmental, taxonomic, and bioindicator variables over sampling stations in 2018 is represented in Table 3 and Table 4. It can be seen that TDS, EC, temperature and nitrates were higher in station 7 and reflect the organic pollution input into the lake that stimulated species richness and an increase in Index saprobity S.
Table 4 shows diatoms as the highest species richness phyla at all studied stations, especially at station 4. Planktonic–benthic inhabitants of temperate temperature waters prevailed in all communities. Indicators of medium oxygenation and medium organically polluted waters were rich in station 4. Between four salinity indicator groups, prevailed indifferences but mesohalobe species were found in the station 4 community. Indicators of water pH were more diverse in three southeastern stations. Autotrophic species as a whole prevailed, but in the southeastern station communities, mixotrophic species were found to survive in an inhospitable environment for photosynthesis. Eutrophic indicators prevailed in station 4 and southeastern stations.
As a whole, the taxonomic prevalence and indicator properties of each station community of microalgae is summarized in Figure 4, and it shows similarities in stations 1, 2, 3, 5 (Figure 2a,b,d) and differences in stations 4, 6, 7, 8 (Figure 2c,f).
RDA plot was constructed on purpose to reveal the relationships between environmental and microalgae community variables of Agmon Lake. Figure 5 shows that water temperature, pH, TDS and Index saprobity S regarding organic pollution response stimulated species richness of Chlorophyta from stations 6 and 8, whereas cyanobacteria and Euglenozoa species preferred slightly toxic waters. The index WESI was minimal and reflected some impact to communities in stations 3, 4, and 7.
Correlation analysis of all environmental (Table 3) and microalgae data with abundance from (Appendix A) oversampling stations revealed two different cluster (Figure 6). Stations 4 and 5 combined to cluster 1, and all other stations combined to cluster 2. These results increase the role of station 4 in the formation of the properties of water and communities of microalgae, since it is located at the point where the channel enters the lake, and station 5 is close to it and is located slightly lower in the direction of water flow from the lake.

3.3. Statistical Mapping

Since the results of calculations and plotting are heterogeneous and indicate different impacts on the ecosystem of the lake, statistical mapping of the results was carried out to identify the correspondence.
At the first stage, we compared the distribution of the values of environmental indicators determined by us in the summers of 2012 and 2018 in order to establish the direction of changes in the properties of the water of Lake Agmon. Figure 7 shows that by the summer of 2018 the water temperature became cooler, the water pH remained almost at the same level, but in 2018 it was somewhat lower. However, the distributions of mineral substances and nitrate nitrogen changed dramatically. The source of dissolved salts in 2018 shifted to the southeast and the overall level of TDS became noticeably lower. The amount of incoming nitrates also decreased by almost 60%.However, if in 2012 the impact sources were in the north (Station 4) and east (Station 7), then in 2018 the southeast impact (Station 7 and 8) became much more noticeable, as well as from the water of the old bed of the Upper River Jordan (Station 1) near the tourist center.
Then, the microalgae community response was assessed with help of a statistical maps constructed for the data of 2018. Figure 8 represents the distribution of taxonomic phyla species number in the communities of the stations at Lake Agmon. It can be seen that the total species number was higher where temperature, pH and especially TDS were high (Figure 7b,d,f). Comparison of the distribution of total species number (Figure 8a) and green algae in communities (Figure 8b) allowed us to conclude that Chlorophyta species are the most sensitive indicators of the increase TDS, since these maps are similar.
It can be seen that, in contrast to the green algae, the number of species of diatoms and cyanobacteria, which were noticeably predominant at the point of entry of the drainage channel waters in the northeast of the lake, noticeably decrease in the lake (Figure 8a–d). However, along with the increase in the total number of species, cyanobacteria again increase in their species number at station 7 in the eastern part of the lake (Figure 8d). Autotrophs are more represented among diatoms, green algae and cyanobacteria (Figure 8e), while the distribution of mixotrophic species number correlates with the distribution of cyanobacteria only (Figure 8f). The distribution of eutraphentic species (Figure 8g) generally repeats the distribution of the total species richness (Figure 8a). However, an increased Saprobity Index S (Figure 8h) indicates two entry points for organic pollution: station 4 in the northeastern part of the lake, where the drainage channel enters, and a station near the entrance of the old riverbed of the Jordan River in the northwestern part of the lake.

4. Discussion

Algae, as the primary producers, creating proteins and sending them up the trophic chain, are excellent indicators of the state of the ecosystem in which they develop [33,34]. The indicator properties of algal species are used to identify various types of impacts on the ecosystem of small lakes [28,29,35]. While the floristic composition is usually presented as the number of species of a particular higher taxon, the indicators are distributed not according to taxonomic, but according to ecological groups of species that have similar preferences for the indicated environmental parameter [30]. Thus, with help of the species composition, as well as the distribution of indicator-species by ecological groups, it is possible to reveal a general characteristic of the studied waterbody. Small lakes are usually shallow; that is, they do not leave room for the development of phytoplankton. In this case, the species composition of the periphyton and microphytobenthos becomes essential. Together with phytoplankton, these species constitute both species richness and are the basis for identifying groups of the most prosperous indicators. Thus, it seems necessary to study algae in all ecotopes for small lakes. The best set of indicators for analyzing the state of small water bodies is a combination of bioindicator and taxonomic composition with environmental variables.
The territory of the eastern Mediterranean is located on the border of the climatic zones, with a transition from a humid climate to a semi-desert and desert [7]. Here, the only large freshwater body is Lake Kinneret and the Dead Sea salt lake. The rest of the territory is poorly saturated, except for small rivers, with small bodies of water. The study of the species composition of algae in small lakes has been carried out for hundreds of years; however, a number of them still remain unexplored [36,37,38,39,40,41]. There are more than 200 nature reserves in Israel, the territory of which, most often, is confined to water. However, with a developed monitoring system, biological indicators are not included in observations, and only chemical variables of water are determined [42].
Thus, for the organization of minimum impact management, it is necessary to understand what factors, where, when and with what intensity affect the water body, the core of the reserve. Using the example of the small Lake Agmon, which has almost a century of complex history and is currently an ornithological attraction, we tried to identify these factors. To obtain the results, the species composition and abundance of algae and cyanobacteria in the lake, chemical parameters of water, and coordinates of sampling points in different years from 2011 to 2018 were determined. The summer period was chosen for sampling of the biotic community since in the summer the load of pollutants in the Upper Jordan basin is minimal [33], as well as the fluctuation of water runoff, and is therefore close to the reference level.
Many of the species of algae identified in Agmon are present in the list of Lake Hula, which has the same historical roots [6]. However, the inclusion in the analysis of all diversity from both phytoplankton and phytoperiphyton showed a shift in Agmon toward diatoms, while green algae predominated in the studied phytoplankton of Hula. All Agmon algae species have proven to be indicators of water quality and have become the basis for environmental analysis. The indicators revealed a preference for plankton–benthic habitats in waters with medium oxygen-rich and moderate temperatures. The number of indicator types was the largest in the categories of weakly alkaline waters, moderately saturated with organic matter. The identified species were mostly composed of autotrophs, withstanding weak organic pollution, and characterized Lake Agmon as eutrophic as a result of our indicators–species distribution analysis.
Statistical methods were used to identify implicit patterns in the distribution of indicators over the lake area. In particular, with the help of RDA and JASP, two types of communities were identified developing in the waters near the inflowing drainage channel, as well as in the rest of the lake. That is, our attention was drawn to the peculiarities of these stations. Further, statistical maps were built based on the dynamics of environmental variables during the study period. Statistical maps, first used by us to identify the patterns of distribution of various indicators in Lake Agmon, have long established themselves as an apparatus for visualizing and predicting their changes [35,42] in ecosystems of water bodies.
It turned out that the existing differences in the distribution of environmental variables reflect the time difference for water temperature value, inflow of TDS and nitrate–nitrogen, while remaining similar in pH. That is, the dynamics in the maps reflect changes in the relationship between the catchment and the lake. In addition, for the first time, maps of the distribution of taxonomic composition and the most important groups of indicator species showed that the total species richness is determined by green algae, which are most developed in the eastern part of the lake. At the same time, diatoms and cyanobacteria dramatically change their composition in communities near the entrance of the drainage channel, but cyanobacteria are also most diverse in the eastern part of the lake. According to our observations during the collection of material, it was clear that it is the eastern part of the lake that is connected by a channel with a field located on the other side of it, where migratory birds are concentrated in countless numbers (Figure 2e).
Cyanobacteria can form symbiotic association with microalgae where a microalgae–cyanobacteria consortium can result in higher microalgae growth rate and improved nutrient and pollutants uptake [43]. Mixotrophs, in contrast to autotrophs, are also most represented in the eastern part. In addition, eutrophic species and Index saprobity S show two sources of organic pollution inflow: in the areas of the entrance of the old channel of the Jordan River and in the area of the entrance of the drainage canal. Thus, the high role of the influence of the catchment area on the diversity of algae and environmental indicators of Lake Agmon is revealed. The same responses were revealed when studying small reservoirs of Kazakhstan located in a semi-arid zone [42]. It was previously established that the trend of climate change in the Lower Danube basin, as an integral part of the common Mediterranean–Black Sea basin, will affect the ecological state of the lakes and their communities located there; thus, mitigating measures [44,45] to prevent the impact of climate change are urgently needed, especially for protected lakes. In our case, it is impossible to exclude the joint impact on small lakes of both climate change and anthropogenic transformation. Lake eutrophication can also be detected by the response of the ecosystem [46], in particular, by changes in the species composition of primary producers. Conversely, a decrease in the role of phytoplankton due to the development of macrophytes in more than one hundred small lakes in Europe was found, but this was stimulated by an increase in TDS [47].

5. Conclusions

A survey of the protected bird reserve of Lake Agmon during 2011–2018 revealed 57 species of algae and cyanobacteria in plankton and fouling and the dynamics of water quality indicators. Comprehensive analyses of algal diversity and ecology combined with statistical methods have proven to be an effective approach to uncover hidden relationships between environmental variables and algal diversity in small lakes such as Lake Agmon in the semi-arid climate of the eastern Mediterranean. The combination of statistical methods and the bioindicator composition of microalgae made it possible to identify the most pronounced zones of influence on the ecosystem of Lake Agmon, as well as to establish environmental and diversity factors that most clearly show them. Thus, the TDS factor turned out to be the most indicative in relation to the spatial distribution and dynamics of water quality, and at the same time, reflect lake–area interaction. With respect to the TDS for Lake Agmon, two sites were found to be important: (1) the entry of the old Jordan River channel and (2) the entry of the drainage channel into the northeast and northwest parts of the lake, respectively. However, an area on the east coast has attracted particular attention, where the influence of the influx of nutrients that stimulate the development of green algae and cyanobacteria is clearly manifested. Such a conclusion turned out to be possible only as a result of bioindicator analysis of algae communities and statistical mapping of the spatial distribution of environmental and biota parameters. This makes it possible to recommend bioindicator analyses for monitoring in combination with statistical mapping, which, in the form of visualization of the distribution of data, is easily accessible to the administration of the protected lake, which makes decisions of its management.

Author Contributions

Conceptualization, S.B.; methodology, S.B. and T.S.; software, S.B.; validation, S.B., T.S. and P.T.; formal analysis, S.B., T.S. and P.T.; investigation, S.B., T.S. and P.T.; resources, S.B.; data curation, S.B., T.S. and P.T.; writing—original draft preparation, S.B., T.S. and P.T.; writing—review and editing, S.B., T.S. and P.T.; visualization, S.B. All authors have read and agreed to the published version of the manuscript.

Funding

This research received no external funding.

Institutional Review Board Statement

Not applicable.

Informed Consent Statement

Not applicable.

Data Availability Statement

Not applicable.

Acknowledgments

We are thankful to the Israel Ministry of Aliyah and Integration that partly supported this work.

Conflicts of Interest

The authors declare no conflict of interest.

Appendix A

Table A1. Diversity and ecology of algae and cyanobacteria distribution over sampling stations with abundance scores in the Agmon Lake, 2018.
Taxa12345678HabTemOXYDSSAPHALpHAUT-HETTRO
Bacillariophyta
Achnanthidium kranzii (Lange-Bertalot) Round & Bukhtiyarova 199600020000----------
Achnanthidium minutissimum (Kützing) Czarnecki 199401044313P-Betermst-stres0.95b-miindatee
Amphora ovalis (Kützing) Kützing 184400010000Btempst-strsx1.5bialfatee
Aulacoseira granulata (Ehrenberg) Simonsen 197910000005P-Btempst-stres2.0bialfatee
Cocconeis pediculus Ehrenberg 183800222110Btempst-strsx1.8a-bialfateme
Cocconeis placentula Ehrenberg 183801200100P-Btempst-stres1.35oialfateme
Craticula cuspidata (Kutzing) D.G.Mann 199000020000Btempst-stres2.45aialf-me
Craticula halophila (Grunow) D.G.Mann 199000030000Btempst-stres3.0amhalfatee
Cyclotella meneghiniana Kützing 184400000604P-Btempst-strsp2.8ahlalfhnee
Decussiphycus placenta (Ehrenberg) Guiry & Gandhi 201900000001P-B,aercoolstsx0.4x-oialfatsot
Diatoma vulgaris Bory 182400002000P-Btempst-strsx2.2bialfateme
Encyonema minutum (Hilse) D.G.Mann 199000066002Btempst-strsx1.2oiindatem
Encyonema muelleri (Hustedt) D.G.Mann 199010001000Btempst-strsx1.2oiindateo-e
Encyonema silesiacum (Bleisch) D.G.Mann 199000000100Btempstes--ialbhne-
Eunotia pectinalis (Kützing) Rabenhorst 186400000010B-st-strsx0.3xiacfatem
Gomphonella angustata Rabenhorst 185300001000Btempst-stres1.3oiindatsom
Gomphonella olivacea (Hornemann) Rabenhorst 185300200000B-str-1.2oiindatsm
Gomphonella subtile Ehrenberg, 183800302020B-st-stres1.0oiindatsom
Gomphonema parvulum (Kützing) Kützing 184901000405Btempst-stres2.35biindhneom
Gyrosigma kuetzingii (Grunow) Cleve 189400010000---------e
Melosira varians C.Agardh 182700020030P-Btempst-stres2.1bhlindhneme
Navicula cryptocephala Kützing 184411435112P-Btempst-stres2.1biindateo-e
Navicula salinarum Grunow 188000030000P-B-st-str-2.1bmhindateme
Navicula vulpina Kützing 184400000002Btempst-str-2.0biindatsme
Nitzschia flexa Schumann 186201000000B---1.8o-aohalf--
Nitzschia palea (Kützing) W.Smith 185602000200P-Btempst-strsp2.8a-oiindhcehe
Nitzschia paleacea (Grunow) Grunow 188100400020P-Btempst-stres2.2bialfhcee
Nitzschia recta Hantzsch ex Rabenhorst 186200040000Btempst-stres1.5o-bialfateom
Nitzschia subacicularis Hustedt 192200000023Btempst-stres2.0bialfatso-e
Nitzschia tropica Hustedt 194900000200P-Btemp----ialf--
Nupela impexiformis (Lange-Bertalot) Lange-Bertalot 199900006010B--es---ind--
Paraplaconeis placentula (Ehrenberg) Kulikovskiy & Lange-Bertalot 201200000101Btempst-strsx1.5o-bialfatee
Prestauroneis crucicula (W.Smith) Genkal & Yarushina 201700100000B---------
Sellaphora arvensis (Hustedt) C.E.Wetzel & L.Ector 201500300000Betermst-strsx1.9o-ahlindateme
Sellaphora pupula (Kützing) Mereschkovsky 190210020100B--es--hlacfhne-
Staurosira construens Ehrenberg 184300030000P-Btempst-strsx1.3oialfatsme
Staurosira subsalina (Hustedt) Lange-Bertalot 200400000010P-B-st-stres1.3ohlalfateme
Staurosirella pinnata (Ehrenberg) D.M.Williams & Round 198800020000P-Btempst-stres1.2ohlalfateo-e
Surirella librile (Ehrenberg) Ehrenberg 184500000010P-Btempst-str-2.1bialfatee
Charophyta
Closterium moniliferum Ehrenberg ex Ralfs 184800100000P-B-st-str-2.1biind-me
Spirogyra sp.60000000P-B------alf-e
Chlorophyta
Ankistrodesmus falcatus (Corda) Ralfs 184800000400P-B-st-str-2.3bhb--e
Carteria fritschii H.Takeda 191600000100----------
Characium pringsheimii A.Braun 185500200002B---------
Desmodesmus communis (E.Hegewald) E.Hegewald 200000000303P-B-st-2.0o-a---e
Monoraphidium convolutum (Corda) Komárková-Legnerová 196900000101P-B-st-str-2.3b---e
Oedogonium sp.00000002B------alb--
Pseudagloë polychloris (Pascher) K.I.Meyer 195200000006P--------e
Tetraëdron minimum (A.Braun) Hansgirg 188900100102P-B-st-str-2.1bialf-e
Tetraëdron trigonum (Nägeli) Hansgirg 188800100100P---2.0b---e
Cyanobacteria
Calothrix elenkinii Kossinskaja 192400002050----------
Chroococcus minutus (Kützing) Nägeli 184900020000P-B---1.8o-aiind-e
Leptolyngbya tenuis (Gomont) Anagnostidis & Komárek 198800032062B,S-st-str-2.4b-aialf--
Merismopedia minima G.Beck 189700000200B,S-aer------ot
Tychonema decoloratum (G.S.West) Anagnostidis & Komárek 198806030060----------
Euglanozoa
Trachelomonas pusilla Playfair 191501000001----2.3b----
Euglenaformis proxima (P.A.Dangeard) M.S.Bennett & Triemer 201400000010P-Betermst-str-3.5p-amhind-e
Phacus pusillus Lemmermann 191000000020P-B-st-str-2.5b-a-acf--
Miozoa
Gymnodinium inversum Nygaard 192900000051P---1.6b-o----
Note: 1–8—sampling stations. Ecological preferences: Habitat: P—planktonic, P-B—plankto-benthic, B—benthic. Temperature (Tem): cool—cool water, temp—temperate temperature, eterm—eurythermic. Oxygenation & water moving (Oxy): st—standing water, st-str—low streaming water, aer—aerophiles. Halobity degree (Sal): i—oligohalobes-indifferent, hl—halophiles, hb—halophobes, mh—masohalobes. Acidity (pH): alf—alkaliphiles, ind—indifferents; acf—acidophiles, alb, alkalibiontes. Organic pollution indicators according to Watanabe (D): sx—saproxenes, es—eurysaprobes, sp—saprophiles. S—Species-specific index saprobity S. Saprobity (Sap): x—xenosaprob, x-o—xeno-oligosaprob, o—oligosaprob, a-b—alpha-beta-mesosaprob, o-b—oligo-beta-msosaprob, b-o—beta-oligosaprob, o-a—oligo-alpha-mesosaprob, b—beta-mesosaprob, b-a—beta-alpha-mesosaprob, a-o—alpha-oligosaprob, a—alpha-mesosaprob, p-a—poly-alpha=masosaprob. Nitrogen uptake metabolism (Aut-Het): ats—nitrogen-autotrophic taxa, tolerating very small concentrations of organically bound nitrogen; ate—nitrogen-autotrophic taxa, tolerating elevated concentrations of organically bound nitrogen; hne—facultatively nitrogen-heterotrophic taxa, needing periodically elevated concentrations of organically bound nitrogen, hce—facultatively nitrogen-heterotrophic taxa, needing elevated concentrations of organically bound nitrogen. Trophic state (Tro): ot—oligotraphentic; om—oligo-mesotraphentic; m—mesotraphentic; me—meso-eutraphentic; e—eutraphentic; o-e—oligo-eutraphentic; he—hypereutraphentic. “-” property is unknown.

References

  1. Hula-Agmon Natural Park Authority. Available online: http://agamon-hula.co.il/ (accessed on 24 December 2021).
  2. Rayss, T.; Katchalsky, E. On the plankton in Lake Hula. Hatevah Ve’Haaretz 1938, 5, 483–490. (In Hebrew) [Google Scholar]
  3. Hambright, K.D.; Zohary, T. Lakes Hula and Agmon: Destruction and creation of wetland ecosystems in northern Israel. Wetl. Ecol. Manag. 1998, 6, 83–89. [Google Scholar] [CrossRef]
  4. Hambright, K.D.; Zohary, T. The Hula Valley (Northern Israel) Wetlands Rehabilitation Project. In An International Perspective on Wetland Rehabilitation; Streever, W., Ed.; Kluwer Academic Publishers: Dordrecht, The Netherlands, 1999; pp. 73–180. [Google Scholar]
  5. Pollingher, U.; Zohary, T.; Fishbein, T. Algal flora in the Hula valley—Past and present. Isr. J. Plant Sci. 1998, 46, 155–168. [Google Scholar] [CrossRef]
  6. Barinova, S.; Alster, A. Algae and Cyanobacteria Diversity and Bioindication of Long-Term Changes in the Hula Nature Reserve, Israel. Diversity 2021, 13, 583. [Google Scholar] [CrossRef]
  7. Freshwater Ecoregions of the World, (FEOW). Available online: https://www.feow.org/ (accessed on 21 September 2021).
  8. Payne, R.J. A longer-term perspective on human exploitation and management of peat wetlands: The Hula Valley, Israel. Mires Peat. 2012, 4, 1–9. [Google Scholar]
  9. Barinova, S. How to Align and Unify the Cell Counting of Organisms for Bioindication. Int. J. Environ. Sci. Nat. Resour. 2017, 2, 555–585. [Google Scholar] [CrossRef] [Green Version]
  10. Desikachary, T. Cyanophyta; Pyarelal Sah at the Times of India Press: Bombay, India, 1959; 686p. [Google Scholar]
  11. Dillard, G. Freshwater algae of the southeastern United States, part 1, Chlorophyceae: Volvocales, Tetrasporales and Chlorococcales. In Bibliotheca Phycologica Band 81; J. Cramer: Stuttgart, Germany, 1989. [Google Scholar]
  12. Forest, H. Handbook of Algae; Univ. Tenn. Press: Knoxville, TN, USA, 1954; 467p. [Google Scholar]
  13. Komárek, J.; Anagnostidis, K. Cyanoprokaryota, 1. Teil, Chroococcales. In Süsswasserflora von mitteleuropa, Band 19/1; Ettl, H., Gärtner, G., Heynig, H., Mollenhauer, E., Eds.; Gustav Fisher: Jena, Germany, 1999; 548p. [Google Scholar]
  14. Komárek, J.; Anagnostidis, K. Cyanoprokaryota, 2. Teil, Oscillatoriales. In Süßwasserflora von mitteleuropa, Band 19/2; Büdel, B., Krienitz, L., Gärtner, G., Schagerl, M., Eds.; Spektrum Akademischer Verlag, Elsevier GmbH: München, Germany, 2005; 759p. [Google Scholar]
  15. Krammer, K.; Lange-Bertalot, H. Bacillariophyceae, Teil 1, Naviculaceae. In Süsswasserflora von Mitteleuropa, Band 2/1; Ettl, H., Gerloff, J., Heynig, H., Mollenhauer, D., Eds.; Gustav Fisher: Jena, Germany, 1986; 876p. [Google Scholar]
  16. Krammer, K.; Lange-Bertalot, H. Bacillariophyceae, Teil 2, Bacillariaceae, Epithemiaceae, Surirellaceae. In Süsswasserflora von Mitteleuropa, Band 2/2; Ettl, H., Gerloff, J., Heynig, H., Mollenhauer, D., Eds.; Gustav Fisher: Jena, Germany, 1988; 596p. [Google Scholar]
  17. Krammer, K.; Lange-Bertalot, H. Bacillariophyceae, Teil 3, Centrales, Fragilariaceae, Eunotiaceae. In Süsswasserflora von Mitteleuropa, Band 2/3; Ettl, H., Gerloff, J., Heynig, H., Mollenhauer, D., Eds.; Gustav Fisher: Jena, Germany, 1991; 598p. [Google Scholar]
  18. Krammer, K.; Lange-Bertalot, H. Bacillariophyceae, Teil 4, Achnantaceae, Kritische Ergänzungen zu Navicula (Lineolatae) und Gomphonema. In Süsswasserflora von Mitteleuropa, Band 2/4; Ettl, H., Gerloff, J., Heynig, H., Mollenhauer, D., Eds.; Gustav Fisher: Jena, Germany, 1991; 468p. [Google Scholar]
  19. Krammer, K.; Lange-Bertalot, H. Bacillariophyceae, Teil 5, English and French translation of the keys. In Süsswasserflora von Mitteleuropa, Band 2/5; Büdel, B., Gärtner, G., Krienitz, L., Lokhorst, G., Eds.; Spektrum Akademischer Verlag: Heidelberg-Berlin, Germany, 2000; 311p. [Google Scholar]
  20. Prescott, G. Algae of the Western Great Lakes Area; WM. C. Brown Co. Publishers: Dubuque, IA, USA, 1962; 977p. [Google Scholar]
  21. Whitford, L.; Schumacher, G. A Manual of Freshwater Algae; Sparks Pr Inc.: San Francisco, CA, USA, 1984; 324p. [Google Scholar]
  22. John, D.M.; Whitton, B.A.; Brook, A.J. (Eds.) The Freshwater Algal Flora of the British Isles: An Identification Guide to Freshwater and Terrestrial Alga; Cambridge University Press: Cambridge, UK, 2002; 702p. [Google Scholar]
  23. Guiry, M.D.; Guiry, G.M. AlgaeBase World-Wide Electronic Publication. National University of Ireland, Galway. Available online: http://www.algaebase.org (accessed on 24 June 2019).
  24. Sládeček, V. Diatoms as indicators of organic pollution. Acta Hydroch. Hydrobiol. 1986, 14, 555–566. [Google Scholar] [CrossRef]
  25. Love, J.; Selker, R.; Marsman, M.; Jamil, T.; Dropmann, D.; Verhagen, J.A.; Ly, A.; Gronau, F.Q.; Smira, M.; Epskamp, S.; et al. JASP: Graphical statistical software for common statistical designs. J. Stat. Softw. 2019, 88, 1–17. [Google Scholar] [CrossRef] [Green Version]
  26. Ter Braak, C.J.F.; Šmilauer, P. CANOCO Reference Manual and CanoDraw for Windows User’s Guide: Software for Canonical Community Ordination (Version 4.5); Microcomputer Power Press: Ithaca, NY, USA, 2002; 500p. [Google Scholar]
  27. Novakovsky, A.B. Abilities and base principles of program module “GRAPHS”. Sci. Rep. Komi Sci. Cent. Ural. Div. Russ. Acad. Sci. 2004, 27, 1–28. [Google Scholar]
  28. Barinova, S.S.; Medvedeva, L.A.; Anissimova, O.V. Diversity of Algal Indicators in Environmental Assessment; Pilies Studio Publisher: Tel Aviv, Israel, 2006; 498p. (In Russian) [Google Scholar]
  29. Barinova, S.S.; Bilous, O.P.; Tsarenko, P.M. Algal Indication of Water Bodies in Ukraine: Methods and Prospects; Publishing House of Haifa University: Haifa, Kyiv, Israel, 2019; 367p. (In Russian) [Google Scholar]
  30. Barinova, S. Essential and practical bioindication methods and systems for the water quality assessment. Int. J. Environ. Sci. Nat. Resour. 2017, 2, 1–11. [Google Scholar] [CrossRef]
  31. Barinova, S. Ecological mapping in application to aquatic ecosystems bioindication: Problems and methods. Int. J. Environ. Sci. Nat. Resour. 2017, 3, 1–7. [Google Scholar] [CrossRef] [Green Version]
  32. Barinova, S. On the Classification of Water Quality from an Ecological Point of View. Int. J. Environ. Sci. Nat. Resour. 2017, 2, 1–8. [Google Scholar] [CrossRef]
  33. Barinova, S.; Krassilov, V.A. Algal diversity and bio-indication of water resources in Israel. Int. J. Environ. Resour. 2012, 1, 62–72. [Google Scholar]
  34. Dokulil, M.T. Algae as ecological bio-indicators. In Bioindicators and Biomonitors. Principles, Concepts and Applications, Chapter 9; Market, B.A., Breure, A.M., Zechmeistter, H.G., Eds.; Elsevier: Oxford, UK, 2003; pp. 285–327. [Google Scholar] [CrossRef]
  35. Barinova, S.; Bilous, O.; Ivanova, N. New Statistical Approach to Spatial Analysis of Ecosystem of the Sasyk Reservoir, Ukraine. Int. J. Ecotoxicol. Ecobiol. 2016, 1, 118–126. [Google Scholar] [CrossRef]
  36. Barinova, S.; Romanov, R. How a new locality of algal community in the Negev Desert, Israel was formed. Expert Opin. Environ. Biol. 2015, 4, 1–7. [Google Scholar] [CrossRef]
  37. Barinova, S.; Romanov, R. Unique charophytes locality in the Borot Loz Natural Reserve, Negev Desert, Israel. Discov. Nat. 2015, 9, 33–41. [Google Scholar]
  38. Barinova, S.; Romanov, R. The Ein El Balad Charophyte Locality in the Mount Carmel Biosphere Reserve, Israel. Int. J. Adv. Res. Bot. 2015, 1, 1–12. [Google Scholar]
  39. Barinova, S.; Romanov, R. Charophyte community in the lowermost locality in the world near the Dead Sea, Israel. Int. J. Plant Soil Sci. 2015, 6, 229–243. [Google Scholar] [CrossRef]
  40. Barinova, S.; Romanov, R. Charophyte Communities in the Ein Afeq Natural Reserve, Israel. Nat. Resour. Conserv. 2015, 3, 31–44. [Google Scholar] [CrossRef]
  41. Barinova, S.; Romanov, R. The ancient locality Syndianna with charophytes in the northern Israel. Nat. Resour. Conserv. 2016, 4, 1–14. [Google Scholar] [CrossRef] [Green Version]
  42. Krupa, E.; Barinova, S.; Aubakirova, M. Tracking pollution and its sources in the catchment-lake system of major waterbodies in Kazakhstan. Lakes Reserv. Res. Manag. 2020, 25, 18–30. [Google Scholar] [CrossRef]
  43. Lutzu, G.A.; Dunford, N.T. Interactions of microalgae and other microorganisms for enhanced production of high-value compounds. Front. Biosci. 2018, 23, 1487–1504. [Google Scholar] [CrossRef] [PubMed] [Green Version]
  44. Bănăduc, D.; Joy, M.; Olosutean, H.; Afanasyev, S.; Curtean-Bănăduc, A. Natural and anthropogenic driving forces as key elements in the Lower Danube Basin–South-Eastern Carpathians–North-Western Black Sea coast area lakes: A broken stepping stones for fish in a climatic change scenario? Environ. Sci. Eur. 2020, 32, 73. [Google Scholar] [CrossRef]
  45. Bănăduc, D.; Sas, A.; Cianfaglione, K.; Barinova, S.; Curtean-Bănăduc, A. The Role of Aquatic Refuge Habitats for Fish, and Threats in the Context of Climate Change and Human Impact, during Seasonal Hydrological Drought in the Saxon Villages Area (Transylvania, Romania). Atmosphere 2021, 12, 1209. [Google Scholar] [CrossRef]
  46. Qin, B.Q.; Gao, G.; Zhu, G.W.; Zhang, Y.L.; Song, Y.Z.; Tang, X.M.G.; Xu, H.; Deng, J.M. Lake eutrophication and its ecosystem response. Chin. Sci. Bull. 2013, 58, 961–970. [Google Scholar] [CrossRef] [Green Version]
  47. Muylaert, K.; Pérez-Martínez, C.; Sánchez-Castillo, P.; Lauridsen, T.L.; Vanderstukken, M.; Declerck, S.A.J.; Van der Gucht, K.; Conde-Porcuna, J.M.; Jeppesen, E.; De Meester, L.; et al. Influence of nutrients, submerged macrophytes and zooplankton grazing on phytoplankton biomass and diversity along a latitudinal gradient in Europe. Hydrobiologia 2010, 653, 79–90. [Google Scholar] [CrossRef]
Figure 1. Sampling points in Agmon Lake. Red star, position of Agmon Lake on the map of the Eastern Mediterranean; numbered yellow dots, sampling points in 2011–2018, respectively. Blue map of sampling points is statistically generated base for mapping of variables.
Applmicrobiol 02 00014 g001
Figure 2. Sampling in the Agmon Lake stations: Station 1 (a); Station 2 (b); Station 4 (c); Station 5 (d); Viewpoint station for the birds monitoring (e); Station 8 (f).
Applmicrobiol 02 00014 g002
Figure 3. Comparative dynamics of the environmental variables during seasons and investigated dates of Agmon Lake.
Applmicrobiol 02 00014 g003
Figure 4. Heat map for species richness in phyla, Index of organic pollution S, and species number in the groups of indicators at Agmon Lake, 2018. Abbreviations in the y-axis and station numbers in the x-axis are the same as in Table 4. The color of the cells varies from blue to red according to the proportion of the number in the entire distribution.
Applmicrobiol 02 00014 g004
Figure 5. RDA plot of the relationships between environmental variables, Index of organic pollution S, Index of toxic impact WESI (black arrows) and species number in taxonomic phyla (blue arrows) in the Agmon Lake, 2018.
Applmicrobiol 02 00014 g005
Figure 6. JASP Network plot for correlation of species abundance and environmental variables in sampling stations of Agmon Lake, 2018. Abbreviated sampling stations stay in the corners of the network as V1-V8, the blue lines are the positive correlations, the red lines are the negative correlations, the line thickness corresponds to the power of correlation, and clusters are outlined by dashed lines.
Applmicrobiol 02 00014 g006
Figure 7. Statistical maps for comparison of summer environmental variables dynamics of Agmon Lake in 2012 (a,c,e,g) and 2018 (b,d,f,h).
Applmicrobiol 02 00014 g007
Figure 8. Statistical maps for species number in phyla and indicator group, and Index saprobity S value in the Agmon Lake in 2012 (a,c,e,g) and 2018 (b,d,f,h).
Applmicrobiol 02 00014 g008
Table 1. Species frequencies scale according to [9].
ScoreVisual EstimateCell Numbers of Plankton per LCell Numbers of Periphyton per Slide (20 × 20 mm)Cell Number of Each Species, %
1Occasional1–103 cell L−11–5 cells per slide<1
2Rare103–104 cell L−110–15 cells per slide2–10
3Common104–105 cell L−125–30 cells per slide10–40
4Frequent105–107 cell L−11 cell over a slide transect40–60
5Very frequent106–107 cell L−1Several cells over a slide transect60–80
6AbundantMore than 107 cell L−1One or more cells in each field of view80–100
Table 2. Averaged environmental data for seasons of investigation in Agmon Lake.
DateSeasonpHEC, ms cm−1TDS, mg L−1N-NO3, mg L−1Temperature °C
30 March 2011Wet7.611.01734.755.6722.50
21 May 2012Wet7.740.71510.401.4724.88
31 August 2012Dry7.990.46331.951.8328.89
5 August 2018Dry7.840.87632.382.2819.20
Table 3. Distribution of environmental variables, species richness, Index saprobity S over sampling stations with its geographical coordinates at Lake Agmon in summer 2018.
StationNorthEastIndex SNo of SpeciespHElectrical Conductivity
ms cm−1
TDS,
mg L−1
Temperature,
°C
N-NO3
mg L−1
133.06.3635.35.461.7757.70.9266217.03.8
233.06.3335.35.582.0688.00.4532719.90.7
333.06.2935.36.471.77127.80.3626518.31.6
433.06.2635.36.561.75187.80.3624617.61.6
533.06.2435.37.001.55117.70.4028619.31.2
633.06.2235.37.032.17207.91.74128521.84.5
733.06.0635.37.171.94187.51.3195518.03.8
833.05.4935.36.441.99198.31.42103321.71.0
Table 4. Distribution of species number in phyla and number of indicators in ecological groups over sampling stations in Lake Agmon, 2018.
Group12345678
Phyla
Bacillariophyta468159111110
Charophyta10100000
Euglenozoa01000021
Cyanobacteria01032131
Chlorophyta00300636
Miozoa00000011
Habitat
B22687668
P-B2457310108
P00100112
Temperature
cool00000001
temp344106998
eterm01111111
Oxygen
aer00000110
st-str350139111112
st00000222
Watanabe
sx10245223
es34484665
sp01000221
Salinity
hb00000110
i368109101011
hl10130221
mh00020000
pH
acf10010110
ind24567445
alf22483667
alb00000111
Autotrophy-Heterotrophy
ats00222003
ate33496553
hne11020442
hce01100110
Trophy
ot00000111
om01112111
m00111001
me01452221
e21151888
o-e21122112
he01000110
Note: Habitat: P, planktonic; P-B, plankto-benthic; B, benthic. Temperature: cool, cool water; temp, temperate temperature; eterm—eurythermic. Oxygenation and water moving (Oxygen): st, standing water; st-str, low streaming water; aer, aerophiles. Halobity degree (Salinity): i, oligohalobes-indifferent; hl, halophiles; hb, halophobes; mh, mesohalobes. Acidity (pH): alf, alkaliphiles; ind, indifferents; acf, acidophiles; alb, alkalibiontes. Organic pollution indicators according to Watanabe (D): sx, saproxenes; es, eurysaprobes; sp, saprophiles. Nitrogen uptake metabolism (Aut-Het): ats, nitrogen-autotrophic taxa; tolerating small concentrations of organically bound nitrogen; ate, nitrogen-autotrophic taxa; tolerating elevated concentrations of organically bound nitrogen; hne, facultatively nitrogen-heterotrophic taxa; needing periodically elevated concentrations of organically bound nitrogen; hce, facultatively nitrogen-heterotrophic taxa; needing elevated concentrations of organically bound nitrogen. Trophic state (Tro): ot, oligotraphentic; om, oligo-mesotraphentic; m, mesotraphentic; me, meso-eutraphentic; e, eutraphentic; o-e, oligo-eutraphentic; he, hypereutraphentic.
Publisher’s Note: MDPI stays neutral with regard to jurisdictional claims in published maps and institutional affiliations.

