Article

Multi-Trait Index-Based Characterization of Putative Drought-Heat Tolerant Gamma-Irradiated Rice Mutants Through Artificial Screening at the Seedling Stage


by
Achmad Kautsar Baharuddin
1,2,
Amir Yassi
2,3,
Bambang Sapta Purwoko
4,
Muh Riadi
3,
Amin Nur
5,
Iswari Saraswati Dewi
6,
Reflinur Reflinur
6,
Andi Isti Sakinah
6,
Wijaya Murti Indriatama
6 and
Muhammad Fuad Anshori
2,3,*
1
Agrotechnology Magister Study Program, Faculty of Agriculture, Hasanuddin University, Makassar 90245, Indonesia
2
Rice Research Group, Faculty of Agriculture, Hasanuddin University, Makassar 90245, Indonesia
3
Department of Agronomy, Faculty of Agriculture, Hasanuddin University, Makassar 90245, Indonesia
4
Department of Agronomy and Horticulture, Faculty of Agriculture, IPB University, Bogor 16680, Indonesia
5
Indonesian Agency for Agricultural Engineering and Modernization, Ministry of Agriculture, Jakarta 12540, Indonesia
6
National Research and Innovation Agency, Cibinong 16915, Indonesia
*
Author to whom correspondence should be addressed.
Crops 2026, 6(4), 73; https://doi.org/10.3390/crops6040073
Submission received: 19 April 2026 / Revised: 10 July 2026 / Accepted: 23 July 2026 / Published: 27 July 2026

Abstract

Rice is highly vulnerable to concurrent drought-heat stress, which intensifies the disruption of plant growth and can cause high seedling mortality. Limited genetic diversity further constrains breeding for combined stress adaptation. Thus, mutation breeding has emerged as a solution for inducing beneficial variability in rice genomes. Based on this solution, this study aimed to identify rice mutants tolerant to drought and heat through artificial screening combined with multi-trait index analysis. Experiments were conducted from April to August 2025 at Hasanuddin University in two sequential phases: seedling screening in a controlled stress chamber and pot evaluation under semi-controlled conditions. Mutants were derived from the seeds of the double haploid (DH) rice line HS1-28-1-5, which was previously developed through anther culture and exhibited potential abiotic stress adaptability. DH seeds were exposed to gamma irradiation (200–1000 Gy) as the M1 population. Based on radiosensitivity evaluation, 200 and 400 Gy were selected and used in the present study as the M2 populations. Rice M2 evaluation results indicated that 200 Gy irradiation enhanced phenotypic variability with improved performance, whereas M2 400 Gy resulted in broader but less stable variation. Yield components were strongly associated with weight per clump, with panicle length being the primary direct contributor and weight per panicle mediating indirect effects. Principal component analysis accounted for 89.13% of the total variation, which was predominantly driven by yield traits. Integrated weighted average absolute score–tolerance score analysis classified genotypes into tolerance groups, identifying 33 putative tolerant mutants, with M2 200 Gy mutants demonstrating superior adaptability to drought-heat stress. These findings suggest that moderate irradiation coupled with multi-trait index selection provides a reproducible framework for identifying putative drought-heat-tolerant rice candidates at early stages while retaining relevance to subsequent yield recovery.

1. Introduction

Agricultural production systems are currently facing unprecedented challenges from global climate change, which alters environmental conditions. In response to these changes, phenomena such as rising temperatures, irregular precipitation patterns, and increased frequency of extreme weather events have intensified abiotic stresses that threaten crop productivity worldwide [1]. Drought and heat stress have emerged as the major abiotic stresses affecting plants. Both stresses critically impact fundamental plant processes by disrupting physiological functions, such as photosynthesis, stomatal regulation, and cellular homeostasis [2,3], which can lead to yield reductions of up to 50% [4], depending on crop type, developmental stage, and stress intensity. Under tropical conditions, drought-heat stress frequently occurs simultaneously rather than individually, often resulting in more severe impacts on plant growth, particularly in major staple crops, such as rice [5,6].
Despite its importance in providing carbohydrates to more than half of the global population, rice is highly sensitive to environmental stresses, particularly drought and heat stress [7,8]. The increasing occurrence of these stresses in major rice-growing regions has raised concerns about the stability of rice production throughout its life cycle. Among the different developmental stages, the seedling stage is particularly sensitive to abiotic stress, as it determines early plant vigor and successful crop growth [9,10]. Several studies have shown that exposure to drought and heat during this stage can impair root and shoot development, reduce biomass accumulation, and compromise plant survival, leading to the early death of seedlings [6,11]. Therefore, screening at the seedling stage is a crucial step for developing tolerant rice genotypes.
The development of tolerant rice genotypes has been widely pursued through conventional breeding and genomic approaches [12,13,14]. However, these methods are often time-consuming, costly, and labor-intensive, requiring multiple breeding cycles and extensive field evaluations [15]. Moreover, most breeding efforts have primarily focused on developing single-stress (mono-tolerant) rice, thus limiting their effectiveness under field conditions, where multiple stresses frequently occur simultaneously. Developing multi-tolerant varieties is inherently difficult because of narrow genetic diversity and limited variability within existing germplasm [15,16,17]. These constraints highlight the limitations of conventional and genomic breeding. Given these challenges, there is a pressing need for approaches that can effectively develop multi-tolerant rice.
Mutation breeding has emerged as a valuable approach for inducing diverse genetic variation within existing mutant populations without the introduction of external genes [18,19]. It offers rapid selection of new phenotypes and overcomes the limitations of naturally occurring variability [20,21,22]. However, mutation breeding faces multiple challenges, including the fact that most induced mutations are neutral or deleterious, making it difficult to identify beneficial changes. The frequency of desirable mutations is often low, requiring the evaluation of large populations [23,24]. Evaluating such populations under field conditions is time-consuming and labor-intensive [25,26]. Thus, artificial screening under controlled stress chambers provides a systematic approach that allows these populations to be scaled down in an environment similar to field conditions [27]. By creating artificial conditions in a controlled setting, this method efficiently narrows down large populations to a manageable set of candidate genotypes for further evaluation [28], while maintaining relevance to actual growing conditions for screening multi-tolerant rice.
Screening gamma-irradiation-induced rice mutants is often complicated by generational timing. Selection at the M1 generation is generally unreliable, as M1 plants have not yet undergone segregation and remain affected by chimerism [29,30]. For this reason, most mutation breeding programs conduct screening at the M2 generation once segregation begins to stabilize [31]. However, screening M2 populations using a single trait, such as yield alone, often results in poor selection efficiency, as yield performance does not necessarily reflect the genotype’s overall stress response [32], risking the exclusion of genetically promising mutants whose tolerance potential is not captured by yield alone.
To address these limitations, the present study applied a multi-trait index selection approach by combining principal component analysis (PCA) with weighted absolute scores (WASB) and tolerance scoring to evaluate multiple traits simultaneously in the M2 generations under a single-environment trial, instead of relying only on yield or one trait. This approach allows trait relationships and overall genotype adaptability to be captured collectively. Despite this demonstrated advantage, relatively few studies have applied multi-trait index approaches specifically to M2 mutant screening for combined drought and heat stress tolerance.
Thus, this study aimed to identify multi-tolerant rice mutant genotypes through the integration of tolerance scoring and multi-trait index approaches and establish a systematic and robust screening framework for the selection of multi-stress-tolerant mutant lines.

2. Materials and Methods

2.1. Experimental Site

The study was conducted at the Green House Experimental Farm, Hasanuddin University, Tamalanrea District, Makassar (7 m above sea level) during the dry season (April to August 2025). The experiment utilized two greenhouse facilities, a stress chamber, and a Center of Excellence (CoE) greenhouse, assigned to different screening stages. The heat chamber, used for seedling-phase screening (Figure S1), consisted of a 2 m (front) × 1.5 m (side) enclosed light steel frame structure fully covered with polyethylene plastic on all sides, with concrete block flooring (Figure S2), allowing maximum solar radiation and heat accumulation to induce high-temperature stress conditions.
Subsequently, selected genotypes from the seedling phase screening were evaluated in the CoE greenhouse at the vegetative to reproductive stages to assess growth performance and yield-related traits under semi-controlled conditions. At both facilities, rainfall was excluded by the greenhouse structures, whereas temperature and relative humidity were continuously monitored using digital thermohygrometer acquired from local agriculture store in Makassar, Indonesia.

2.2. Rice Mutant Genotype Origin and Plant Materials

The rice mutant genotypes used in this study were derived from previous breeding work reported by Anshori et al. (2018; 2019) [33,34] developed through anther culture to produce double-haploid (DH) rice lines at IPB University, Indonesia. Specifically, the genetic material employed was one selected line among 56 DH rice lines, designated as HS1-28-1-5. These specific lines were selected based on their agronomic and abiotic stress adaptability. As a DH line, this genotype is fully homozygous, providing a uniform and stable genetic background that enables the direct expression of induced mutations without segregation effects. This genetic uniformity makes DH-derived materials particularly suitable for mutation breeding [35].
Seeds from this line were exposed to gamma irradiation at doses of 200, 400, 600, 800, and 1000 Gy to generate M1 mutant populations. Based on prior radiosensitivity evaluations, 200 and 400 Gy doses exhibited favorable agronomic performance, whereas higher doses (600–1000 Gy) resulted in deleterious effects [36]. Therefore, mutant lines from 200 and 400 Gy treatments in M1 mutant populations were advanced and used as M2 populations in the present study, where induced mutations were more stable and phenotypically expressed.
Four rice mutant genotypes, namely, M2 200 (6), M2 200 (15), M2 400 (5), and M2 400 (3), each with 91 seeds, were used. A non-irradiated line, such as M2 0, was also included as a wild-type (positive control), while IR29 was used because of its susceptibility to drought-heat stress (negative control) [37] to verify stress expression, with a total of 28 seeds per control.

2.3. Principle of the Controlled Stress Chamber Screening System

The controlled stress chamber in the present study was developed based on the principle of simultaneous drought-heat stress imposition. Drought stress was induced by withholding irrigation, whereas heat stress was applied through passive solar heat accumulation within a transparent polyethylene enclosure, which elevated air temperature while limiting convective heat loss. Therefore, through the combination of increasing air temperature, progressive soil water depletion, and elevated vapor pressure deficit (VPD), a compound drought-heat environment was created. Similar controlled-environment systems have been widely employed for rice stress screening because they provide uniform and reproducible stress conditions for genotype evaluation while minimizing environmental variation. Accordingly, the controlled-stress chamber used in this study was modified from [38] established screening principles to simulate combined drought-heat stress during seedling stage screening.

2.4. Exploratory Research Procedure

This study used an exploratory research approach to systematically evaluate mutant rice lines for their adaptability to combined drought–heat stress. Such a design is appropriate for the early-stage screening of large mutant populations, as it enables flexible, iterative evaluation under conditions of limited prior information regarding genotype performance. This research procedure facilitates the rapid identification of putative tolerant genotypes while optimizing resource allocation, particularly when dealing with high genetic heterogeneity induced by mutagenesis.
The screening phase was conducted in a sequential two-stage selection process. In Stage 1, seedling-phase screening was performed in seed trays under controlled stress conditions to identify genotypes that exhibited early tolerance. Mutant lines were assessed alongside non-irradiated controls and standard check varieties to establish comparative benchmarks for the phenotypic traits. All surviving genotypes were advanced to stage 2, which involved evaluation during the vegetative to reproductive phases under semi-controlled conditions. This stage focused on assessing growth dynamics and yield-related traits to determine whether seedling-stage tolerance was associated with multi-trait subsequent growth recovery and yield performance.
A separate non-stress treatment was not included because the primary objective of this study was not to partition the individual effect of mutation and stress on yield, nor to identify the highest-yielding genotype under optimum conditions after stress treatment. Instead, selection was primarily based on linking seedling stage tolerance score and the multi-trait index, which enabled comprehensive identification of putative drought-heat-tolerant mutants by simultaneously considering multiple stress-response traits. Therefore, agronomic and yield component traits at stage 2 were evaluated as indicators of post-stress recovery performance in relation to previous drought-heat screening during seedling stage screening.

2.4.1. Seedling Preparation

The experimental procedures involved a sequential workflow comprising growth medium preparation, seedling establishment, stress imposition, recovery evaluation, and subsequent growth assessment under pot conditions. The growth medium was prepared by mixing soil and rice husk at a ratio of 2:1 (v/v). The mixture was thoroughly homogenized and used for both seedling trays and pots. In trays, the medium was maintained under moist conditions to support germination and early growth, whereas in pots, it was brought to a saturated (puddled) state to simulate lowland rice conditions.
Seedling-stage screening was conducted using four seedling trays for each rice mutant genotype. The seedling trays comprised 105 planting cells arranged in a structured manner. The tray was divided into three sections: the left section containing 42 cells allocated for mutant lines, a central section comprising two columns of seven cells each assigned to the non-irradiated control (M2 0) and the susceptible check (IR 29), and the right section containing 49 cells for additional mutant lines. This configuration allowed direct within-tray comparison between the mutant genotypes and controls, as illustrated in Figure S3.
Prior to sowing, the seeds were soaked in water for 24 h to promote uniform germination. The pre-germinated seeds were then sown into prepared trays and grown for 16 days under controlled conditions. The seedlings were arranged in labeled rows to ensure accurate genotype identification. During this establishment phase, routine management practices were applied, including manual weeding, regular watering, and a single application of NPK fertilizer (3 g/L per tray at 10 days after sowing) to ensure uniform growth prior to stress imposition.

2.4.2. Multi-Stress Imposition Inside Controlled Stress Chamber

Multi-stress treatment combining drought and high-temperature stress was imposed at the seedling stage, starting 10 days after sowing (DAS). Seedling trays were transferred into a stress chamber consisting of a fully enclosed transparent plastic structure designed to maximize solar radiation and heat accumulation in the chamber. Drought stress was induced by withholding water, and high-temperature stress was controlled within the chamber. Stress was applied in two phases (15–17 and 21–23 DAS). Microclimatic conditions, including air temperature and relative humidity, and daily maximum and minimum air temperature and relative humidity, were recorded directly and monitored daily using a digital hygrothermometer. These measurements represent the daytime microclimatic conditions recorded between 05:00 A.M. and 18:00 P.M. Subsequently, microclimatic data were used to calculate heat degree days (HDD), saturation vapor pressure, actual vapor pressure, and vapor pressure deficit according to the FAO-56 Penman-Monteith methodology as presented in Table S1 [39].
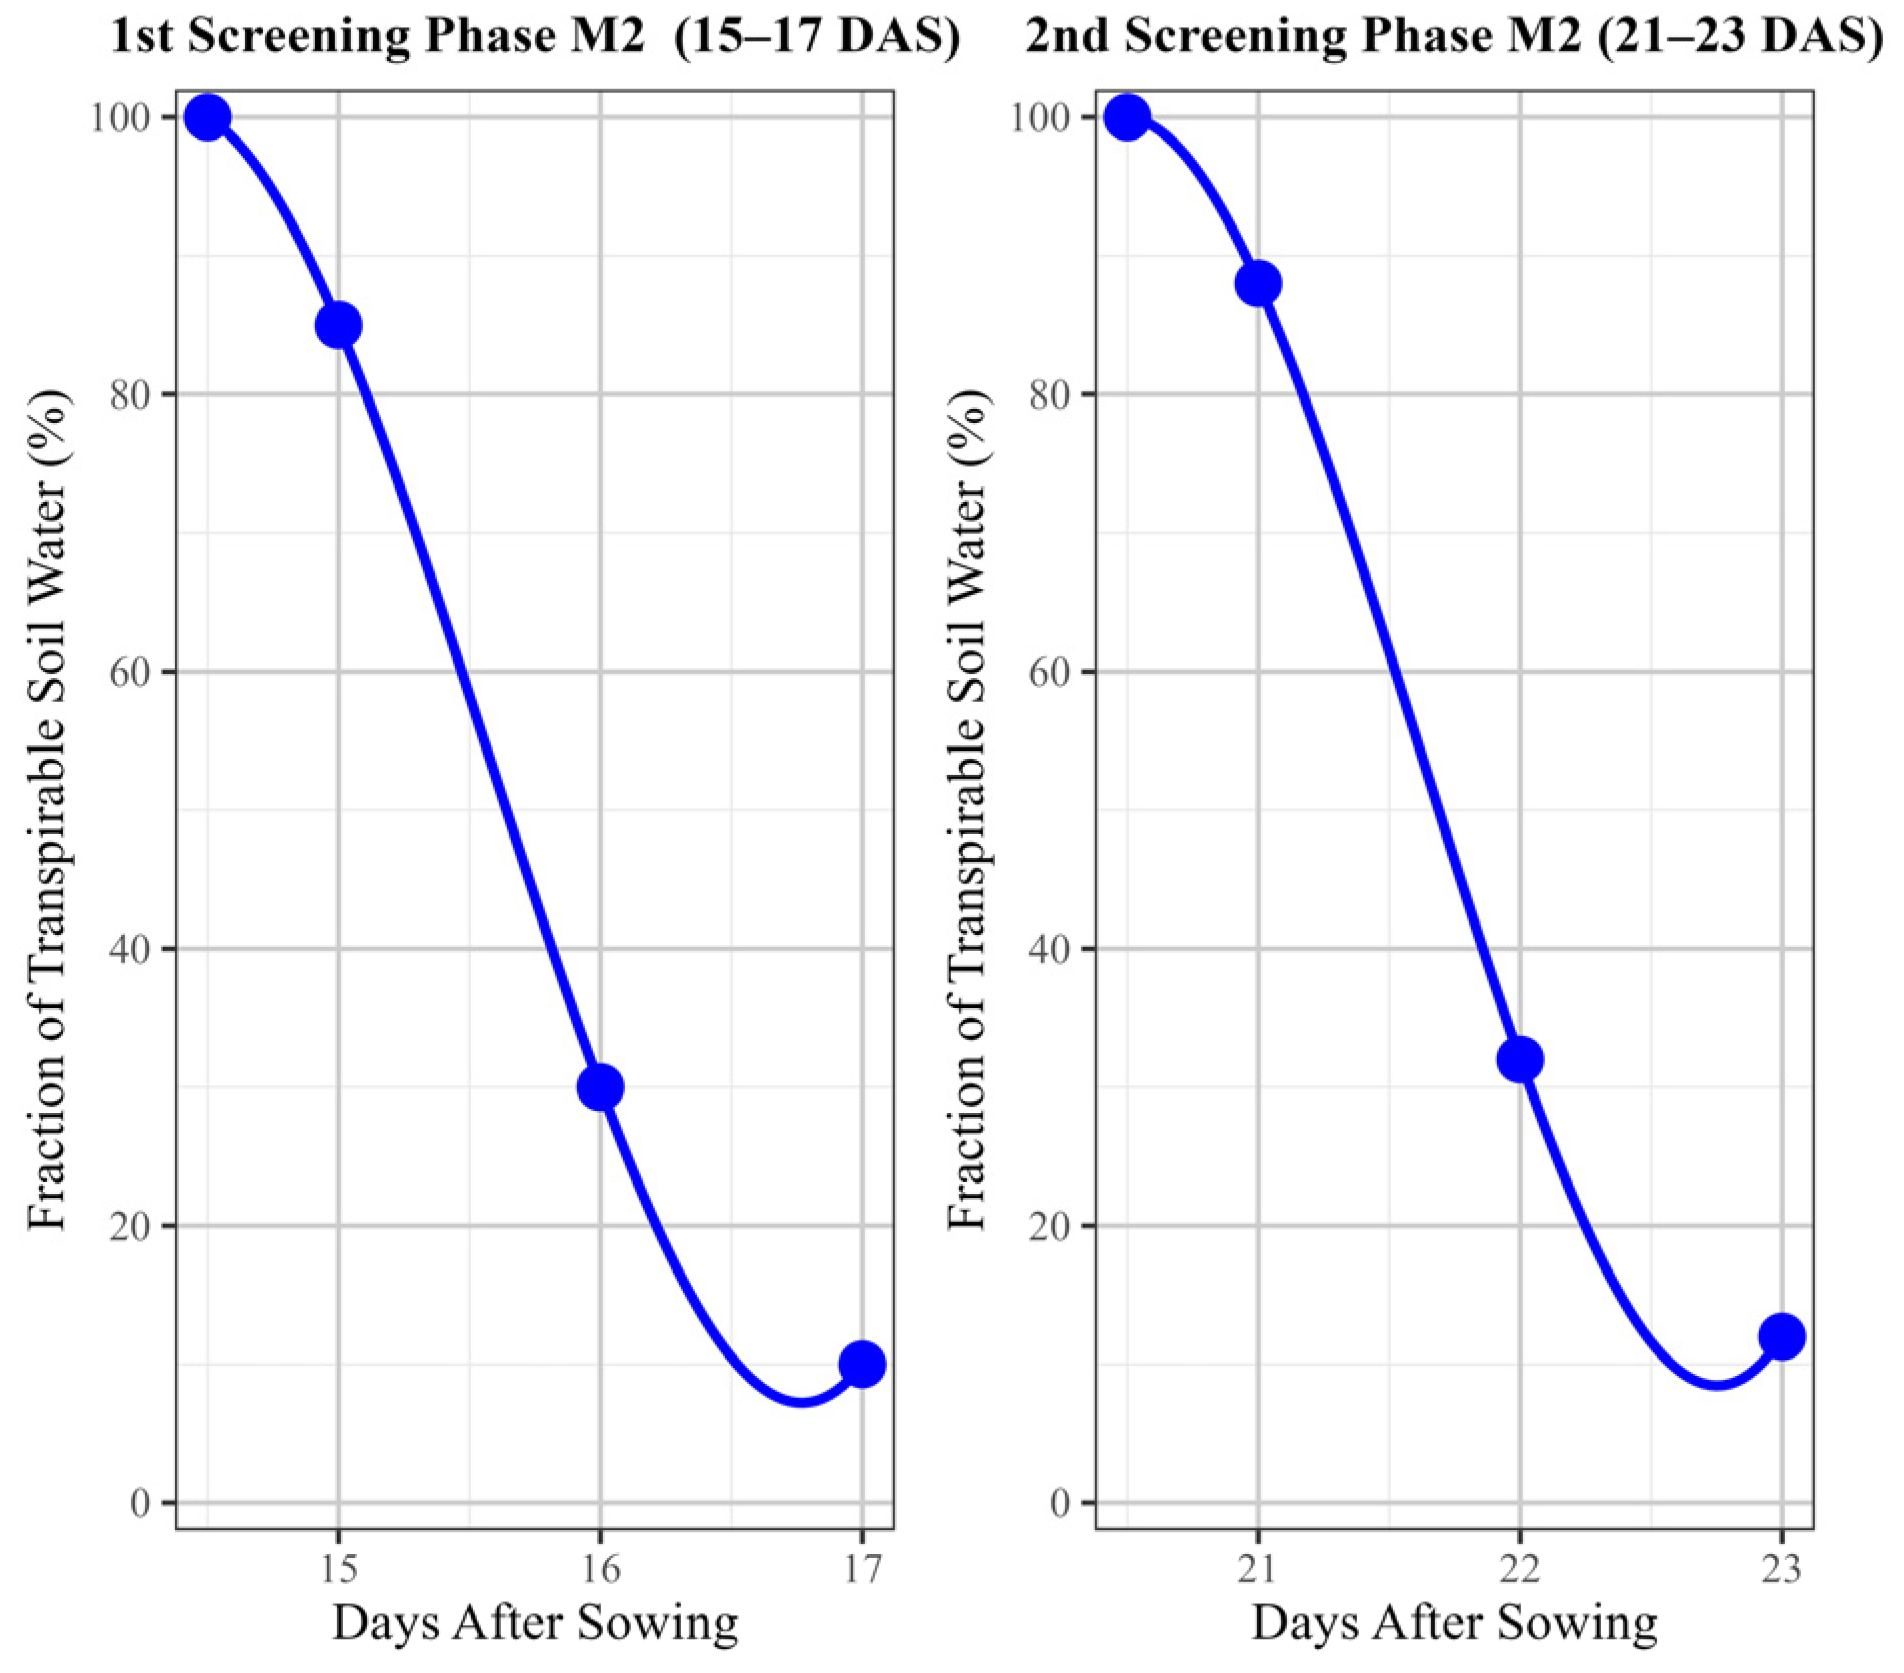
To further ensure that the imposed drought conditions were effectively achieved, plant response to soil water deficit was calculated utilizing the fraction of transpirable soil water (FTSW), which represents the proportion of soil water available for transpiration between field capacity and a lower limit approximately 10% of its maximum, approaching conditions near the permanent wilting point. In this research, field capacity was defined as the soil water content after free gravitational drainage had ceased. FTSW was determined gravimetrically from pot mass during the screening phase using a weighing scale, where W i is the pot weight on the day of measurement, W F c is the pot weight at field capacity, and W F i n a l is the pot weight at the end of the drying cycle:
F T S W i =     ( W i W F i n a l ) ( W F c W F i n a l )
At the onset of each screening phase, the soil moisture was adjusted to field capacity (FC) to ensure a uniform initial water status across the screening phases. Following stress exposure, the seedlings were removed from the chamber after screening in phase 1 and intensively rewatered to initiate a 3-day recovery (readjustment) period. After screening in phase 2, the plants were rewatered and maintained under optimal conditions, allowing normal growth to resume until 38 DAS.
Selected seedlings were transplanted into pots under controlled, puddled soil conditions at 38 DAS to simulate lowland conditions. All pots were standardized to have equal soil mass and composition to ensure uniform growth conditions, with water maintained through regular irrigation. Plants were grown to maturity under standard agronomic practices, and harvesting was conducted when approximately two-thirds of the panicles had reached physiological maturity. The experimental timeline for the imposition of multi-stress is shown in Figure 1.

2.5. Data Acquisition and Multi-Trait Index Analysis Pipeline

The collected data included plant height (PH), number of total tillers (NTT), number of productive tillers (NPT), day of flowering (DoF), day of maturity (DoM), flag leaf length (FLL), flag leaf width (FLW), number of total panicles (NP), panicle length (PL), weight per panicle (WPP), weight of 1000 grains (W1000G), number of total grains (NTG), number of filled grains (NFG), number of empty grains (NEG), percentage of filled grains (PFG), percentage of empty grains (PEG), and weight per clump (WPC). Tolerance scoring based on the Standard Evaluation System (SES) of the International Rice Research Institute (IRRI) [40] was also performed, including leaf rolling scoring (LRS), leaf drying scoring (LDS), heat tolerance (HTol) [38], and spikelet fertility (SF).
Prior to the analyses, all measured variables were subjected to appropriate scaling procedures to ensure comparability and prevent bias arising from differences in measurement units and value ranges [41]. Agronomic traits were standardized using Z-score normalization, a process that transforms each observation based on its deviation from the mean relative to the standard deviation, resulting in variables with a mean of zero and a variance of one. In contrast, tolerance-related variables derived from the Standard Evaluation System (SES) were normalized using min–max normalization, which adjusts values to fit within a specified range, typically between 0 and 1 [42].
Spearman’s rank correlation analysis quantified the strength and direction of monotonic relationships among agronomic traits [43], particularly to identify traits significantly associated with WPC under stress conditions. Traits significantly correlated with WPC were then subjected to path coefficient analysis following Wright’s method, enabling decomposition of correlation coefficients into direct and indirect effects [44,45]. This distinguished traits with true causal influence on yield from those contributing indirectly. Traits with substantial direct effects on WPC were incorporated into PCA in Rstudio IDE version 2026.04.0 Build 526 using R version 4.6.0. PCA were utilized to address multicollinearity and reduce dimensionality. Principal components were retained using the Kaiser criterion (eigenvalues > 1) [46,47], facilitating identification of key trait combinations underlying genotypic variation and performance.
Subsequently, the Weighted Absolute Score (WASB) was calculated using the principal component scores, where each genotype (i) was evaluated based on its position in the reduced multivariate space [48]. This approach integrates the contributions of multiple traits into a single composite index, enabling more robust genotype ranking. Overall, the integration of correlation analysis, path analysis, PCA, and WASB establishes a systematic and hierarchical selection framework that allows the identification of superior genotypes based on both individual trait effects and their complex interrelationships. WASB calculation is as follows:
W A S B P C 1 =   P C 1 i   ×     V a r P C 1 V a r P C 1 + V a r P C 2
W A S B P C 2 =   P C 2 i ×   V a r P C 2 V a r P C 1 + V a r P C 2
WASB value was further combined with tolerance scoring (TScore), which was averaged from four tolerance scores and normalized using min-max normalization. TScore value was obtained from four tolerance parameters. The thresholds were 0.00–0.40 (Tolerant), 0.40–0.70 (Moderate), and 0.70–1.00 (Susceptible). The stricter threshold for the tolerant class was applied to increase selection intensity by assigning only genotypes exhibiting consistently favorable performance across all SES scoring.

3. Results

3.1. Rice Mutant Seedling Survival and Tolerance Scores Under Combined Drought-Heat Stress

The temporal dynamics of the fraction of transpirable soil water (FTSW) confirmed the efficiency of the stress chamber in simulating drought-heat stress in screening rice mutant seedlings (Figure 2). During screening phase 1, FTSW declined from 100% to 8% by 17 DAS, whereas in screening phase 2, it decreased from 100% to 12% by 23 DAS. Collectively, these environmental conditions indicate that the artificial screening concept utilizing stress chamber infrastructure has the potential for generating sufficiently severe and reproducible methods for screening rice under combined drought-heat stress.
The effectiveness of the screening protocol was reflected in the survival responses of the evaluated rice populations (Table 1). 420 seedlings were screened, of which only 53 survived the combined drought-heat stress, corresponding to an overall survival rate of 12.62%, whereas 87.38% of the seedlings failed to recover following stress exposure. The susceptible check variety, IR29, exhibited complete mortality (100%), confirming the severity of the imposed stress. Among the evaluated populations, the wild type (M2 0) recorded the highest survival rate (21.43%), followed by two mutant populations derived from 200 Gy irradiation, M2 200 (15) and M2 200 (6), with survival rates of 19.78% and 18.68%, respectively. In contrast, both 400 Gy mutant populations, M2 400 (3) and M2 400 (5), exhibited substantially lower survival (6.59%), indicating reduced capacity to withstand the combined drought-heat stress treatment.
To further characterize surviving seedlings’ response, tolerance potential was evaluated using the SES, including LDS, LRS, Htol, and SF. The tolerance score results, showing a distribution pattern across parameters. Notably, M2 200 exhibited more individuals at low-medium scores than M2 0 and M2 400 (Table 2). For leaf drying, the distribution shifted from M2 0, which had few individuals across scores, to M2 200, concentrated at medium scores (3–7) with a peak at score 5, then declined in M2 400, with lower frequency centered at score 3. A similar pattern appeared in leaf rolling, with M2 200 dominant at low to medium scores (1–5), whereas M2 0 and M2 400 showed narrower distributions with fewer individuals. For heat tolerance, individuals increased from M2 0 to M2 200, peaking at score 2, then decreased at M2 400, forming an optimum-like response where M2 200 had the most individuals in the main score category. Spikelet fertility showed a similar trend, where M2 200 was concentrated at scores 1 and 3 with the highest frequency, while M2 0 and M2 400 had lower, more dispersed distributions, including higher scores in M2 400.

3.2. Phenotype Variation and Trait Relationships of Gy-Irradiation Induced Mutant in Rice Under Drought-Heat Stresses

The distribution of agronomic traits differed between wild-type and mutant populations (200 and 400 Gy). Mutant lines showed broader distributions for most traits, indicating increased phenotypic variability induced by gamma irradiation (Table S2). PH was higher in the 200 Gy treatment, whereas the 400 Gy treatment showed greater dispersion, suggesting variability rather than improvement. Similarly, tillering and yield traits, including NTT, NPT, PL, NTG, and WPP, showed increased spread in mutant populations versus the wild type. At times, 200 Gy showed higher values, whereas 400 Gy showed more extreme values (Figure S4). These patterns indicate gamma irradiation generates variability, with moderate doses enhancing trait performance and higher doses increasing heterogeneity.
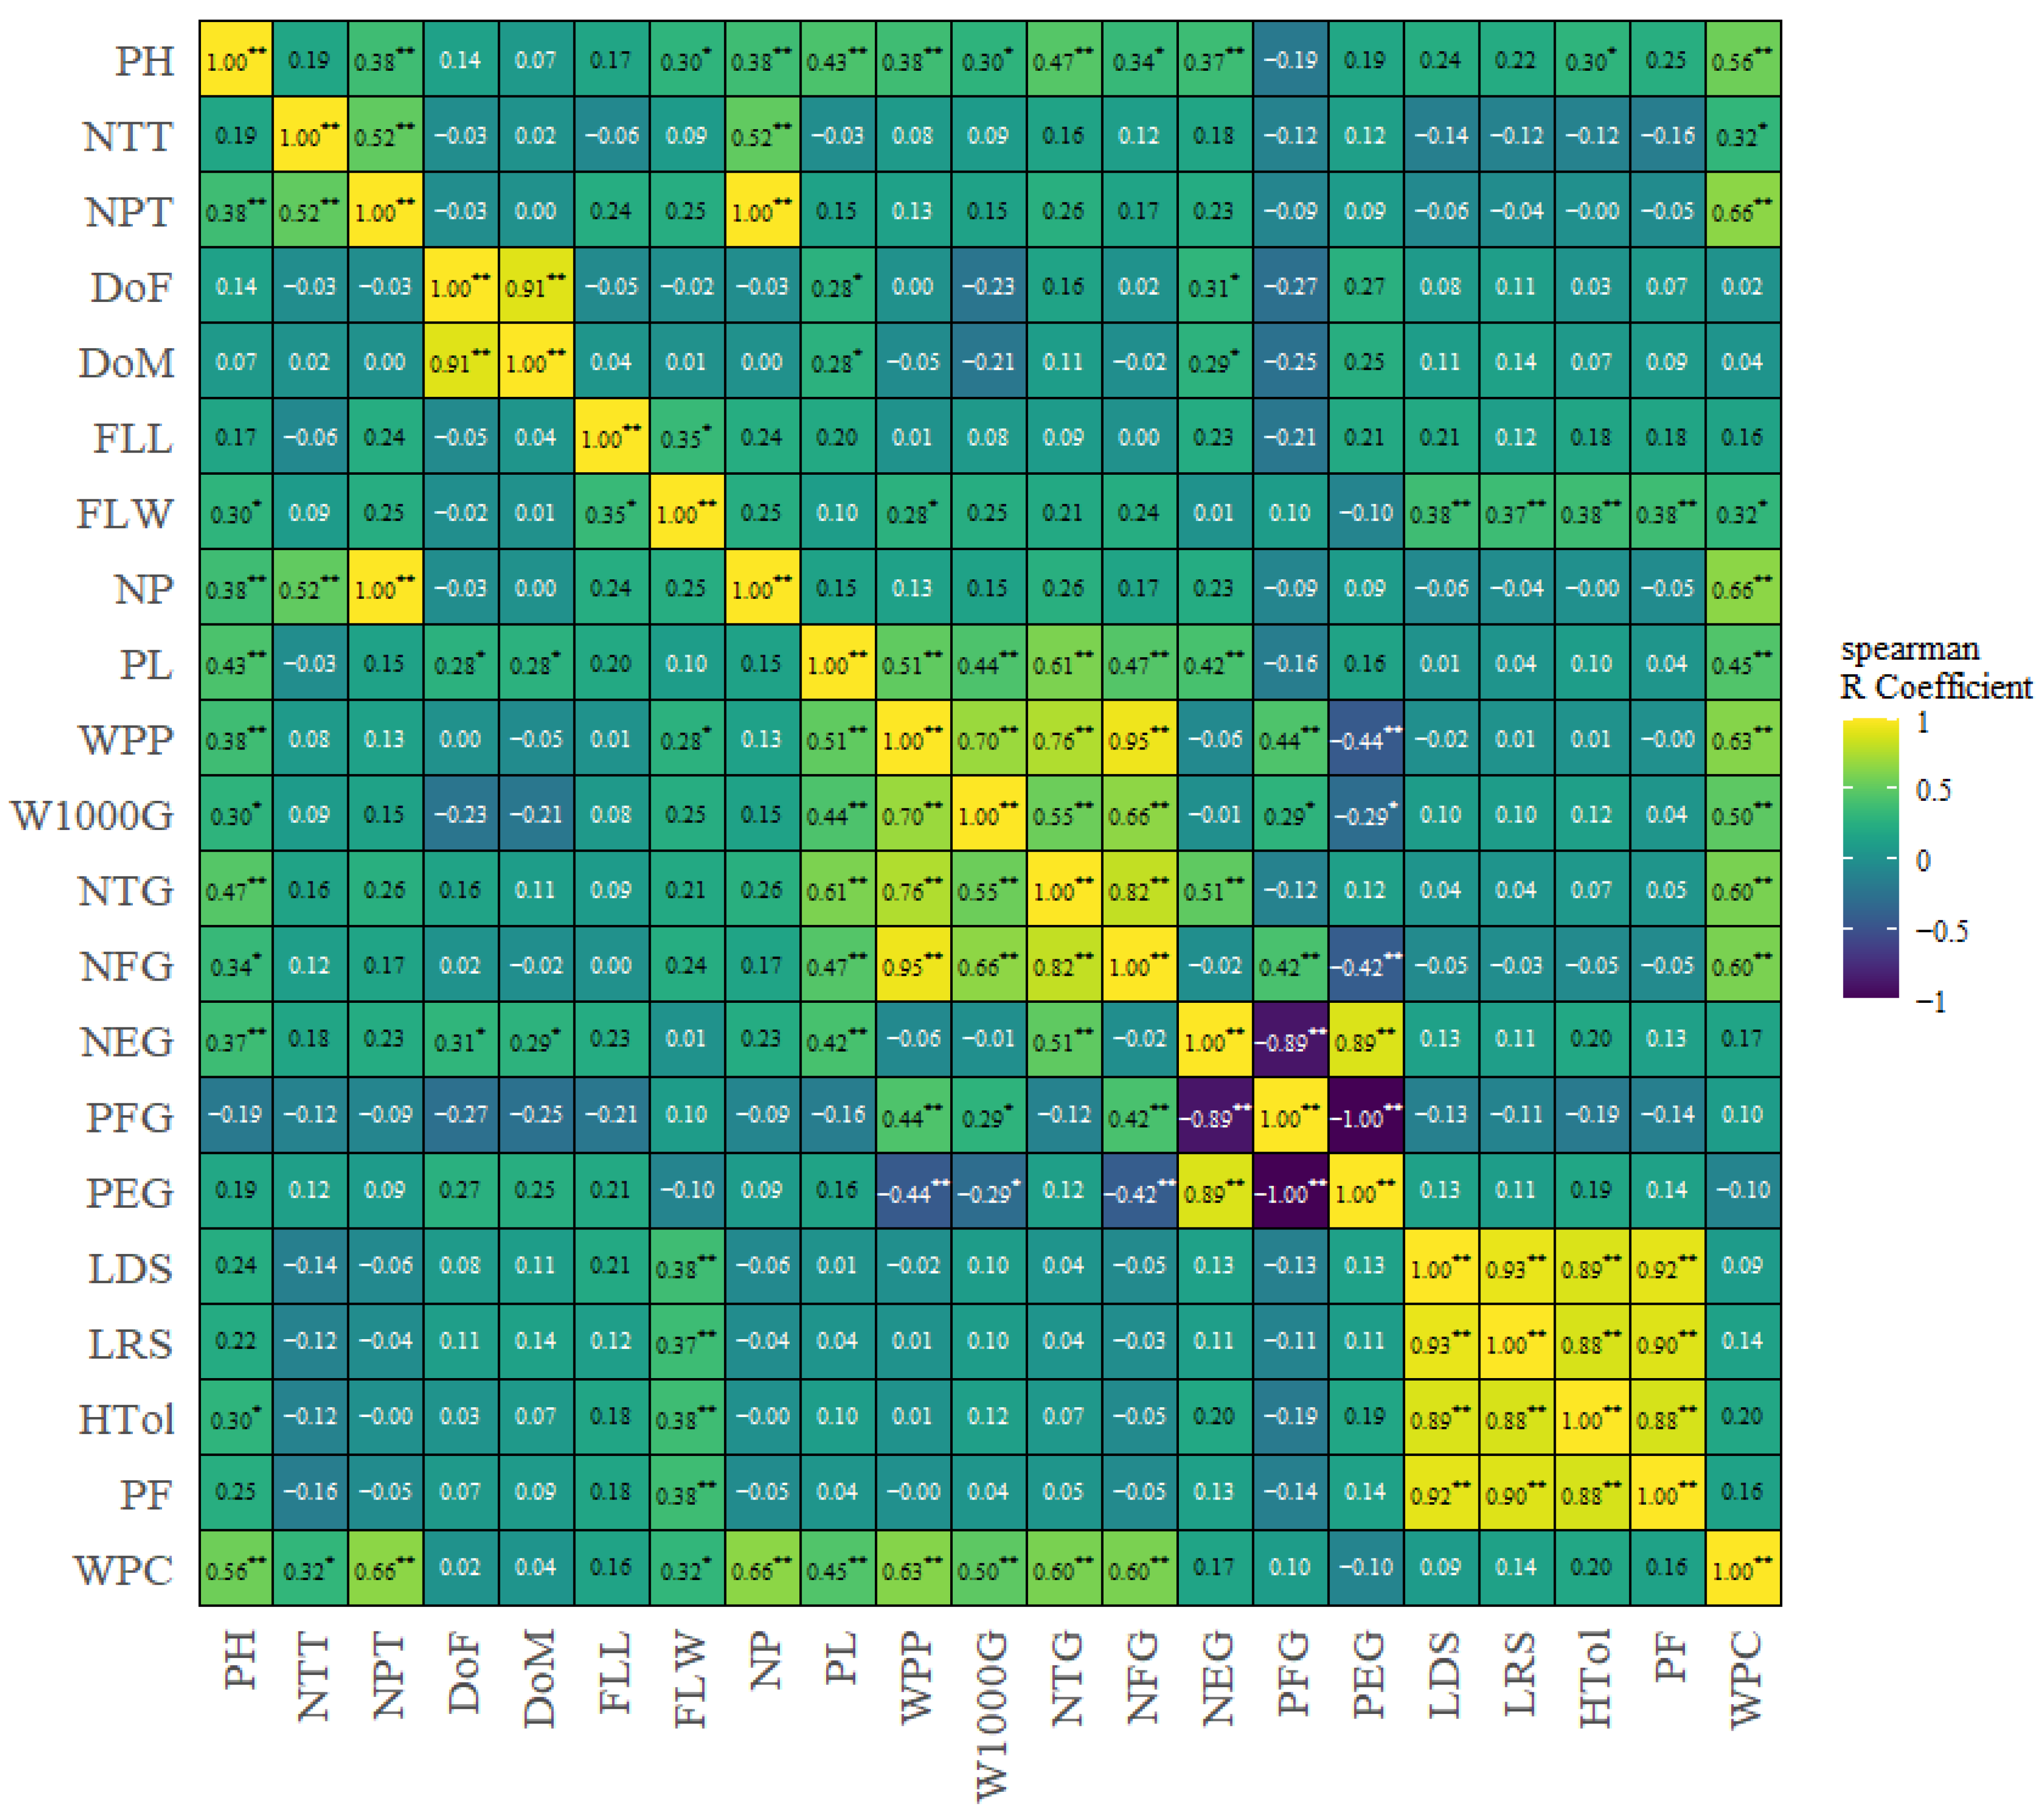
Figure 3 illustrates the Spearman correlation analysis, showing relationships among traits in rice mutants under drought–heat stress, with WPC as the key variable. WPC was positively correlated with vegetative traits PH (0.56), NTT (0.32), and FLW (0.32), and more strongly with yield components WPP (0.63), W1000G (0.50), NTG (0.60), and NFG (0.60). WPC was also positively correlated with PL (0.45), while correlations with physiological parameters LDS, LRS, and HToI were low to moderate. Yield components generally showed strong positive correlations: NFG with WPP (0.95) and NTG (0.82), NTG with WPP (0.78) and W1000G (0.55), and W1000G with WPP (0.70). Among vegetative traits, PH correlated with NTG (0.47), WPP (0.38), and NFG (0.34), whereas NPT correlated with PH (0.38) and strongly with NP (1.00). Conversely, PEG showed negative correlations with PFG (−1.00), WPP (−0.44), and NTG (−0.29); PFG was also negatively correlated with other yield variables. LDS, LRS, HTol, and SF were strongly positively correlated (>0.88).

3.3. Identification of Yield-Contributing Traits Through Path Coefficient Analysis and PCA in M2 Rice Mutant Population

The results (Table 3) indicate that panicle length (PL) exerted the highest positive direct effect (0.47) on WPC, highlighting its primary contribution to yield formation. Plant height (PH) and the number of total tillers (NTT) also showed positive direct effects of moderate magnitude (0.27 and 0.22, respectively), with PH further contributing indirectly through weight per panicle (WPP) (0.18), resulting in a relatively strong total association (0.56). Flag leaf width (FLW) exhibited a comparatively low direct effect (0.08), and its total contribution (0.32) was primarily supported by indirect effects, particularly via WPP (0.13).
In contrast, several traits displayed relatively small direct effects but substantial total effects because of strong indirect contributions. Weight per panicle (WPP) had a low direct effect (0.07); however, its overall association (0.45) was enhanced by indirect pathways through other yield components, including the total number of grains (NTG) and filled grains (NFG). Similarly, 1000-grain weight (W1000G) showed a low direct effect (0.06), but a notable indirect contribution via WPP (0.33) resulted in a higher total effect (0.50). NTG also followed this pattern, with a low direct effect (0.09) but a substantial total association (0.60), largely mediated through WPP (0.36).
Notably, NFG exhibited a negative direct effect (−0.14) on WPC; however, this was offset by relatively strong positive indirect effects, particularly via WPP (0.45), leading to a positive overall association (0.60). These findings indicate that while certain traits, such as PL and PH, contribute directly to WPC, others, including W1000G, NTG, and NFG, primarily influence WPC indirectly through their interactions with key intermediary traits, especially WPP.
As shown in Table 4, the principal component analysis (PCA) results reveal that five principal components account for the majority of the variation in mutant rice characteristics under drought–heat stress conditions. The first principal component (PC1) has an eigenvalue of 4.56 and contributes the most to the variation (50.68%), followed by PC2 (1.14; 12.70%), PC3 (0.93; 10.38%), PC4 (0.86; 9.58%), and PC5 (0.52; 5.80%), culminating in a total cumulative variation explained of 89.13%. Within PC1, most characteristics exhibit high positive loadings, notably WPP (0.92), NFG (0.88), NTG (0.86), WPC (0.83), and W1000G (0.74), followed by PH (0.67) and PL (0.55), whereas FLW (0.41) and NTT (0.23) contribute less significantly. In PC2, NTT provides the largest contribution (0.75), followed by FLW (0.40), PH (0.36), and WPC (0.25), while other characteristics display negative loadings, such as PL (−0.29), NFG (−0.24), and WPP (−0.19). In PC3, FLW has the highest loading (0.66), followed by PH (0.31) and PL (0.18), whereas NTT exhibits a substantial negative loading (−0.55). In PC4, PL contributes the most (0.65), followed by PH (0.33), while other characteristics generally have low to negative loadings. In PC5, all variables demonstrate relatively minor contributions, with the highest values for PL (0.37) and W1000G (0.29), while PH (−0.31) and WPC (−0.23) indicate a negative direction. Overall, PC1 predominates in data variation with a contribution exceeding 50%, with most characteristics, particularly yield components and WPC, exhibiting high positive loadings, whereas the subsequent components offer additional contributions with more varied directions and magnitudes of loadings.

3.4. Multi-Trait Index Selection of Putative Multi-Tolerant M2 Rice Mutant Genotypes to Drought-Heat Stress

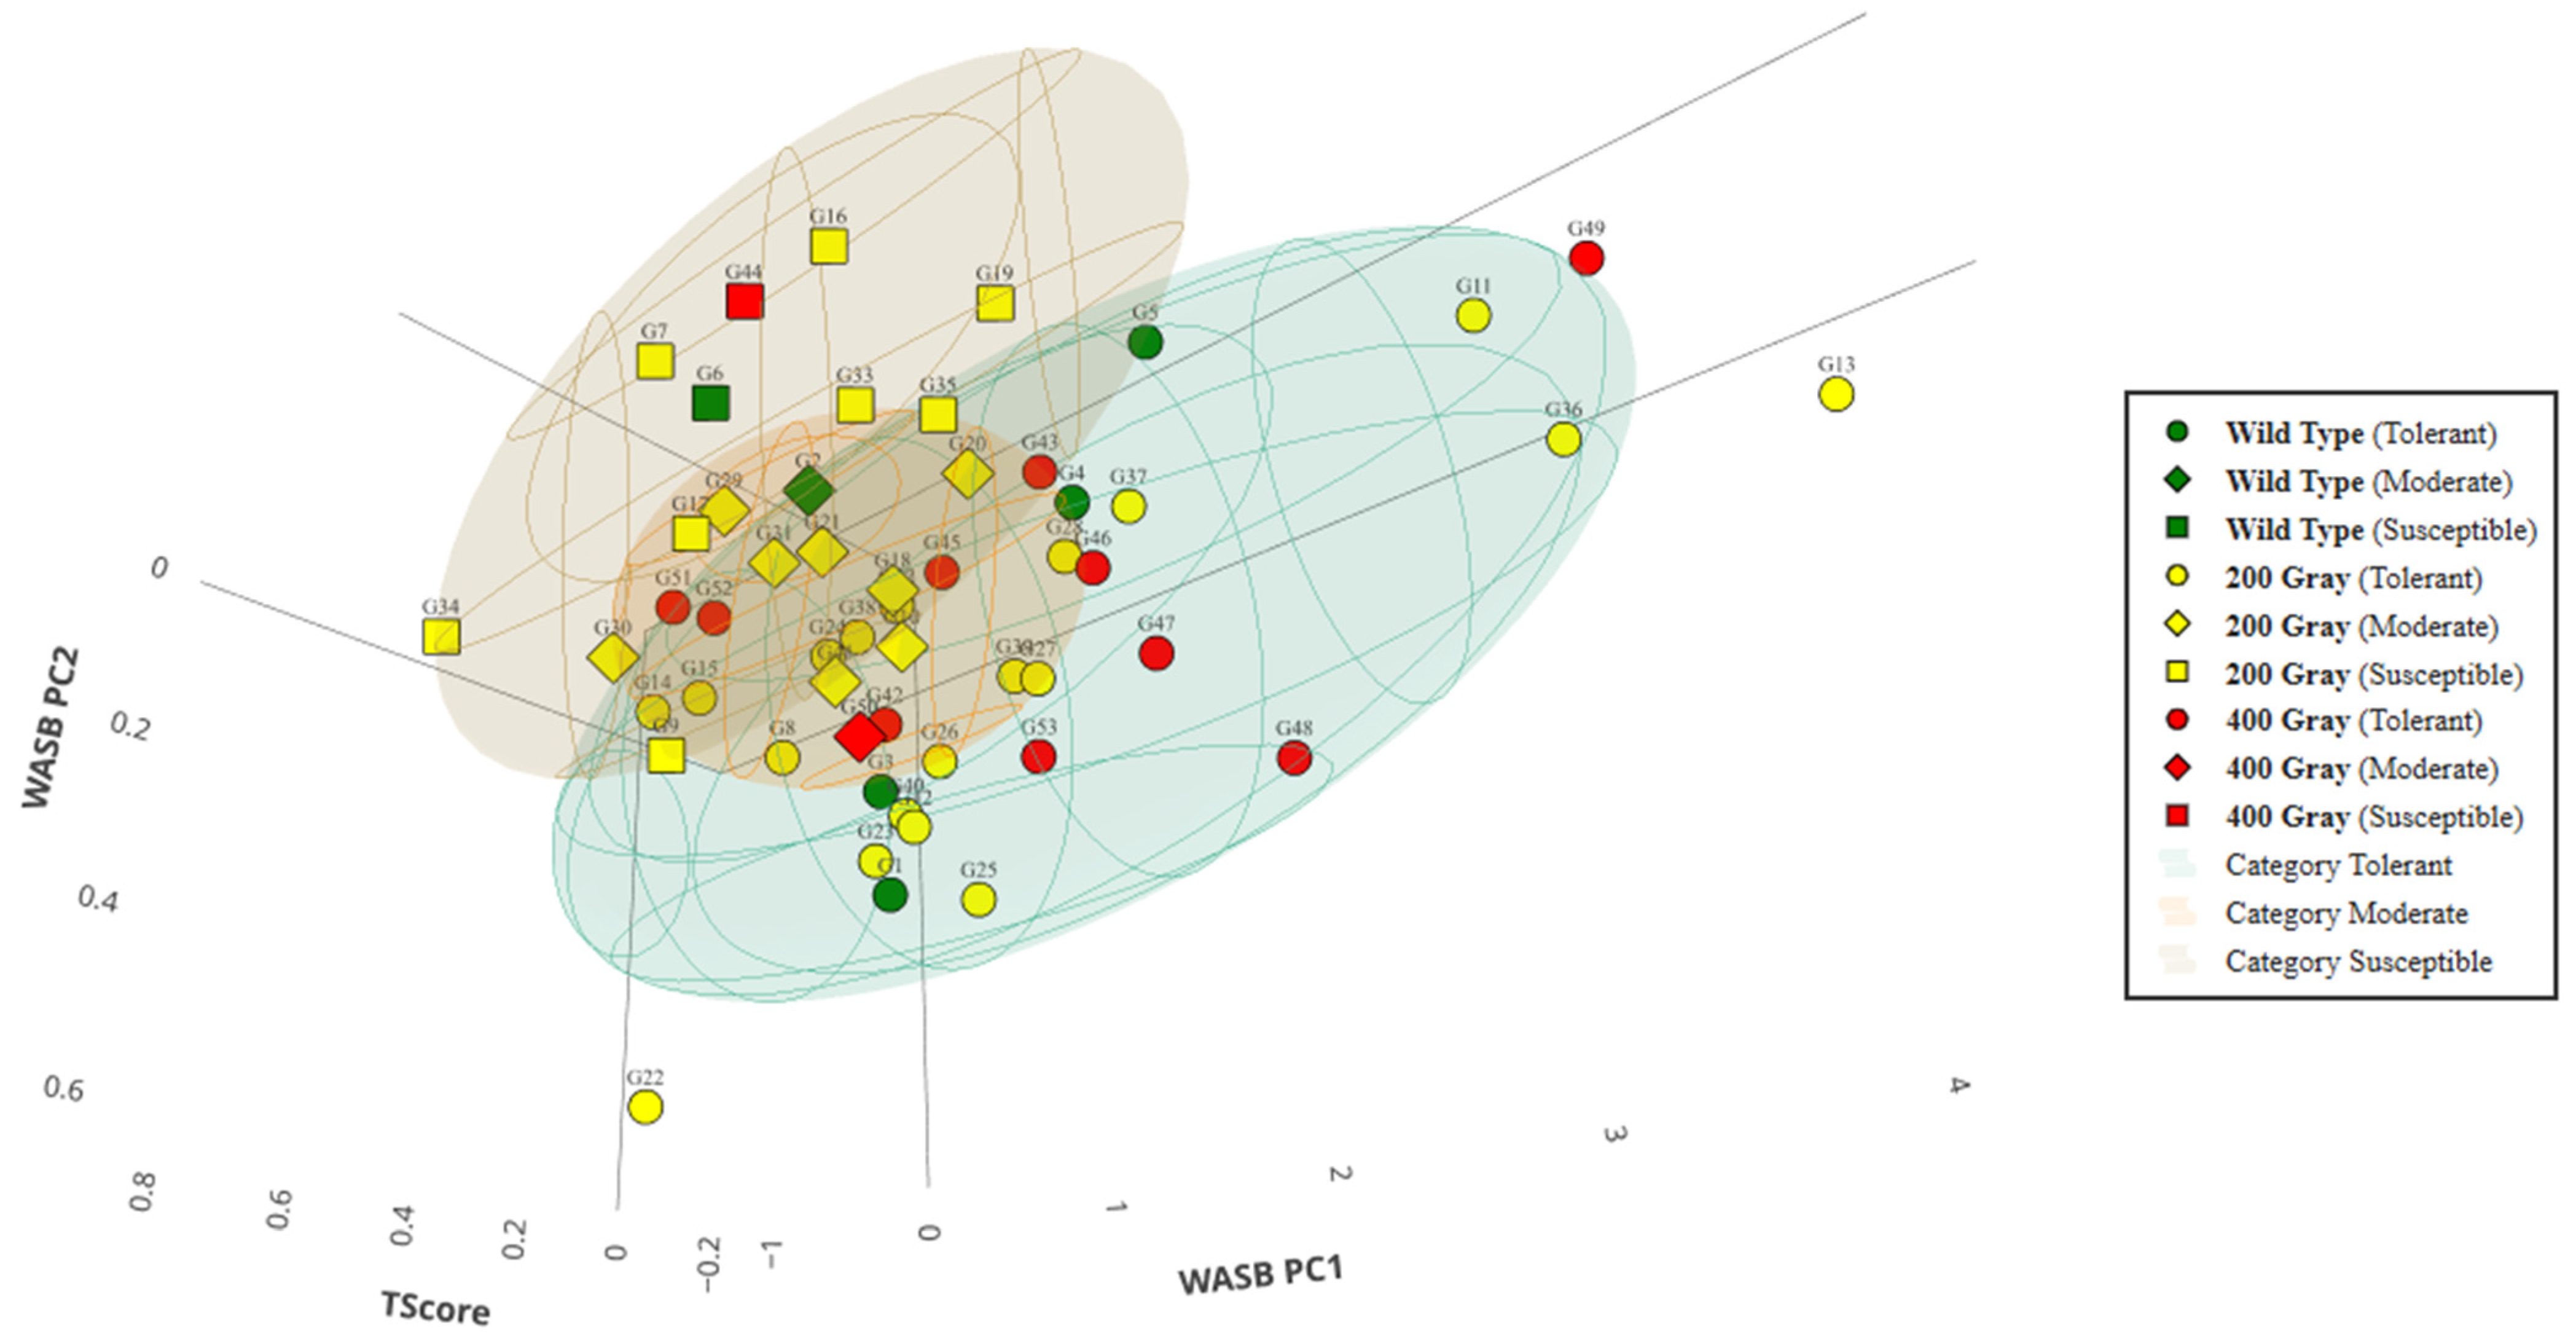
Multi-trait index analysis was further explored by visualizing the distribution of mutant genotypes across TScore, WASB-PC1, and WASB-PC2 dimensions. As shown in Figure S5 and Figure 4, and Table 5, mutant rice genotypes exhibited substantial variation in TScore and WASB components, resulting in distinct distribution patterns among tolerance categories under combined drought-heat stress. In this research, lower TScore values indicate greater drought-heat tolerance. Therefore, a clear separation of genotypes according to tolerance classification was observed in both Figure 4, where putative tolerant mutant genotypes (G1, G3, G4, G23, G25, G26, G28, G39, G47, G49, and G53) were predominantly located on the left side of the plots and susceptible genotypes were concentrated on the right side (G6, G7, G9, G16, G17, G19, G33, G34, G35 and G44), while moderately tolerant genotypes occupied intermediate positions (G2, G10, G13, G18, G20, G21, G22, G29, G30, G41, and G50), forming a transitional region between tolerant and susceptible groups.
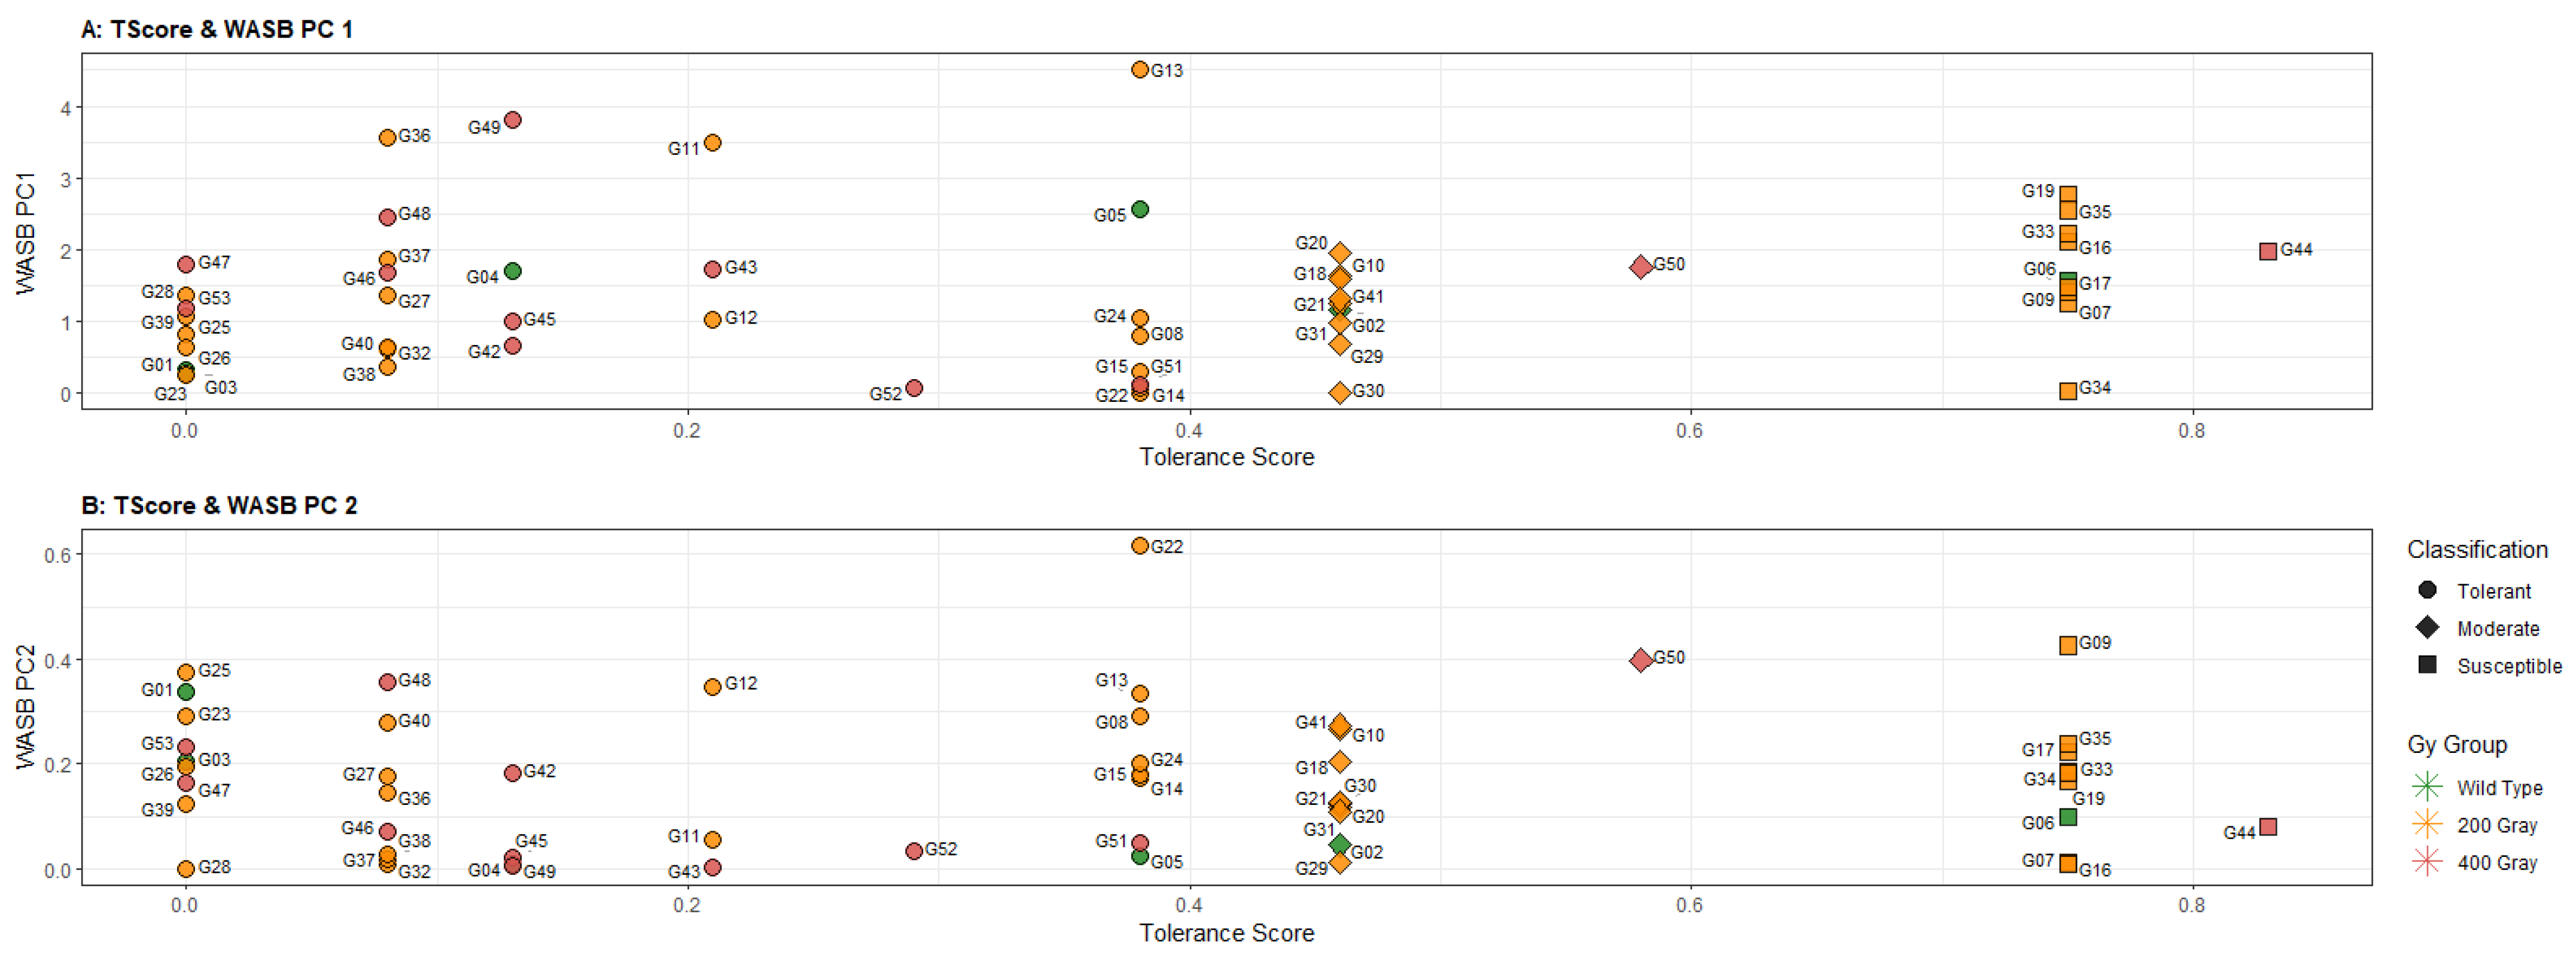
In TScore-WASB-PC 1 (Figure 5A), genotype separation occurred along the TScore axis, while WASB-PC 1 differentiated genotypes within tolerance categories. Putative tolerant genotypes showed a broad distribution across the WASB-PC 1 axis, indicating heterogeneous multi-trait responses despite comparable tolerance classification. In contrast, susceptible genotypes were more compactly distributed with moderate WASB-PC 1 values. A few genotypes deviated from the main distribution, particularly G13 (WASB-PC 1 = 4.50), G49 (3.80), and G36 (3.56), with high WASB-PC 1 values. A similar pattern was observed in TScore-WASB-PC 2 (Figure 5B), where most genotypes clustered within a narrow WASB-PC 2 range, but G22 (WASB-PC 2 + 0.62), G9 (0.43), and G50 (0.40) were separated. Distinct patterns were also observed among the Gy irradiation dose groups, particularly at 200 Gy, which generated substantial phenotypic diversity in multi-trait responses, as visualized in the TScore-WASB-PC value. A similar trend with less variability was observed in the 400 Gy and 0 Gy (wild type) groups. These distribution patterns indicate that gamma irradiation induced diverse multi-trait responses rather than a uniform response. Collectively, these findings highlight the utility of the multi-trait index approach as one of the approaches for identifying putative drought-heat-tolerant rice mutant genotypes.

4. Discussion

4.1. M2 Rice Mutant Seedling-Screening Response Under Combined Drought-Heat Stress and Their Implications for Spikelet Fertility

Controlled stress chambers were used to generate a reproducible and uniform stress environment for screening rice mutant seedlings under drought-heat stress. Despite the relatively short multi-stress screening cycle, the imposed conditions were sufficient to induce physiologically relevant combined drought-heat stress. As shown in Table S1, the microclimatic conditions inside the stress chamber were characterized by elevated vapor pressure deficit (VPD) and reduced relative humidity. These conditions increased the vapor pressure gradient between the leaf and the surrounding air. Combined with water withholding, this resulted in a rapid decline in plant water status [49,50], effectively simulating acute drought-heat stress within a limited screening period in the seedling stage in rice.
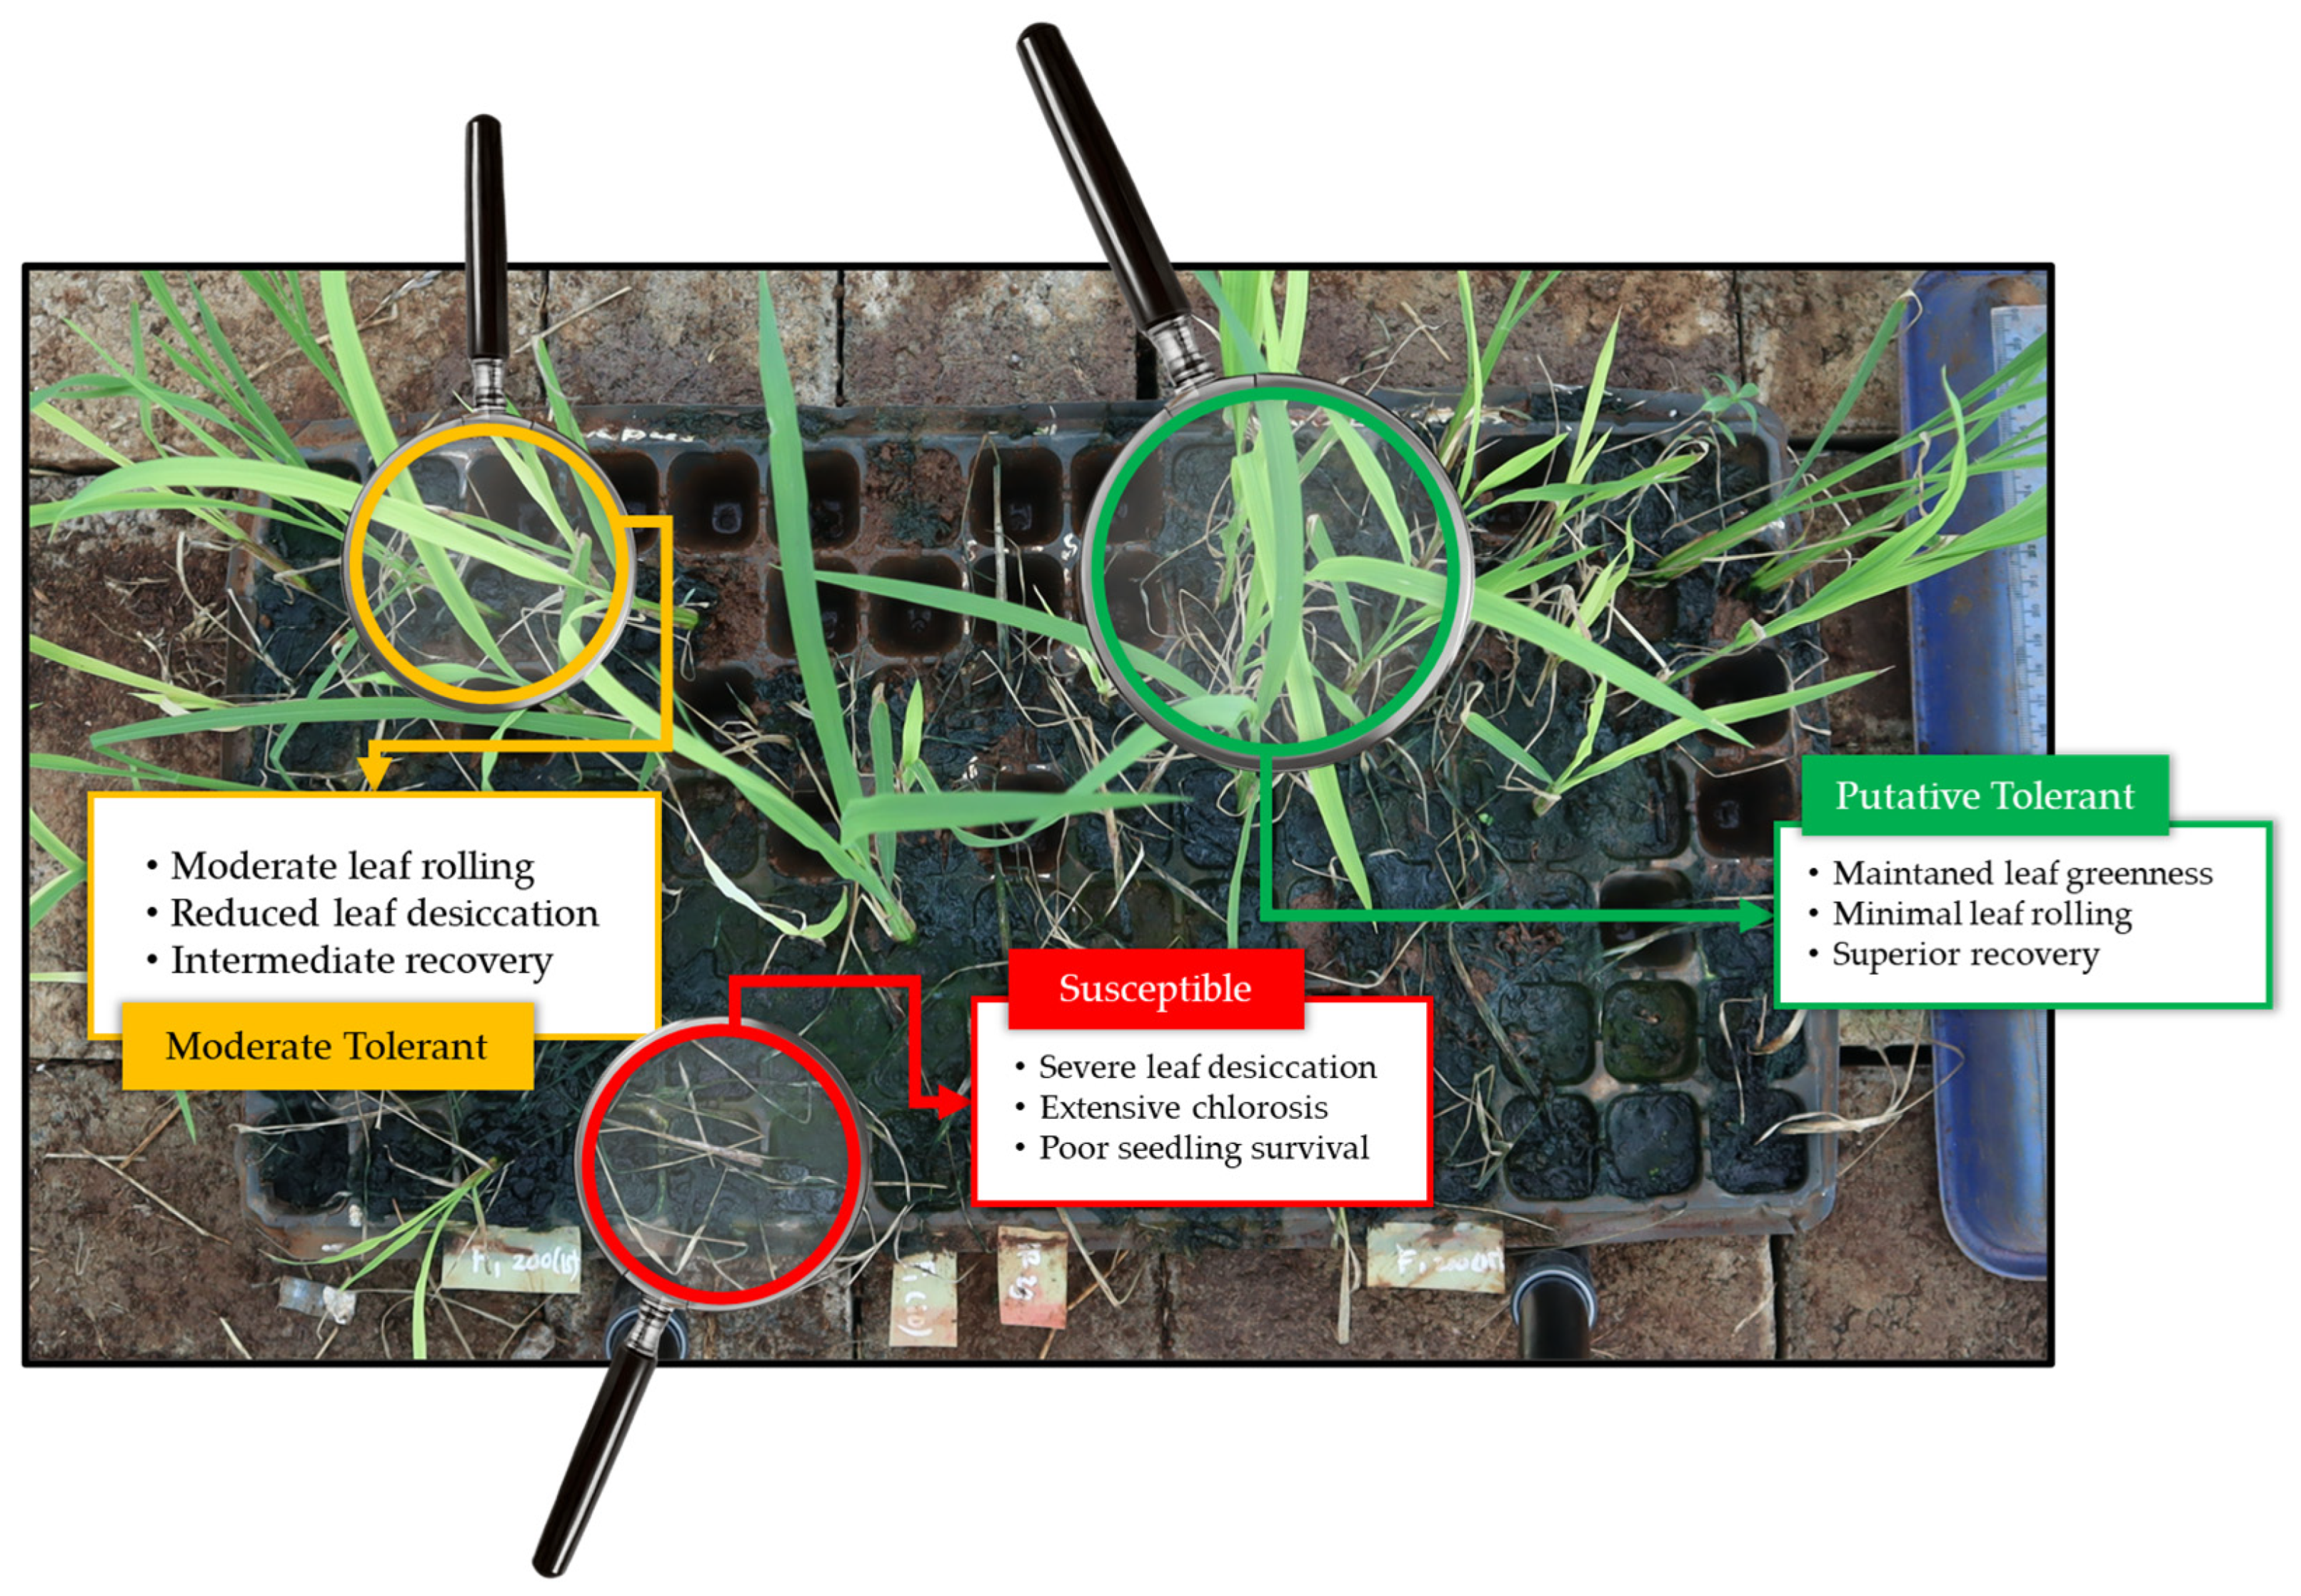
Seedlings represent one of the most vulnerable developmental stages in rice, during which exposure to combined drought and heat stress can substantially impair subsequent plant growth. In the present study, Figure 6 reveals distinct responses among mutant genotypes. These contrasting responses suggest differences in the capacity of each genotype to withstand stress during early vegetative growth. Although the underlying physiological mechanisms were not directly investigated in this study, previous studies have suggested that maintenance of leaf greenness and reduced leaf rolling are commonly associated with improved leaf water status, delayed chlorophyll degradation, sustained photosynthetic activity, and enhanced osmotic adjustment under drought and heat stress [51,52,53]. Therefore, it is hypothesized that the superior performance of the putatively tolerant mutant may be attributed to more efficient regulation of these protective processes. To validate this hypothesis, further physiological and molecular analyses are required in future studies.
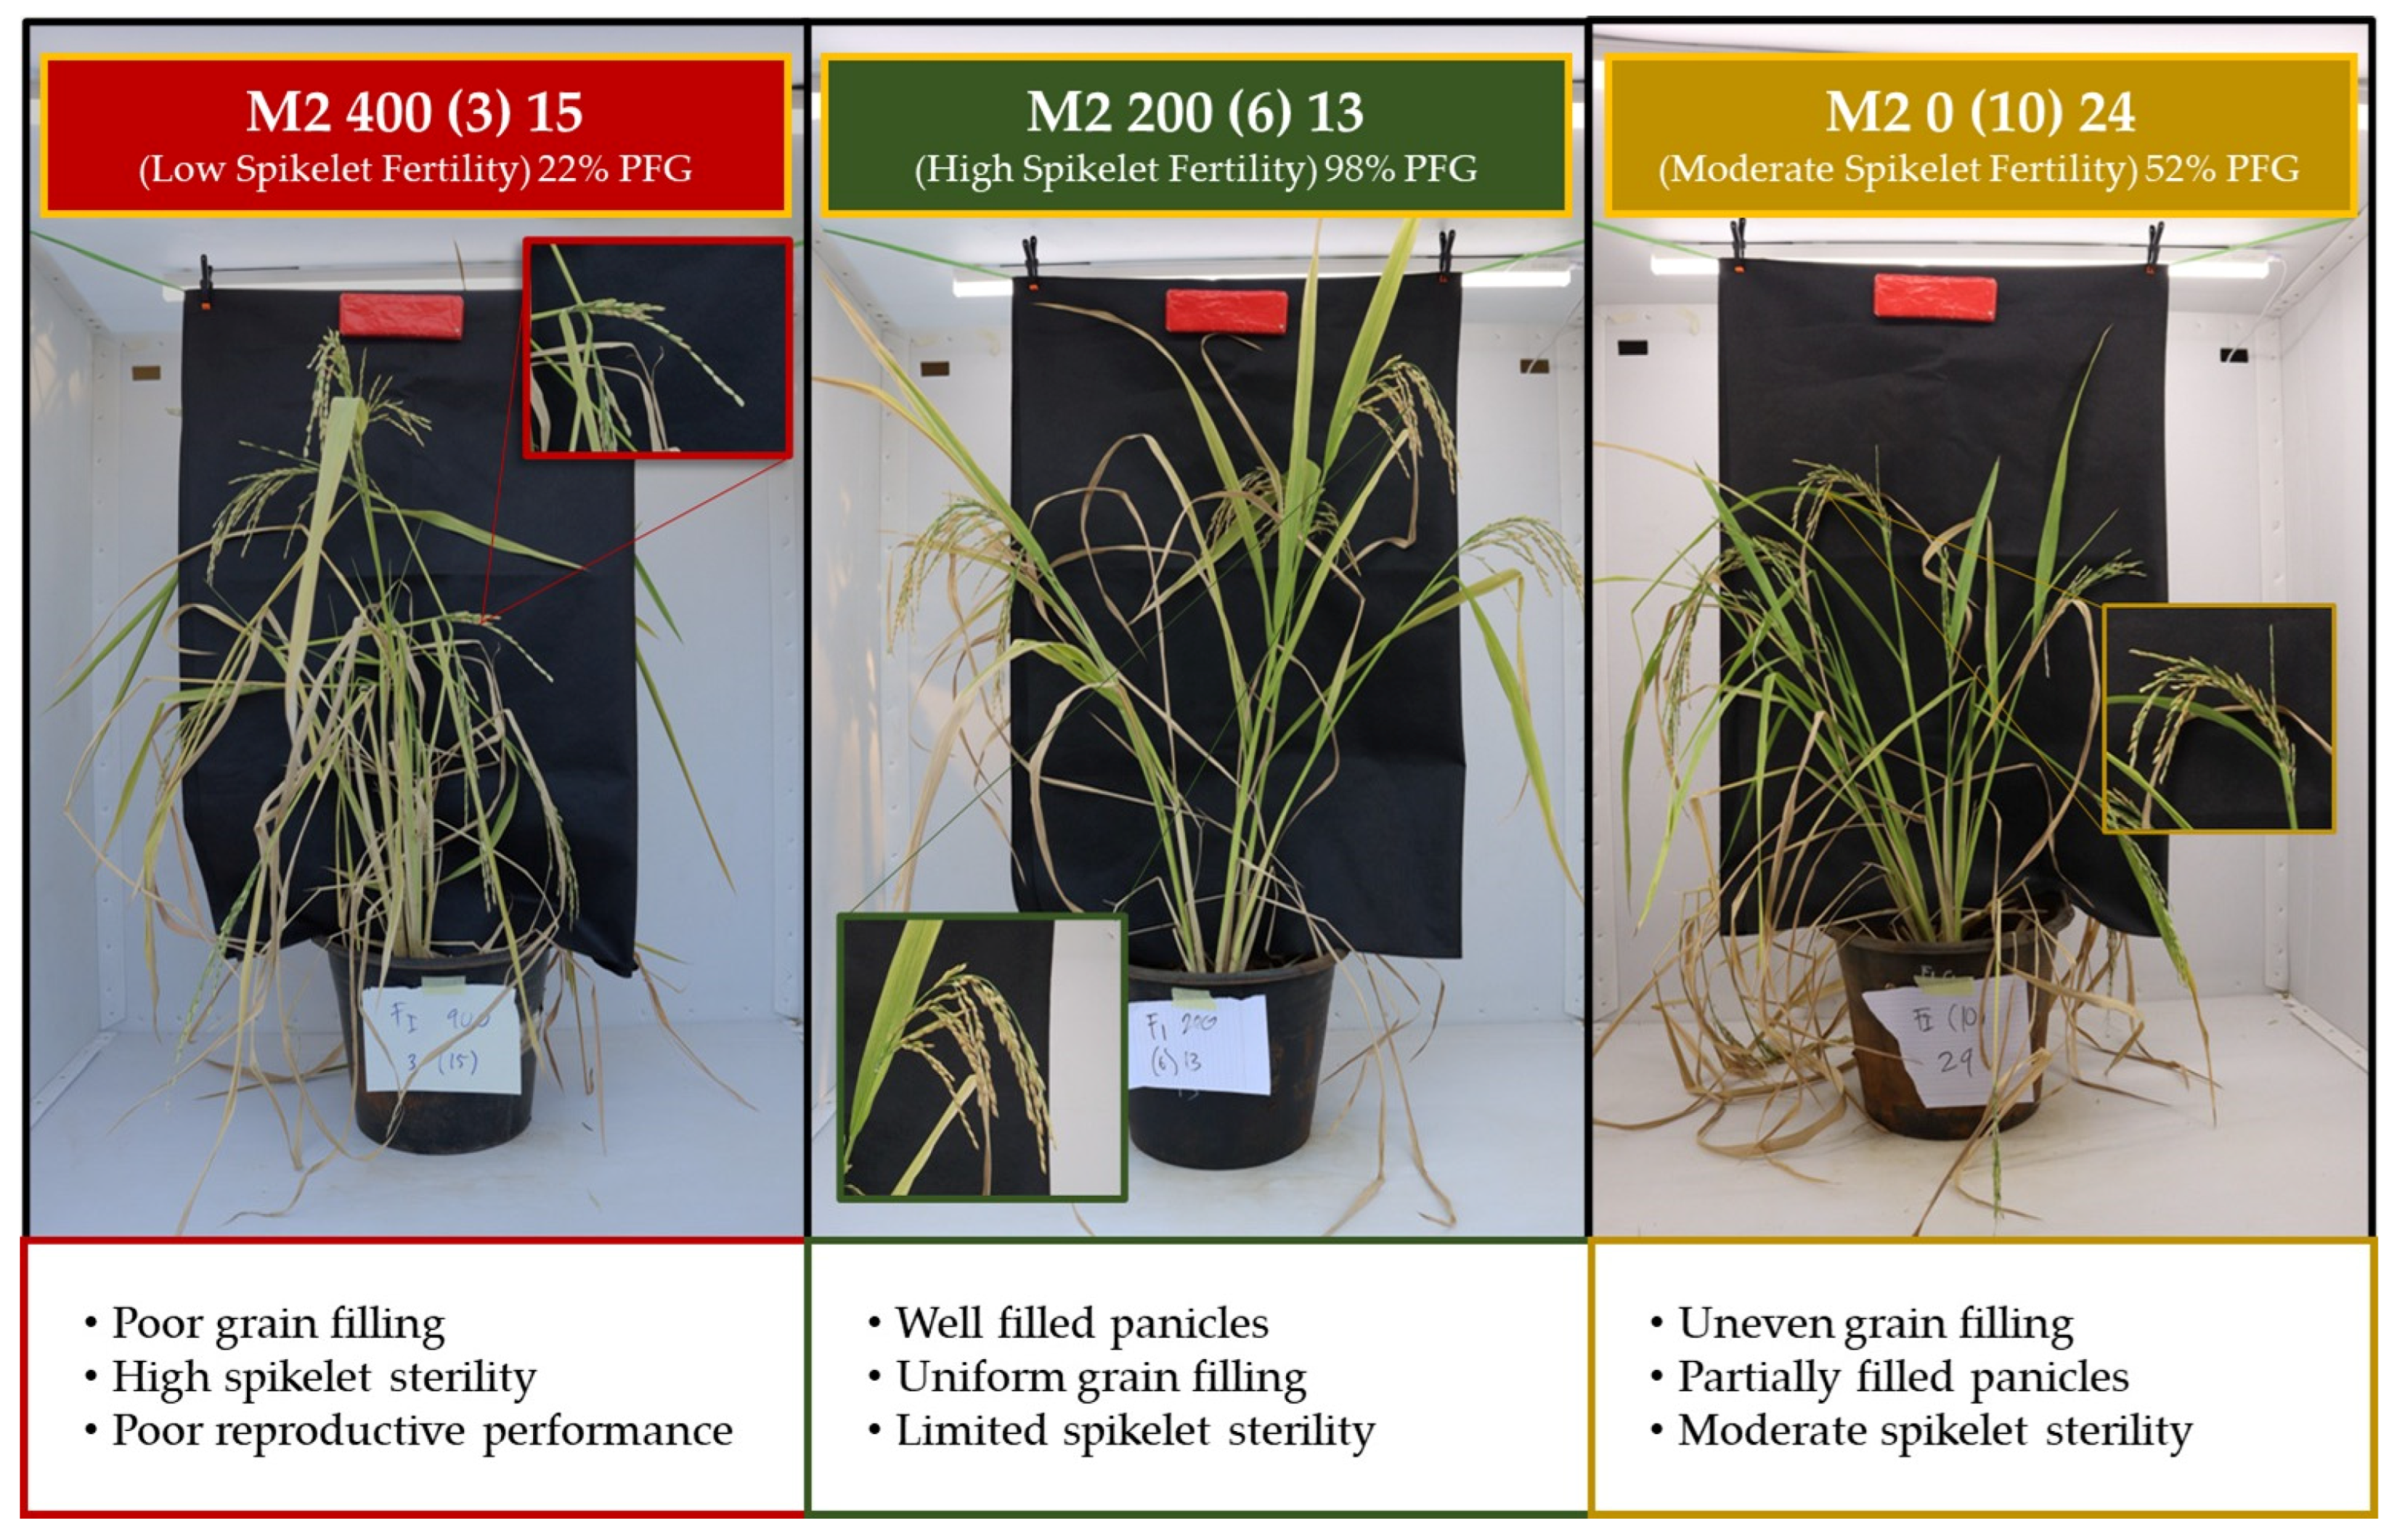
Apart from its immediate effects on seedling survival, damage incurred during the seedling phase may also exert carry-over effects on subsequent plant development, particularly during the reproductive stage. In the present study, this potential carry-over effect was reflected by the contrasting spikelet fertility among the M2 rice mutant population and the wild type (Figure 7). This phenomenon has been well documented in previous studies, where early exposure to combined drought and heat stress in rice was reported to disrupt normal vegetative growth by reducing biomass accumulation [6,54], limiting tiller development [55,56], impairing photosynthetic capacity [57,58], and restricting carbohydrate production [59]. These hypothesized effects may subsequently reduce the assimilate supply required for panicle development and grain filling during the reproductive stage, thus leading to increased spikelet sterility and yield loss.
The wild-type line retained moderate spikelet fertility following stress despite exhibiting seedling-stage stress injury, compared with most M2 rice mutants. This suggests that the wild type already possesses a capacity for recovery following combined drought-heat stress. The superior reproductive performance in the mutants may represent not the acquisition of a new stress response, but enhancement of the adaptive capacity in the wild type through mutation-induced genetic variation. Gamma irradiation induces random genetic variation throughout the genome, which may modify the function or regulation of genes involved in abiotic stress responses in the wild type. Consequently, induced mutagenesis increases available genetic variations within irradiated populations, enabling selection of individuals with enhanced adaptation to drought and heat stress.
These variations presented in the study suggest that stress responses expressed during the seedling stage may influence subsequent reproductive performance and yield-related traits. However, this relationship was not quantitatively evaluated in the present study. Therefore, future studies should investigate the direct mathematical relationship between seedling-stage tolerance and reproductive-stage performance.

4.2. Hypothesized Gene Mechanism Underlying Seedling Tolerance and Reproductive Resilience Under Combined Drought-Heat Stress in M2 Rice Mutant

Abiotic stress tolerance in rice is a trait regulated by interconnected physiological and molecular pathways coordinating plant adaptation to drought and heat stress throughout the life cycle. Rather than functioning independently at specific stages, many stress-responsive genes activated during early vegetative growth may contribute to maintaining growth, recovery, and reproductive development under prolonged or recurrent stress [60,61]. Although these mechanisms were not investigated in the present study, the contrasting responses between tolerant and susceptible mutants may reflect differential regulation of stress-responsive pathways reported in rice (Table 6). The candidate genes presented in the table represent regulatory pathways for water status maintenance, protection against oxidative and heat-induced damage, chlorophyll preservation, and reproductive resilience under abiotic stress. Although these mechanisms remain hypothetical in the present study, they provide a plausible physiological-molecular framework linking seedling tolerance with variation in yield-related traits. Gene expression analysis of these candidate genes would be valuable to elucidate the molecular basis of tolerance to drought-heat stress in rice.

4.3. Differential Sensitivity of Yield and Vegetative Traits to Gamma Irradiation in Rice M2 Mutants Under Drought–Heat Stress

The findings indicate that gamma ray irradiation enhances agronomic trait diversity within the line population, evidenced by broader trait distribution in the 200 Gy and 400 Gy lines than in the 0 (wild type). The expanded distribution suggests individuals with extreme superior and inferior performance due to induced random mutations. This pattern was most evident in yield component traits, including WPC, WPP, NTG, NFG, and W1000G, which showed greater variation in the mutant population than in the wild type. However, the increase was less pronounced in vegetative traits. This trend underscores the sensitivity of yield components to mutation-induced genetic changes. A similar pattern was reported by Anshori et al. (2025) [27], indicating pronounced diversity increases in yield components compared to vegetative traits.
The characteristics of yield components are predominantly governed by multiple genes, a condition known as polygenic control [80,81]. Random mutations induced by gamma rays have the potential to modify one or several genes within these regulatory networks [82], thereby generating increased variation in yield traits. Furthermore, yield traits represent the culmination of various physiological processes, meaning that minor genetic alterations can be magnified into significant phenotypic differences. In contrast, vegetative traits exhibit greater stability against mutational effects. Although they are generally under polygenic control, they are often predominantly influenced by major genes, resulting in genetic changes that do not necessarily lead to extreme variation.
The median distribution showed patterns among M2 0 (wild-type), M2 200, and M2 400 lines. In M2 0 lines, the distribution was narrow and centered on the median, indicating low variation in untreated populations. In contrast, M2 200 and M2 400 lines showed broader distributions than the wild type. However, in M2 400 lines, character value distribution expansion did not coincide with a median shift. By contrast, M2 200 lines showed broad variation and a median shift toward higher levels. This suggests that high dosage may induce extreme variation but does not significantly increase the proportion of individuals with optimal performance [27]. Therefore, moderate-dose gamma-ray induction was more effective in generating lines with enhanced diversity and improved agronomic performance.

4.4. Adaptability of M2 Generation Rice Mutant Lines to Various Doses of Gamma-Ray Irradiation Under Drought and High-Temperature Stress Based on Tolerance Scoring

The tolerance scoring method revealed variability among mutant lines generated through gamma-ray irradiation. The 200 line showed adaptability to drought and elevated temperatures over the wild-type and 400 lines. Evidenced by the concentration of individuals in the low-to-medium score range, the 200 group mostly comprised individuals with mild-to-moderate damage. This indicates that irradiation at 200 Gy induced beneficial mutations in the plant’s defense mechanisms against drought-heat stress. Previous studies suggest that tolerant rice genotypes exhibit stomatal regulation, cell turgor maintenance, and delayed leaf rolling under water deficit conditions [6,58,83]. These effects are reflected in tolerant-to-moderate LDS and LRS values, facilitating photosynthesis under drought-stress conditions.
The HTol and SF scoring values suggest that the M2 200 line exhibits potential as a genotype adaptable to high-temperature stress conditions. This adaptability is hypothesized to be associated with the line’s capacity to maintain cell membrane stability [69] and the integrity of the photosynthetic apparatus [84]. An HTol score within the tolerant-to-moderate category indicates minimal thermal damage to structural proteins, whereas an elevated spikelet fertility signifies successful reproductive processes that remain optimal despite exposure to extreme drought-heat stress [85]. According to [86], rice plants exposed to high-temperature stress accumulate compatible osmolytes, such as proline, soluble sugars, and protective proteins. Studies from [87] also show that an increase in the accumulation of these compounds occurs under drought stress treatment rather than well-watered rice. These compounds serve as osmoregulatory agents to maintain cell turgor and provide protection for enzymes and cell membranes against thermal denaturation.
In contrast, the M2 400 line exhibited a dispersed distribution pattern of scores, characterized by a low frequency of individuals within the tolerant category. This pattern indicates limited adaptability to multiple stressors. It was hypothesized that a high irradiation dose induces excessive genetic variation mutations, thereby disrupting the biochemical pathways responsible for neutralizing reactive oxygen species (ROS) [84]. Consequently, plants in the M2 400 line were prone to symptoms of chlorosis and leaf necrosis; previous studies have shown that these symptoms were attributed to chlorophyll degradation and lipid peroxidation in the cell membrane [52]. These observations were also aligned with the findings of Yanting et al. (2024) [88], who reported that gamma ray irradiation doses exceeding the optimal threshold result in an increase in ROS that cannot be neutralized by the antioxidant enzyme system, thus may lead to inhibited growth and tissue death in leaves due to biochemical imbalances in the plant’s leaf tissues [69,89].
A comparison of the adaptability responses between 400 Gy and the moderate dose of 200 Gy illustrates the hormesis phenomenon, in which a moderate dose has the potential to enhance plant adaptability to abiotic stress, whereas a high dose proves toxic to plant physiological processes, whereas higher doses produce inhibitory or deleterious effects. Under moderate irradiation, transient oxidative signals induced by gamma rays are hypothesized to function as signaling molecules that activate antioxidant defense systems, osmotic adjustment, DNA repair mechanisms, and stress-responsive metabolic pathways, thereby increasing plant resilience to subsequent abiotic stress. Similar biphasic dose–response patterns have been reported in rice [90,91] and other cereal crops [92,93], where intermediate gamma irradiation doses promoted stress tolerance and optimal growth performance, whereas higher doses exceeding the optimal threshold resulted in excessive ROS production that overwhelmed the antioxidant capacity, thereby promoting cellular injury and progressive reductions in physiological performance. These findings support the interpretation that the superior adaptability of the M2 200 line reflects a beneficial hormetic response, whereas the reduced performance of the M2 400 line represents the detrimental consequences of irradiation beyond the hormetic optimum.
In the M2 0 line (wild type), the score distribution appeared to be homogeneous across each assessment. This suggests a limited variation in the natural response of wild-type individuals when subjected to extreme environmental stress, as the entire population exhibited similar symptoms of damage. This observation serves as an indicator of the effective application of gamma-ray irradiation in inducing genetic variation within mutant lines, which may be considered potential candidates for selection as lines with enhanced adaptability to drought and high-temperature stress.

4.5. Multivariate Approach in Assessing Diversity and Mutation Effectiveness in M2 Generation Rice Populations Resulting from Gamma Irradiation Under Drought-High Stress

A multivariate approach integrating correlation, path analysis, PCA, and WASB elucidated relationships among rice mutant traits. Spearman’s correlation and path coefficient analyses identified NTG, NFG, WPP, and W1000G as primary yield determinants, with WPP mediating NTG and WPC. This supports the view that cereal crop yield is governed by interactions among traits [94]. Vegetative characters PH and NTT contribute indirectly by enhancing source capacity and supporting photosynthesis production and allocation. Yield stability under stress is determined by source–sink relationship efficiency, reflected in causal interactions among traits.
Path coefficient analysis highlighted PL as an indicator of sink capacity, exerting the strongest direct impact on WPC and contributing indirectly via WPP. Similar interpretations were reported by Parida et al. (2022) [95] and Anshori et al. (2025) [27], where panicle-related traits emerge as key determinants of sink strength and yield. Although NTG, NFG, and W1000G have minor effects, their overall impact is considerable through WPP, a central node in relationships. This structure reflects the hierarchical nature of yield formation, in which upstream traits indirectly influence yield through components. Vegetative traits, PH and NTT, also act through indirect pathways associated with photosynthate distribution. This structure is consistent with PCA findings distinguishing productivity (PC1) and vegetative (PC2) dimensions, supporting plant potential differentiation.
The combination of tolerance scores, PCA, and the WASB selection index enables comprehensive genotype identification by considering both tolerance and productivity together. Using stability indices such as WASB with multivariate techniques was reported previously by [96,97] to improve selection in variable, especially stress-prone, environments. This approach avoids bias from focusing on one trait group, ensuring genotypes have balanced characteristics. The relationship between genotypes’ PCA positions and selection index values also shows that high-performing genotypes generally occupy regions of strong productivity supported by adequate vegetative vigor, providing the basis for evaluating mutation treatment effectiveness.
The differences in genotype responses to gamma irradiation doses indicate that diversity is influenced by treatment intensity. A 200 Gy dose generates broader, more targeted variation in yield traits, whereas higher doses produce variation less efficient for agronomic performance. This pattern is consistent with mutation breeding theory, in which moderate irradiation doses are optimal for inducing useful variability without excessive deleterious effects. Genotypes without irradiation still show limitations in exploring diversity, reinforcing mutation as a source of variability. Studies by [27,98,99] on induced mutagenesis in rice showed that gamma irradiation enhances genetic variability, expanding selection for desirable traits. Thus, selection success depends not only on the extent of variation but also on its relevance to target traits.
Although this approach provides a framework for selecting putative multi-tolerant mutants to drought-heat stress, high residual values in path analysis indicate factors remain unaccounted for in the present study. High residuals suggest missing explanatory variables [100], particularly unmeasured physiological or molecular traits. Parameters such as photosynthetic rate, chlorophyll content, and molecular aspects likely influence seed filling efficiency and yield stability. Evidence from Chaturvedi et al. (2017) [101], Yang et al. (2024) [102], and Sharma et al. (2025) [103] has shown that physiological traits, including photosynthetic efficiency and assimilate partitioning, are determinants of stress tolerance in rice. In this study, drought and heat stress were imposed simultaneously, which may obscure each stressor’s contribution and interaction on trait expression and yield formation. The study lacked a separate non-stress control group; future studies should include non-stress, separate, and combined stress treatments, especially using stabilized lines, to disentangle individual and synergistic effects of drought and heat stresses.
Thus, future research that combines agronomic approaches with physiological and molecular dimensions and incorporates a non-stress control group, individual and combined drought and heat treatments is a logical step to improve selection accuracy and pave the way for the development of more precise screening methods to identify adaptive mutant rice lines to multiple stresses.

5. Conclusions

The findings demonstrated that the controlled stress chamber effectively simulated combined drought-heat stress during the rice seedling stage, as confirmed by the progressive decline in the FTSW, complete mortality of the susceptible check (IR29), and clear phenotypic differentiation among the evaluated mutant populations. Among the irradiation treatments, the 200 Gy populations exhibited higher seedling survival, more favorable tolerance score distribution, and a greater proportion of putative multi-tolerant mutants than the 400 Gy population, indicating that the moderate irradiation dose was more effective for inducing beneficial phenotypic variation. Multivariate analysis through correlation, path coefficient, and principal component analysis identified PL, WPC, NTG, NFG and W1000G as the principal traits associated with post-stress growth performance, with PL exerting the strongest direct effect on WPC, acting as a key mediator of indirect trait contributions. Furthermore, the integration of TScore, PCA, and the WASB provided a systematic multi-trait selection framework that was able to distinguish putative tolerant genotypes by simultaneously considering stress tolerance potential and multi-trait performance. These findings demonstrate that the proposed screening strategy is an effective approach for the early identification of putative multi-tolerant rice mutants and provides promising candidate genetic materials for subsequent validation in future analysis through physiological and molecular analyses.

Supplementary Materials

The following supporting information can be downloaded at: https://www.mdpi.com/article/10.3390/crops6040073/s1. Supplementary Table S1. Microclimatic conditions during drought-heat stress screening in a controlled-stress chamber; Supplementary Table S2. Distribution of agronomic and yield component traits among M2 rice mutants; Supplementary Figure S1. Location of the experimental site; Supplementary Figure S2. Structural design of the heat chamber used for seedling-phase screening; Supplementary Figure S3. Arrangement of rice genotypes in seedling trays for seedling-stage screening; Supplementary Figure S4. Distribution of observed agronomic and yield-component traits in wild-type and M2 rice mutants derived from 200 Gy and 400 Gy gamma irradiation. Supplementary Figure S5. Interactive 3D visualization of categorical genotype tolerance performance based on WASB components and tolerance score under drought-heat stress.

Author Contributions

Conceptualization, A.K.B., A.Y., B.S.P., M.R. and M.F.A.; methodology, A.K.B., A.Y., B.S.P., M.R. and M.F.A.; software, A.K.B., A.I.S. and M.F.A.; validation, A.N., I.S.D., R.R. and M.F.A.; formal analysis, A.K.B. and M.F.A.; investigation, A.K.B. and W.M.I.; resources, B.S.P., I.S.D., W.M.I. and M.F.A.; data curation, M.R., A.N., R.R. and A.I.S.; writing—original draft preparation, A.K.B. and M.F.A.; writing—review and editing, A.Y., B.S.P., M.R., A.N., I.S.D. and R.R.; visualization, A.K.B. and M.F.A.; supervision, A.Y. and M.F.A.; project administration, A.K.B.; funding acquisition, M.F.A. All authors have read and agreed to the published version of the manuscript.

Funding

This research was funded by Hasanuddin University for providing the foundation for this study through thematic research group grant batch 1 with number 01167/UN4.1.7/PT.01.03/2026.

Data Availability Statement

The original contributions presented in this study are included in the article/Supplementary Materials. Further inquiries can be directed to the corresponding author.

Acknowledgments

We are grateful to Hasanuddin University for providing the foundation for this study through thematic research group grant batch 1 with number 01167/UN4.1.7/PT.01.03/2026.

Conflicts of Interest

The authors declare no conflicts of interest.

Abbreviations

The following abbreviations are used in this manuscript:
DASDays after sowing
DAPDay after planting
DHDouble haploid
HTolHeat tolerance score
LRSLeaf rolling score
LDSLeaf drying score
MMutant generation
PCAPrincipal component analysis
SFSpikelet fertility
SESStandard evaluation system
TscoreTolerance score
WASBWeighted Absolute Score
WPCWeight per clump

References

  1. Arif, M.; Fiaz, S.; Kandegama, W.M.W.W.; Sheth, S.; Li, L. Evaluating the Impacts of Environmental Stresses on Agriculture in the Context of Climate Resilience. Plant Mol. Biol. 2025, 115, 73. [Google Scholar] [CrossRef] [Scilit] [PubMed]
  2. Jiang, Z.; van Zanten, M.; Sasidharan, R. Mechanisms of Plant Acclimation to Multiple Abiotic Stresses. Commun. Biol. 2025, 8, 655. [Google Scholar] [CrossRef] [Scilit] [PubMed]
  3. Zafar, S.; Khan, M.K.; Aslam, N.; Hasnain, Z. Impact of Different Stresses on Morphology, Physiology, and Biochemistry of Plants. In Molecular Dynamics of Plant Stress and Its Management; Springer Nature: Singapore, 2024; pp. 67–91. [Google Scholar]
  4. Lamaoui, M.; Jemo, M.; Datla, R.; Bekkaoui, F. Heat and Drought Stresses in Crops and Approaches for Their Mitigation. Front. Chem. 2018, 6, 26. [Google Scholar] [CrossRef] [Scilit] [PubMed]
  5. Radha, B.; Sunitha, N.C.; Sah, R.P.; Tp, M.A.; Krishna, G.K.; Umesh, D.K.; Thomas, S.; Anilkumar, C.; Upadhyay, S.; Kumar, A.; et al. Physiological and Molecular Implications of Multiple Abiotic Stresses on Yield and Quality of Rice. Front. Plant Sci. 2023, 13, 996514. [Google Scholar] [CrossRef] [Scilit] [PubMed]
  6. Mondal, K.; Kar, R.K.; Chakraborty, A.; Dey, N. Concurrent Effect of Drought and Heat Stress in Rice (Oryza sativa L.): Physio-Biochemical and Molecular Approach. 3 Biotech 2024, 14, 132. [Google Scholar] [CrossRef] [Scilit] [PubMed]
  7. Salgotra, R.K.; Chauhan, B.S. Ecophysiological Responses of Rice (Oryza sativa L.) to Drought and High Temperature. Agronomy 2023, 13, 1877. [Google Scholar] [CrossRef] [Scilit]
  8. Kamatchi, K.A.M.; Anitha, K.; Kumar, K.A.; Senthil, A.; Kalarani, M.K.; Djanaguiraman, M. Impacts of Combined Drought and High-Temperature Stress on Growth, Physiology, and Yield of Crops. Plant Physiol. Rep. 2024, 29, 28–36. [Google Scholar] [CrossRef] [Scilit]
  9. Bhandari, U.; Gajurel, A.; Khadka, B.; Thapa, I.; Chand, I.; Bhatta, D.; Poudel, A.; Pandey, M.; Shrestha, S.; Shrestha, J. Morpho-Physiological and Biochemical Response of Rice (Oryza sativa L.) to Drought Stress: A Review. Heliyon 2023, 9, e13744. [Google Scholar] [CrossRef] [Scilit] [PubMed]
  10. Fatima, S.; Rashid, M.; Hameed, A.; Fiaz, S.; Rebouh, N.Y.; Zaman, Q. Development of Rice Mutants with Enhanced Resilience to Drought and Brown Spot (Bipolaris oryzae) and Their Physiological and Multivariate Analysis. BMC Plant Biol. 2025, 25, 1040. [Google Scholar] [CrossRef] [Scilit] [PubMed]
  11. Thomas, T.; Purushothaman, J.; Janarthanan, R.; Anusuya, N.; Medisetti, P.G.; Karthick, J.; Nadaradjan, S.; Thirumeni, S. Identification of Rice Genotypes for Seedling Stage Multiple Abiotic Stress Tolerance. Plant Physiol. Rep. 2020, 25, 697–706. [Google Scholar] [CrossRef] [Scilit]
  12. Madhu, B.; Singh, N.U.; Sukrutha, B.; Deepika, K.; Ananda Lekshmi, L.; Venkateswarao, G.; Lavudya, S. Conventional and Molecular Breeding Strategies for Improvement of Drought Tolerance Cultivars in Rice: Recent Approaches and Outlooks. Environ. Conserv. J. 2023, 24, 367–381. [Google Scholar] [CrossRef] [Scilit]
  13. Anilkumar, C.; Sah, R.P.; Beena, R.; Tp, M.A.; Kumar, A.; Behera, S.; Sunitha, N.; Pradhan, S.; Reshmi Raj, K.; Parameswaran, C.; et al. Conventional and Contemporary Approaches for Drought Tolerance Rice Breeding: Progress and Prospects. Plant Breed. 2023, 142, 418–438. [Google Scholar] [CrossRef] [Scilit]
  14. Chimthai, S.; Cheabu, S.; Aesomnuk, W.; Ruengphayak, S.; Arikit, S.; Vanavichit, A.; Malumpong, C. Breeding for Heat Tolerant Aromatic Rice Varieties and Identification of Novel QTL Regions Associated with Heat Tolerance During Reproductive Phase by QTL-Seq. Rice Sci. 2025, 32, 67–80. [Google Scholar] [CrossRef] [Scilit]
  15. Bhosale, S.; Thathapalli Prakash, P.; Kadaru, S.B.; Hussain, W.; Dixit, S.; Ali, J.; Platten, J.D.; Islam, M.R.; Singh, V.K.; Murori, R.; et al. Onerice Breeding Framework: An End-to-end System to Develop Better Varieties Faster. Crop Sci. 2025, 65, e70087. [Google Scholar] [CrossRef] [Scilit]
  16. Khazaei, H.; Dodd, I.C.; Ortiz, R. Breeding for Multi-stress Resilience in Crops: Myth or Possibility? Plants People Planet 2026, 1–10. [Google Scholar] [CrossRef] [Scilit]
  17. Ali, J.; Anumalla, M.; Murugaiyan, V.; Li, Z. Green Super Rice (GSR) Traits: Breeding and Genetics for Multiple Biotic and Abiotic Stress Tolerance in Rice. In Rice Improvement; Springer International Publishing: Cham, Switzerland, 2021; pp. 59–97. [Google Scholar]
  18. Yali, W.; Mitiku, T. Mutation Breeding and Its Importance in Modern Plant Breeding. J. Plant Sci. 2022, 10, 64. [Google Scholar] [CrossRef] [Scilit]
  19. Zakir, M. Mutation Breeding and Its Application in Crop Improvement under Current Environmental Situations for Biotic and Abiotic Stresses. Int. J. Res. Stud. Agric. Sci. 2018, 4, 2454–6224. [Google Scholar] [CrossRef] [Scilit]
  20. Oladosu, Y.; Rafii, M.Y.; Abdullah, N.; Hussin, G.; Ramli, A.; Rahim, H.A.; Miah, G.; Usman, M. Principle and Application of Plant Mutagenesis in Crop Improvement: A Review. Biotechnol. Biotechnol. Equip. 2016, 30, 1–16. [Google Scholar] [CrossRef] [Scilit]
  21. Ke, C.; Guan, W.; Bu, S.; Li, X.; Deng, Y.; Wei, Z.; Wu, W.; Zheng, Y. Determination of Absorption Dose in Chemical Mutagenesis in Plants. PLoS ONE 2019, 14, e0210596. [Google Scholar] [CrossRef] [Scilit] [PubMed]
  22. Sao, R.; Sahu, P.K.; Patel, R.S.; Das, B.K.; Jankuloski, L.; Sharma, D. Genetic Improvement in Plant Architecture, Maturity Duration and Agronomic Traits of Three Traditional Rice Landraces through Gamma Ray-Based Induced Mutagenesis. Plants 2022, 11, 3448. [Google Scholar] [CrossRef] [Scilit] [PubMed]
  23. Wei, F.-J.; Droc, G.; Guiderdoni, E.; Hsing, Y.C. International Consortium of Rice Mutagenesis: Resources and Beyond. Rice 2013, 6, 39. [Google Scholar] [CrossRef] [Scilit] [PubMed]
  24. Viana, V.E.; Pegoraro, C.; Busanello, C.; de Oliveira, A.C. Mutagenesis in Rice: The Basis for Breeding a New Super Plant. Front. Plant Sci. 2019, 10, 1326. [Google Scholar] [CrossRef] [Scilit] [PubMed]
  25. Yu, H.; Xu, Y.; Gu, Z.; Wang, K.; Zhang, T.; Qian, Q.; Li, J. Rice 2035: A Decadal Vision for Rice Research and Breeding. Mol. Plant 2026, 19, 456–469. [Google Scholar] [CrossRef] [Scilit] [PubMed]
  26. Wang, Q.; Tang, J.; Han, B.; Huang, X. Advances in Genome-Wide Association Studies of Complex Traits in Rice. Theor. Appl. Genet. 2020, 133, 1415–1425. [Google Scholar] [CrossRef] [Scilit] [PubMed]
  27. Anshori, M.F.; Purwoko, B.S.; Carsono, N.; Dewi, I.S.; Bahrun, A.H.; Baharuddin, A.K.; Rahman, R.; Indriatama, W.M.; Alotaibi, M.; Ali, N.; et al. Integration of Gamma Irradiation Breeding from Doubled Haploid and Systematic Screening to Develop Adapted Rice Mutants under Salinity Stress. BMC Plant Biol. 2025, 25, 1571. [Google Scholar] [CrossRef] [Scilit] [PubMed]
  28. Anshori, M.F.; Purwoko, B.S.; Dewi, I.S.; Suwarno, W.B.; Ardie, S.W. Salinity Tolerance Selection of Doubled-Haploid Rice Lines Based on Selection Index and Factor Analysis. AIMS Agric. Food 2022, 7, 520–535. [Google Scholar] [CrossRef] [Scilit]
  29. FAO/IAEA. Manual on Mutation Breeding, 3rd ed.; Spencer-Lopes, M.M., Jankuloski, L., Ghanim, M.A., Matijevic, M., Kodym, A., Eds.; FAO: Rome, Italy; IAEA: Vienna, Austria, 2018. [Google Scholar]
  30. Ishak, I. Genetic Variability of Mutant Rice (Oryza sativa) Genotype Induced by Gamma Rays. Biodivers. J. Biol. Divers. 2023, 24, 3300–3306. [Google Scholar] [CrossRef] [Scilit]
  31. Bado, S.; Forster, B.P.; Nielen, S.; Ali, A.M.; Lagoda, P.J.L.; Till, B.J.; Laimer, M. Plant Mutation Breeding: Current Progress and Future Assessment. In Plant Breeding Reviews: Volume 39; Wiley: Hoboken, NJ, USA, 2015; pp. 23–88. [Google Scholar]
  32. Jasmin, A.; Rajendran, K. Identification of Rice Genotypes for Reproductive Stage Heat Tolerance and Yield Stability through Multi-Trait and Multivariate Analysis. Front. Plant Sci. 2026, 17, 1853773. [Google Scholar] [CrossRef] [Scilit] [PubMed]
  33. Anshori, M.F.; Purwoko, B.S.; Dewi, I.S.; Ardie, S.W.; Suwarno, W.B.; Safitri, H. Determination of Selection Criteria for Screening of Rice Genotypes for Salinity Tolerance. Sabrao J. Breed. Genet. 2018, 50, 279–294. [Google Scholar]
  34. Anshori, M.F.; Purwoko, B.S.; Dewi, I.S.; Ardie, S.W.; Suwarno, W.B. Selection Index Based on Multivariate Analysis for Selecting Doubled-Haploid Rice Lines in Lowland Saline Prone Area. Sabrao J. Breed. Genet. 2019, 51, 161–174. [Google Scholar]
  35. Szarejko, I.; Forster, B.P. Doubled Haploidy and Induced Mutation. Euphytica 2007, 158, 359–370. [Google Scholar] [CrossRef] [Scilit]
  36. Al Qautzar, M.F.; Anshori, M.F.; Bahrun, A.H.; Purwoko, B.S.; Dewi, I.S.; Indriatama, W.M.; Dungga, N.E.; Rahman, R. Analysis of Radiosensitivity and M1 Mutation Variance in Double Haploid Rice Induced by Gamma Ray Irradiation. Sarhad J. Agric. 2026, 42, 105. [Google Scholar] [CrossRef] [Scilit]
  37. Basu, S.; Roychoudhury, A.; Saha, P.P.; Sengupta, D.N. Differential Antioxidative Responses of Indica Rice Cultivars to Drought Stress. Plant Growth Regul. 2010, 60, 51–59. [Google Scholar] [CrossRef] [Scilit]
  38. Sarsu, F.; Ghanim, A.M.A.; Das, P.; Bahuguna, R.N.; Kusolwa, P.M.; Ashraf, M.; Singla-Pareek, S.L.; Pareek, A.; Forster, B.P.; Ingelbrecht, I. Pre-Field Screening Protocols for Heat-Tolerant Mutants in Rice; Springer: Berlin/Heidelberg, Germany, 2018. [Google Scholar] [CrossRef] [Scilit]
  39. Valiantzas, J.D. Simplified Forms for the Standardized FAO-56 Penman–Monteith Reference Evapotranspiration Using Limited Weather Data. J. Hydrol. 2013, 505, 13–23. [Google Scholar] [CrossRef] [Scilit]
  40. IRRI. Standard Evaluation System for Rice (SES); IRRI: Manila, Philippines, 2002; pp. 1–56. [Google Scholar]
  41. Backhaus, K.; Erichson, B.; Gensler, S.; Weiber, R.; Weiber, T. Multivariate Analysis; Springer Fachmedien: Wiesbaden, Germany, 2021. [Google Scholar]
  42. Patro, S.G.K.; Sahu, K.K. Normalization: A Preprocessing Stage. Lond. J. Press 2015, 19, 39–44. [Google Scholar]
  43. Okoye, K.; Hosseini, S. Correlation Tests in R: Pearson Cor, Kendall’s Tau, and Spearman’s Rho. In R Programming; Springer Nature: Singapore, 2024; pp. 247–277. [Google Scholar]
  44. Yadav, S.P.S.; Bhandari, S.; Ghimire, N.P.; Mehata, D.K.; Majhi, S.K.; Bhattarai, S.; Shrestha, S.; Yadav, B.; Chaudhary, P.; Bhujel, S. Genetic Variability, Character Association, Path Coefficient, and Diversity Analysis of Rice (Oryza sativa L.) Genotypes Based on Agro-Morphological Traits. Int. J. Agron. 2024, 2024, 9946332. [Google Scholar] [CrossRef] [Scilit]
  45. Wright, S. The Method of Path Coefficients. Ann. Math. Stat. 1934, 5, 161–215. [Google Scholar] [CrossRef] [Scilit]
  46. Shrestha, N. Factor Analysis as a Tool for Survey Analysis. Am. J. Appl. Math. Stat. 2021, 9, 4–11. [Google Scholar] [CrossRef] [Scilit]
  47. Jollife, I.T.; Cadima, J. Principal Component Analysis: A Review and Recent Developments. Philos. Trans. R. Soc. A Math. Phys. Eng. Sci. 2016, 374, 20150202. [Google Scholar] [CrossRef] [Scilit] [PubMed]
  48. Pour-Aboughadareh, A.; Khalili, M.; Poczai, P.; Olivoto, T. Stability Indices to Deciphering the Genotype-by-Environment Interaction (GEI) Effect: An Applicable Review for Use in Plant Breeding Programs. Plants 2022, 11, 414. [Google Scholar] [CrossRef] [Scilit] [PubMed]
  49. Grossiord, C.; Buckley, T.N.; Cernusak, L.A.; Novick, K.A.; Poulter, B.; Siegwolf, R.T.W.; Sperry, J.S.; McDowell, N.G. Plant Responses to Rising Vapor Pressure Deficit. New Phytol. 2020, 226, 1550–1566. [Google Scholar] [CrossRef] [Scilit] [PubMed]
  50. Tanguilig, V.C.; Yambao, E.B.; O’toole, J.C.; De Datta, S.K. Water Stress Effects on Leaf Elongation, Leaf Water Potential, Transpiration, and Nutrient Uptake of Rice, Maize, and Soybean. Plant Soil 1987, 103, 155–168. [Google Scholar] [CrossRef] [Scilit]
  51. Yavas, I.; Jamal, M.A.; Ul Din, K.; Ali, S.; Hussain, S.; Farooq, M. Drought-Induced Changes in Leaf Morphology and Anatomy: Overview, Implications and Perspectives. Pol. J. Environ. Stud. 2024, 33, 1517–1530. [Google Scholar] [CrossRef] [Scilit]
  52. Hanif, S.; Saleem, M.F.; Sarwar, M.; Irshad, M.; Shakoor, A.; Wahid, M.A.; Khan, H.Z. Biochemically Triggered Heat and Drought Stress Tolerance in Rice by Proline Application. J. Plant Growth Regul. 2021, 40, 305–312. [Google Scholar] [CrossRef] [Scilit]
  53. Mthiyane, P.; Aycan, M.; Mitsui, T. Strategic Advancements in Rice Cultivation: Combating Heat Stress through Genetic Innovation and Sustainable Practices—A Review. Stresses 2024, 4, 452–480. [Google Scholar] [CrossRef] [Scilit]
  54. Wang, X.; Liu, X.; Su, Y.; Shen, H. Rice Responses to Abiotic Stress: Key Proteins and Molecular Mechanisms. Int. J. Mol. Sci. 2025, 26, 896. [Google Scholar] [CrossRef] [Scilit] [PubMed]
  55. Jiang, X.; Li, G.; Luo, S. The Research Progress on the Mechanisms of Drought Stress at Different Growth Stages Affecting Rice Yield Formation. Resour. Data J. 2025, 4, 302–321. [Google Scholar]
  56. Kalaitzidis, A.; Kadoglidou, K.; Mylonas, I.; Ghoghoberidze, S.; Ninou, E.; Katsantonis, D. Investigating the Impact of Tillering on Yield and Yield-Related Traits in European Rice Cultivars. Agriculture 2025, 15, 616. [Google Scholar] [CrossRef] [Scilit]
  57. Anwar, K.; Joshi, R.; Bahuguna, R.N.; Govindjee, G.; Sasidharan, R.; Singla-Pareek, S.L.; Pareek, A. Impact of Individual, Combined and Sequential Stress on Photosynthesis Machinery in Rice (Oryza sativa L.). Physiol. Plant. 2024, 176, e14209. [Google Scholar] [CrossRef] [Scilit] [PubMed]
  58. Sato, H.; Mizoi, J.; Shinozaki, K.; Yamaguchi-Shinozaki, K. Complex Plant Responses to Drought and Heat Stress under Climate Change. Plant J. 2024, 117, 1873–1892. [Google Scholar] [CrossRef] [Scilit] [PubMed]
  59. Sadhukhan, D.; Mukherjee, T.; Sarkar, A.; Devi, N.D.; Bisarya, D.; Kumar, V.; Jincy, M. A Comprehensive Analysis of Drought Stress Responses in Rice (Oryza sativa L.): Insights into Developmental Stage Variations from Germination to Grain Filling. Int. J. Environ. Clim. Change 2024, 14, 141–158. [Google Scholar] [CrossRef] [Scilit]
  60. Gammanpila, H.; Sashika, M.A.N.; Priyadarshani, S.V.G.N. Transcription Factors in Rice (Oryza sativa) Agriculture: Enhancing Resilience to Environmental Stress and Global Food Security. Stresses 2025, 5, 55. [Google Scholar] [CrossRef] [Scilit]
  61. Ganie, S.A.; McMulkin, N.; Devoto, A. The Role of Priming and Memory in Rice Environmental Stress Adaptation: Current Knowledge and Perspectives. Plant. Cell Environ. 2024, 47, 1895–1915. [Google Scholar] [CrossRef] [Scilit] [PubMed]
  62. Nyasulu, M.; Medison, R.G.; Mushtaq, W.; Mataka, S.N. Stress-Tolerance Genes in Rice: Bridging Gene Discovery, Functional Validation, and Breeding Applications. Front. Plant Sci. 2026, 17, 1835666. [Google Scholar] [CrossRef] [Scilit] [PubMed]
  63. Kamal, N.M.; Gorafi, Y.S.A.; Abdelrahman, M.; Abdellatef, E.; Tsujimoto, H. Stay-Green Trait: A Prospective Approach for Yield Potential, and Drought and Heat Stress Adaptation in Globally Important Cereals. Int. J. Mol. Sci. 2019, 20, 5837. [Google Scholar] [CrossRef] [Scilit] [PubMed]
  64. Dwiningsih, Y.; Kumar, A.; Thomas, J.; Ruiz, C.; Alkahtani, J.; Baisakh, N.; Pereira, A. Quantitative Trait Loci and Candidate Gene Identification for Chlorophyll Content in RIL Rice Population under Drought Conditions. Indones. J. Nat. Pigment. 2021, 3, 54. [Google Scholar] [CrossRef] [Scilit]
  65. Singh, A.K.; Yadav, N.; Singh, A.; Singh, A. Stay-Green Rice Has Greater Drought Resistance: One Unique, Functional SG Rice Increases Grain Production in Dry Conditions. Acta Bot. Plantae 2023, 2, 38. [Google Scholar]
  66. Chakraborty, K.; Jena, P.; Mondal, S.; Dash, G.K.; Ray, S.; Baig, M.J.; Swain, P. Relative Contribution of Different Members of OsDREB Gene Family to Osmotic Stress Tolerance in Indica and Japonica Ecotypes of Rice. Plant Biol. 2022, 24, 356–366. [Google Scholar] [CrossRef] [Scilit] [PubMed]
  67. Zong, W.; Yang, J.; Fu, J.; Xiong, L. Synergistic Regulation of Drought-responsive Genes by Transcription Factor OsbZIP23 and Histone Modification in Rice. J. Integr. Plant Biol. 2020, 62, 723–729. [Google Scholar] [CrossRef] [Scilit] [PubMed]
  68. Kurowska, M.; Janiak, A.; Sitko, K.; Potocka, I.; Gajecka, M.; Sybilska, E.; Płociniczak, T.; Lip, S.; Rynkiewicz, M.; Wiecha, K.; et al. Functional Analysis of HvSNAC1 in Stomatal Dynamics and Drought Adaptation. J. Appl. Genet. 2025, 66, 817–840. [Google Scholar] [CrossRef] [Scilit] [PubMed]
  69. Ma, Y.; Wu, Z.; Dong, J.; Zhang, S.; Zhao, J.; Yang, T.; Yang, W.; Zhou, L.; Wang, J.; Chen, J.; et al. The 14-3-3 Protein OsGF14f Interacts with OsbZIP23 and Enhances Its Activity to Confer Osmotic Stress Tolerance in Rice. Plant Cell 2023, 35, 4173–4189. [Google Scholar] [CrossRef] [Scilit] [PubMed]
  70. Hong, S.H.; Tripathi, B.N.; Chung, M.-S.; Cho, C.; Lee, S.; Kim, J.-H.; Bai, H.-W.; Bae, H.-J.; Cho, J.-Y.; Chung, B.Y.; et al. Functional Switching of Ascorbate Peroxidase 2 of Rice (OsAPX2) between Peroxidase and Molecular Chaperone. Sci. Rep. 2018, 8, 9171. [Google Scholar] [CrossRef] [Scilit] [PubMed]
  71. Zafar, S.A.; Hameed, A.; Ashraf, M.; Khan, A.S.; Qamar, Z.; Li, X.; Siddique, K.H.M. Agronomic, Physiological and Molecular Characterisation of Rice Mutants Revealed the Key Role of Reactive Oxygen Species and Catalase in High-Temperature Stress Tolerance. Funct. Plant Biol. 2020, 47, 440–453. [Google Scholar] [CrossRef] [Scilit] [PubMed]
  72. Luo, C.; Min, W.; Akhtar, M.; Lu, X.; Bai, X.; Zhang, Y.; Tian, L.; Li, P. Melatonin Enhances Drought Tolerance in Rice Seedlings by Modulating Antioxidant Systems, Osmoregulation, and Corresponding Gene Expression. Int. J. Mol. Sci. 2022, 23, 12075. [Google Scholar] [CrossRef] [Scilit] [PubMed]
  73. Sun, X.; Wang, Y.; Chen, Y.; Zhang, P.; Li, Y.; Ouyang, T.; Li, L.; Zhu, J.; Jia, X.; Ye, X.; et al. OsLEML2 Regulates Rice Thermotolerance Through Auxin and ROS Homeostasis. Rice 2025, 18, 99. [Google Scholar] [CrossRef] [Scilit] [PubMed]
  74. Lu, J.; Chen, J.; Chen, H.; Fan, Z.; Lin, L.; Liu, C.; Wu, X.; Huang, J.; Liu, Z.; Li, J.; et al. Heat Shock Transcription Factor OsHsfc1a Enhances Rice Seedling Thermotolerance by Regulating OsMFT1 and Preserving Chloroplast Structure Under Heat Stress. Plant Biotechnol. J. 2026, 24, 1898–1915. [Google Scholar] [CrossRef] [Scilit] [PubMed]
  75. Yu, H.; Jiang, L.; Sun, B.; Liu, Q.; Mao, X.; Zhang, J.; Chen, P.; Chen, W.; Li, C.; Lyu, S. Hsp101-1 Orchestrates Thermotolerance in Rice via Pre-Activated Transcriptional Networks and Modular Cross-Tissue Coordination. Genes 2025, 16, 1039. [Google Scholar] [CrossRef] [Scilit] [PubMed]
  76. Tripathi, G.; Biswal, A.K.; Sarkar, N.K.; Kumar, K.; Sahi, C.; Grover, A. HSP101 Alleles from Indica and Japonica Subspecies of Rice (Oryza sativa L.) Show Differential Response to Heat Stress. Planta 2025, 262, 140. [Google Scholar] [CrossRef] [Scilit] [PubMed]
  77. Kusano, H.; She, K.-C.; Matsubara, K.; Wang, L.-L.; Tsujiuchi, K.; Matsumoto, R.; Shiraishi, M.; Okubo, Y.; Yasui, H.; Sasaki, T.; et al. Rice Sucrose Transporter 1, OsSUT1, Confers to Alleviation of the High Temperature Stress in Rice Grain Filling. Plant Biotechnol. 2025, 42, 467–473. [Google Scholar] [CrossRef] [Scilit] [PubMed]
  78. Wahab, M.M.S.; Akkareddy, S.; Shanthi, P.; Latha, P. Identification of Differentially Expressed Genes under Heat Stress Conditions in Rice (Oryza sativa L.). Mol. Biol. Rep. 2020, 47, 1935–1948. [Google Scholar] [CrossRef] [Scilit] [PubMed]
  79. Zhang, C.; Wang, Y.; Meng, W.; Yu, X.; Xu, M.; Wang, Y.; Xiong, L.; Qi, X.; Ma, X.; Ma, J.; et al. Transcriptomic and DNA Methylation Insights into Polyploidy-Enhanced Heat Tolerance in Rice (Oryza sativa L.). Plant Physiol. 2026, 200, kiag135. [Google Scholar] [CrossRef] [Scilit] [PubMed]
  80. Debsharma, S.K.; Syed, M.A.; Ali, M.H.; Maniruzzaman, S.; Roy, P.R.; Brestic, M.; Gaber, A.; Hossain, A. Harnessing on Genetic Variability and Diversity of Rice (Oryza sativa L.) Genotypes Based on Quantitative and Qualitative Traits for Desirable Crossing Materials. Genes 2022, 14, 10. [Google Scholar] [CrossRef] [Scilit] [PubMed]
  81. Reddyyamini, B.; Hariprasad Reddy, K.; Narayana Reddy, V.L.; Ramesh Babu, P.; Sudhakar, P. Transgressive Segregation for Yield and Its Component Traits in Rice (Oryza sativa L.). Int. J. Curr. Microbiol. Appl. Sci. 2019, 8, 2450–2455. [Google Scholar] [CrossRef] [Scilit]
  82. Rashid, M.; Khan, A.; Al–Dosary, M.A.; Alshudukhi, F.M.S.; Alamri, S.; Siddiqui, M.H.; Ashraf, K.; uz Zaman, Q. Broadening the Genetic Horizon of Rice: Comparative Insights from Gamma Radiation and EMS-Induced Mutagenesis. BMC Plant Biol. 2026, in press. [Google Scholar] [CrossRef] [Scilit] [PubMed]
  83. Rao, M.J.; Duan, M.; Zhou, C.; Jiao, J.; Cheng, P.; Yang, L.; Wei, W.; Shen, Q.; Ji, P.; Yang, Y.; et al. Antioxidant Defense System in Plants: Reactive Oxygen Species Production, Signaling, and Scavenging During Abiotic Stress-Induced Oxidative Damage. Horticulturae 2025, 11, 477. [Google Scholar] [CrossRef] [Scilit]
  84. Tan, Y.; Duan, Y.; Chi, Q.; Wang, R.; Yin, Y.; Cui, D.; Li, S.; Wang, A.; Ma, R.; Li, B.; et al. The Role of Reactive Oxygen Species in Plant Response to Radiation. Int. J. Mol. Sci. 2023, 24, 3346. [Google Scholar] [CrossRef] [Scilit] [PubMed]
  85. Cheabu, S.; Moung-Ngam, P.; Arikit, S.; Vanavichit, A.; Malumpong, C. Effects of Heat Stress at Vegetative and Reproductive Stages on Spikelet Fertility. Rice Sci. 2018, 25, 218–226. [Google Scholar] [CrossRef] [Scilit]
  86. Shrestha, S.; Mahat, J.; Shrestha, J.; Madhav, K.C.; Paudel, K. Influence of High-Temperature Stress on Rice Growth and Development. A Review. Heliyon 2022, 8, e12651. [Google Scholar] [CrossRef] [Scilit] [PubMed]
  87. Barik, M.; Das, A.; Pattnaik, A.; Mohanty, J.N.; Baig, M.J.; Swain, P. Characterization of Vegetative Stage Responses in Four Rice Genotypes (Oryza sativa L.) under Drought Stress: Integrating Morpho-Physiological, Biochemical Traits and DEG Analysis. Cereal Res. Commun. 2025, 53, 855–872. [Google Scholar] [CrossRef] [Scilit]
  88. Yanting, L.; Bingkui, W.; Mengchao, Z.; Jing, Y.; Shenghai, Y. Sensitivity of Genotypically Diverse Rice Varieties to Radiation and the Related Changes to Antioxidant Enzyme Activities. Int. J. Radiat. Biol. 2024, 100, 453–465. [Google Scholar] [CrossRef] [Scilit] [PubMed]
  89. Tavu, L.E.J.; Redillas, M.C.F.R. Oxidative Stress in Rice (Oryza sativa): Mechanisms, Impact, and Adaptive Strategies. Plants 2025, 14, 1463. [Google Scholar] [CrossRef] [Scilit] [PubMed]
  90. Alsalman, A.; Alrifai, S.; Younas, S.; Fathima, S.; Asim, Z.; Aloqayfi, N.; Aldaghmani, I.; Alsahli, A.; Alzahrani, S. Optimizing the Gamma Radiation Dose for Growth Performance of Hassawi Rice (Oryza sativa L.). Cogent Food Agric. 2026, 12, 2653271. [Google Scholar] [CrossRef] [Scilit]
  91. Abdelnour-Esquivel, A.; Perez, J.; Rojas, M.; Vargas, W.; Gatica-Arias, A. Use of Gamma Radiation to Induce Mutations in Rice (Oryza sativa L.) and the Selection of Lines with Tolerance to Salinity and Drought. In Vitr. Cell. Dev. Biol. Plant 2020, 56, 88–97. [Google Scholar] [CrossRef] [Scilit]
  92. Oguz, M.C.; Yildiz, M. Gamma Irradiation-Induced Drought Stress Tolerance in Wheat (Triticum aestivum L.): Physiological and Biochemical Responses. Russ. J. Plant Physiol. 2025, 72, 117. [Google Scholar] [CrossRef] [Scilit]
  93. Al-Sayed, W.M.; El-Shazly, H.H.; El-Nahas, A.I.; Omran, A.A.A. Cytogenetic Impact of Gamma Radiation and Its Effects on Growth, Yield and Drought Tolerance of Maize (Zea mays L.). BMC Plant Biol. 2025, 25, 141. [Google Scholar] [CrossRef] [Scilit] [PubMed]
  94. Sadras, V.O.; Slafer, G.A. Environmental Modulation of Yield Components in Cereals: Heritabilities Reveal a Hierarchy of Phenotypic Plasticities. Field Crop. Res. 2012, 127, 215–224. [Google Scholar] [CrossRef] [Scilit]
  95. Parida, A.K.; Sekhar, S.; Panda, B.B.; Sahu, G.; Shaw, B.P. Effect of Panicle Morphology on Grain Filling and Rice Yield: Genetic Control and Molecular Regulation. Front. Genet. 2022, 13, 876198. [Google Scholar] [CrossRef] [Scilit] [PubMed]
  96. Hossain, M.A.; Mamun, M.A.A.; Al Rabbi, S.M.H.; Joya, S.D.; Rana, M.M.; Rahaman Hera, M.H.; Sharmin, R.; Roy, R.K. Identification of Stable Rice Genotypes Using WAASB and MTSI Indices. Turk. J. Field Crop. 2025, 30, 266–281. [Google Scholar] [CrossRef] [Scilit]
  97. Habib, M.A.; Azam, M.G.; Haque, M.A.; Hassan, L.; Khatun, M.S.; Nayak, S.; Abdullah, H.M.; Ullah, R.; Ali, E.A.; Hossain, N.; et al. Climate-Smart Rice (Oryza sativa L.) Genotypes Identification Using Stability Analysis, Multi-Trait Selection Index, and Genotype-Environment Interaction at Different Irrigation Regimes with Adaptation to Universal Warming. Sci. Rep. 2024, 14, 13836. [Google Scholar] [CrossRef] [Scilit] [PubMed]
  98. Njoroge, W.; Kinyua, M.; Gichuhi, E.; Ankamah-Yeboah, T.; Offei, K.S.; Ofori, K. Radio-Sensitivity of Four Selected Rice (Oryza sativa L.) Varieties in Kenya, as a Pre-Requisite for Mutation Breeding. Afr. J. Plant Sci. 2022, 16, 210–223. [Google Scholar] [CrossRef]
  99. Herdiyanti, F.; Saleh, M.; Pujowati, P.; Sunaryo, W.; Nurhasanah. Effects of Gamma-Ray Irradiation on Agronomic Traits and Determination of the Optimal Mutagenic Dose (LD50) in the Local Rice Cultivar Mayas (Oryza sativa L.). BIO Web Conf. 2025, 206, 02004. [Google Scholar] [CrossRef] [Scilit]
  100. Ratna, M.; Begum, S.; Husna, A.; Dey, S.; Hossain, M. Correlation and Path Coefficients Analyses in Basmati Rice. Bangladesh J. Agric. Res. 2015, 40, 153–161. [Google Scholar] [CrossRef] [Scilit]
  101. Chaturvedi, A.K.; Bahuguna, R.N.; Shah, D.; Pal, M.; Jagadish, S.V.K. High Temperature Stress during Flowering and Grain Filling Offsets Beneficial Impact of Elevated CO2 on Assimilate Partitioning and Sink-Strength in Rice. Sci. Rep. 2017, 7, 8227. [Google Scholar] [CrossRef] [Scilit] [PubMed]
  102. Yang, X.; Wang, X.; Li, Y.; Yang, L.; Hu, L.; Han, Y.; Wang, B. Effects of Drought Stress at the Booting Stage on Leaf Physiological Characteristics and Yield of Rice. Plants 2024, 13, 3464. [Google Scholar] [CrossRef] [Scilit] [PubMed]
  103. Sharma, N.; Saini, D.K.; Pushkar, S.; Somayanda, I.; Jagadish, S.V.K.; Anand, A. Reprogramming Assimilate Partitioning in the Second Half of the Night Supports Grain Filling in Inferior Spikelets under High Night Temperature Stress in Rice. Plant Stress 2025, 15, 100773. [Google Scholar] [CrossRef] [Scilit]
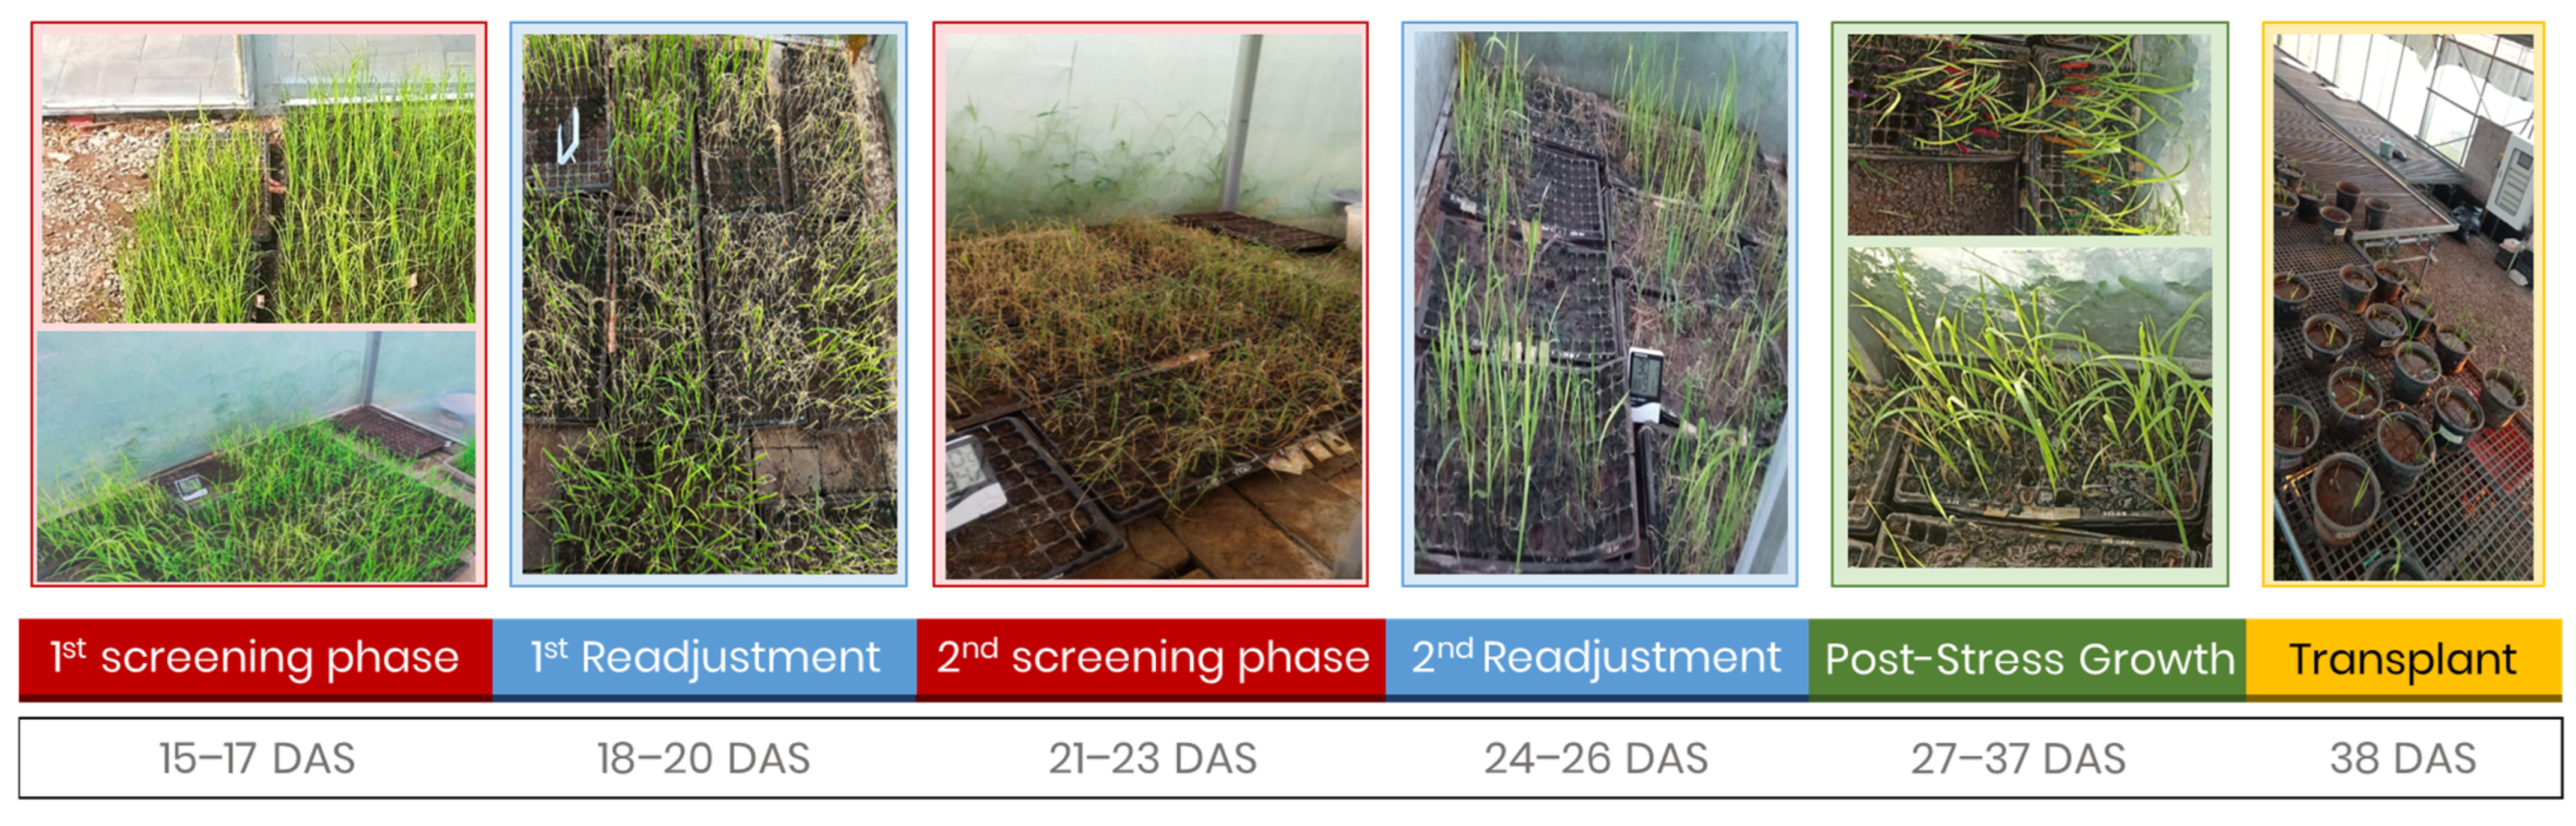
Figure 1. Experimental timeline of multi-stress imposition on rice mutants under a controlled heat chamber.
Crops 06 00073 g001
Figure 2. Dynamics of the fraction of transpirable soil water during screening phases 1 and 2.
Crops 06 00073 g002
Figure 3. Spearman correlation analysis of observed characters in rice mutants under drought-heat stress. Note: PH, plant height; NTT, number of total tillers; DoF, day of flowering; DoM, day of maturity; FLL, flag leaf length; FLW, flag leaf width; NP, number of panicles; PL, panicle length; WPP, weight per panicle; W1000G, weight 1000 grain; NTG, number of total grains; NFG, number of filled grains; NEG, number of empty grains; PFG, percentage of filled grains; PEG, percentage of empty grains; LDS, leaf drying score; LRS, leaf rolling score; Htol, heat tolerance; PF, spikelet fertility; WPC, weight per clump. Values with white font indicate a correlation coefficient < 0.15; values with black font indicate a correlation coefficient > 0.15. * indicates significance at the 0.05 probability level, whereas ** indicates significance at the 0.01 probability level.
Crops 06 00073 g003
Figure 4. 3D visualization of genotype tolerance categorical performance based on WASB components and tolerance score under drought-heat stress.
Crops 06 00073 g004
Figure 5. 2D visualization of genotype tolerance categorical performance based on WASB components and tolerance score under drought-heat stress. Note: TScore and WASB-PC 1 components (A), TScore and WASB-PC 2 components (B). Tolerant, moderately tolerant, and susceptible genotypes are represented by circles (○), diamonds (◇), and squares (□), respectively. Genotypes are color-coded according to irradiation treatment: wild type (green), 200 Gy (orange), and 400 Gy (red).
Crops 06 00073 g005
Figure 6. Comparison of seedling response among M2 rice mutant population under combined drought-heat stress.
Crops 06 00073 g006
Figure 7. Reproductive performance of M2 rice mutants and wild type exhibiting contrasting spikelet fertility following seedling-stage combined drought-heat stress.
Crops 06 00073 g007
Table 1. Seedling survival of mutant rice M2 under drought-heat stress.
GroupEarly Seedling PopulationSurviveSurvival (%)MortalityMortality (%)
M2 0 (Wild Type)28.006.0021.4322.0078.57
M2 200 (15)91.0018.0019.7873.0080.22
M2 200 (6)91.0017.0018.6874.0081.32
M2 400 (3)91.006.006.5985.0093.41
M2 400 (5)91.006.006.5985.0093.41
IR2928.000.000.0028.00100.00
Total420.0053.0012.62367.0087.38
Table 2. Tolerance scores of mutant rice M2 under drought-heat stress.
ScoringEvaluation
Criteria
Tolerance ScoreCategoryM2 0M2 200M2 400
LDSNo leaves are drying0 Highly tolerant000
The tip of the leaf is slightly drying1 Tolerant252
Leaves dry up to 1/4 of each leaf3 Slightly tolerant187
1/4–1/2 portion drying on all leaves5 Moderate2142
More than 2/3 of all dried leaves7 Slightly susceptible181
All parts of the leaf have dried out9 Susceptible000
LRSThere are no curled leaves0 Highly tolerant000
The leaf begins to curl1 Tolerant3118
Leaves curling to form a V shape3 Slightly tolerant182
Leaves curl forming the letter U5 Moderate181
The leaf curls to form the number 0, with the tip and base of the leaf touching each other7 Slightly susceptible181
The leaf is fully curled up9 Susceptible000
HTolNormal growth, slight curling at the leaf tips1 Highly tolerant2114
Almost all the leaves are curling, turning yellow, and the number of leaves is decreasing2 Moderately tolerant3166
All the leaves have dried up, and some have undergone necrosis3 Susceptible182
All the plants are dying or dead4 Highly susceptible000
SF>80% Spikelet Fertility1 Tolerant3137
61–80% Spikelet Fertility3Slightly tolerant2143
41–60% Spikelet Fertility5 Moderate181
20–39% Spikelet Fertility7 Slightly susceptible001
0–19% Spikelet Fertility9 Susceptible000
LDS: leaf drying score, LRS: leaf rolling score, HTol: heat tolerance, SF: Spikelet fertility.
Table 3. Path coefficient analysis of direct, indirect, and residual effects of agronomic traits on weight per clump in the rice mutant M2 population under combined drought-heat stress.
CharacterDirect
Effect
Individual EffectIndirect
Effect
Residual
PHNTTFLWWPPPLW1000GNTGNFG
PH (cm)0.270.270.040.020.030.180.020.04−0.050.560.42
NTT (tiller)0.220.050.220.010.000.040.010.02−0.020.32
FLW (cm)0.080.080.020.080.010.130.010.02−0.030.32
WPP (g)0.070.12−0.010.010.070.240.030.06−0.060.45
PL (cm)0.470.100.020.020.040.470.040.07−0.130.63
W1000G (g)0.060.080.020.020.030.330.060.05−0.090.50
NTG (grain)0.090.130.040.020.040.360.030.09−0.110.60
NFG (grain)−0.140.090.030.020.030.450.040.08−0.140.60
Note: PH: plant height; NTT: number of total tillers; FLW: flag leaf width; WPP: weight per panicle; PL: panicle length; W1000G: weight 1000 grain; NTG: number of total grain; NFG: number of filled grain.
Table 4. Principal component loadings and explained variance of selected characters influencing weight per clump in rice M2 mutants under combined drought-heat stress.
VariablePC1PC2PC3PC4PC5
PH0.670.360.310.33−0.31
NTT0.230.75−0.550.090.26
FLW0.410.40.66−0.380.27
WPP0.92−0.19−0.08−0.23−0.05
PL0.55−0.290.180.650.37
W1000G0.74−0.21−0.16−0.220.29
NTG0.86−0.11−0.10.11−0.09
NFG0.88−0.24−0.16−0.25−0.08
WPC0.830.25−0.040.06−0.23
Eigenvalue4.561.140.930.860.52
Proportion50.6812.710.389.585.8
Cumulative50.6863.3773.7583.3389.13
Note: Orange-colored and bolded values indicate the highest loading for each PC. PH: plant height; NTT: number of total tillers; FLW: flag leaf width; WPP: weight per panicle; PL: panicle length; W1000G: weight of 1000 grains; NTG: number of total grains; NFG: number of filled grains.
Table 5. Rice Mutant M2 Genotypes TScore, PCA, and WASB Values under Drought-Heat Stress.
GenotypeGenotype CodeTScorePC1PC2WASB PC1WASB PC2
M2 0 (10) 04G10.000.42−1.690.330.34
M2 0 (10) 10G20.461.47−0.231.170.05
M2 0 (10) 11G30.00−0.361.020.280.21
M2 0 (10) 18G40.13−2.13−0.051.700.01
M2 0 (10) 22G50.38−3.220.122.570.03
M2 0 (10) 24G60.75−1.950.491.560.10
M2 200 (15) 09G70.751.570.061.250.01
M2 200 (15) 10G80.381.001.460.800.29
M2 200 (15) 12G90.751.762.131.410.43
M2 200 (15) 17G100.462.04−1.341.630.27
M2 200 (15) 18G110.214.370.293.490.06
M2 200 (15) 19G120.211.28−1.741.020.35
M2 200 (15) 20G130.385.631.684.500.34
M2 200 (15) 22G140.380.01−0.860.010.17
M2 200 (15) 23G150.380.380.900.300.18
M2 200 (15) 26G160.75−2.640.052.110.01
M2 200 (15) 27G170.75−1.85−1.121.480.22
M2 200 (15) 28G180.462.00−1.021.600.20
M2 200 (15) 29G190.753.470.832.770.17
M2 200 (15) 30G200.462.450.601.960.12
M2 200 (15) 31G210.461.56−0.621.250.12
M2 200 (15) 33G220.380.093.070.070.62
M2 200 (15) 36G230.000.311.450.250.29
M2 200 (15) 39G240.381.31−1.001.050.20
M2 200 (6) 04G250.001.04−1.870.830.38
M2 200 (6) 13G260.000.80−0.970.640.20
M2 200 (6) 22G270.081.72−0.881.370.18
M2 200 (6) 23G280.001.720.011.380.00
M2 200 (6) 24G290.460.860.070.690.01
M2 200 (6) 25G300.460.020.630.010.13
M2 200 (6) 30G310.46−1.23−0.550.990.11
M2 200 (6) 32G320.08−0.770.050.620.01
M2 200 (6) 38G330.75−2.780.932.220.19
M2 200 (6) 39G340.750.05−0.920.040.18
M2 200 (6) 40G350.75−3.191.192.550.24
M2 200 (6) 41G360.08−4.46−0.723.560.15
M2 200 (6) 43G370.08−2.340.091.870.02
M2 200 (6) 44G380.080.46−0.150.370.03
M2 200 (6) 45G390.001.34−0.621.070.12
M2 200 (6) 47G400.08−0.80−1.390.640.28
M2 200 (6) 49G410.46−1.64−1.371.310.27
M2 400 (3) 01G420.130.83−0.910.660.18
M2 400 (3) 06G430.21−2.160.021.730.00
M2 400 (3) 15G440.83−2.47−0.411.980.08
M2 400 (3) 23G450.131.260.111.010.02
M2 400 (3) 25G460.082.10−0.361.680.07
M2 400 (3) 30G470.002.240.821.790.16
M2 400 (5) 08G480.08−3.081.782.460.36
M2 400 (5) 12G490.13−4.750.033.800.01
M2 400 (5) 13G500.58−2.201.981.760.40
M2 400 (5) 14G510.38−0.140.250.110.05
M2 400 (5) 16G520.290.10−0.170.080.03
M2 400 (5) 29G530.00−1.47−1.161.180.23
Note = Genotype is formatted as M2 X (Y) Z, where X denotes the gamma irradiation intensity, Y specifies the screening population group, and Z represents the individual genotype number within each group.
Table 6. Physiological and molecular mechanisms underlying rice response to combined drought and heat stress reported in recent studies.
Plant
Response
Hypothesized MechanismCandidate Genes, PathwaysSupporting
Reference
Maintained leaf greennessDelayed chlorophyll degradation and sustained photosynthesisOsSGR, NYC1, chlorophyll metabolism genes[62,63,64,65]
Reduced leaf rollingImproved leaf water status through osmotic adjustment and ABA-mediated stomatal regulationOsDREB2A, OsbZIP23, SNAC1, ABA signaling[66,67,68,69]
Reduced leaf desiccationEnhanced ROS scavenging and membrane stabilityOsAPX2, CAT, SOD, OsHSPs[70,71,72]
Seedling survivalGreater cellular protection and stress-responsive signalingOsHsfA2e, HSP70, HSP101, LEA proteins[73,74,75,76]
Higher spikelet fertilityMaintenance of pollen viability, assimilate transport and reproductive developmentOsHTAS, TT1, sucrose transport genes[77,78,79]
Disclaimer/Publisher’s Note: The statements, opinions and data contained in all publications are solely those of the individual author(s) and contributor(s) and not of MDPI and/or the editor(s). MDPI and/or the editor(s) disclaim responsibility for any injury to people or property resulting from any ideas, methods, instructions or products referred to in the content.