Article

Ultrafine Bubble Irrigation Enhances Early Growth and Antioxidant Activity of Rice Seedlings Under Nutrient-Free Conditions


1
Graduate School of Science and Engineering, Saitama University, 255 Shimo-Okubo, Sakura-ku, Saitama 338-8570, Japan
2
Maruyama Mfg. Co., Inc., Tokyo 101-0047, Japan
*
Author to whom correspondence should be addressed.
Crops 2026, 6(2), 29; https://doi.org/10.3390/crops6020029
Submission received: 8 January 2026 / Revised: 12 February 2026 / Accepted: 2 March 2026 / Published: 4 March 2026

Abstract

Ultrafine bubble (UFB)-enriched water promotes plant growth when nutrients are present. A key question is whether it can still encourage growth in the absence of nutrients. Therefore, this study examines how different UFB concentrations affect the early growth and development of rice seedlings under nutrient-free conditions where external nutritional application was excluded. The results showed that the examined morphological and physicochemical parameters were directly affected by the bubble concentration in the irrigation water. Higher bubble concentrations resulted in a significant increase in the fresh and dry weights of roots, primary and secondary root lengths, and specific root length. Similarly, higher bubble concentrations were also associated with greater shoot height, fresh weight, and dry weight. However, pigment concentrations were not clearly affected, except for anthocyanin. Hydrogen peroxide concentration increased proportionally with bubble concentration. Among the antioxidant enzymes assessed, peroxidase activity increased significantly with bubble concentration, whereas the other antioxidant enzymes showed no significant variation. Moreover, UFB irrigation significantly affected carbon metabolism, increasing soluble sugar content while reducing storage starch levels. In conclusion, the findings suggest that UFB-enriched irrigation can promote plant growth under nutrient-free external conditions by modulating stress-related molecules, activating antioxidant enzymes, and altering carbon metabolism.

1. Introduction

The use of nanobubble-based crop production techniques has become more prominent globally in recent decades due to their multiple agronomic advantages [1]. In particular, nanobubbles (NBs) in agriculture have emerged as a promising tool to address several crop production constraints. NBs, also known as ultrafine bubbles (UFBs), are gas bubbles that are less than 1 µm in diameter [2]. These bubbles’ special qualities, such as increased zeta potential, enhanced adsorption, increased solubility, hydrophobic interaction, and synthesis of reactive oxygen species (ROS), have enabled wider use of UFBs in various agricultural and environmental applications [3].
The recent literature provides evidence for diverse applications of UFBs beyond the agricultural applications. For instance, ref. [4] reported that UFBs and NBs are widely explored across diverse fields, including biomedicine, biology, chemistry, decontamination, materials science, food technology, and energy. In agriculture, most experiments have focused on improving yield both quantitatively and qualitatively [5,6,7]. In addition, several studies have focused on morphological and genetic changes in crops after application of UFBs [8,9], crop protection from biotic factors such as pests [10], and germination improvement with nanobubble treatment [11,12,13]. Furthermore, scientists have researched the possibility of improving the micro-environment of the growing media by enhancing microbial activities in the rhizosphere, even under unsuitable ecological conditions [14,15]. These studies have been conducted targeting different growth stages of crops, including the germination stage.
Although UFB research has been conducted to examine the bubble impact on growth performances, there is limited research on how bubble concentration affects the phenological and physicochemical characteristics of plants under nutrient-limited or nutrient-free external conditions. Root and shoot morphological changes in plants may be driven by changes in plant growth hormones (e.g., gibberellic acid (GA3) and auxins) or by ROS-mediated cellular processes, as suggested by previous studies. Our previous study showed that 100% UFB water irrigation enhanced cellular elongation in different areas of the primary root, thus ultimately enhancing the primary root length and dry weights compared to non-UFB treatment [9]. However, apart from the primary root, lateral root growth performances as well as other root and shoot parameter variations with respect to bubble concentration have not been investigated.
In this context, the present study was designed to clarify the intrinsic role of UFBs in regulating initial crop growth responses under externally nutrient-deficient conditions, where fertilizer effects are deliberately excluded. Specifically, we aimed to determine how different UFB concentrations influence early root and shoot development, photosynthetic pigments, stress-related molecules, antioxidant enzyme activities, and carbon metabolism in rice seedlings. However, seedling growth under these conditions is supported by internal seed reserves, allowing for assessment of physiological responses in the absence of external nutrient inputs. Hence, the primary objective of the study was not to demonstrate crop production without fertilizers, but rather to isolate and understand how UFBs influence early root and shoot development, photosynthetic pigments, stress molecules, antioxidant enzyme activity, and carbon metabolism during the seedling stage. By using an external nutrient-absence system as a controlled baseline, this study enables a clearer evaluation of UFBs as physiological growth-stimulating agents independent of nutrient availability. The findings will provide mechanistic insight into the potential of UFB technology to enhance early seedling vigor, which might be important as a foundation for future studies integrating UFBs with conventional nutrient management strategies under practical agricultural conditions.

2. Materials and Methods

2.1. Treatments and Experimental Design

The research was conducted using japonica rice (Oryza sativa; variety “Koshihikari”) seedlings. After being sterilized for five minutes with 10% sodium hypochlorite (NaClO; FUJIFILM Wako Pure Chemical Cooperation, Osaka, Japan), homogenously sized rice seeds were thoroughly rinsed with water three times. Before being put in seed plates, the seeds were soaked in tap water at 25 °C for a whole day in the dark. Each plastic seed plate held twenty soaking seeds before being set into a 10 cm × 10 cm × 10 cm acrylic box. UFB water, generated using a pressurized cavitation-based ultrafine bubble generator, was used for the treatments. The study included five treatments, including UFB produced from Milli-Q (100% UFB-MQ) water (T1), 75% UFB-MQ + 25% MQ (T2), 50% UFB-MQ + 50% MQ (T3), 25% UFB-MQ + 75% MQ water (T4), and 100% Milli-Q water (T5). The treatments T2, T3, and T4 were prepared with proportionate mixing of UFB-MQ and MQ water. In this regard, to reduce the impact of other elements on UFB water, MQ water was used as the raw material. The Milli-Q system (Millipore, Bedford, MS, USA) was used to produce the MQ water. The research was conducted using different acrylic boxes. The research was designed using a completely randomized design (CRD) with three replicates. The corresponding solution (800 mL) was added to each hydroponic container, which was then placed in a growth room with carefully monitored environmental conditions. No mineral nutrients were added to the growth solution throughout the experiment; therefore, seedling growth relied on endogenous seed reserves while external nutrient availability was excluded.

2.2. Measuring Environmental Parameters

During the study period, the temperature, relative humidity, and light intensity were recorded inside the growth chamber. In this regard, temperature and relative humidity were measured daily using an ESPEC temperature and humidity sensor. Using a light meter (Apogee MQ-200, Logan, UT, USA), the photosynthetic active radiation (PAR) was determined. The mean daytime and nighttime temperatures were 29.0 ± 1.2 °C and 28.5 ± 1.1 °C. The relative humidity ranged between 60.6 and 49.4%. The photosynthetic photon flux density was maintained at 449.4 ± 9.1 μmol m−2 s−1 with a photoperiod of 14 h light and 10 h dark.

2.3. Preparation of UFB Water and Analysis of Bubble Characteristics

A nanobubble generator (UP0290M-1; 1.4 L min−1, 2 MPa, 250 W; Maruyama, Tokyo, Japan) was used to produce UFB water. The nanobubble size and concentration were determined using nanoparticle tracking analysis (NTA) with NanoSight NS300 (Malvern Instruments, Malvern, UK) at 25 °C. The system tracks the Brownian motion of individual particles and calculates the hydrodynamic diameter based on the Stokes–Einstein equation, assuming spherical particles. UFBs generated in this study consisted of air, as no specific gas injection (e.g., pure oxygen) was applied during UFB generation. The particle size and zeta potential analyzer ELSZ-2000 (Otsuka Electronics, Hirakata, Japan) was used to measure the zeta potential. HQ30d (Hach Company, Loveland, CO, USA) was used to measure the temperature and dissolved oxygen (DO) level of water. The pH of the water was measured by using a pH meter (Mettler Toledo, Greifensee, Switzerland). Throughout the experiment, a rather constant bubble concentration was maintained by changing the growing media daily.

2.4. Assessment of Rice Root Phenotype

The rice plants were carefully uprooted 14 days after the soaking period without causing any damage to the root system. After carefully separating the rice seedlings’ shoots and root sections, the root parts were put on a clear glass plate [16]. Plant images were taken at a similar height using an EOS KissX9i camera (Canon, Tokyo, Japan). ImageJ (version 1.53a) was used to determine maximum primary root length, average crown root length, number of crown roots, and total root length. The total number of roots was manually counted to determine the overall number of roots. Fresh root weight was measured by using an analytical balance (Mettler Toledo PG503-S, Tokyo, Japan, with an accuracy of ±0.01 mg). Following 72 h of oven drying at 80 °C, the dry weight of the roots was determined and weighed using an analytical balance (Mettler Toledo PG503-S, Greifensee, Switzerland, with an accuracy of ±0.001 mg). The specific root length (SRL) was calculated according to [17], dividing the length or volume of a root by its dry weight.

2.5. Evaluation of Rice Shoot Phenotype

Several shoot parameters were checked for the study. Shoot height was measured by using ImageJ (Version number: 1.53a) software. Shoot fresh and dry weights were measured by following the same procedure explained under root measurements. The plant dry matter % (DM) was determined by measuring fresh weight (FW) and dry weight (DW) and expressing it as a percentage, which is mentioned in [18].

2.6. Pigment Quantification

N,N-dimethylformamide was used to extract the photosynthetic pigments, including chlorophyll a, chlorophyll b, and carotenoids. In order to extract these pigments, a 150 mg sample was taken from the shoot and incubated with 5 mL of N,N-dimethylformamide for 24 h at room temperature in the dark. A spectrophotometer (UV-1280, Shimadzu, Kyoto, Japan) was then used to quantify the optical absorptions at wavelengths of 664, 647, and 480 nm. Using the formula given by [19], the concentrations of chlorophyll a, chlorophyll b, and carotenoids were determined. The values were given as micrograms per milligram of fresh weight (µg g−1 FW) for each pigment.
The following formulas were used to determine the contents of chlorophyll a, chlorophyll b, and carotenoids:
Chlorophyll a (µg g−1 FW) = 11.65 × A664− 2.69 ×A647/Fresh sample weight
Chlorophyll b (µg g−1 FW) = 20.81 × A647 − 4.53 × A664/Fresh sample weight
Carotenoids (µg g−1 FW) = (1000 × A480 − 0.89 × Ca − 52.02 × Cb)/245
The anthocyanin content was also determined using a spectrophotometer with slight modifications, as detailed in [20]. Approximately 50 mg of leaf samples was crushed in liquid nitrogen and combined with 2 mL of extraction buffer, which consisted of 5% (v/v) acetic acid and 45% (v/v) methanol in distilled water. The supernatant was collected following centrifugation (3500 rpm for 15 min at 20 °C). The optical absorbance was measured at a wavelength of 530 nm. The Beer–Lambert law was used to measure the anthocyanin concentration.

2.7. Hydrogen Peroxide and Antioxidant Enzymes

H2O2 and antioxidant enzymes, such as ascorbate peroxidase (APX), catalase (CAT), and peroxidase (POD), were measured using a spectrophotometer (UV-1280, Shimadzu, Kyoto, Japan) analysis. For this analysis, nearly 100 mg of the sample was crushed in liquid nitrogen while polyvinylpyrrolidone was added. The crushed plant samples were used for extraction using 5 mL of 0.05 M phosphate buffer (pH 6.0). The extraction mixture was centrifuged for 10 min at 4 °C at 3500 rpm. Before analysis, the supernatant was gathered and kept at −80 °C [21].
The H2O2 was determined by mixing 750 µL of the supernatant with 2.5 mL of 0.1% (w/v) titanium sulfate in 20% (v/v) sulfuric acid [22]. After that, the assay mixture was incubated at room temperature (26.5 ± 0.23 °C) for 30 min. At 410 nm, the absorbance measurements in the assay mixture were then obtained. By comparing absorbance readings with the H2O2 standard curve, the H2O2 concentration in the samples was determined. The findings were reported on a fresh weight basis in µmol mg−1.
Peroxidase activity was determined by combining 100 µL of extract supernatant with 40 µL of 30 mM H2O2 and 50 µL of 25 mM guaiacol, following the method outlined by [23]. The absorbance data were recorded at 420 nm every 10 s for 3 min. The peroxidase concentration was determined by taking enhanced absorbance data. Final values were represented as µmol min−1g−1 FW using the extinction coefficient of 26.6 mmol−1cm−1.
Catalase activity was determined by reacting 100 µL of 10 mM H2O2, 2 mL of 100 mM potassium phosphate buffer (pH 7.0), and 500 µL of extract supernatant [24]. The absorbance at 240 nm was noted every 10 s for 3 min. The rate of absorbance decline was used to calculate CAT activity. The extinction coefficient was 40 mmol−1cm−1. CAT activity was denoted as µmolmin−1g−1 FW.
Ascorbate peroxidase was calculated using the procedure described by [25]. There was 100 µL of extract supernatant in the reaction mixture, including 200 µL of 0.5 mM ascorbic acid in 50 mM potassium phosphate buffer, and 2 mL of 50 mM potassium phosphate buffer (pH 7.0). To begin the test, 60 mL of 1 mM H2O2 was added. An extinction coefficient of 2.8 mmol−1cm−1 was used. The absorbance at 290 nm was recorded every 10 s for 3 min. APX activity expressed in µmol min−1g−1 FW according to the absorbance reduction rate.

2.8. Soluble Sugar

The extraction procedure for soluble sugar determination was carried out following the method defined by [26] with slight modifications. A 50 mg portion of finely ground dry tissue was used, and 100% acetone was applied to remove pigments from the sample. Soluble sugars were subsequently extracted using 5 mL aliquots of 80% ethanol. The phenol–sulfuric acid method was used to measure the amount of sugar as outlined by [27], with slight modifications relevant to the experimental conditions. The absorbance at 490 nm was recorded.

2.9. Starch

The residue derived from glucose analysis was subjected to acid hydrolysis according to the procedure described by [28]. Herein, 5 mL of 1.1% v/v HCl solution was added to the residue and heated in a water bath at 100 °C for 30 min. In this regard, the starch is hydrolyzed to glucose. Glucose in the hydrolyzed extract can be determined colorimetrically using anthrone reagents. The solution was diluted to 10 mL with deionized water. A total of 1 g of anthrone was dissolved in 500 mL of 72% (v/v) sulfuric acid to prepare the anthrone reagent. The prepared regent was cooled to an ice-cold temperature before use. Glass tubes filled with 5 mL of anthrone solution and 1 mL of the extract were mixed well. The solution was heated in boiling water (for nearly 11 min). The concentration of starch was determined at a 620 nm wavelength with a spectrophotometer using starch as the standard.

2.10. Statistical Analysis

The “SAS® OnDemand for Academics” program (SAS version 9.4, SAS Institute Inc., Cary, NC, USA) was used to conduct the statistical analysis. Differences among treatments were assessed using one-way ANOVA (Analysis of Variance), and treatment means were compared at the 0.05 significance level using Duncan’s multiple range test (DMRT). The treatment means were compared at the 0.05 confidence level using Duncan’s multiple range test (DMRT). Student’s t-test was used to compare the UFB concentration and bubble size. In addition, a correlation analysis between the parameters was performed using R (v.4.5.1) software. The visual illustrations were created using Microsoft Excel 2010.

3. Results

3.1. UFB Parameters

The particle concentration and mean diameter were 5.86 × 10⁷ mL−1 and 167.2 nm, respectively, in UFB water. Simultaneously, the particle concentration in MQ water (non-UFB) was 2.32 × 10⁷ mL−1, and the mean bubble diameter was 182.1 nm. This clearly illustrates the significant enhancement of the bubble number, approximately by 3.54 × 10⁷ mL−1, after the cavitation process. However, the average particle size did not alter significantly (Table 1). Thus, Milli-Q water is not completely free of nanoscale bubbles, as residual dissolved gases and handling-induced cavitation generate background nanobubbles. Similar baseline particle concentrations in control water have been reported in previous nanobubble studies using ultrapure water.

3.2. Physicochemical Properties of the Water Parameters

Table 2 shows several physicochemical properties of the irrigation solutions. Dissolved oxygen and zeta potential varied notably among treatments, whereas temperature and pH remained relatively stable. Among the treatments, T1 (100% UFB water) recorded the highest DO concentration (7.9 ± 0.0 mgL−1), which was 6.8% higher than the control (7.4 ± 0.0 mgL−1). As the UFB water proportion decreased, the DO gradually reduced as well. When the UFB concentration decreased, the zeta potential significantly decreased in magnitude, suggesting that the control treatment’s surface charge stability was compromised. Water temperature remained relatively consistent across treatments, ranging between 26.4 and 27.1 °C, suggesting that UFBs had a slight effect on thermal conditions. Similarly, the pH levels, which ranged from 7.1 to 7.2, remained constant across treatments. Overall, these findings demonstrate that UFB water considerably boosts the availability of dissolved oxygen and fortifies negative zeta potential, both of which may lead to better water quality.

3.3. Effect of UFBs on Root Phenotype

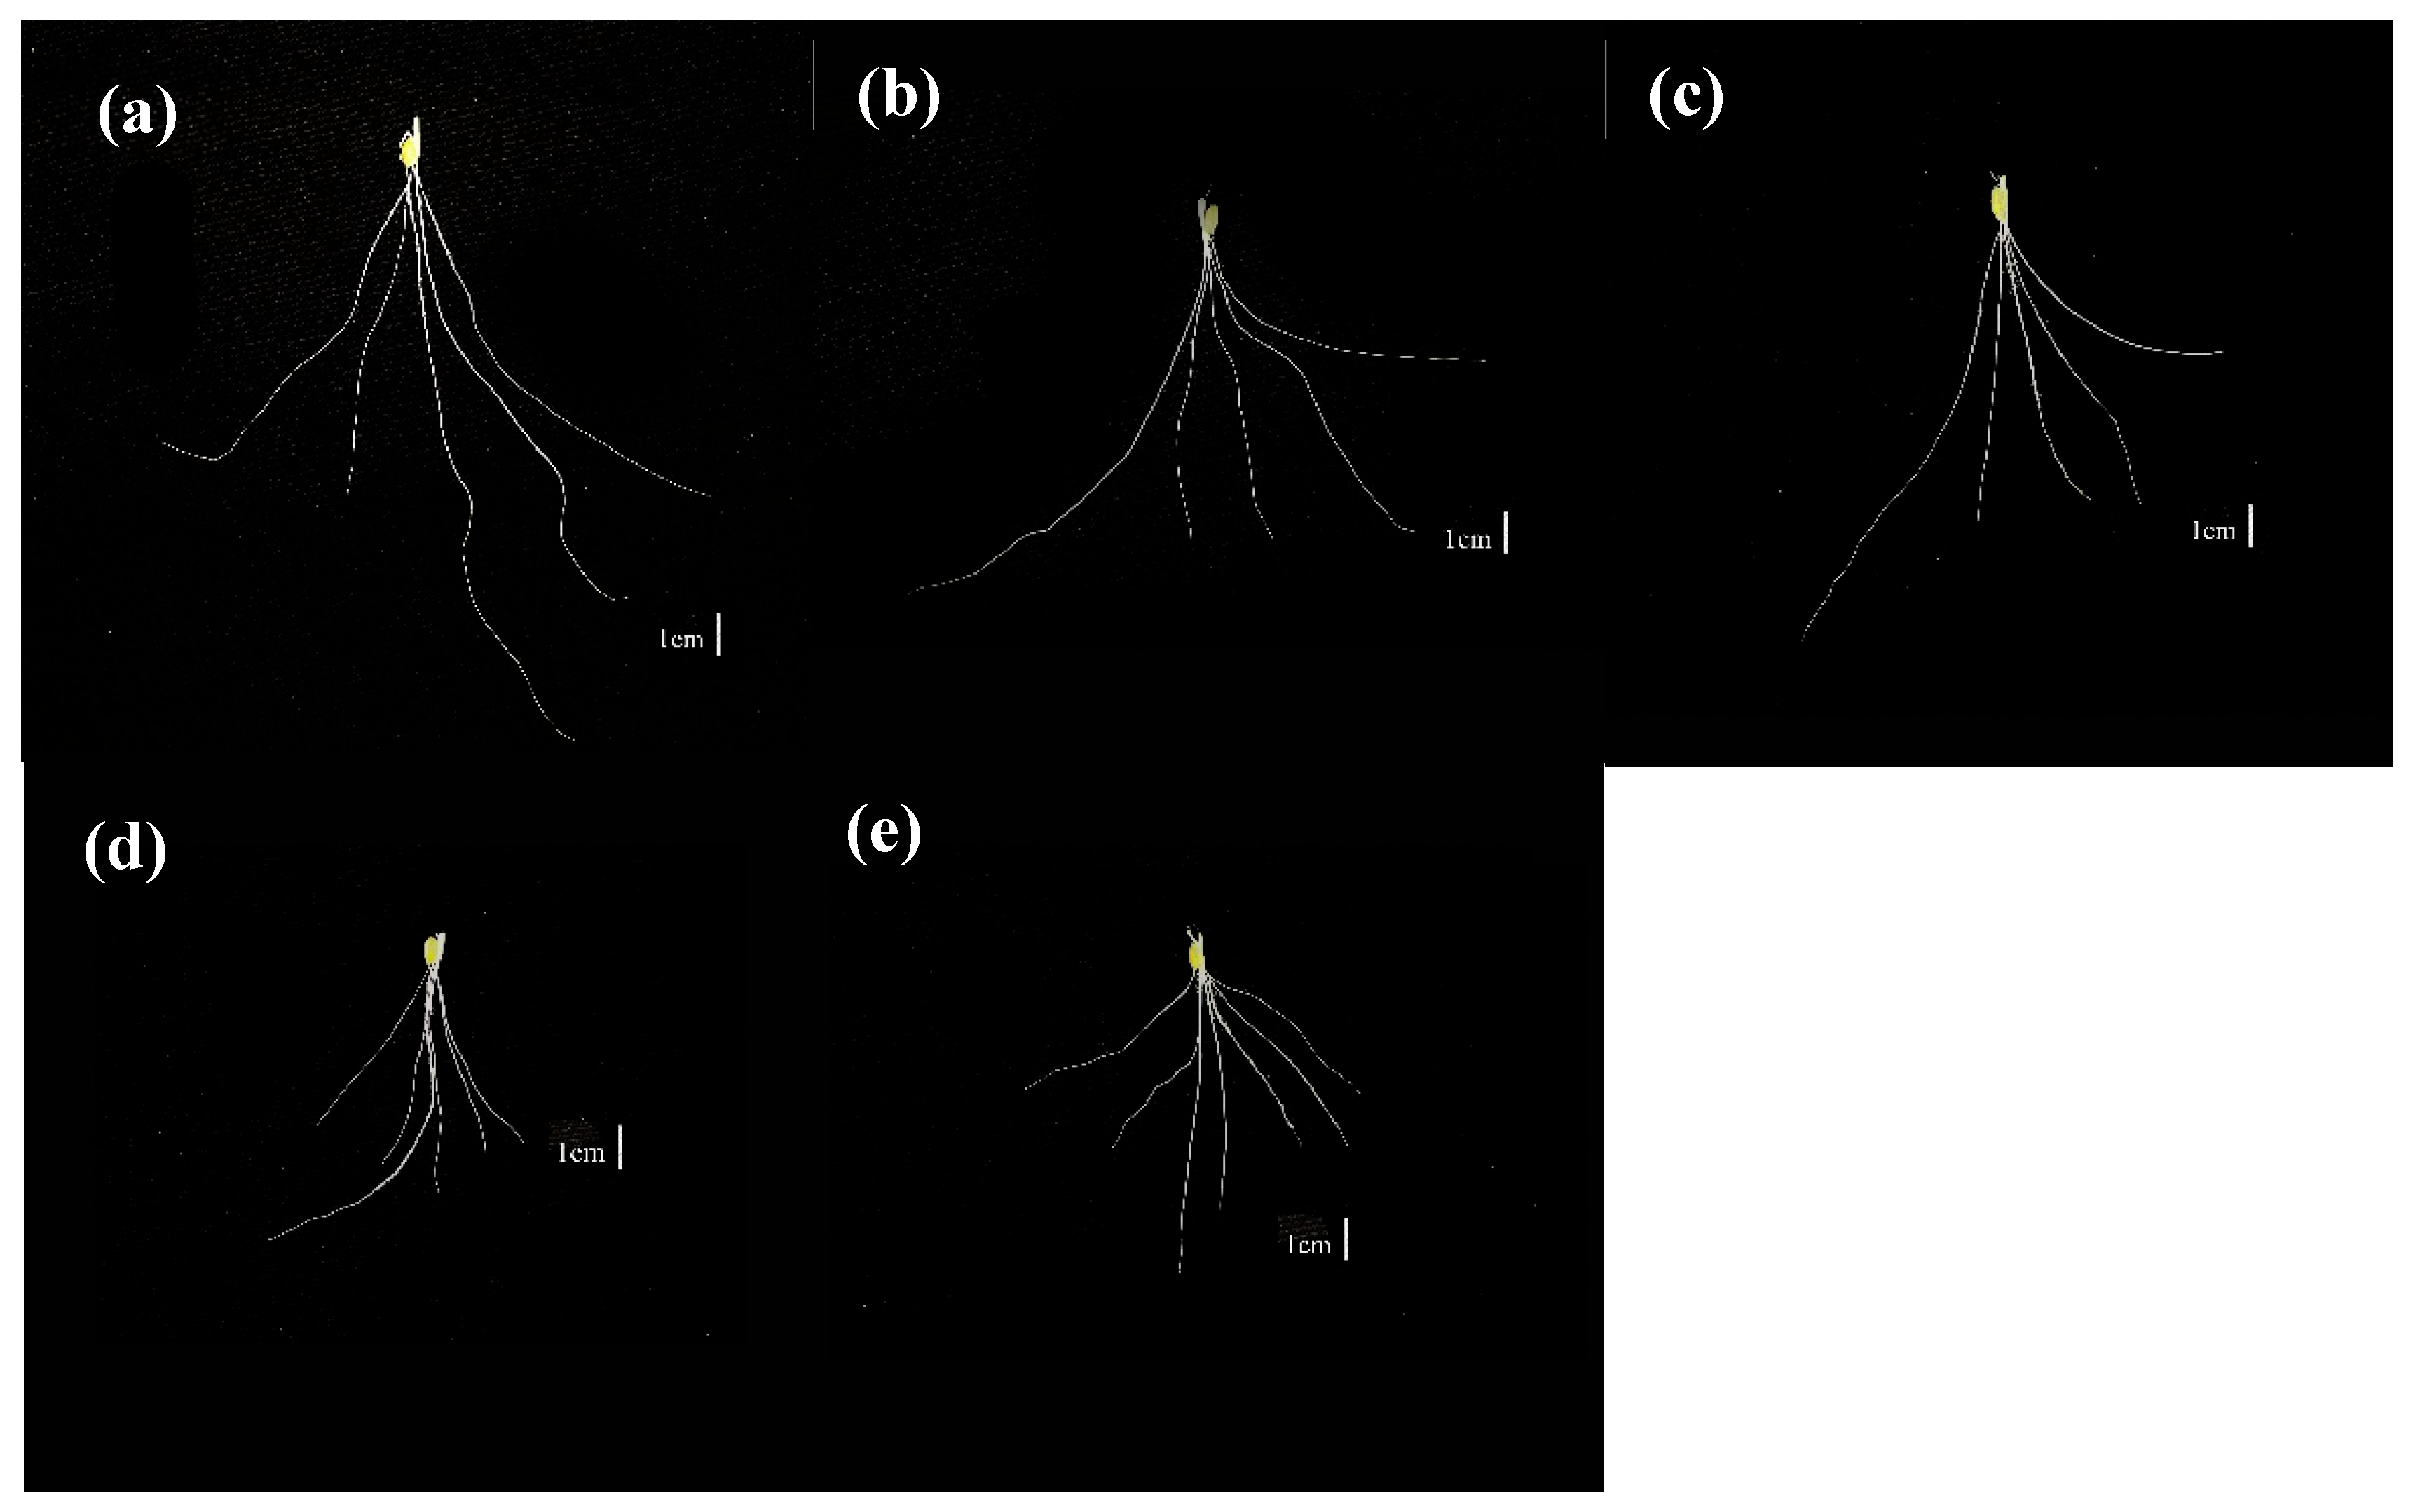
Table 3 shows that rice root traits varied significantly (p < 0.05) among the different UFB concentrations. Among the treatments, T1 (100% UFB water) consistently performed better than the other treatments in the majority of root parameters. In this regard, the average lateral root length in T1 (10.2 cm) was 106.4% longer than in T5 (4.9 cm), and the longest primary root length was significantly longer in T1 (14.2 cm) compared to T5 (7.5 cm), indicating an 88.3% increase (Figure 1). Similarly, T1 had the longest total root length (630.4 cm), while T5 had the shortest (341.2 cm). However, other treatments showed intermediate responses for these parameters. Interestingly, T5 (5.9) had the most lateral roots, surpassing T1 (4.2) by 41.7%. This suggests that lower UFB concentrations may induce greater root branching, potentially as a stress adaptation. In addition, under T1 (32.5 cm g−1), specific root length was significantly increased, demonstrating a 48.7% improvement over T5 (21.8 cm g−1). Additionally, T1 had the highest root fresh weight (0.07 g) and dry weight (0.012 g), increasing by 40% and 33.3%, respectively, in comparison to T5 (0.05 g and 0.009 g). Thus, these findings indicate that UFB water considerably promotes root development while bubble concentration directly affects root phenotypic changes.

3.4. Effect of UFBs on Shoot Phenotype

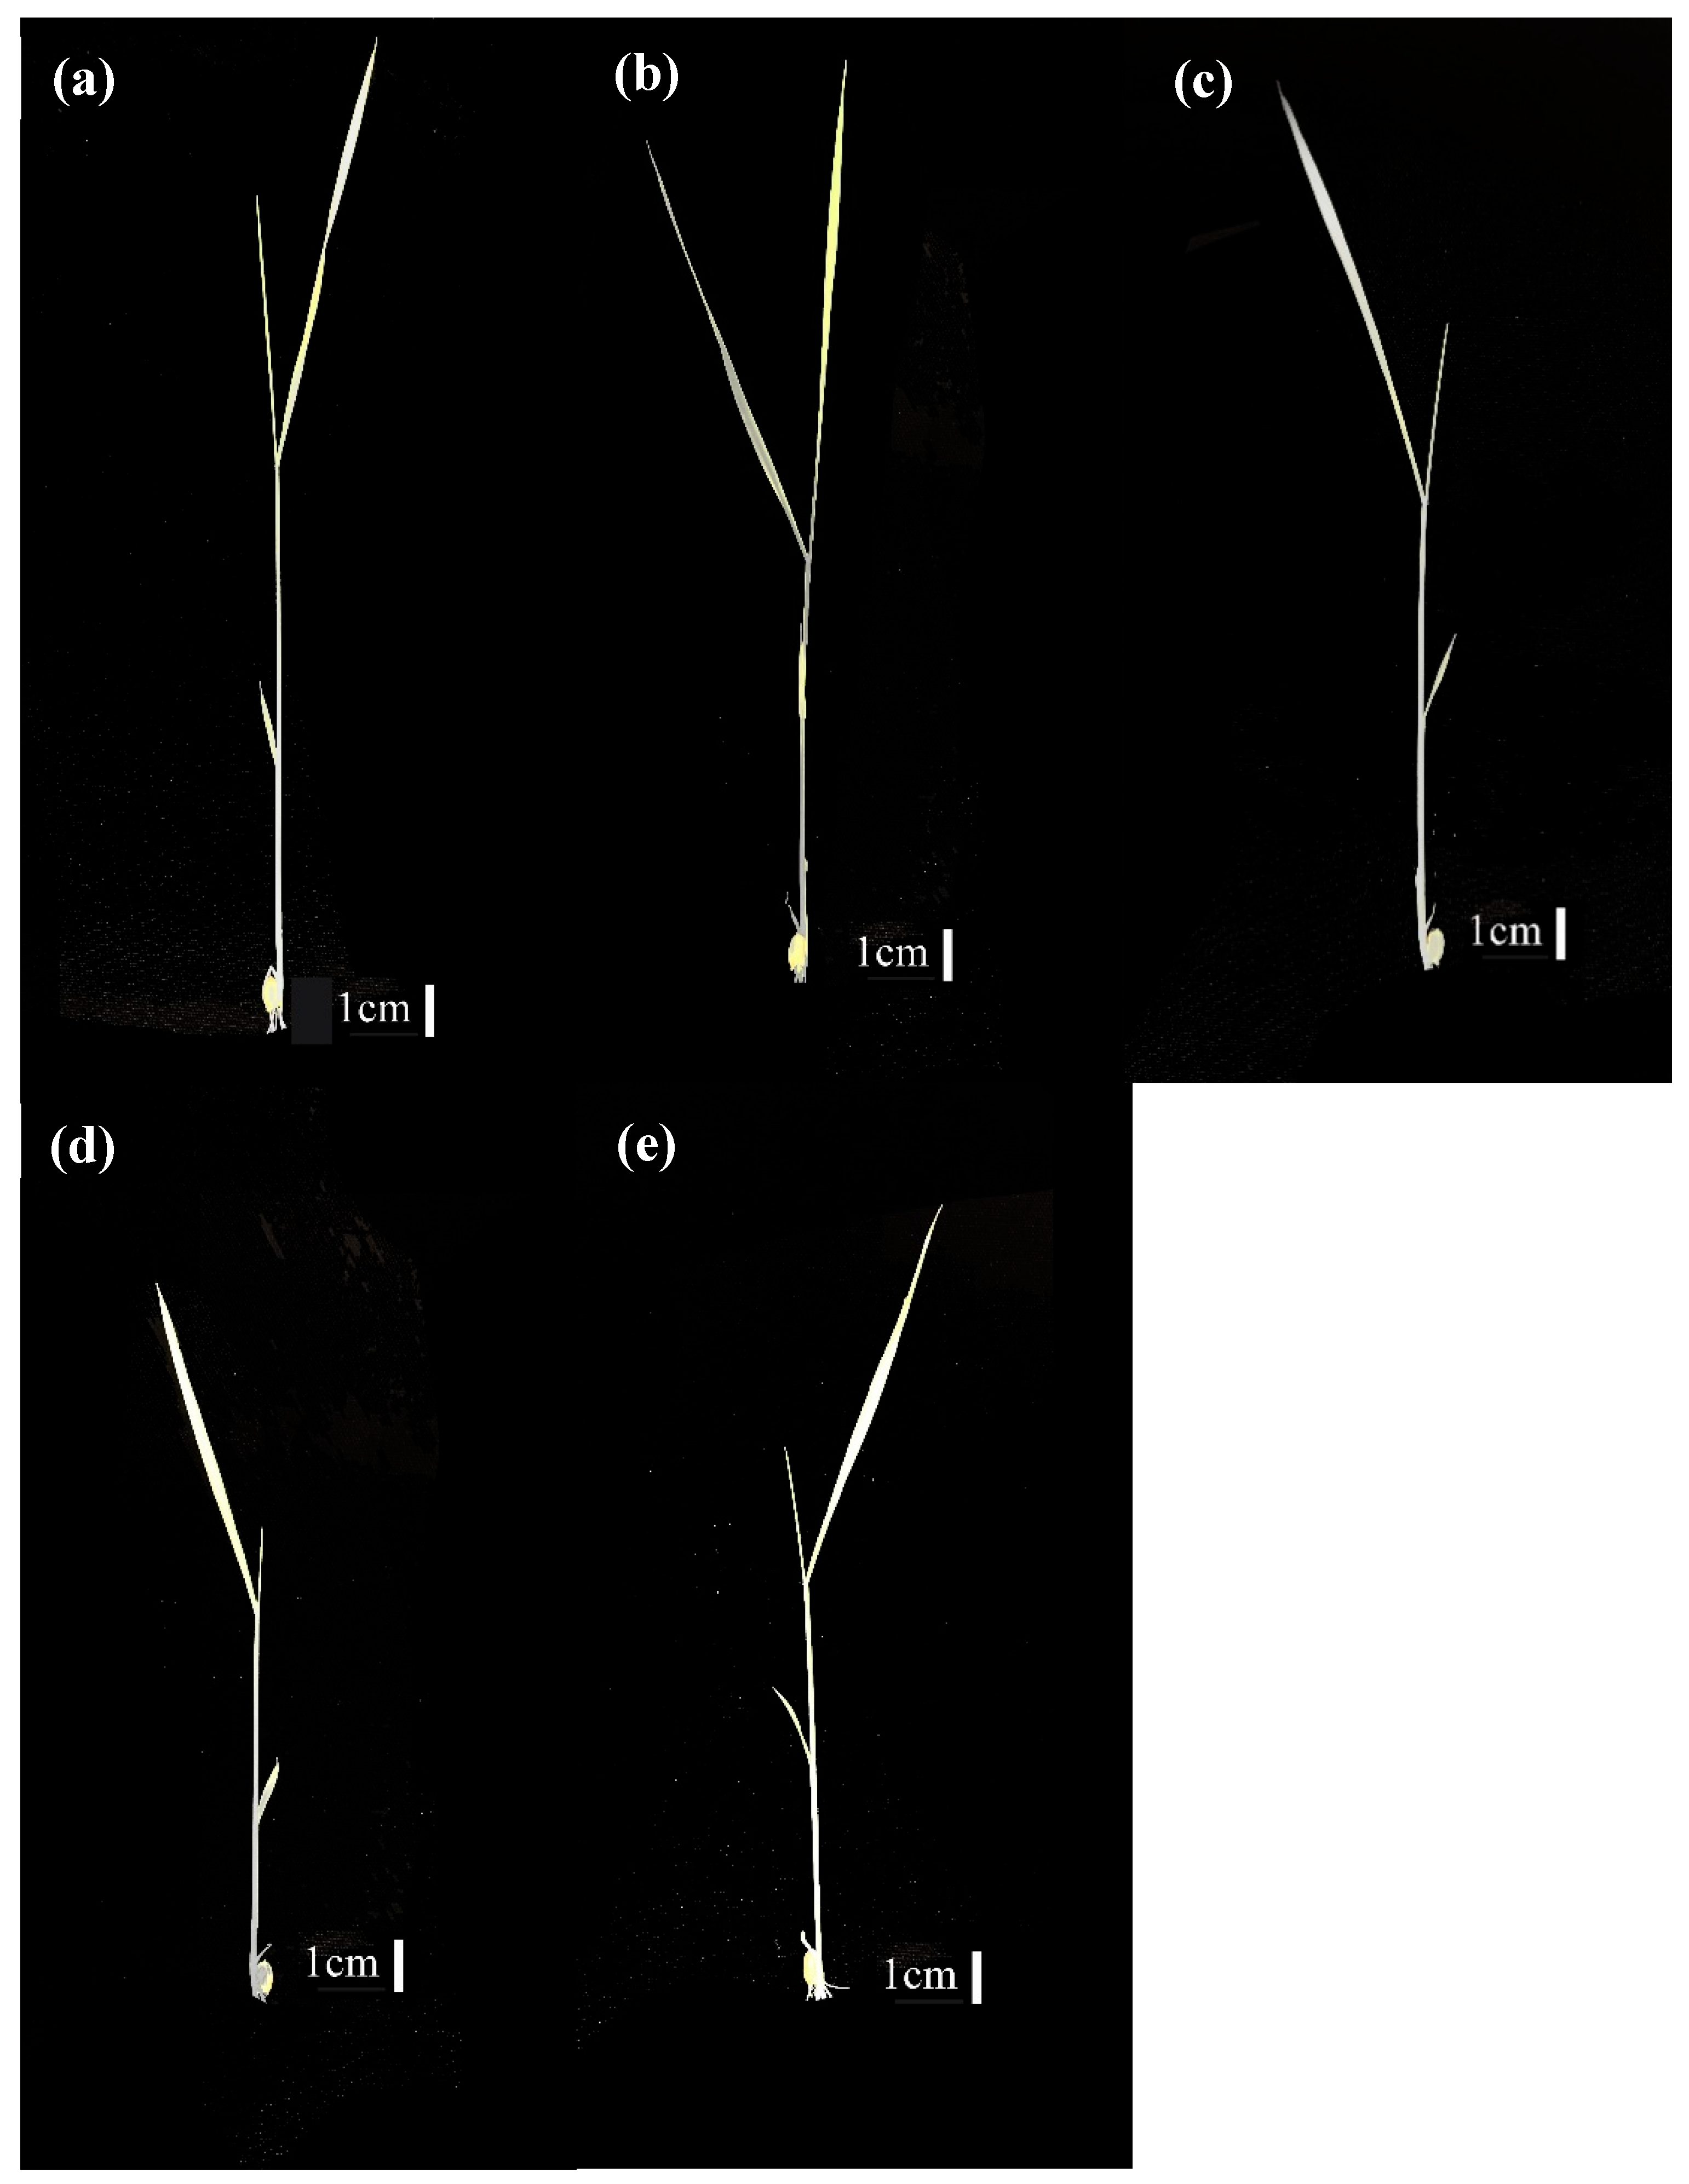
Shoot parameters followed a similar trend across the different UFB irrigation treatments. Among the treatments, T1 steadily showed superior performance across most shoot parameters (Figure 2). The highest shoot height was achieved in T1 (15.9 cm), which remained 55.1% greater than the control (T5, 10.2 cm), while other treatments showed intermediate shoot heights compared to T1. Similarly, shoot fresh weight (0.14 g) and shoot dry weight (0.008 g) were highest in T1, representing 40% and 33.3% increases over T5 (0.10 g and 0.006 g), respectively. In addition, the total dry biomass was nearly double in T1 (0.02 g) compared to T5 (0.01 g), indicating improved shoot development under UFB irrigation. The dry matter percentages did not significantly differ among the treatments. Overall, shoot parameters were highly influenced by the concentration of UFB (Table 3).

3.5. UFB Water Impacts on Pigments

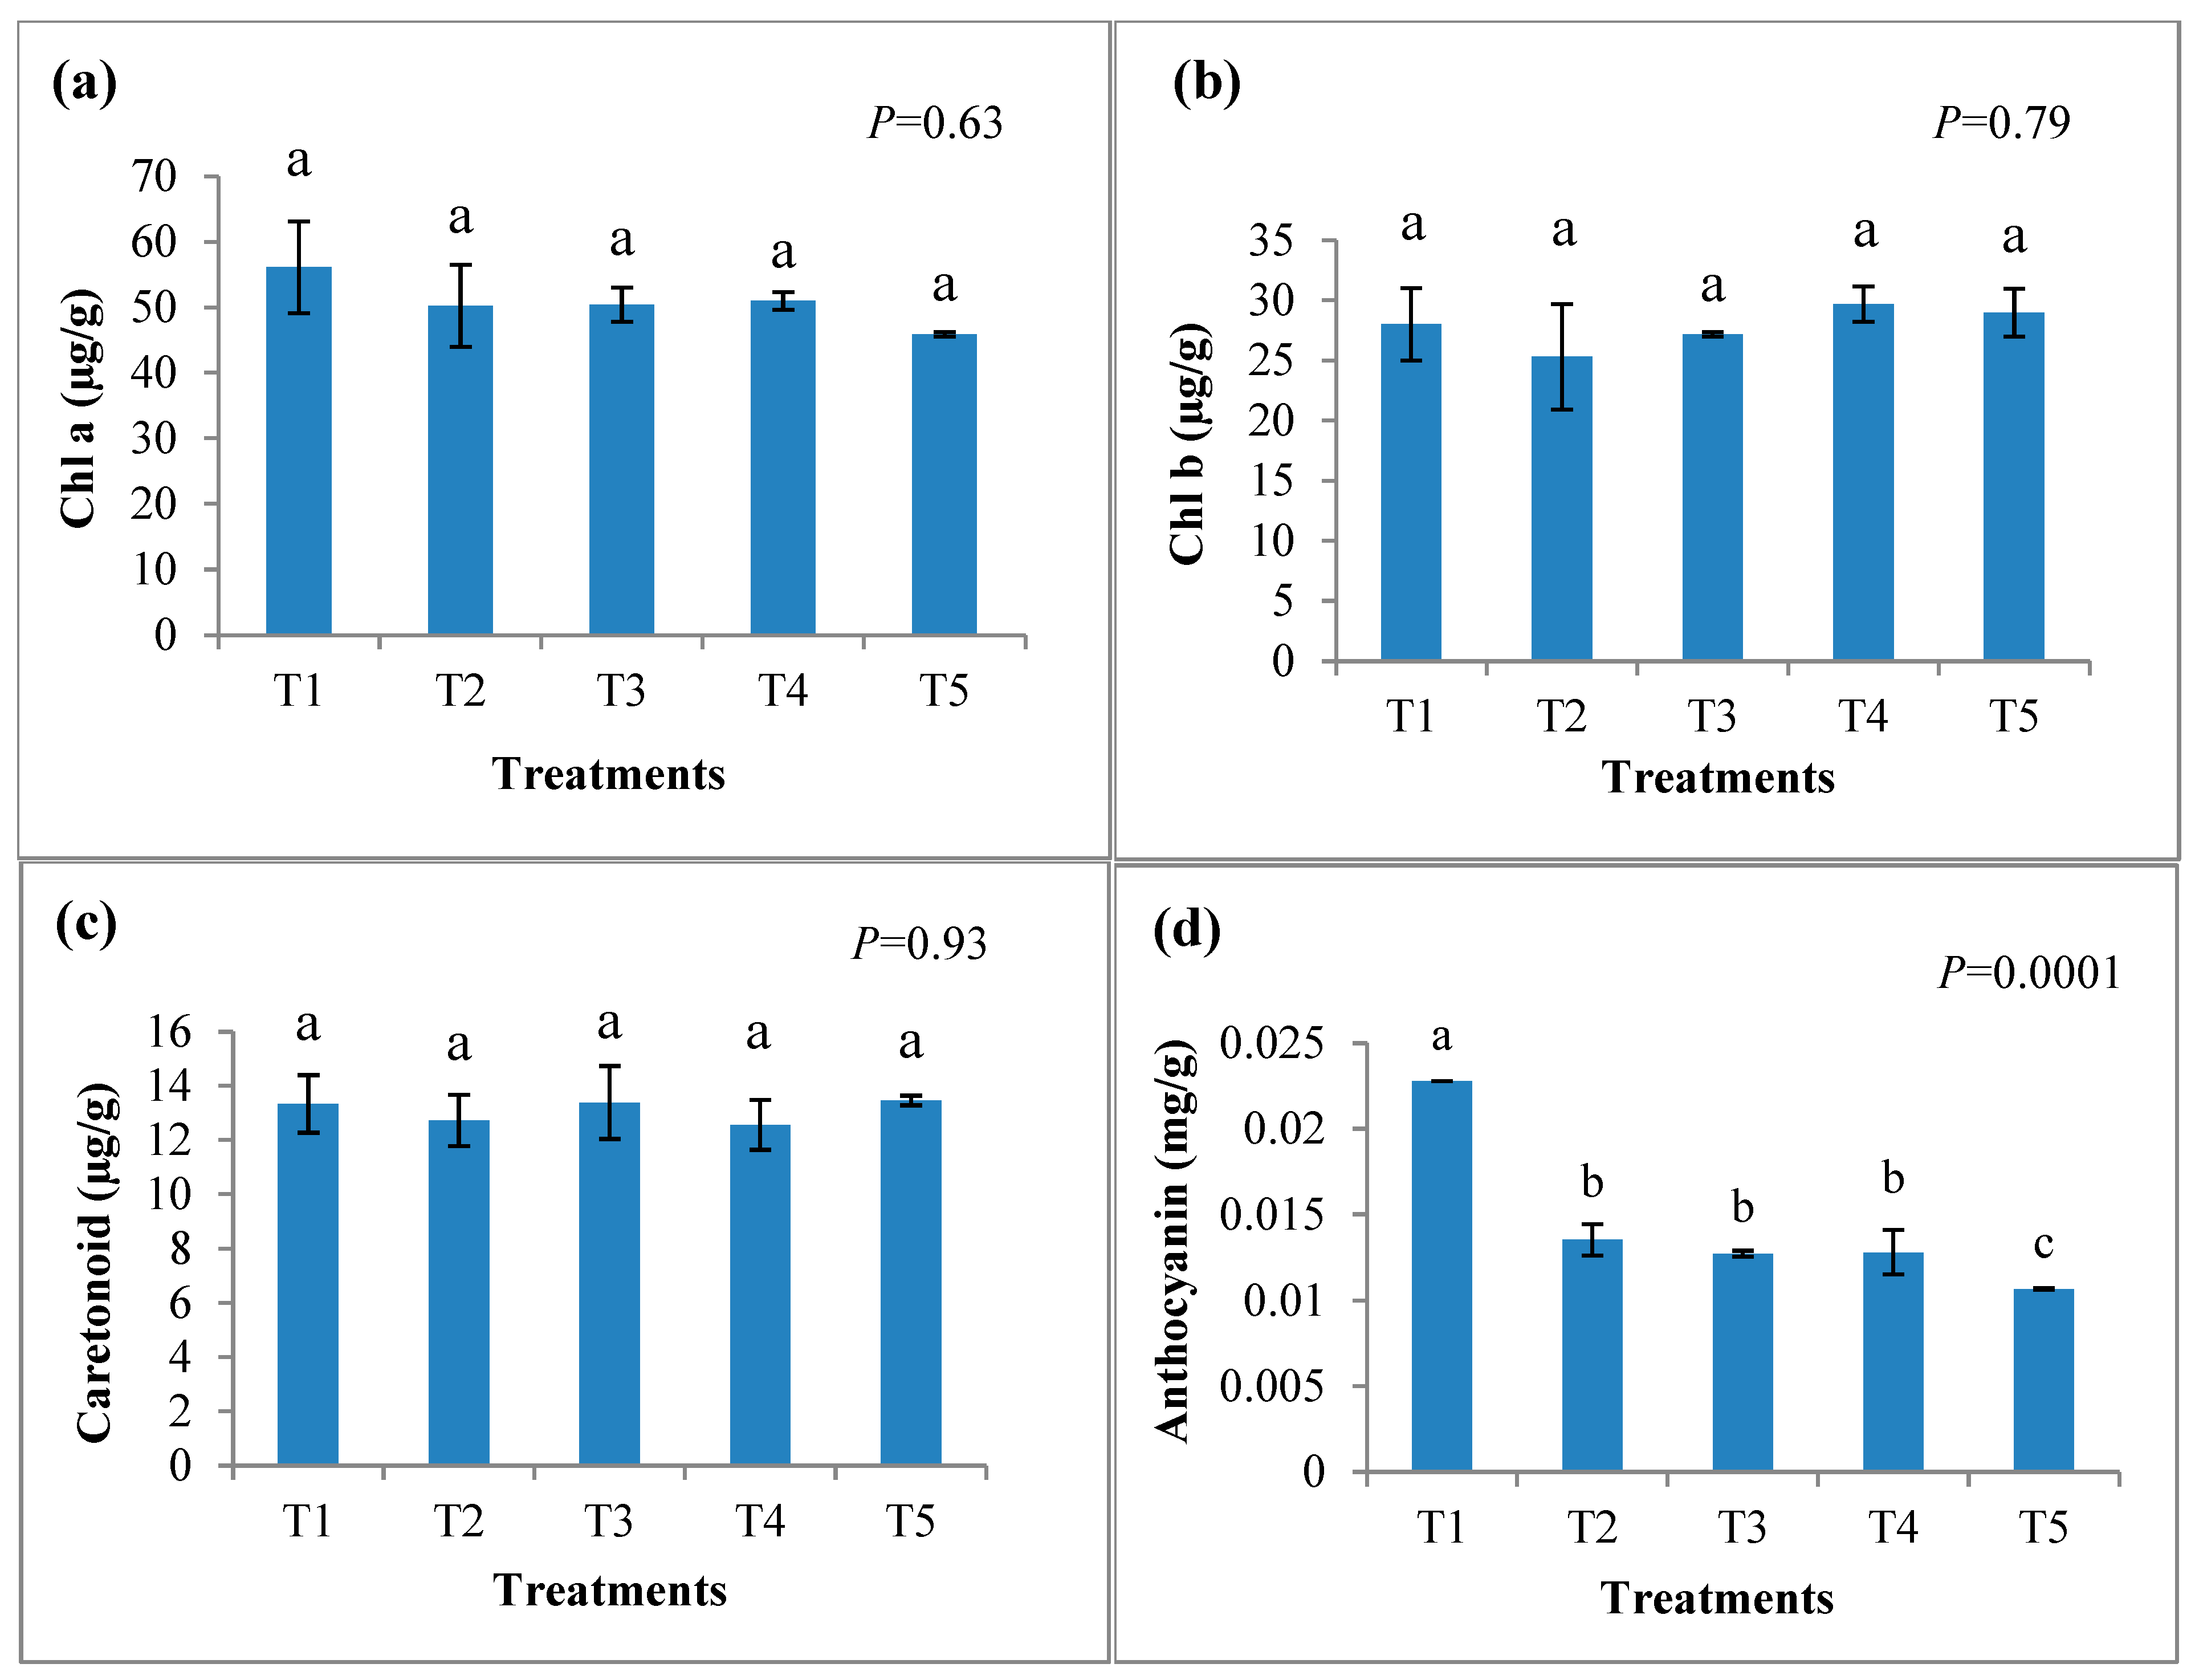
According to the ANOVA results, photosynthetic pigment concentrations did not differ significantly among treatments for chlorophyll a, chlorophyll b, or carotenoids (Figure 3). Nevertheless, chlorophyll a showed a numerical increase in T1 compared with the control, while anthocyanin content increased significantly with higher UFB concentration. Regarding chlorophyll a, the highest content was observed in T1 (~1.7 mg g−1 FW), which showed an approximate 65% increase compared to the control (T5, ~1.0 mg g−1 FW). Other treatments showed intermediate levels, which indicate ~18–23% improvements relative to the control (Figure 3a). For chlorophyll b, T1 showed the highest accumulation (~7.0 mg g−1 FW), representing a ~15% increase compared to the control (Figure 3b). The results did not show a statistical difference among treatments (p > 0.05). Nevertheless, a numerical tendency toward higher chlorophyll a content was observed with increasing proportions of UFB water. Similarly, chlorophyll b and carotenoid concentrations also showed numerical variation among treatments. The measurements from T1 together with T3 reached the highest values at 7.8 mg g−1 FW, which showed a 7% improvement compared to the control T5 value of 7.3 mg g−1 FW. However, T2 and T4 showed slightly lower carotenoid levels (~7.1–7.2 mg g−1 FW), suggesting that moderate proportions of UFB water maintain pigment stability (Figure 3c). The anthocyanin content displayed different levels between the various bubble-containing treatment groups. T1 reached the highest average value of 0.02 mg g−1, which showed 60–110% more than the other treatments. The results from T2, T3, and T4 exhibited similar average values with small variations according to Figure 3d. The lowest average anthocyanin content was recorded in T5 (0.01 mg g−1).

3.6. Changes in Hydrogen Peroxide and Antioxidant Concentrations

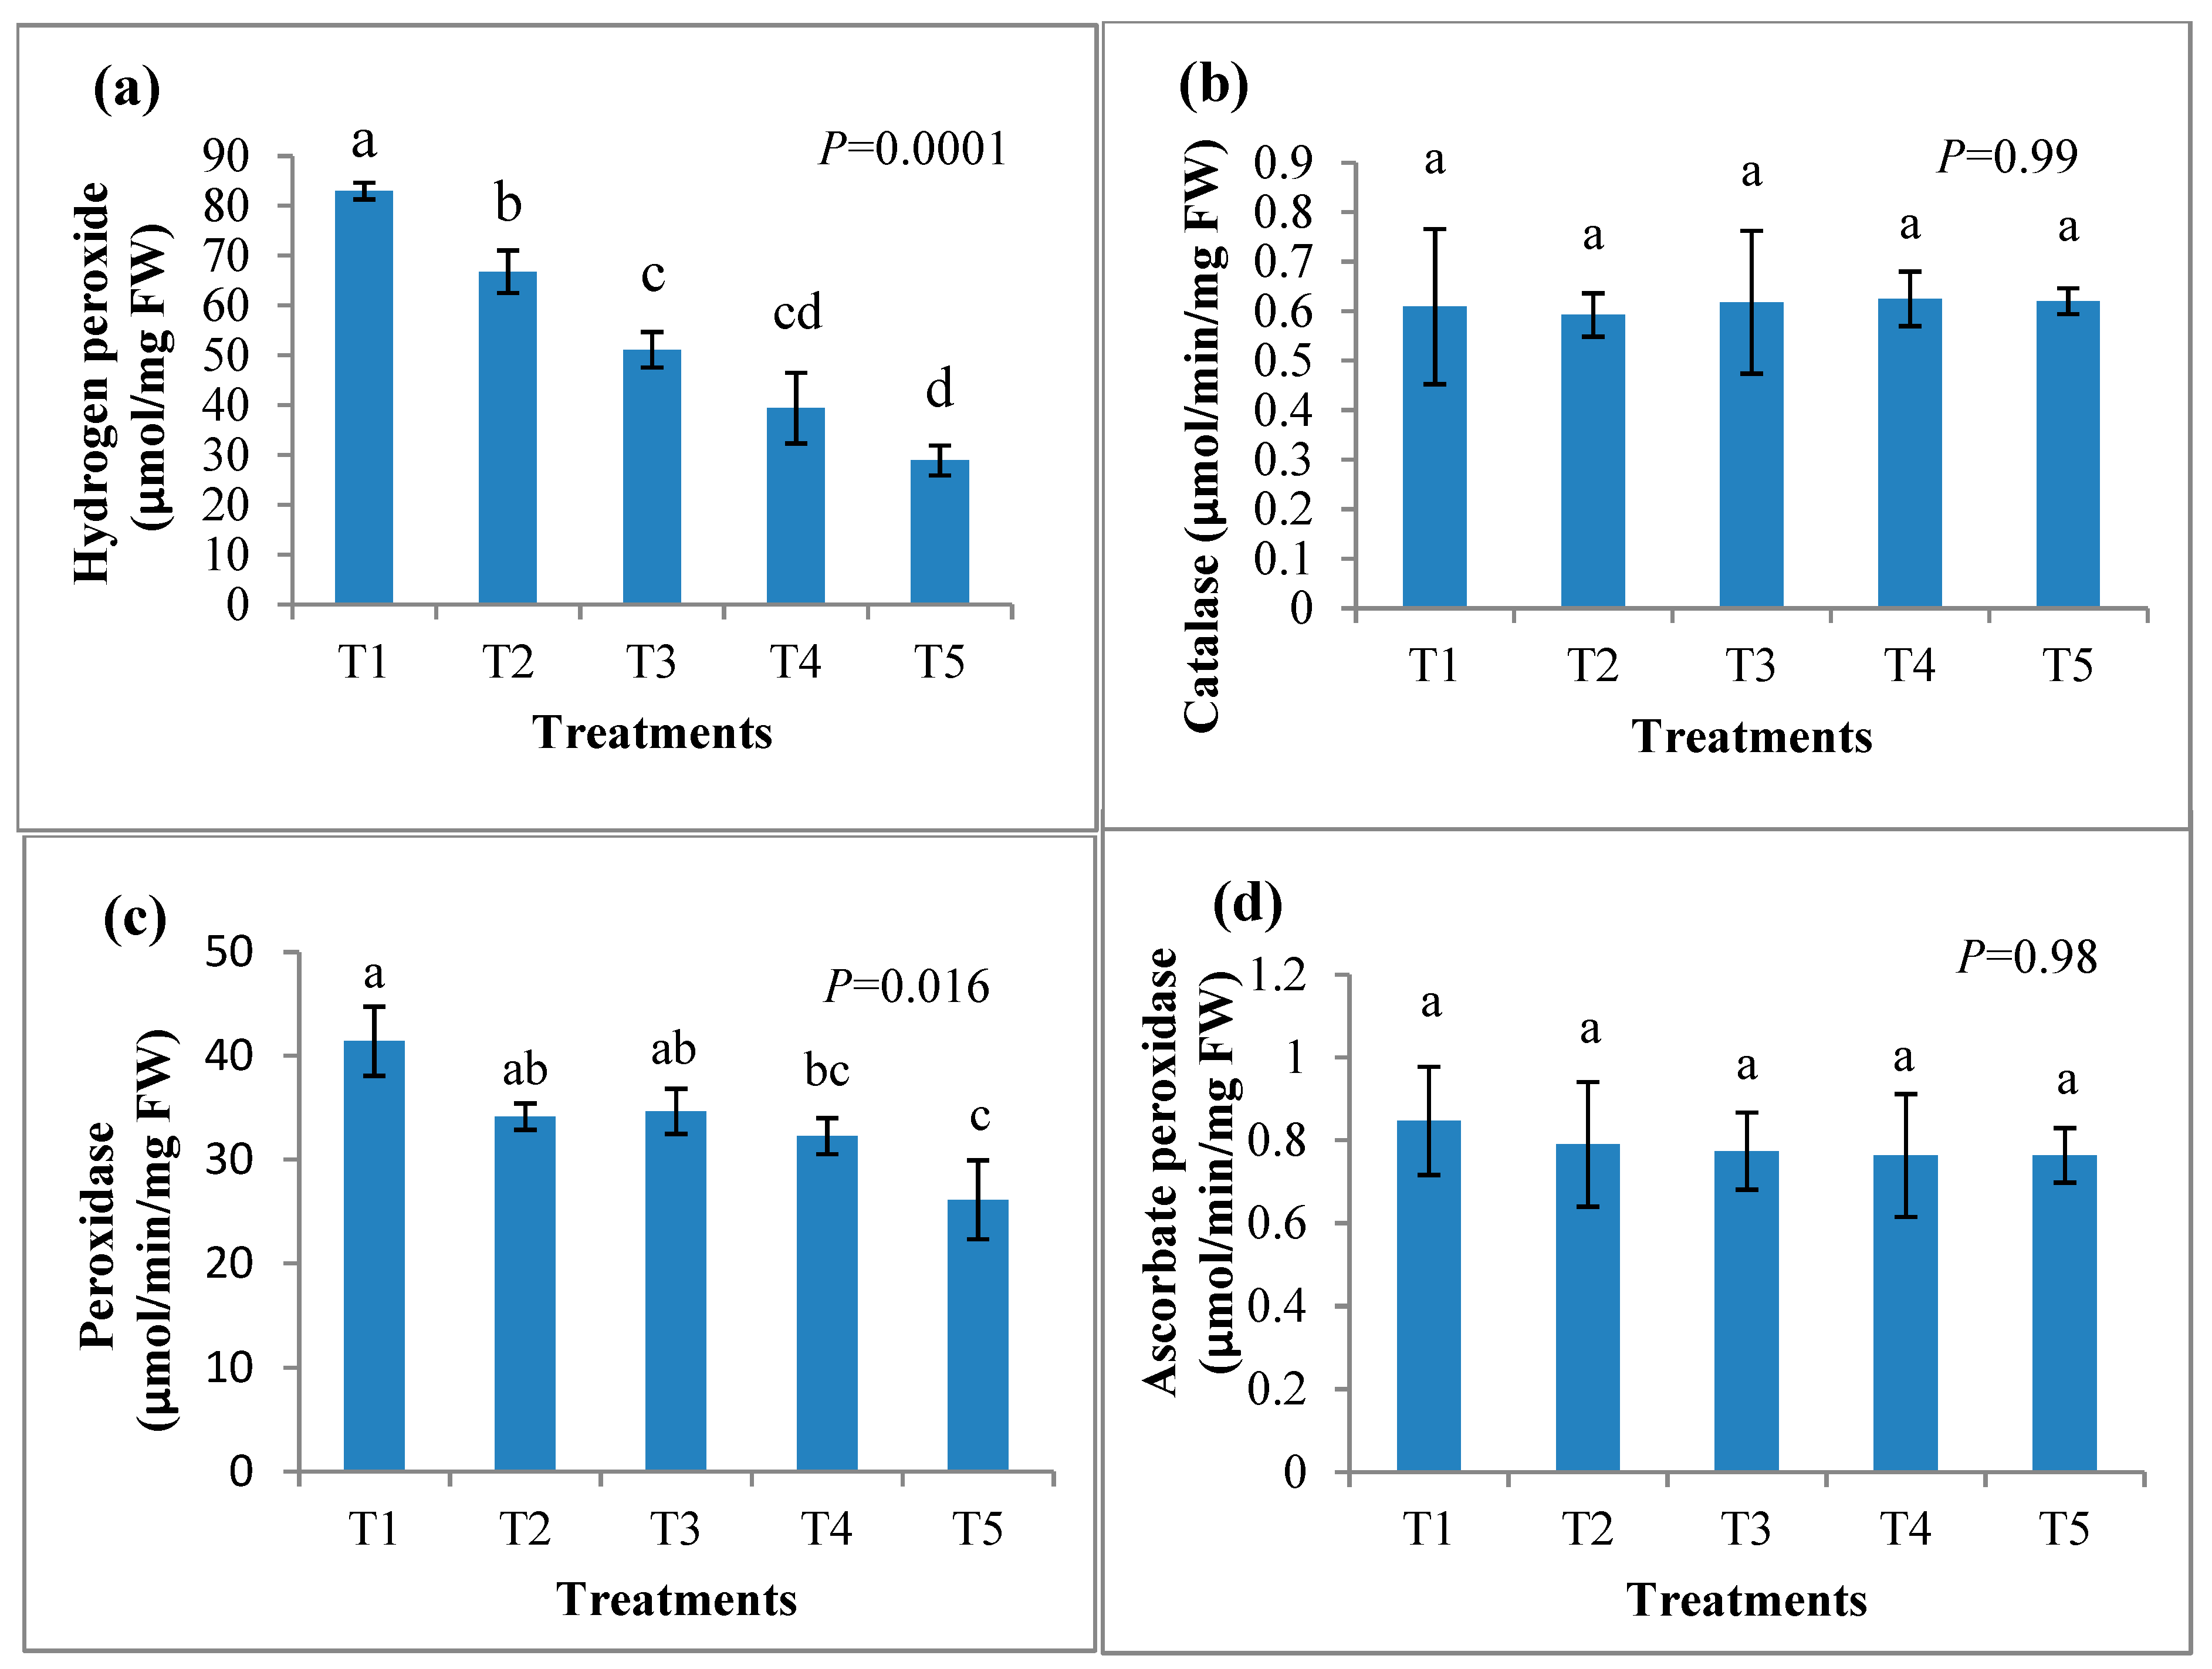
Hydrogen peroxide accumulation increased with increasing UFB concentration, indicating enhanced oxidative signaling under UFB irrigation (Figure 4a). The other treatments produced middle-level outcomes, demonstrating steady performance decreases when H2O2 and UFB percentages decreased. The results indicate that increasing UFB concentrations lead to higher H2O2 accumulation, suggesting enhanced ROS production and potential oxidative stress.
In contrast to H2O2 accumulation, CAT activity remained relatively stable across treatments, ranging from 0.59 µmol min−1mg−1 (T2) to 0.62 µmol min−1mg−1 (T4). Herein, CAT activity did not differ significantly among treatments (p > 0.05), indicating no detectable response to UFB concentration under the present experimental conditions (Figure 4b). In contrast, the results demonstrate that POD activity decreased in response to the treatments, which is similar to the pattern of H2O2 buildup, thus showing POD’s higher sensitivity to oxidative changes than CAT (Figure 4c). The highest activity was recorded in T1 (41.4 µmol min−1mg−1), while the lowest was in T5 (26.1 µmol min−1mg−1), representing a ~36.9% reduction. The intermediate treatments showed moderate reductions of 16–22% when compared to T1. The results demonstrate that NBs improve POD activity, which helps cells maintain redox equilibrium through enhanced H2O2 removal during oxidative stress. In contrast to H2O2 and POD, APX activity showed no statistically significant variation among treatments, ranging narrowly from 0.7 µmol min−1mg−1 (T4) to 0.8 µmol min−1mg−1 (T1) (Figure 4d).

3.7. Changes in Soluble Sugar

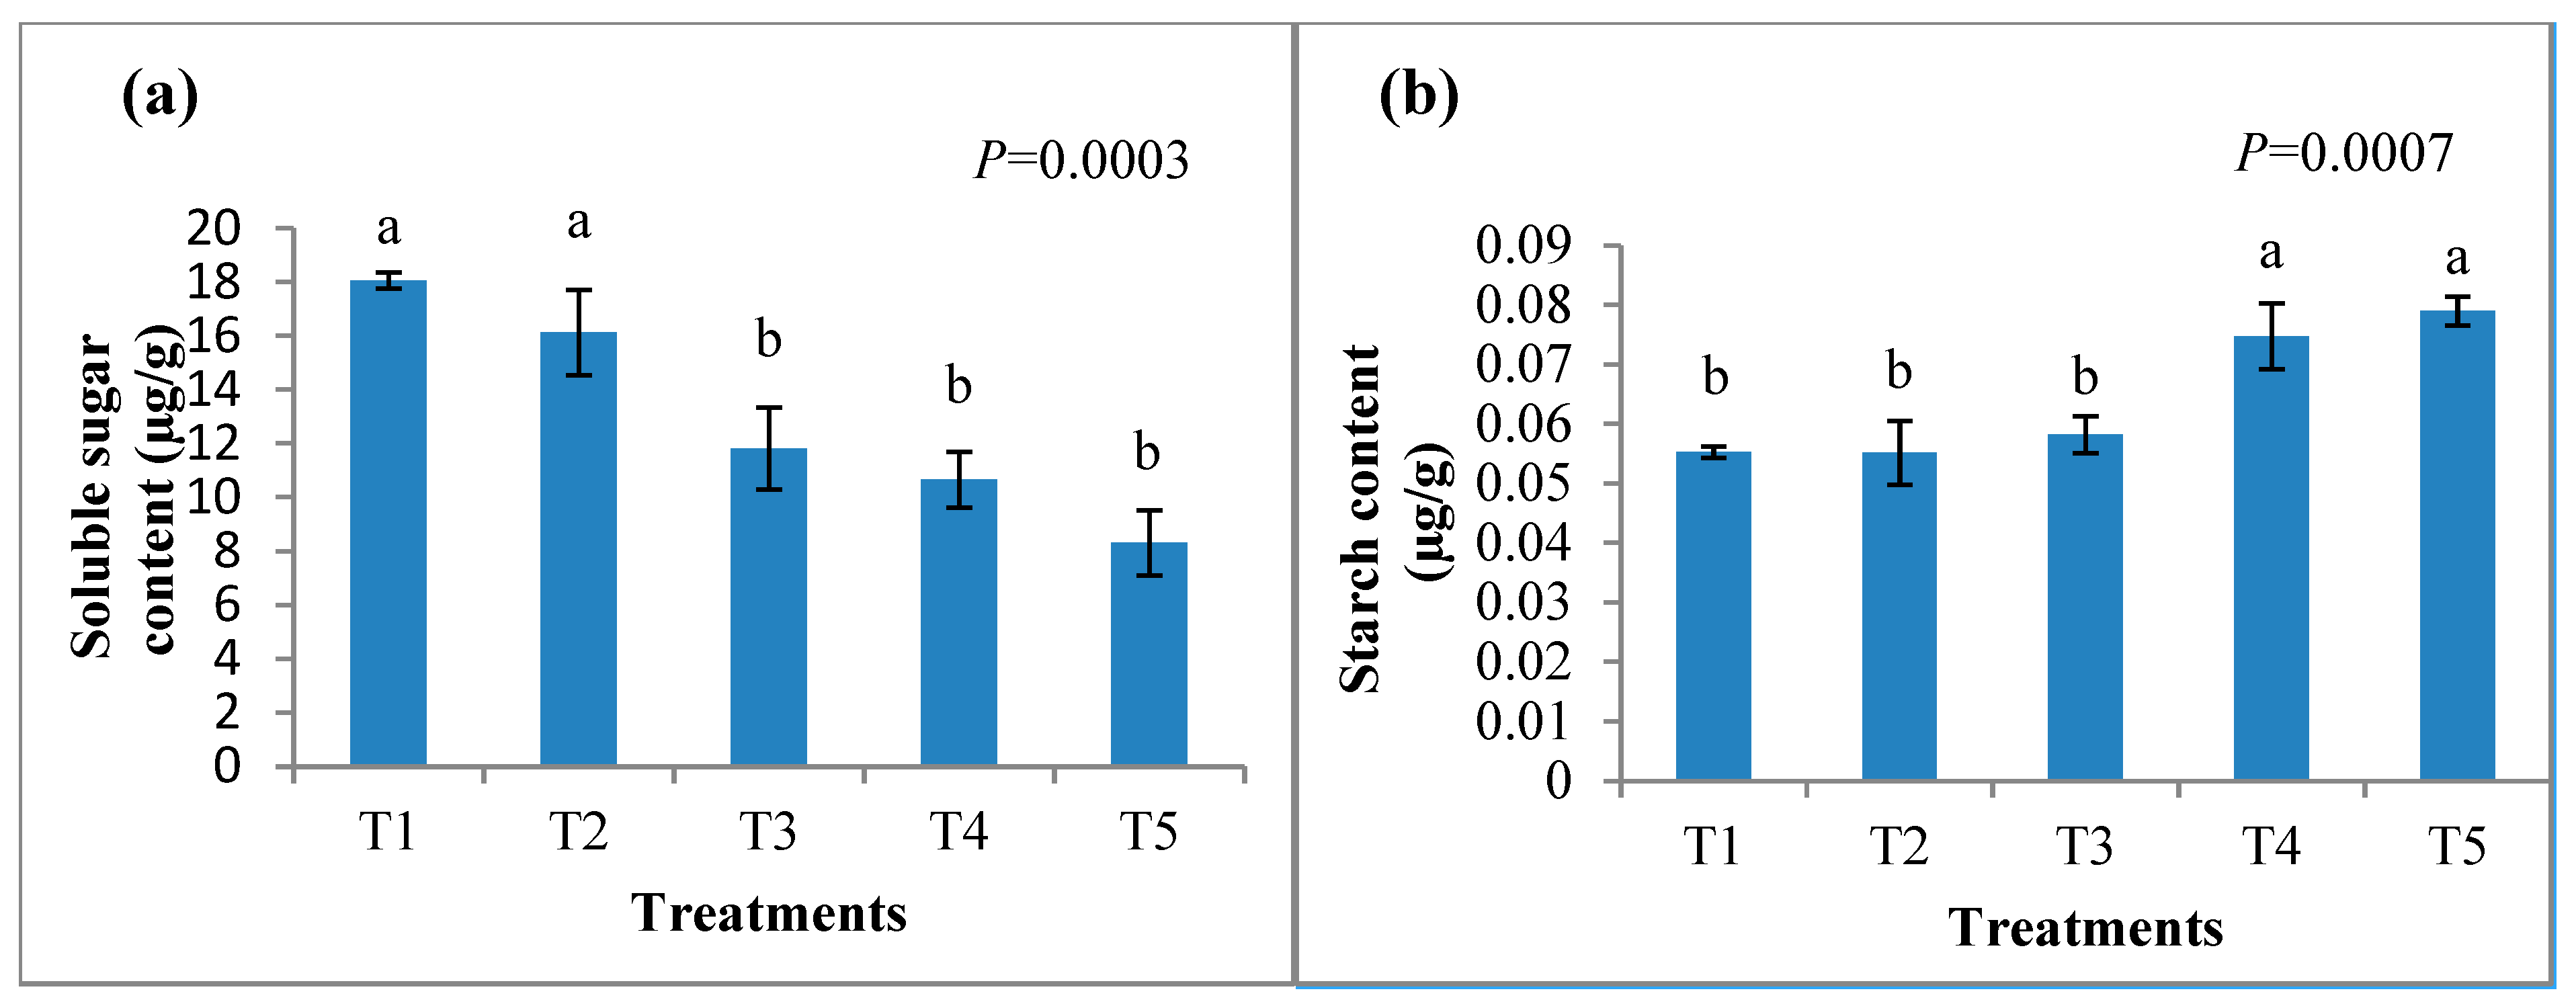
Soluble sugar levels differed significantly among treatments (p < 0.05) and showed a clear concentration-dependent response (Figure 5a). The highest sugar concentration appeared in T1 (100% UFB water) at 18.0 µg g−1, representing the optimal condition. The concentration levels of other treatments decreased steadily as bubble concentration increased until T5 reached its lowest measurement of 8.3 µg g−1. The results indicate that UFB concentration levels directly affect the soluble sugar content, and when the bubble content lessens, the soluble sugar content also reduces.

3.8. Changes in Starch

The statistical analysis revealed a significant change in starch content when comparing different treatments with UFBs, as shown in Figure 5b. The lowest starch concentration was observed in T1 and T2, which both showed nearly 0.05 µg g−1. The maximum concentration appeared in T5 (0.07 µg g−1) and showed a 43.6% increase compared to T1. The starch values showed an upward trend when the UFB concentration decreased. The results demonstrate that higher UFB concentrations result in lower starch values, but the starch content increases as UFB concentration decreases.

3.9. Heat Map Analysis

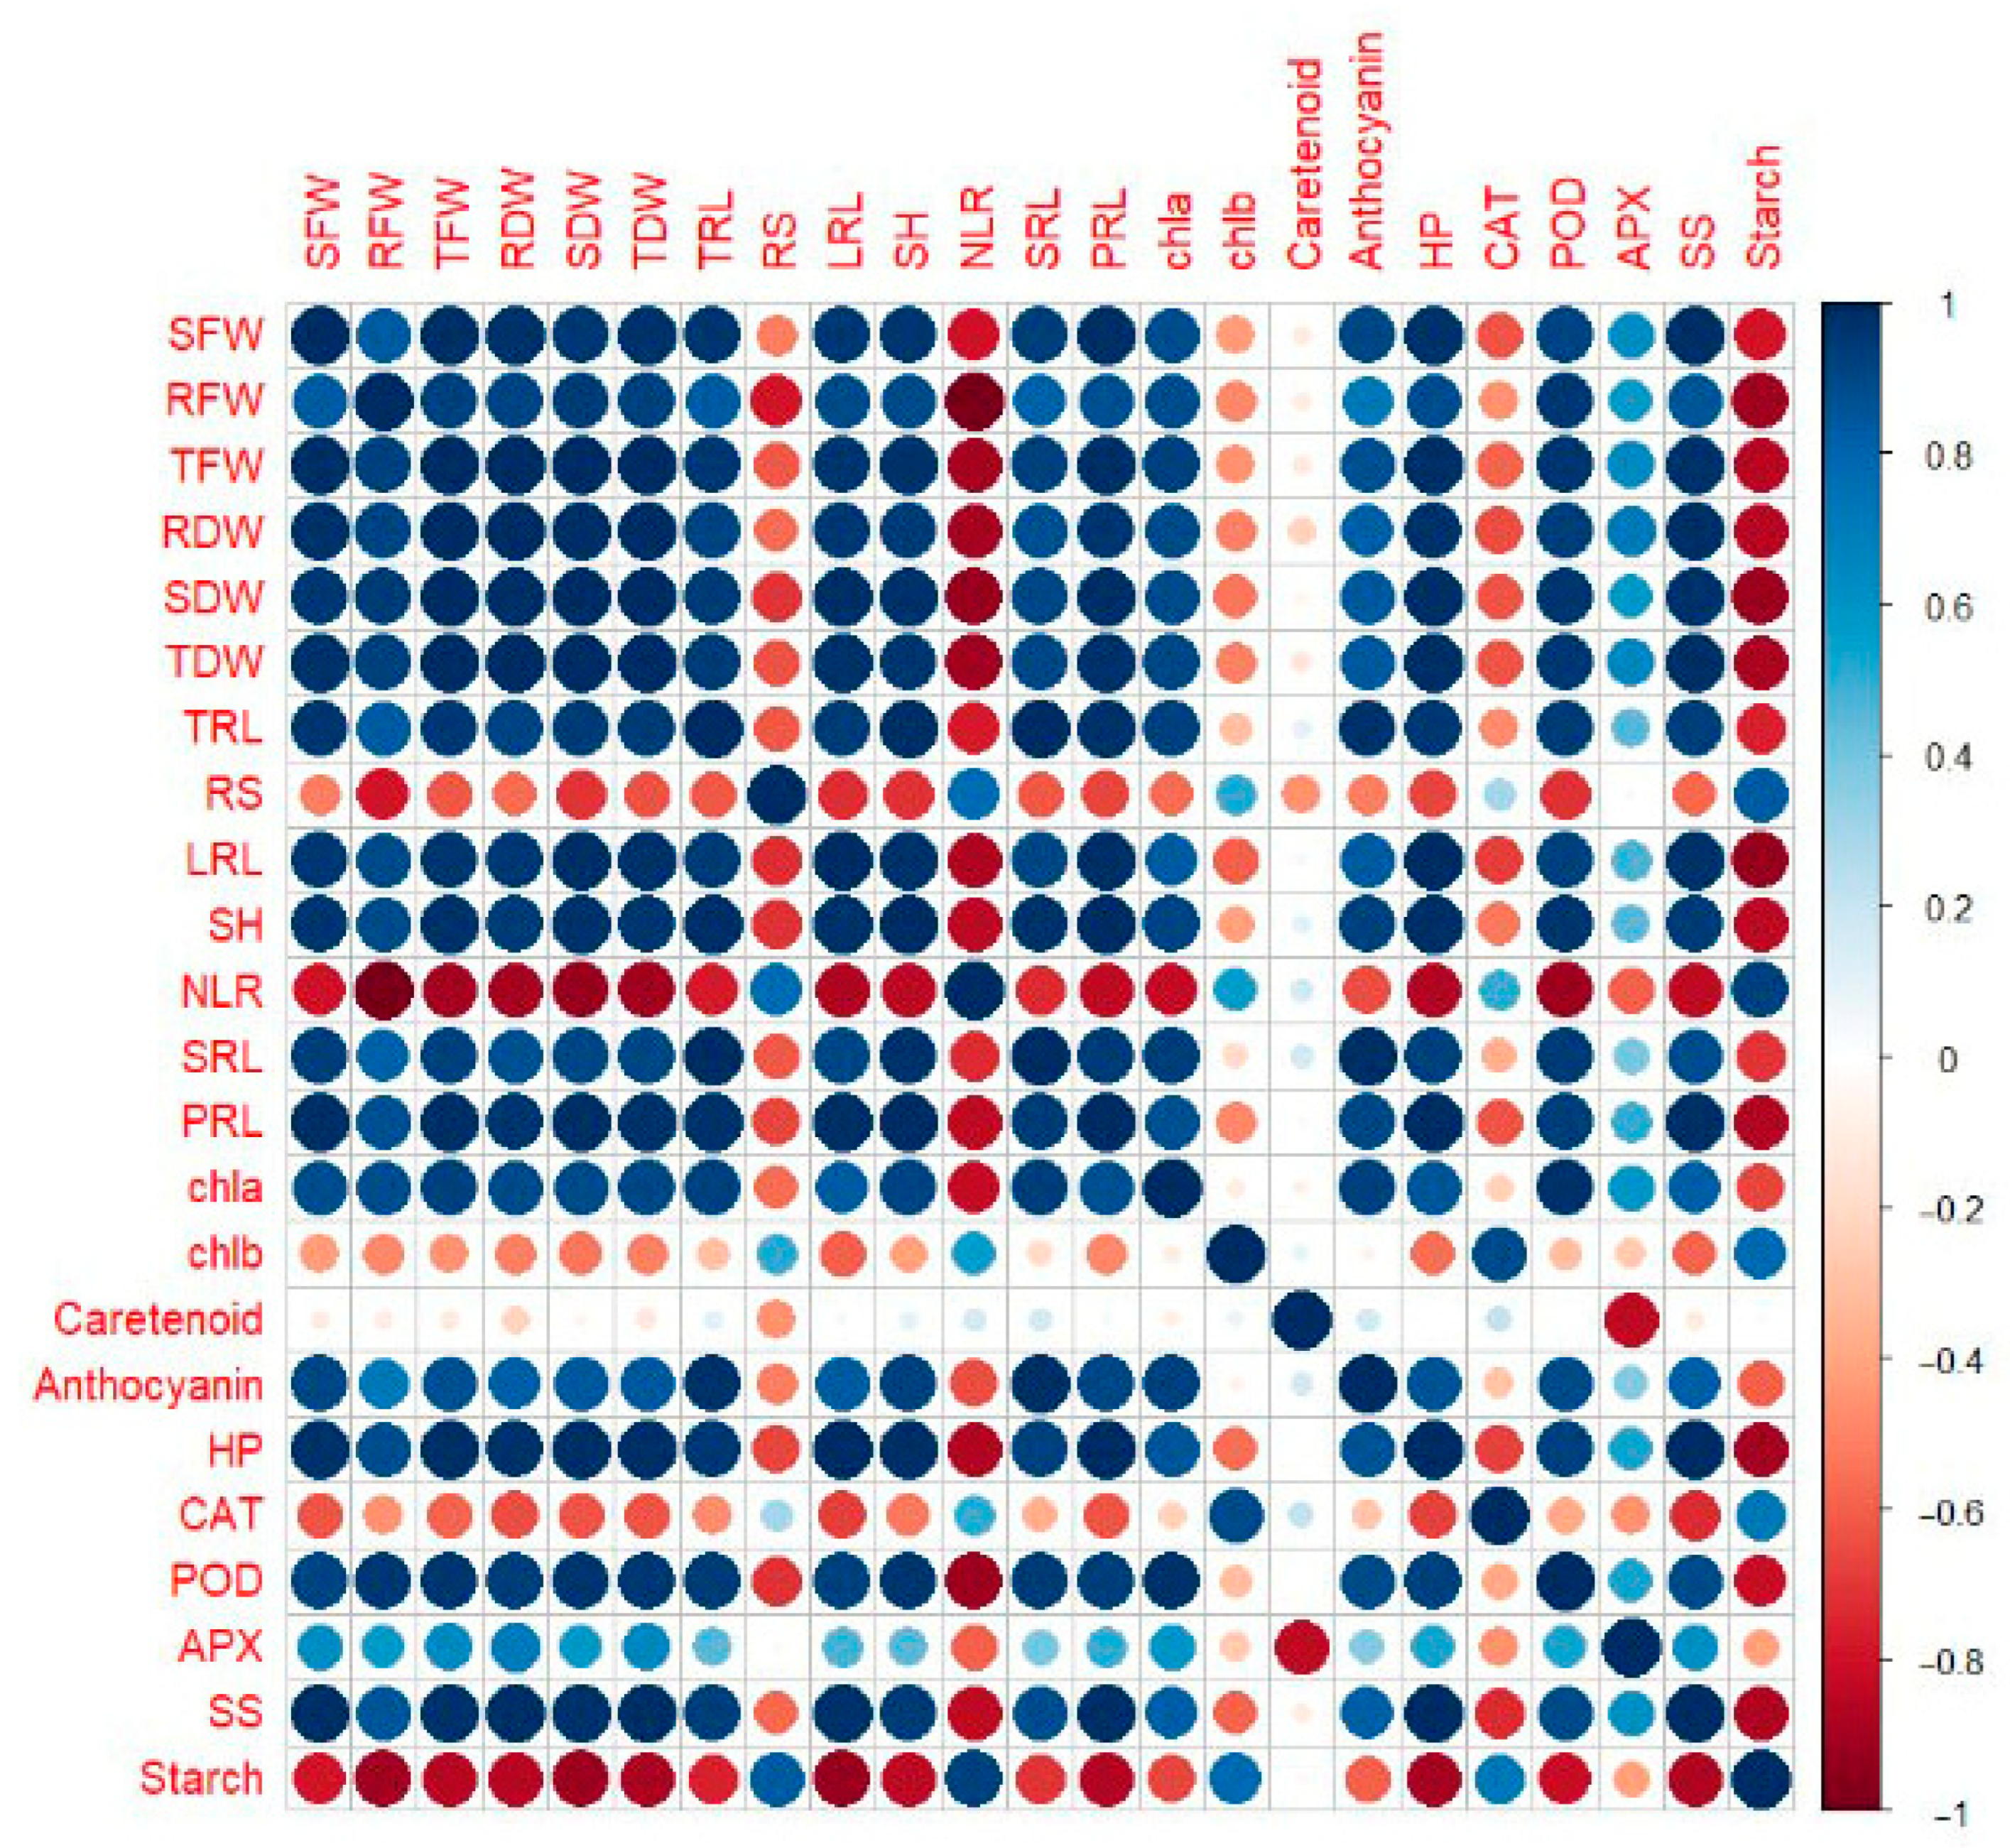
Total fresh and dry weights (including both shoot and root weights) exhibited strong positive correlations (r > 0.90) with one another, suggesting that biomass accretion was coordinated across organs (Figure 6). Furthermore, there was a positive correlation between biomass traits and root system appearances, such as total root length, specific root length, and primary root length, which highlights the contribution of root development to overall plant growth. In contrast, the root-to-shoot ratio was negatively correlated with shoot and total biomass, suggesting a trade-off between proportional root allocation and total growth. Similarly, the number of crown roots was inversely related to biomass accumulation, indicating that excessive crown root branching might not favor whole-plant productivity.
Concerning the photosynthetic pigments, chlorophyll a and b were strongly interrelated (r = 0.85), and both pigments showed moderate positive correlations with carotenoids, consistent with their shared role in photosynthesis. Moreover, starch content did not show a significant correlation with biomass-related traits. Instead, starch was strongly and negatively correlated with H2O2, POD, and soluble sugar content. This pattern is consistent with treatment-level responses, where high-UFB conditions promoted biomass accumulation alongside reduced starch and elevated soluble sugars, indicating a shift in carbon partitioning rather than enhanced carbohydrate storage. In addition, the negative association between starch and both soluble sugars and oxidative markers suggests that UFB irrigation promotes starch mobilization to fuel growth and stress acclimation, rather than increasing long-term carbohydrate storage. In contrast, stress-related metabolites such as anthocyanins exhibited negative correlations with biomass and starch, while H2O2 was positively correlated with antioxidant enzymes, including CAT, POD, and APX (r = 0.60 − 0.75), showing coordinated oxidative stress responses. Overall, the heat map illustrates associations among measured variables, including biomass traits, root characteristics, pigments, and stress-related metabolites. These correlations describe relationships among parameters but do not imply statistically significant treatment effects for all variables.

4. Discussion

The current study provides the first systematic evidence that UFB irrigation alone without external nutrient supplementation can significantly enhance early root and shoot development in rice seedlings. Unlike previous studies that examined UFB effects under nutrient-sufficient or fertilized conditions, the present work isolates the intrinsic physiological role of UFBs by employing a nutrient-free system. This approach allows us to demonstrate that UFB-induced growth promotion is driven primarily by physical and redox-mediated mechanisms rather than nutrient availability.
The results demonstrate that UFB irrigation has a strong impact on root and shoot morphology in rice seedlings. In this regard, primary, crown, and total root lengths are significantly enhanced by the UFB treatment, leading to a proportional increase in both fresh and dry root weights. Interestingly, this increase was proportional to bubble concentration despite the absence of added nutrients. Concurrently, specific root length (SRL) varied among treatments. SRL is a key functional trait governing plant nutrient and water acquisition [17], where a higher SRL enables plants to explore a greater volume of growing media per unit root biomass. Additionally, plants with a higher SRL invest less biomass per unit root length, potentially improving their energy and resource-use efficiency [29]. Other studies that introduced NBs to the root zone have shown similar results. For example, Ref. [30] conducted a laboratory experiment to examine NBs’ impact on nutrient consumption and rice seedling growth. The results describe that root length increased by around 3% with a low-frequency NB treatment compared to untreated (control) plants. Simultaneously, in the high-frequency treated group, root length increased significantly by over 52%, respectively. Moreover [31], reported that using micro- and NBs injected with CO2 resulted in a larger root size compared to the control group of Amaranths.
The changes in root morphology might be due to several reasons. For instance, ROS-mediated signaling has been reported to influence root growth and development in other plant systems, acting in a hormone-like manner [32]. However, in the present study, this relationship is inferred from physiological responses rather than directly demonstrated. In addition, hydroxyl radicals generated during the nanobubbling process may help maintain the balance between cell differentiation and proliferation, while ROS homeostasis at the root tip is essential for cell elongation and differentiation [32]. Our previous study showed that 100% UFB irrigation enhanced cell proliferation and elongation near the primary root tip, increasing root length [9]. This enhancement may further promote hydroxyl radical-mediated cell wall loosening [33]. In the present study, most root parameters increased proportionally with bubble concentration, indicating that higher UFB levels stimulate root growth via enhanced cell proliferation and elongation. UFB treatment also promoted shoot growth.
Apart from the root, UFB treatment promoted shoot growth and development. The shoot height and weights (dry and fresh) were enhanced with the elevated bubble concentration. According to the literature, a similar trend was observed when using NBs. For instance, stem diameter, leaf area, leaf thickness, and shoot dry weight increased with nitrogen and oxygen NB irrigation [11,34,35,36]. Another study conducted by [37] observed that after cucumber plants were irrigated with oxygen NBs, the shoot dry weight was enhanced by nearly 16.6–33.8%. In addition, several other studies related to lettuce [8,38], red mustard [39], muskmelon [10], etc. also observed a similar trend as we observed in our study. The UFB-related cell proliferation and elongation, as well as the activation of plant growth hormones (e.g., gibberellic acid), might cause these changes.
Although photosynthetic pigment concentrations did not differ significantly among treatments, relatively higher numerical values were consistently observed under elevated UFB concentrations, suggesting a possible trend rather than a definitive treatment effect. Although chlorophyll content did not change significantly, it was relatively higher under elevated bubble concentrations. Anthocyanin content also increased with bubble concentration, indicating a plant response to ROS-mediated stress. Under stress, anthocyanin accumulation and the expression of biosynthetic genes are enhanced [40,41,42]. Due to their antioxidant properties, anthocyanins play a key role in ROS scavenging and plant protection against environmental stresses.
Under stress conditions, soluble sugar content increased while starch content decreased. Similar findings were reported by [37], where oxygen nanobubbles increased soluble sugars in cucumber (2.5–44.5%) and tomato (4.3–30.3%) compared with non-nanobubble treatments. These results suggest that nanobubbles alter carbohydrate partitioning in rice seedlings. Consistent with [38], soluble sugar accumulation is an adaptive stress response and is closely associated with elevated ROS, particularly sucrose accumulation. This is generally interpreted as an adaptive response, in which sugars act as osmo-protectants and signaling molecules that can activate antioxidant defense pathways. Hydroxyl radicals may activate signaling pathways that upregulate genes related to photosynthesis, glycolysis, and sucrose metabolism [43]. As a result of this, some metabolic activities such as sucrose phosphate synthase (SPS), invertases, and sucrose synthase (SuSy) are enhanced, leading to the generation of more soluble sugar content in the plant. Based on previous reports, ROS signaling has been associated with altered activities of enzymes such as sucrose phosphate synthase (SPS), invertases, and sucrose synthase (SuSy). Although these enzymes were not measured in the present study, their involvement could partly explain the observed increase in soluble sugars and reduction in starch under high-UFB conditions. Previous studies have shown that ROS can induce the expression of stress-responsive transcription factors (e.g., WRKY, NAC, and bZIP families). In the present study, such molecular regulation was not measured but may contribute to the observed physiological responses. Simultaneously, under ROS signaling, plants often mobilize stored starch to soluble sugars for osmo-protection and energy supply [44]. This might be the reason for low starch accumulation in the UFB-treated rice seedlings.
Antioxidant enzyme activity in rice increased with rising UFB concentration, indicating elevated ROS production at higher bubble levels. Similar results were reported by [8], where 100% UFB treatment increased superoxide radical and total antioxidant contents. To mitigate ROS-induced oxidative damage, plants likely enhance endogenous antioxidant defenses [45]. Moreover, antioxidant systems have been reported to influence cell division and elongation in plants [46]. However, in this study, such cellular-level processes were not directly assessed and therefore remain speculative. In this study, we could also observe that high UFB concentration enhanced H2O2 accumulation but reported a significant enhancement of the peroxidase enzyme to mitigate ROS and increase plant growth and development.
The observed changes in the physicochemical properties of UFB water highlight relationships among key parameters. Notably, zeta potential became progressively more negative with increasing UFB proportion, indicating enhanced interfacial surface charge and improved dispersion stability of UFBs in irrigation water (Table 2). Zeta potential is widely used to assess colloidal surface charge and electrostatic stability, where higher absolute values (negative or positive) reflect stronger electrostatic repulsion and reduced aggregation, while values near zero indicate lower stability [47,48]. Similar negative zeta potentials have been reported for micro- and nanobubbles, supporting their stability and persistence in aqueous systems [2,38]. Importantly, zeta potential does not directly quantify surface reactivity or ROS generation. Although UFBs and nanobubbles can generate ROS under certain conditions, including hydroxyl radicals, these processes depend on factors such as gas composition, collapse dynamics, dissolved oxygen, and interfacial chemistry rather than surface charge alone [12]. In this study, we present this relationship between UFB surface charge properties and ROS-mediated plant responses as a working hypothesis, proposing that UFB-induced changes in surface characteristics may influence interfacial redox processes and downstream ROS signaling in plants; however, direct ROS quantification is required to confirm this mechanism.
Dissolved oxygen (DO) strongly influences ROS formation and plant metabolism [49]. Very high DO levels can negatively affect root growth in some hydroponic systems, but in our experiment, DO remained within a moderate range among treatments [46]. These levels support root aerobic respiration, rhizosphere microbial activity, and redox balance by limiting excessive hydroxyl radical production while sustaining efficient respiration [50]. The interaction between moderate DO and zeta potential might enable controlled ROS signaling without oxidative stress. Additionally, the near-neutral pH observed across treatments is optimal for plant growth and maintains ROS at biologically acceptable levels, supporting cell wall loosening, elongation, and hormone-mediated processes [51].
Overall, the study advances the current state of the art by isolating the direct physiological role of UFBs using a nutrient-free experimental system. By eliminating external nutrient inputs, we demonstrate that UFBs alone can stimulate early root and shoot development through concentration-dependent modulation of root architecture, reactive oxygen species signaling, antioxidant enzyme activity, and carbon partitioning. This novel finding creates some potential capability for promoting root and shoot development of the early growth stage of plants. Simultaneously, further studies are essential to discover the molecular mechanisms and cellular variations underlying these augmented changes to prove the reason behind the process. However, it is well known that different plant species and growing conditions might have numerous impacts [52]. Therefore, exploring the structural and quantitative variances in rice root and shoot cross-analysis will shed light on the overall behavior of UFBs.

5. Conclusions

This hydroponics experiment demonstrates the impact of UFB irrigation on the early growth of rice seedlings under externally nutrient-free conditions, where development is sustained by internal seed reserves rather than externally supplied nutrients. These findings demonstrate that UFB irrigation can enhance rice seedling growth under nutrient-limited hydroponic conditions; however, soil-mediated effects were beyond the scope of the present study. The UFB concentration in irrigated water showed a direct impact on the enhancement of root and shoot growth. The higher UFB content in water increased the root and shoot elongation as well as dry and fresh mass. However, UFBs negatively impacted the lateral roots’ emergence. Rice plants are likely to investigate a greater volume of the growing media for nutrients, as indicated by the rapid root growth with the elevated UFB concentration. Under UFB irrigation, hydrogen peroxide levels increased and peroxidase activity was enhanced, suggesting activation of antioxidant defenses that may help balance potential oxidative damage. The UFB concentration in water also affects carbon metabolism by increasing soluble sugar content while reducing starch content in plants.

Author Contributions

Conceptualization, methodology, data curation, data analysis, and writing—original draft preparation, H.G.; supervision, Y.S.; supervision, K.K.; writing, reviewing, editing, and supervision, T.F. All authors have read and agreed to the published version of the manuscript.

Funding

This research was supported by project grant KK5T24022, a collaborative initiative between Saitama University and Maruyama Mfg. Co., Inc., Tokyo.

Data Availability Statement

The dataset was collected from laboratory trials and can be obtained from the corresponding author.

Conflicts of Interest

Authors Harshana Galahitigama and Takeshi Fujino were employed by the company Maruyama Mfg. Co., Inc. The remaining authors declare that the research was conducted in the absence of any commercial or financial relationships that could be construed as a potential conflict of interest. The authors declare no conflicts of interest.

Abbreviations

The following abbreviations are used in this manuscript:
UFBsUltrafine Bubbles
ROSReactive Oxygen Species
MQMilli-Q
GA3Gibberellic Acid
CRDCompletely Randomized Design
PARPhotosynthetic Active Radiation
DODissolved Oxygen
FWFresh Weight
DWDry Weight
DMDry Matter
PODPeroxidase
CATCatalase
APXAscorbate Peroxidase
NBsNanobubbles
SRLSpecific Root Length
SPSSucrose Phosphate Synthase
SuSySucrose Synthase

References

  1. Chirwa, W.; Li, P.; Zhan, H.; Zhang, Y.; Liu, Y. Application of fine bubble technology toward sustainable agriculture and fisheries. J. Clean. Prod. 2024, 449, 141629. [Google Scholar] [CrossRef]
  2. Ushikubo, F.Y.; Enari, M.; Furukawa, T.; Nakagawa, R.; Makino, Y.; Kawagoe, Y.; Oshita, S. Zeta-potential of micro- and/or nano-bubbles in water produced by some kinds of gases. IFAC Proc. Vol. 2010, 43, 283–288. [Google Scholar] [CrossRef]
  3. Wu, C.; Nesset, K.; Masliyah, J.; Xu, Z. Generation and characterization of submicron size bubbles. Adv. Colloid Interface Sci. 2012, 179–182, 123–132. [Google Scholar] [CrossRef]
  4. Galahitigama, H.; Fujino, T. Advancing sustainable crop production through nanobubble technology: Current understanding and future prospects. Rev. Agric. Sci. 2026, 14, 43–65. [Google Scholar] [CrossRef]
  5. Wu, Y.; Lyu, T.; Yue, B.; Tonoli, E.A.M.; Verderio, E.A.M.; Ma, Y.; Pan, G. Enhancement of tomato plant growth and productivity in organic farming by Agri-nanotechnology using nanobubble oxygation. J. Agric. Food Chem. 2019, 67, 10823–10831. [Google Scholar] [CrossRef] [PubMed]
  6. Zhou, Y.; Bastida, F.; Liu, Y.; Liu, Y.; Xiao, Y.; Song, P.; Wang, T.; Li, Y. Selenium fertigation with nanobubbles influences soil selenium residual and plant performance by modulation of bacterial community. J. Hazard. Mater. 2022, 423, 127114. [Google Scholar] [CrossRef]
  7. Lei, H.; Wang, W.; Liang, Y.; Xiao, Z.; Pan, H.; Wang, L.; Du, M. Effect of nano-bubble irrigation on the yield and greenhouse gas warming potential of greenhouse tomatoes. Agronomy 2023, 13, 2917. [Google Scholar] [CrossRef]
  8. Adilaksono, I.C.; Nakashima, H.; Miyasaka, J.; Ohdoi, K. Effect of different ultrafine bubble content in nutrient solution on lettuce (Lactuca sativa L. cv. Frillice): Growth, superoxide radical accumulation, and total antioxidant capacity. Environ. Control Biol. 2022, 60, 195–204. [Google Scholar] [CrossRef]
  9. Galahitigama, H.; Sawada, Y.; Kamura, K.; Yamato, T.; Fujino, T.; Takasaki, H. Cellular and morphological effects of ultrafine bubbles on rice root development during seedling growth. J. Plant Growth Regul. 2024, 44, 3369–3374. [Google Scholar] [CrossRef]
  10. Hung, J.C.; Li, N.J.; Peng, C.Y.; Ko, S.S. Safe farming: Ultrafine bubble water reduces insect infestation and improves melon yield and quality. Plants 2024, 13, 537. [Google Scholar] [CrossRef]
  11. Ahmed, A.K.A.; Shi, X.; Hua, L.; Manzueta, L.; Qing, W.; Marhaba, T.; Zhang, W. Influences of air, oxygen, nitrogen, and carbon dioxide nanobubbles on seed germination and plant growth. J. Agric. Food Chem. 2018, 66, 5117–5124. [Google Scholar] [CrossRef] [PubMed]
  12. Sun, X.; Chen, J.; Fan, W.; Liu, S.; Kamruzzaman, M. Production of reactive oxygen species via nanobubble water improves radish seed water absorption and the expression of aquaporin genes. Langmuir 2022, 38, 11724–11731. [Google Scholar] [CrossRef]
  13. Singh, E.; Kumar, A.; Lo, S.L. Synergistic roles of carbon dioxide nanobubbles and biochar for promoting direct CO2 assimilation by plants and optimizing nutrient uptake efficiency. Environ. Res. 2024, 244, 117918. [Google Scholar] [CrossRef]
  14. Yokoyama, M.; Yamashita, T.; Kaida, R.; Seo, S.; Tanaka, K.; Abe, S.; Nakano, M.; Fuji, Y.; Kuchitsu, K. Ultrafine bubble water mitigates plant growth in damaged soil. Biosci. Biotechnol. Biochem. 2021, 85, 2466–2475. [Google Scholar] [CrossRef] [PubMed]
  15. Iijima, M.; Yamashita, K.; Hirooka, Y.; Yoshikatsu, U. Ultrafine bubbles alleviated osmotic stress in soybean seedlings. Plant Prod. Sci. 2022, 25, 218–223. [Google Scholar] [CrossRef]
  16. Tajima, R.; Kato, Y. A quick method to estimate root length in each diameter class using freeware ImageJ. Plant Prod. Sci. 2013, 16, 9–11. [Google Scholar] [CrossRef]
  17. Ostonen, I.; Püttsepp, Ü.; Biel, C.; Alberton, O.; Bakker, M.R.; Lõhmus, K.; Brunner, I. Specific root length as an indicator of environmental change. Plant Biosyst. 2007, 141, 426–442. [Google Scholar] [CrossRef]
  18. Di Gioia, D.; Gaggìa, F.; Bosco, M.; Pagliarini, E.; Baffoni, L. Isolation and characterisation of plant growth-promoting rhizobacteria for improving growth and water/salt stress resilience in lettuce. Microorganisms 2026, 14, 353. [Google Scholar] [CrossRef]
  19. Wellburn, A.R. The spectral determination of Chlorophylls a and b, as well as total carotenoids, using various solvents with spectrophotometers of different resolution. J. Plant Physiol. 1994, 144, 307–313. [Google Scholar] [CrossRef]
  20. Lees, D.; Francis, F. Standardization of pigment analyses in cranberries. Hort. Sci. 1972, 7, 83–84. [Google Scholar]
  21. Senavirathna, M.D.H.J.; Wijesinghe, N.A.; Liu, Z.; Fujino, T. Effects of short-term exposure to different salinity levels on Myriophyllum spicatum and Ceratophyllum demersum and suitability of biomarkers to evaluate macrophyte responses to salinity stress. Ann. Limnol.—Int. J. Lim. 2020, 56, 23. [Google Scholar] [CrossRef]
  22. Satterfield, C.N.; Bonnell, A.H. Interferences in the titanium sulfate method for hydrogen peroxide. Anal. Chem. 1955, 27, 1174–1175. [Google Scholar] [CrossRef]
  23. MacAdam, J.W.; Nelson, C.J.; Sharp, R.E. Peroxidase activity in the leaf elongation zone of tall fescue: I. Spatial distribution of ionically bound peroxidase activity in genotypes differing in length of the elongation zone. Plant Physiol. 1992, 99, 872–878. [Google Scholar] [CrossRef]
  24. Aebi, H. Catalase in Vitro. Methods Enzymol. 1984, 105, 121–126. [Google Scholar]
  25. Nakano, Y.; Asada, K. Hydrogen peroxide is scavenged by ascorbate-specific peroxidase in spinach chloroplasts. Plant Cell Physiol. 1981, 22, 867–880. [Google Scholar] [CrossRef]
  26. Hansen, J.; Møller, I.B. Percolation of starch and soluble carbohydrates from plant tissue for quantitative determination with anthrone. Anal. Biochem. 1975, 68, 87–94. [Google Scholar] [CrossRef]
  27. DuBois, M.; Gilles, K.A.; Hamilton, J.K.; Rebers, P.A.; Smith, F. Colorimetric method for determination of sugars and related substances. Anal. Chem. 1956, 28, 350–356. [Google Scholar] [CrossRef]
  28. Yemm, E.W.; Willis, A.J. The estimation of carbohydrates in plant extracts by anthrone. Biochem. J. 1954, 57, 508–514. [Google Scholar] [CrossRef]
  29. Santangeli, M.; Steininger-Mairinger, T.; Vetterlein, D.; Hann, S.; Oburger, E. Maize (Zea mays L.) root exudation profiles change in quality and quantity during plant development- a field study. Plant Sci. 2024, 338, 111896. [Google Scholar] [CrossRef] [PubMed]
  30. Wang, Y.; Wang, S.; Sun, J.; Dai, H.; Zhang, B.; Xiang, W.; Hu, Z.; Li, P.; Yang, J.; Zhang, W. Nanobubbles promote nutrient utilization and plant growth in rice by upregulating nutrient uptake genes and stimulating growth hormone production. Sci. Total Environ. 2021, 800, 149627. [Google Scholar] [CrossRef] [PubMed]
  31. Khan, P.; Wang, H.; Gao, W.; Huang, F.; Khan, N.A.; Shakoor, N. Effects of micro-nano bubble with CO2 treated water on the growth of Amaranth green (Amaranthus viridis). Environ. Sci. Pollut. Res. 2022, 29, 72033–72044. [Google Scholar] [CrossRef]
  32. Tsukagoshi, H. Control of root growth and development by reactive oxygen species. Curr. Opin. Plant Biol. 2016, 29, 57–63. [Google Scholar] [CrossRef]
  33. Müller, K.; Linkies, A.; Vreeburg, R.A.M.; Fry, S.C.; Krieger-Liszkay, A.; Leubner-Metzger, G. In vivo cell wall loosening by hydroxyl radicals during cress seed germination and elongation growth. Plant Physiol. 2009, 150, 1855–1865. [Google Scholar] [CrossRef] [PubMed]
  34. Mochizuki, Y.; Zhao, T.; Kanematsu, W.; Kawasaki, T.; Saito, T.; Ohyama, A.; Nakano, A.; Higashide, T. Application of a growth model to validate the effects of an ultrafine-bubble nutrient solution on dry matter production and elongation of tomato seedlings. Hortic. J. 2019, 88, 380–386. [Google Scholar] [CrossRef]
  35. Adilaksono, I.C.; Noguchi, R.; Miyasaka, J.; Ohdoi, K.; Ito, A. Comparison of macrobubbles, microbubbles, and ultrafine bubbles applications in plant factory on lettuce growth, fertilizer use, and electricity consumption. Environ. Control Biol. 2025, 63, 11–19. [Google Scholar] [CrossRef]
  36. Iwama, K.; Hirooka, Y.; Izumi, Y.; Shoji, K.; Tateishi, Y.; Watanabe, Y.; Iijima, M. Ultrafine bubble water irrigation promotes soil particle fragmentation and reduces soil hardness in paddy fields. Sci. Rep. 2025, 15, 39626. [Google Scholar] [CrossRef] [PubMed]
  37. Zhou, Y.; Zhou, B.; Xu, F.; Muhammad, T.; Li, Y. Appropriate dissolved oxygen concentration and application stage of micro-nano bubble water oxygenation in greenhouse crop plantation. Agric. Water Manag. 2019, 223, 105713. [Google Scholar] [CrossRef]
  38. Oshita, S.; Boerzhijin, S.; Kameya, H.; Yoshimura, M.; Sotome, I. Promotion effects of ultrafine bubbles/nanobubbles on seed germination. Nanomaterials 2023, 13, 1677. [Google Scholar] [CrossRef]
  39. Lee, S.Y.; Jung, S.H.; Cho, A.R.; Shim, M.S.; Chung, Y.K.; Kim, Y.K. Germination and seedling growth response of sprouts and leafy vegetables after applying oxygen nanobubble water. J. People Plants Environ. 2021, 24, 609–617. [Google Scholar] [CrossRef]
  40. Zhang, F.; Wan, X.; Zheng, Y.; Sun, L.; Chen, Q.; Guo, Y.; Zhu, X.; Liu, M. Physiological and related anthocyanin biosynthesis genes responses induced by cadmium stress in a new colored-leaf plant Quanhong Poplar. Agrofor. Syst. 2014, 88, 343–355. [Google Scholar] [CrossRef]
  41. Wu, Q.; Su, N.; Zhang, X.; Liu, Y.; Cui, J.; Liang, Y. Hydrogen peroxide, nitric oxide and UV RESISTANCE LOCUS8 interact to mediate UV-B-induced anthocyanin biosynthesis in radish sprouts. Sci. Rep. 2016, 6, 29164. [Google Scholar] [CrossRef]
  42. Roitsch, T. Source-sink regulation by sugar and stress. Curr. Opin. Plant Biol. 1999, 2, 198–206. [Google Scholar] [CrossRef] [PubMed]
  43. Foyer, C.H.; Noctor, G. Oxidant and antioxidant signalling in plants: A re-evaluation of the concept of oxidative stress in a physiological context. Plant Cell Environ. 2005, 28, 1056–1071. [Google Scholar] [CrossRef]
  44. Rosa, M.; Prado, C.; Podazza, G.; Interdonato, R.; González, J.A.; Hilal, M.; Prado, F.E. Soluble sugars: Metabolism, sensing and abiotic stress: A complex network in the life of plants. Plant Signal. Behav. 2009, 4, 388–393. [Google Scholar] [CrossRef]
  45. Sharma, P.; Jha, A.B.; Dubey, R.S. Oxidative stress and antioxidative defense system in plants growing under abiotic stresses. In Handbook of Plant and Crop Stresses, 4th ed.; Pessarakli, M., Ed.; CRC Press: Boca Raton, FL, USA, 2019; pp. 93–136. [Google Scholar]
  46. de Pinto, M.C.; de Gara, L. Changes in the ascorbate metabolism of apoplastic and symplastic spaces are associated with cell differentiation. J. Exp. Bot. 2004, 55, 2559–2569. [Google Scholar] [CrossRef]
  47. Hunter, R.J. Zeta Potential in Colloid Science: Principles and Applications; Academic Press: Cambridge, MA, USA, 1981. [Google Scholar]
  48. Hiemenz, P.C.; Rajagopalan, R. Principles of Colloid and Surface Chemistry, 3rd ed.; Marcel Dekker: New York, NY, USA, 1997. [Google Scholar]
  49. Mamun, M.A.; Islam, T. Oxygenated Nanobubbles as a Sustainable strategy to strengthen plant health in controlled environment agriculture. Sustainability 2025, 17, 5275. [Google Scholar] [CrossRef]
  50. Zheng, Y.; Wang, L.; Dixon, M. An upper limit for elevated root zone dissolved oxygen concentration for tomato. Sci. Hortic. 2007, 113, 162–165. [Google Scholar] [CrossRef]
  51. Gill, S.S.; Tuteja, N. Reactive oxygen species and antioxidant machinery in abiotic stress tolerance in crop plants. Plant Physiol. Biochem. 2010, 48, 909–930. [Google Scholar] [CrossRef] [PubMed]
  52. Iijima, M.; Yamashita, K.; Hirooka, Y.; Yoshikatsu, U.; Yamane, K.; Kamimura, C. Ultrafine bubbles effectively enhance soybean seedling growth under nutrient deficit stress. Plant Prod. Sci. 2020, 23, 366–373. [Google Scholar] [CrossRef]
Figure 1. Root morphology variations with different UFB concentrations. (a) 100% UFB-MQ water, (b) 75% UFB-MQ + 25% MQ water, (c) 50% UFB-MQ + 50% MQ water, (d) 25% UFB-MQ + 75% MQ water, and (e) 100% MQ water (control).
Crops 06 00029 g001
Figure 2. Shoot morphology of rice seedlings grown under different UFB concentrations after 14 days of growth under nutrient-free conditions. (a) UFB-MQ water, (b) 75% UFB-MQ + 25% MQ water, (c) 50% UFB-MQ + 50% MQ water, (d) 25% UFB-MQ + 75% MQ water, and (e) MQ water (control).
Crops 06 00029 g002
Figure 3. Changes in (a) chlorophyll a, (b) chlorophyll b, (c) carotenoid, and (d) anthocyanin content in rice seedlings under different UFB treatments. Error bars show the standard errors, while the data are illustrated as means (n = 4). Statistically significant changes among treatments (p ≤ 0.05) are indicated by different letters, which are assigned according to Duncan’s test (T1: 100% UFB-Milli-Q water; T2: 75% UFB-MQ + 25% MQ water; T3: 50% UFB-MQ + 50% MQ water; T4: 25% UFB-MQ + 75% MQ water; T5: 100% Milli-Q water (control)).
Crops 06 00029 g003
Figure 4. (a) Hydrogen peroxide, (b) catalase, (c) peroxidase, and (d) ascorbate peroxidase changes in the plants in response to UFB treatments. Error bars show the standard errors, while the data are represented as means (n = 4). Different letters, assigned based on Duncan’s test, show significant differences among treatments (p ≤ 0.05). (T1: 100% UFB-Milli-Q water; T2: 75% UFB-MQ + 25% MQ water; T3: 50% UFB-MQ + 50% MQ water; T4: 25% UFB-MQ + 75% MQ water; T5: 100% Milli-Q water (control)).
Crops 06 00029 g004
Figure 5. Variations in (a) soluble sugar and (b) starch concentrations in rice plants in response to UFB treatment. The data are expressed as means (n = 4), with error bars representing the standard errors. Different letters, assigned based on Duncan’s test, show statistically significant differences among treatments (p ≤ 0.05). (T1: 100% UFB-Milli-Q water; T2: 75% UFB-MQ + 25% MQ water; T3: 50% UFB-MQ + 50% MQ water; T4: 25% UFB-MQ + 75% MQ water; T5: 100% Milli-Q water (control)).
Crops 06 00029 g005
Figure 6. The correlation matrix between variables. SFW—shoot fresh weight, RFW—root fresh weight, TFW—total fresh weight, RDW—root dry weight, SDW—shoot dry weight, TDW—total dry weight, TRL—total root length, RS—root shoot ratio, LRL—lateral/crown root length, SH—shoot height, NLR—number of lateral roots, SRL—specific root length, PRL—primary root length, chla—chlorophyll a, chlb—chlorophyll b, HP—hydrogen peroxide, CAT—catalase, POD—peroxidase, APX—ascorbate peroxidase, and SS—soluble sugar.
Crops 06 00029 g006
Table 1. Bubble parameters of UFB water.
ParameterUFBMQp-Value of Student’s t-Test
AverageStandard ErrorAverageStandard Error
Bubble concentration (Particles/mL)5.86 × 1074.83 × 1062.32 × 1072.22 × 1060.00016
Bubble size (nm)167.213.2182.120.50.56
Table 2. Physicochemical properties of the water parameters.
ParameterTreatments
T1T2T3T4T5
Dissolved oxygen (mgL−1)7.9 ± 0.0 a7.6 ± 0.0 b7.5 ± 0.0 b7.5 ± 0.0 b7.4 ± 0.0 b
Zeta potential (mV)−12.8 ± 0.2 d−8.7 ± 0.2 c−6.8 ± 0.7 b−6.6 ± 0.4 b−2.3 ± 0.6 a
Temperature (°C)26.9 ± 0.2 ab27.1 ± 0.1 a27.0 ± 0.2 ab26.5 ± 0.2 ab26.4 ± 0.1 ab
pH7.1 ± 0.0 a7.1 ± 0.0 a7.1 ± 0.0 a7.1 ± 0.0 a7.2 ± 0.1 a
The means (n = 3) and standard deviations are used to express the data. Statistically significant changes among treatments (p ≤ 0.05) are indicated by different letters, which are assigned according to Duncan’s test. (T1: 100% UFB-Milli-Q water; T2: 75% UFB-MQ + 25% MQ water; T3: 50% UFB-MQ + 50% MQ water; T4: 25% UFB-MQ + 75% MQ water; T5: 100% Milli-Q water (control)).
Table 3. Morphological changes in rice seedlings under different UFB concentrations.
Measured ParameterT1T2T3T4T5
Root
Primary root length (cm)14.2 ± 0.4 a11.7 ± 0.45 b10.0 ± 0.2 c8.7 ± 0.7 d7.5 ± 0.7 e
Crown root length (cm)10.2 ± 0.0 a8.6 ± 0.8 ab7.4 ± 0.3 b5.7 ± 0.8 bc4.9 ± 0.5 c
Total root length (cm)630.4 ± 44.9 a468.2 ± 68.0 b424.9 ± 38.3 bc392.5 ± 37.2 bc341.2 ± 2.6 c
Number of lateral roots4.2 ± 0.2 c4.4 ± 0.3 bc4.4 ± 0.2 bc5.0 ± 0.4 b5.9 ± 0.0 a
Specific root length (cm/g)32.5 ± 1.7 a25.4 ± 4.1 b24.8 ± 2.1 b23.7 ± 2.1 b21.8 ± 0.1 b
Root fresh weight (g)0.07 ± 0.0 a0.06 ± 0.0 b0.06 ± 0.0 a0.06 ± 0.0 c0.05 ± 0.0 c
Root dry weight (g)0.01 ± 0.0 a0.01 ± 0.00 a0.01 ± 0.0 b0.01 ± 0.0 b0.009 ± 0.0 c
Shoot
Shoot height (cm)15.9 ± 0.2 a13.2 ± 0.5 b12.6 ± 0.7 b11.3 ± 0.3 c10.2 ± 0.1 d
Shoot fresh weight (g)0.14 ± 0.0 a0.13 ± 0.0 b0.11 ± 0.0 c0.11 ± 0.0 c0.10 ± 0.0 d
Shoot dry weight (g)0.008 ± 0.0 a0.007 ± 0.0 a0.007 ± 0.0 ab0.006 ± 0.0 bc0.006 ± 0.0 c
Total dry weight (g)0.02 ± 0.0 a0.02 ± 0.0 b0.02 ± 0.0 c0.02 ± 0.0 d0.01 ± 0.0 e
Dry matter % 9.42 ± 0.0 a9.74 ± 0.0 a9.84 ± 0.1 a9.81 ± 0.3 a10.11 ± 0.0 a
The means (n = 20) and standard deviations are used to express the data. Statistically significant changes among treatments (p ≤ 0.05) are indicated by different letters, which are assigned according to Duncan’s test. (T1: 100% UFB-Milli-Q water; T2: 75% UFB-MQ + 25% MQ water; T3: 50% UFB-MQ + 50% MQ water; T4: 25% UFB-MQ + 75% MQ water; T5: 100% Milli-Q water (control)).
Disclaimer/Publisher’s Note: The statements, opinions and data contained in all publications are solely those of the individual author(s) and contributor(s) and not of MDPI and/or the editor(s). MDPI and/or the editor(s) disclaim responsibility for any injury to people or property resulting from any ideas, methods, instructions or products referred to in the content.