Article

Tolerance and Adaptability of Tomato Genotypes to Saline Irrigation

by
Carlos Eduardo Da Silva Oliveira
1,*,
Tiago Zoz
2,
Arshad Jalal
1,
Eduardo Pradi Vendruscolo
3,
Thiago Assis Rodrigues Nogueira
1,
Arun Dilipkumar Jani
4,* and
Marcelo Carvalho Minhoto Teixeira Filho
1
1
Department of Plant Protection, Rural Engineering and Soils, School of Engineering, São Paulo State University—UNESP-FEIS, Ilha Solteira 15385-000, SP, Brazil
2
University Unit of Mundo Novo, Department of Crop Science, State University of Mato Grosso do Sul—UEMS, Mundo Novo 79980-000, MS, Brazil
3
University Unit of Cassilândia, Department of Crop Science, State University of Mato Grosso do Sul—UEMS, Cassilândia 79540-000, MS, Brazil
4
Monterey Bay, Department of Biology and Chemistry, California State University, Seaside, CA 93955, USA
*
Authors to whom correspondence should be addressed.
Crops 2022, 2(3), 306-322; https://doi.org/10.3390/crops2030022
Submission received: 5 August 2022 / Revised: 20 August 2022 / Accepted: 24 August 2022 / Published: 29 August 2022

Abstract

:
High salt concentration in irrigation water is often a limiting factor to tomato production in Brazil. However, there is limited information available regarding the tolerance of tomato genotypes to saline irrigation. An experiment was conducted in a protected environment using a randomized block design with four replications. Treatments consisted of 12 tomato genotypes cultivated in an environment with varying levels of salt stress. Moderate and severe salt stress affected plant height, transversal and longitudinal diameter of fruit, fresh mass, yield, and number of tomato fruit per plant. Cluster analysis, stability, and adaptability provided the best estimates to identify the most adaptable genotype to saline stress, with the genotypes Maestrina, Onix, Pizzadoro, and Shanty being the best adapted to moderate and severe saline stress conditions. The genotypes Maestrina, Onix, Pizzadoro, and Shanty were identified as most adaptable to and stable under salt stress. Sodium absorption increased as irrigation salinity increased. In addition, P, K, and Ca concentration decreased under salt stress, which caused damage to all yield components and plant nutrition. The genotype Onix was more tolerant to the effects of moderate saline irrigation, while the genotypes Sheena, Sperare, Santa Clara, IPA 6, and Dominador had lower losses under severe salt stress conditions.

1. Introduction

Vegetable production can be considerably more profitable than grain crop production in some regions of Brazil [1]. However, excess salts in soil or irrigation water hamper sustainability of vegetable production, especially under protected cultivation conditions [2]. The expansion of vegetable growing areas depends on use of irrigation in protected cultivation. Climatic instability can reduce precipitation during crop cycles, which has led to concerns about the quality of water to be used in irrigation, since better quality water is used for human consumption [3]. Due to water scarcity, producers are often forced to use low-quality water (high concentration of salts) to irrigate crops [4]. Saline water has adverse effects on crop yield, physical soil conditions, and soil fertility, as well as the performance of the irrigation system [5].
Irrigation with saline water in crop cultivation promotes soil salinization and hinders the success of crops [6]. Saline water with electrical conductivity (EC) of 1.0 dS m−1 can reduce tomato yields by 10%; however, these losses increase to 50% when irrigation water has EC of 4.0 dS m−1 [7]. The frequent use of saline water for irrigation causes physiological disturbances in plants, making cultivation difficult. The salinity caused by NaCl impairs absorption of nutrients (Ca2+ and K+) and water and reduces crop yields [8]. The Na+ enters through roots into plants and is transported from the cytoplasm to apoplastic space and leads to an enhanced electrochemical gradient across the tonoplast, increased transport and accumulation of toxic ions (Na) in the vacuole. The Na present in the vacuole is stored in the vacuolar space and does not affect the physiological processes of the plant even though it is present in plant tissues. It then spreads in the vacuole to develop the process of tissue tolerance [9], which is the capacity of plant cells to continue normal functioning even with high internal Na+ concentrations in tissue without damages [10].
Extensive studies have been carried out in breeding programs to improve plant tolerance to salt stress; however, genetic and physiological complexity has limited the success of such research [11]. Plant growth under saline conditions varies according to the genetic makeup of each species and therefore, several methods are adopted to study different tomato genotypes under different environmental conditions. Annicchiarico [12] evaluated an average distance between genotypes in response to environments and provided a confidence index (Ii). However, this method has been questioned in stressful environments where genotypes with greater adaptability were not effectively selected and caused physiological disturbances. In this sense, this method was improved by considering relationship between favorable environments (Iif) and unfavorable environments (Iid) to generate an Ii that generalizes environments to provide simple and reliable results of genotype adaptability and stability [13]. The analysis of stability and adaptability were carried out all over the world to evaluate genotype tolerance levels under salt stress [11,14,15,16,17]. The newly generated genotypes with the evolution of plant breeding programs are more responsive to ideal growing conditions and sensitive to stressful conditions. Thus, selection of genotypes with greater adaptability and stability under salt stress is indispensable for future vegetable production in many environments [1].
Soil salinization is a major challenge for agriculture, mostly caused by climate alterations, irrigation water having trace amounts of NaCl, and sea water that adversely affects plant growth and production. Considering research gap on genotypes and salt stress conditions, in the current study, we hypothesized that it would be possible to select salt stress-tolerant tomato genotypes on the basis of agronomic and nutritional characteristics using an index of stability and adaptability between normal and stressful environments. Our objective was to use agronomic and nutritional characteristics of tomato under moderate and severe salt stress conditions to select genotypes with greater adaptability and stability under protected environmental conditions.

2. Materials and Methods

2.1. Experimental Characterization and Conduction

The experiment was carried out from July to December, 2019 in a greenhouse. The nursery was setup on 1 July 2019 in Styrofoam trays containing 128 cells with a volume of 40 cm³ and filled with commercial substrate Maxxi® suitable for tomato seedling production. The characteristics of the medium were: pH (H2O) = 6.8, pH (CaCl2) = 5.6, organic matter = 200 g dm−3, P (Mehlich−1) = 50.8 mg dm−3, K+ = 386.0 mg dm−3, K+ = 1.04 cmolc dm−3, Ca2+ = 15.51 cmolc dm−3, Mg2+ = 10.45 cmolc dm−3, H + Al = 4.00 cmolc dm−3, Al3+ = 0.00 cmolc dm−3, cation exchange capacity = 31.00 cmolc dm−3, sum of bases = 27.00 cmolc dm−3, Zn = 22.50 mg dm−3, Cu = 0.20 mg dm−3, Fe = 109.00 mg dm−3, Mn = 54.30 mg dm−3, B = 1.33 mg dm−3, S = 15.20 mg dm−3, base saturation = 87.1%, and electrical conductivity (EC) of the extract = 1.23 dS m−1.
The seedlings were transplanted on 7 August 2019 at 37 days after sowing and had 3 to 4 completely expanded leaves. Seedling cultivation was carried out in double fiber cement channels (0.4 m × 0.6 m × 8.0 m) with 1.9 m³ of soil. Soil was classified as an Entisol with 12.5% clay, 7.5% silt, and 80% sand according to the methodology used by Santos et al. [18] and chemical characteristics of; pH (CaCl2) = 5.6, organic matter = 33.5 g dm−3, P (Mehlich−1) = 636 mg dm−3, K+ = 1792 mg dm−3, K+ = 4.58 cmolc dm−3, Ca2+ = 4.60 cmolc dm−3, Mg2+ = 2.20 cmolc dm−3, H + Al = 3.30 cmolc dm−3, Al3+ = 0.01 cmolc dm−3, cation exchange capacity = 14.70 cmolc dm−3, sum of bases = 11.38 cmolc dm−3, Zn = 43.7 mg dm−3, Cu = 8.1 mg dm−3, Fe = 40.0 mg dm−3, Mn = 54.0 mg dm−3, B = 2.02 mg dm−3, S = 241.0 mg dm−3, base saturation = 77.5%, and EC of the extract = 0.58 dS m−1.
The seedlings were transplanted in double rows of 1.0 m length, 0.4 m apart, plant to plant distance of 0.3 m and a total population of 23810 plants ha−1. Irrigation and fertigation were applied using a drip irrigation system with a dripper for each plant, while irrigation was managed with the help of a soil moisture measuring device using t WaterMark Soil Moisture Sensors manufactured by Irrometer. The tension adopted for the beginning watering period was based on previous work by Marouelli et al. [19]. The plants were held erect using a string, while cultural treatments such as stakes, sprouts and pest and disease control were carried out as recommended for the crop [20]. The top pruning of the branches was performed at the 7th bunch of the plant. Temperature, radiation, and relative air humidity data were obtained from a meteorological station installed inside the greenhouse (Figure 1).
All treatments were initially fertilized with 55 mg dm−3 of N, 340 mg dm−3 of P, 80 mg dm−3 of K, 80 mg dm−3 of Ca, 32.5 mg dm−3 of Mg, 30 mg dm−3 of S, 45 mg dm−3 of Si, 2.75 mg dm−3 of Zn, 0.5 mg dm−3 of B, 1.5 mg dm−3 of Mn, 0.25 mg dm−3 of Cu. Fertilization after seedling transplanting was carried out in three different growth phases via fertigation. 1). The fertigation was performed at initiation of final growth with 154.8 mg dm−3 of N and 300 mg dm−3 Ca at EC of 1.25 dS m−1; 72 mg dm- 3 of N and 360 mg dm−3 of P at EC of 0.35 dS m−1; 96 mg dm−3 of N and 360 mg dm−3 of K at EC of 0.32 dS m−1 and a total EC of fertigation was 1.92 dS m−1 applied from 78 to 112 days. The electrical conductivity used in fertigation was not considered to cause irrigation salinity (NaCl); however, cultivation in saline water requires fertilizer application even if it increases EC of water. Weekly foliar application of 0.0015% N and 0.002% Ca was carried out to meet the need of calcium and avoid blossom end rot.
Soil samples were randomly collected in cultivation beds every 30 days after transplanting to characterize soil salinization from EC of the extract. Final soil characteristics were as follows: pH (CaCl2) = 6.6, organic matter = 28.0 g dm−3, S = 142.0 mg dm−3, P (Mehlich−1) = 578 mg dm−3, K+ = 10.5 cmolc dm−3, Ca2+ = 15.3 cmolc dm−3, Mg2+ = 3.3 cmolc dm−3, H + Al = 1.1 cmolc dm−3, Al3+ = 0.0 cmolc dm−3, cation exchange capacity = 30.0 cmolc dm−3, sum of bases = 29.1 cmolc dm−3, Zn = 21.7 mg dm−3, Cu = 13.7 mg dm−3, Fe = 34.0 mg dm−3, Mn = 3.6 mg dm−3, B = 0.64 mg dm−3, base saturation = 96%, and electrical conductivity of 0.35 dS m−1. Moderate salt stress soil characteristics = pH (CaCl2) = 6.3, organic matter = 28.0 g dm−3, S = 261.0 mg dm−3, P (Mehlich−1) = 596 mg dm−3, K+ = 12.7 cmolc dm−3, Ca2+ = 15.3 cmolc dm−3, Mg2+ = 3.3 cmolc dm−3, H + Al = 1.5 cmolc dm−3, Al3+ = 0.0 cmolc dm−3, cation exchange capacity = 21.3 cmolc dm−3, sum of bases = 19.8 cmolc dm−3, Zn = 22.5 mg dm−3, Cu = 12.9 mg dm−3, Fe = 30.0 mg dm−3, Mn = 4.0 mg dm−3, B = 0.77 mg dm−3, base saturation = 93.0%, and electrical conductivity of 2.64 dS m−1. Severe salt stress soil characteristics = pH (CaCl2) = 5.6, organic matter = 27.0 g dm−3, S = 241,0 mg dm−3, P (Mehlich−1) = 606 mg dm−3, K+ = 12.7 cmolc dm−3, Ca2+ = 13.8 cmolc dm−3, Mg2+ = 2.6 cmolc dm−3, H + Al = 1.2 cmolc dm−3, Al3+ = 0.0 cmolc dm−3, cation exchange capacity = 18.7 cmolc dm−3, sum of bases = 29.1 cmolc dm−3, Zn = 22.5 mg dm−3, Cu = 14.9 mg dm−3, Fe = 40.0 mg dm−3, Mn = 5.5 mg dm−3, B = 0.79 mg dm−3, base saturation = 94.0%, and electrical conductivity of 3.42 dS m−1.

2.2. Experimental Design

The experiment was conducted using a randomized complete block design with four replications. The treatments consisted of 3 salt stress levels and 12 tomato genotypes. These genotypes were selected from two widely cultivated groups (salad and Italian). The genotypes Santa Clara 5800 (110 days and indeterminate), Coração de Boi (120 days and indeterminate), IPA 6 (115 days and determined), Maestrina (125 days and indeterminate), Onix (125 days and indeterminate), and Dominant (120 days and indeterminate) belong to the salad group of tomato. The Italian group of tomato genotypes consists of Shanty (120 days and determined), Sheena (115 days and determined), Pizzadoro (125 days and indeterminate), Totalle (120 days and indeterminate), Sperare (115 days and indeterminate), and Pizzamonty (120 days and indeterminate).
The second factor consisted of cultivation environments with three levels of irrigation water salinity S1 = control- irrigation with water without additional NaCl and had EC of 0.02 dS m−1 (control) + 1.92 dS m−1 (fertigation) = 1.94 dS m−1, S2 = moderate salinity with EC of 1.5 dS m−1 (NaCl) + 1.92 dS m−1 (fertigation) = 3.42 dS m−1, S3 = severe salinity with an EC of 3.0 dS m−1 (NaCl) + 1.92 dS m−1 (fertigation) = 4.92 dS m−1. This factor was based on low quality water irrigation, which was added with EC as mentioned for fertigation. The preparation of water with different levels of salinity was performed according to the equation: EC = 0.1676 + 2.0193 QNaCl (R² = 0.999; p = 0.01). Where EC = electrical conductivity of the solution (dS m−1), and QNaCl = amount of NaCl (g L−1) proposed by Oliveira et al. [21].

2.3. Traits

The number of fruits per bunch per plant, plant height, transversal fruit diameter, longitudinal fruit diameter, average fruit weight, leaf chlorophyll index, fruit yield, and leaf concentration of N, P, K, Ca, and Na were evaluated during experiment. The number of fruits per plant was counted at harvest. Plant height was determined from ground level to the insertion of the last leaf. The transversal and longitudinal diameter of fruit was determined at the time of harvest using a digital caliper (Park Tool DC1—150 mm) with a ±0.01 mm degree of accuracy. Fruit weight was determined using a semi-analytical scale with two decimal places at the time of harvest. Fruit yield (kg m−2) was estimated from the production per plant (kg plant−1), considering the spacing between plants and rows. All evaluations were performed only on fruit with commercial classification in both groups (salad and Italian) and having a transversal diameter above 40 mm. The leaf chlorophyll index (LCI) was determined at flowering stage in four tomato plants per plot with a portable nondestructive chlorophyll Falker meter (ClorofiLOG®—model CFL—1030 Falker). All leaves were collected at complete maturity stage (most of the fruits close to harvest) in each plot, dried at 60 °C for 72 h and ground in a Willey-type mill with a 1 mm opening sieve and packed in identified plastic bags. All samples were used to determine concentrations of N, P, K, Ca and Na according to methodology of Malavolta et al. [22].

2.4. Statistical and Multivariate Analysis

All variables presented normal distribution and homogeneous variances and were submitted to analysis of variance (ANOVA). The significance of means in the ANOVA was tested by an F test at 5% probability. The means related to tomato genotypes were grouped by the clustering test proposed by Scott-Knott at 5% probability level.
The genetic divergence analysis was performed using the Tocher optimization clustering method [23]. The Euclidean distance and Ward’s minimum variance method were performed using Action Stat Pro® Software (version 3.5) for Windows (Estatcamp—Statistical Consulting, Campinas, SP, BRA). The 50% similarity value was used as standard for defining and separating salt stress tolerant groups of tomato genotypes as already used in common bean [24], soybean [25], and tomato genotypes [21].
The heat-map was developed by calculating adaptability and stability of each trait as described by Schmildt et al. [13]. Overall recommendations are made on the basis of lowest Pi estimates for each trait according to the following equations:
General   environment   I i = y ¯ i . Z ( 1 α ) ( σ i . / n )
Favorable   environments   I i f = y ¯ i f Z ( 1 α ) ( σ i f / f )
Unfavorable   environments   I i d = y ¯ i d Z ( 1 α ) ( σ i d / d )
where: 1 − α = 95% and Z = 1.6449 according to Annicchiarico [12]; f = favorable environments; d = unfavorable environments; Ii = confidence index; Iif = confidence index of favorable environments; and Iid = confidence index of unfavorable environments [26]. The corrplot package was used to evaluate relationships among tomato genotypes, productive components, fruit yield, and leaf nutrient concentrations with R software [27].

3. Results

3.1. Tomato Growth and Fruit Yield under Salt Stress

There was a genotype by salt stress effect on the number of fruit (p = 0.0026) and commercial fruit weight (p = 0.00001, Table 1). The largest number of commercial fruit per bunch (NCF) was noted in the control compared to moderate and severe salt stress for all genotypes except Ipa 6 where NCF was not affected by moderate salinity level. Onix was observed with 20% higher NCF as compared to other genotypes. Coração de Boi, Ipa 6, Onix and Totalle had 8% higher NCF than other genotypes under moderate salinity conditions, while Coração de Boi and Pizzamonty were noted with 10% higher NCF under severe salinity in relation to other genotypes (Table 1).
Fresh commercial fruit weight (CFW) was higher in control treatments of all genotypes than under severe salt stress conditions. The CFW of Onix increased by 25% and 26% as compared to other genotypes in the control and moderate salinity conditions, respectively. In addition, Maestrina, Onix, Shanty, and Sheena produced 16% greater CFW under severe salinity conditions than other genotypes (Table 1).
There was a genotype by salt stress effect on the longitudinal diameter (p = 0.009) and transversal diameter (p = 0.01) (Table 2). The largest transversal diameter was observed in the fruit of Coração de Boi, Ipa 6, Maestrina and Onix as it was 11% higher than others’ genotypes in control treatments, 10% in moderate salinity, and 7% under severe salinity stress. The largest fruits longitudinal diameters were observed in genotypes Shanty, Sheena, and Totalle being 9% larger longitudinal diameter than other genotypes in all three saline conditions. The greatest transversal and longitudinal diameter were observed in the treatments without salt stress in relation to other salt stress conditions (Table 2).
There was an interaction between genotype and salt stress levels on plant height (p = 0.003) and fruit yield (p = 0.00001, Table 3). The plant height of Coração de Boi, Maestrina, Onix and Santa Clara increased by 27% under control treatments in relation to other genotypes. The IPA 6, Shanty and Sheena had 40% lower plant height under control and moderate salinity conditions. The plant height of Pizzadoro and Totalle was affected by severe salt stress.
The greatest fruit yield was observed under the control. Onix had a 24% greater fruit yield than Maestrina and was the second highest yielding with 75% higher productivity than all other genotypes under the control. The Onix genotype had 47% greater fruit yield than other genotypes. However, Onix, Maestrina, Pizzamonty, Coração de Boi, Shanty, and Sheena had 14% higher fruit yield under severe salinity conditions in relation to other genotypes (Table 3).

3.2. Effect of Salt Stress on Chlorophyll and Nutrient Concentrations in Tomato Genotypes

There was an interaction between genotypes and salt stress levels for the LCI (p = 0.002) and N-Concentration (p = 0.0018) (Table 4). The Increasing irrigation salinity affected LCI in all genotypes, except Coração de Boi and Dominador, which were not affected by moderate salt stress. Pizzadoro, Pizzamonty and Onix had 5% higher LCI and leaf N concentration than other genotypes under the control. Moderate stress conditions resulted in 5% higher LCI and N-concentration in genotypes Coração de Boi, Maestrina, Onix, Shanty, and Totalle. In addition, Onix was observed with 10% higher LCI and leaf N concentration under severe salinity (Table 4).
There was an interaction between genotypes and salt stress levels for the leaf P-Content (p = 0.00001) and K-Concentration (p = 0.00002) (Table 4). Leaf P concentration was higher under the control than under severe salt stress. The P concentration of Santa Clara, Shanty and Sperare was 17, 47 and 15% higher under moderate stress than under the control and 50, 51, and 54% higher under moderate stress as compared to severe salt stress conditions, respectively. IPA 6 had 71% higher P concentration under the control as compared to severe salt stress conditions. IPA 6 was observed to have 45% higher P concentration under moderate salt stress in relation to other genotypes under the control. IPA 6 and Shanty were noted with 16% higher P concentration in relation to others under moderate salt stress, and IPA 6 was 11% higher in relation to others under severe salt stress. Coração de Boi, Santa Clara, Sheena, and Sperare were observed with 119, 19, 19, and 9% higher leaf K concentration under the control in relation to severe salt stress, respectively. The K concentration of Maestrina, Onix, and Shanty increased by 18, 15, and 14%, respectively, under moderate salt stress in relation to severe salt stress. The Coração de Boi was noted with 25% higher K concentration in relation to other genotypes under the control. In addition, the K concentration of Dominador increased by 45% in relation to other genotypes under severe salt stress (Table 4).
There was a genotype by salt stress effect on leaf Ca-Content (p = 0.0002) and Na-Concentration (p = 0.0001) (Table 4). Leaf Ca concentration was higher in all genotypes, except Sheena and Sperare, under control conditions in relation to severe salt stress conditions. Sperare was observed with highest Ca concentration under moderate and severe salt stress. Severe salt stress impaired absorption and translocation of Ca in tomato leaves in all genotypes, except Sperare and Sheena. The opposite occurred for leaf Na concentration where the highest Na concentration was observed under severe and moderate salt stress conditions. IPA 6, Maestrina, Onix, Santa Clara, and Shanty were noted with higher Ca concentration under control conditions. However, Shanty, Sheena, and Sperare were observed with highest Ca concentration under moderate salt stress conditions. There was no difference in Na concentration between genotypes under the control. The Na concentration of Maestrina and Coração de Boi were 90 and 59% higher under moderate salt stress conditions in relation to other genotypes. In addition, Na concentration of Maestrina, Pizzadoro, and Sheena was 16% higher under severe salt stress conditions in relation to other genotypes. The Na concentration increased by approximately 177 and 539% under moderate and severe stress, respectively, in relation to the control (Table 4).
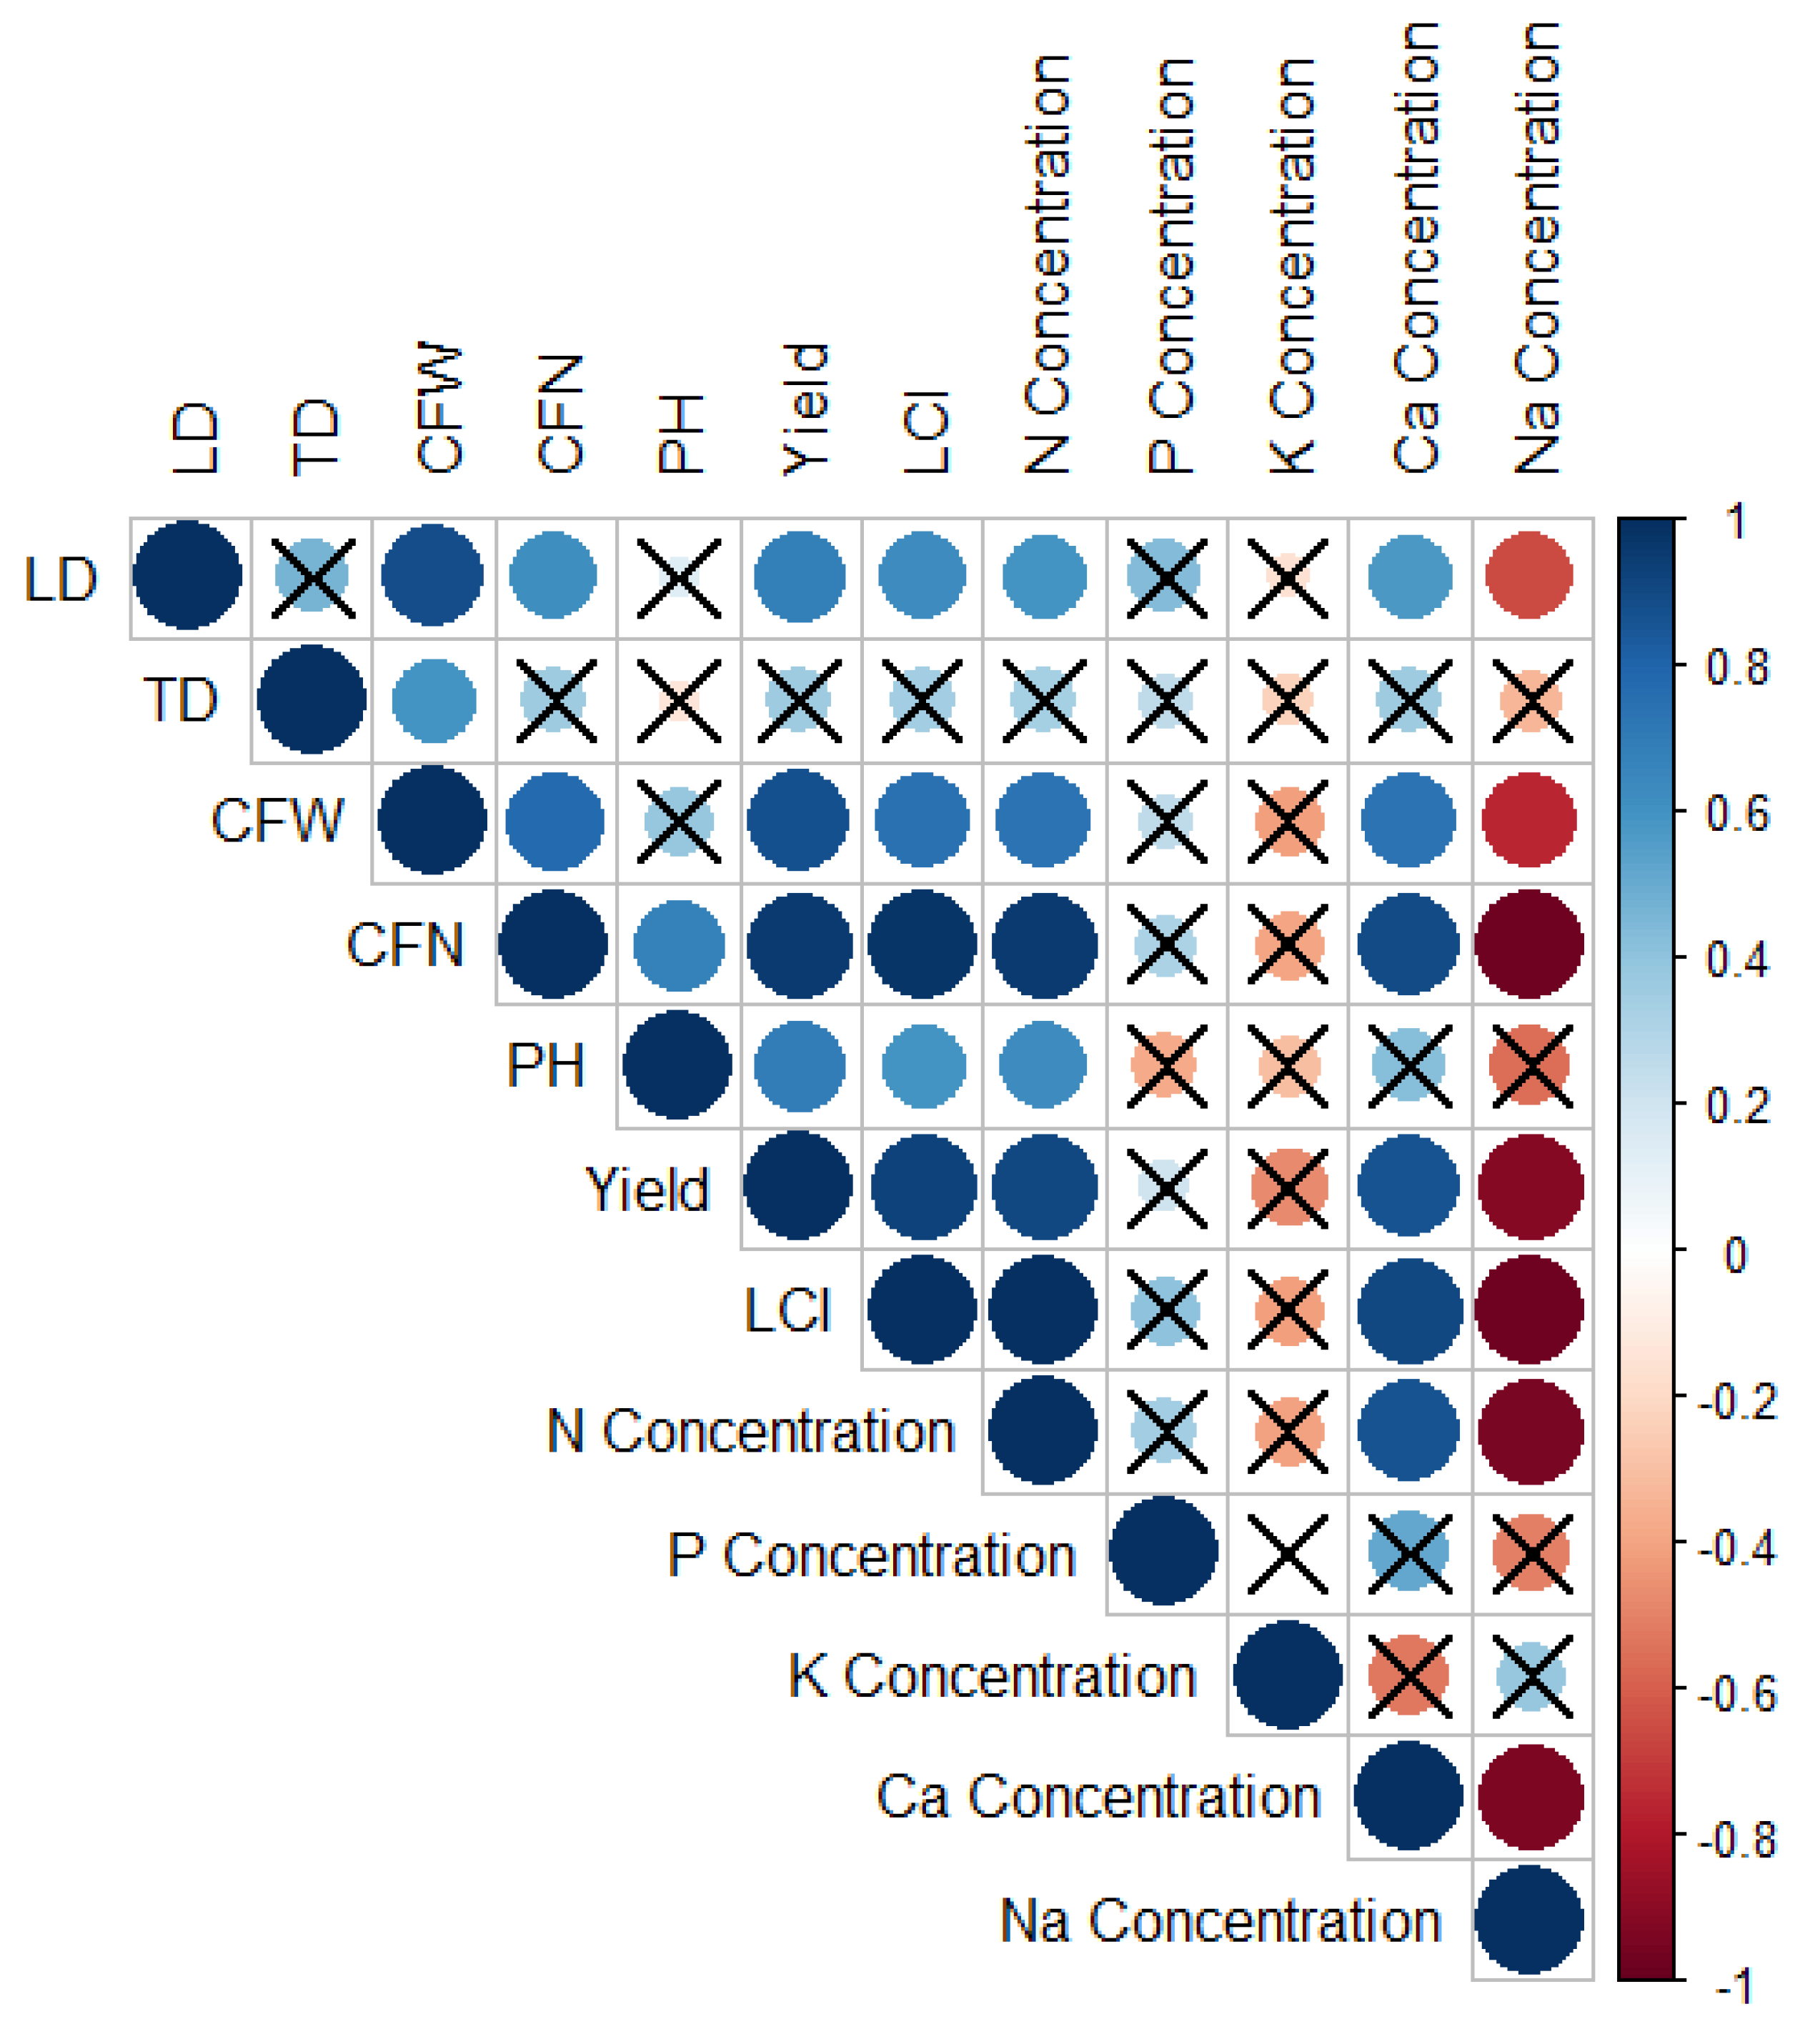
There was a positive and significant correlation between LD and CFW, CNF, YIELD, LCI, and N-concentration, while a negative and significant correlation with Na-concentration was also observed. The plant height had a significant and positive correlation with CNF, YIELD, LCI, and N-concentration. Fruit yield and LCI had a positive correlation with LD, CFW, PH, and Ca-concentration and a negative correlation with Na concentration. Nitrogen concentration had a significant and positive correlation with LD, CFW, CNF, PH, fruit yield, LCI, and Ca concentration and a negative correlation with Na concentration. Calcium concentration was negatively correlated with Na concentration and positively correlated with CFW, CNF, YIELD, LCI, and N concentration (Figure 2).

3.3. Cluster Analysis

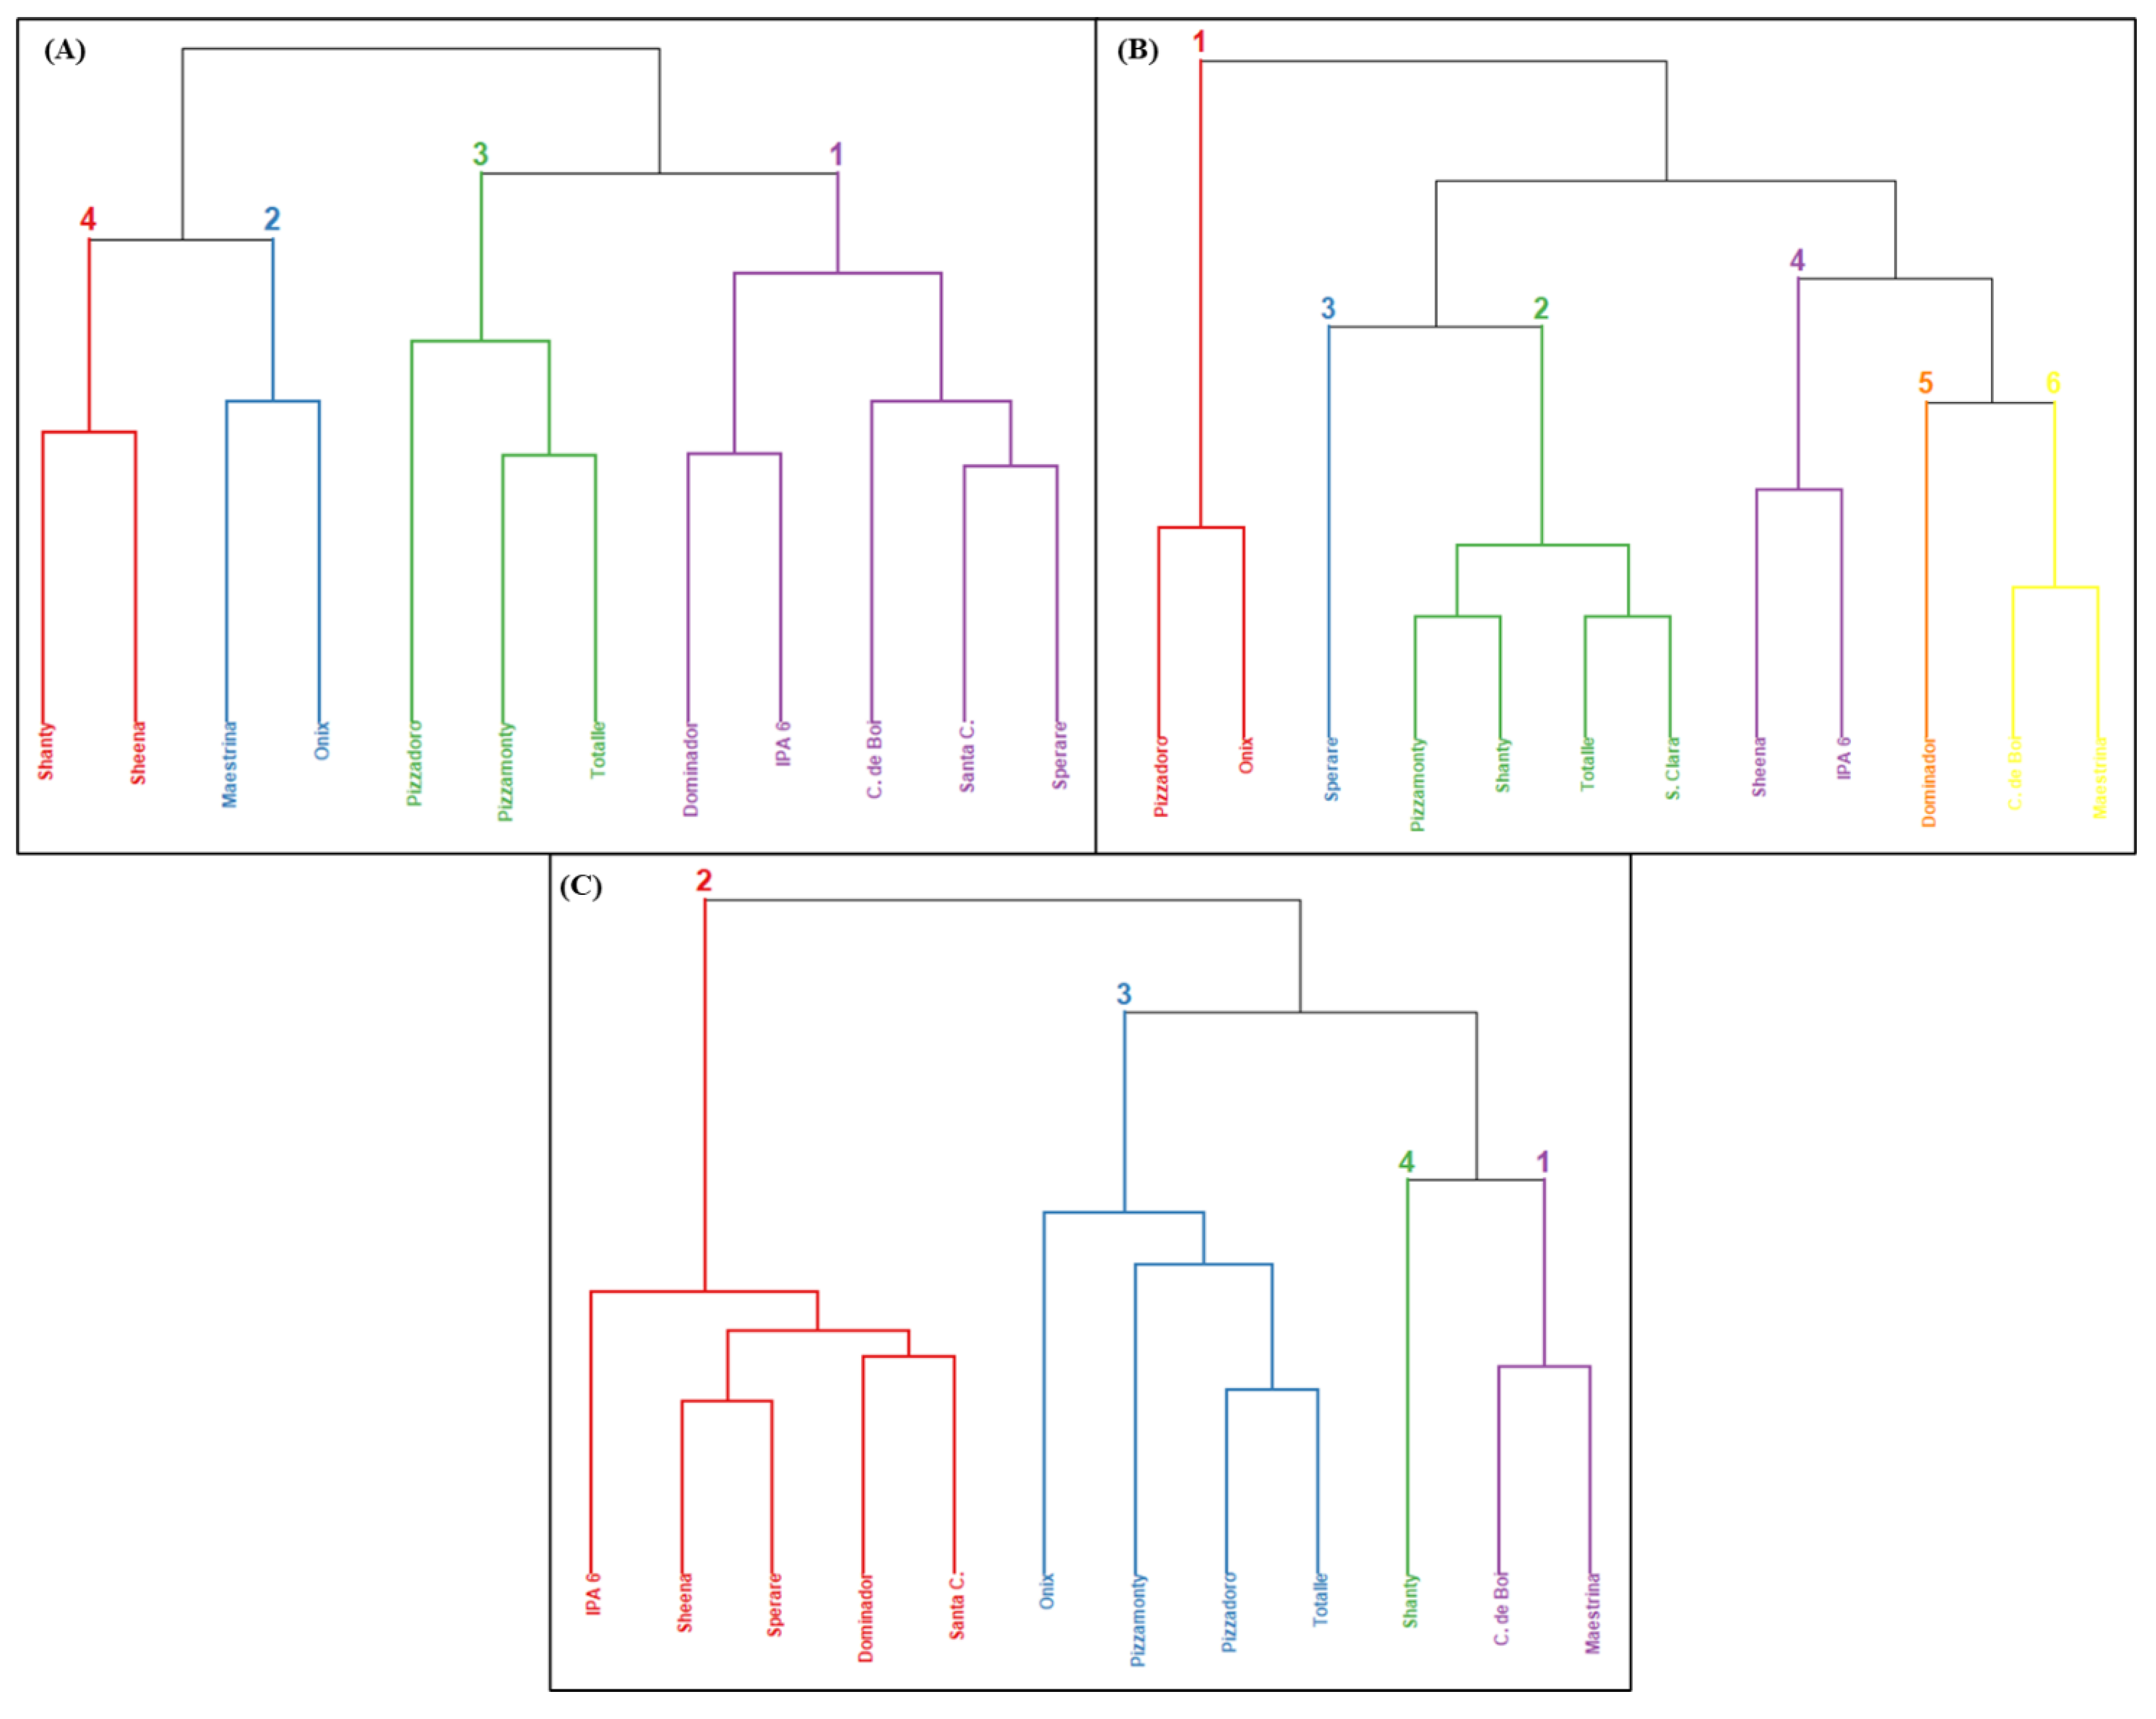
Shanty and Sheena (Group-4) were observed with greater genotypic distance from Dominador, IPA 6, Santa Clara, Coração de Boi, and Sperare (Group-1), which were noted with lowest yields under the control and were most similar with genotypes of Group-3 (Pizzadoro, Pizzamonty, and Totalle). The genotypes of Group-2 (Onix and Maestrina) were most similar to genotypes from Group-4 (Figure 3A).
The cluster distance of all evaluated traits indicated that Onix (Group-3) had greater tolerance to moderate salt stress and greater genotypic distance from Dominador, Santa Clara, Totalle, Sperare, and Sheena (Group-2) which had greater sensitivity to moderate salinity and greater similarity with Group-4 genotypes. However, the genotypes of Group-1 (Shanty, Coração de Boi and Maestrina) had greater similarity with Group-3 (Figure 3B).
Four groups of similarity were formed under severe salt stress conditions on the basis of greater dissimilarity between the genotypes of Group-1 (Coração de Boi and Maestrina) and Group-3 (Sheena, Sperare, Santa Clara, IPA 6, and Dominador). The genotypes of Group-1 were more sensitive to severe salt stress conditions due to higher losses compared to control conditions. In addition, genotypes of Group-2 were moderately tolerant to severe salt stress where yields close to or greater than 50% were demonstrated with greater genotypic stability under stressful conditions (Figure 3C).

3.4. Analysis of Adaptability and Stability under Stress Conditions

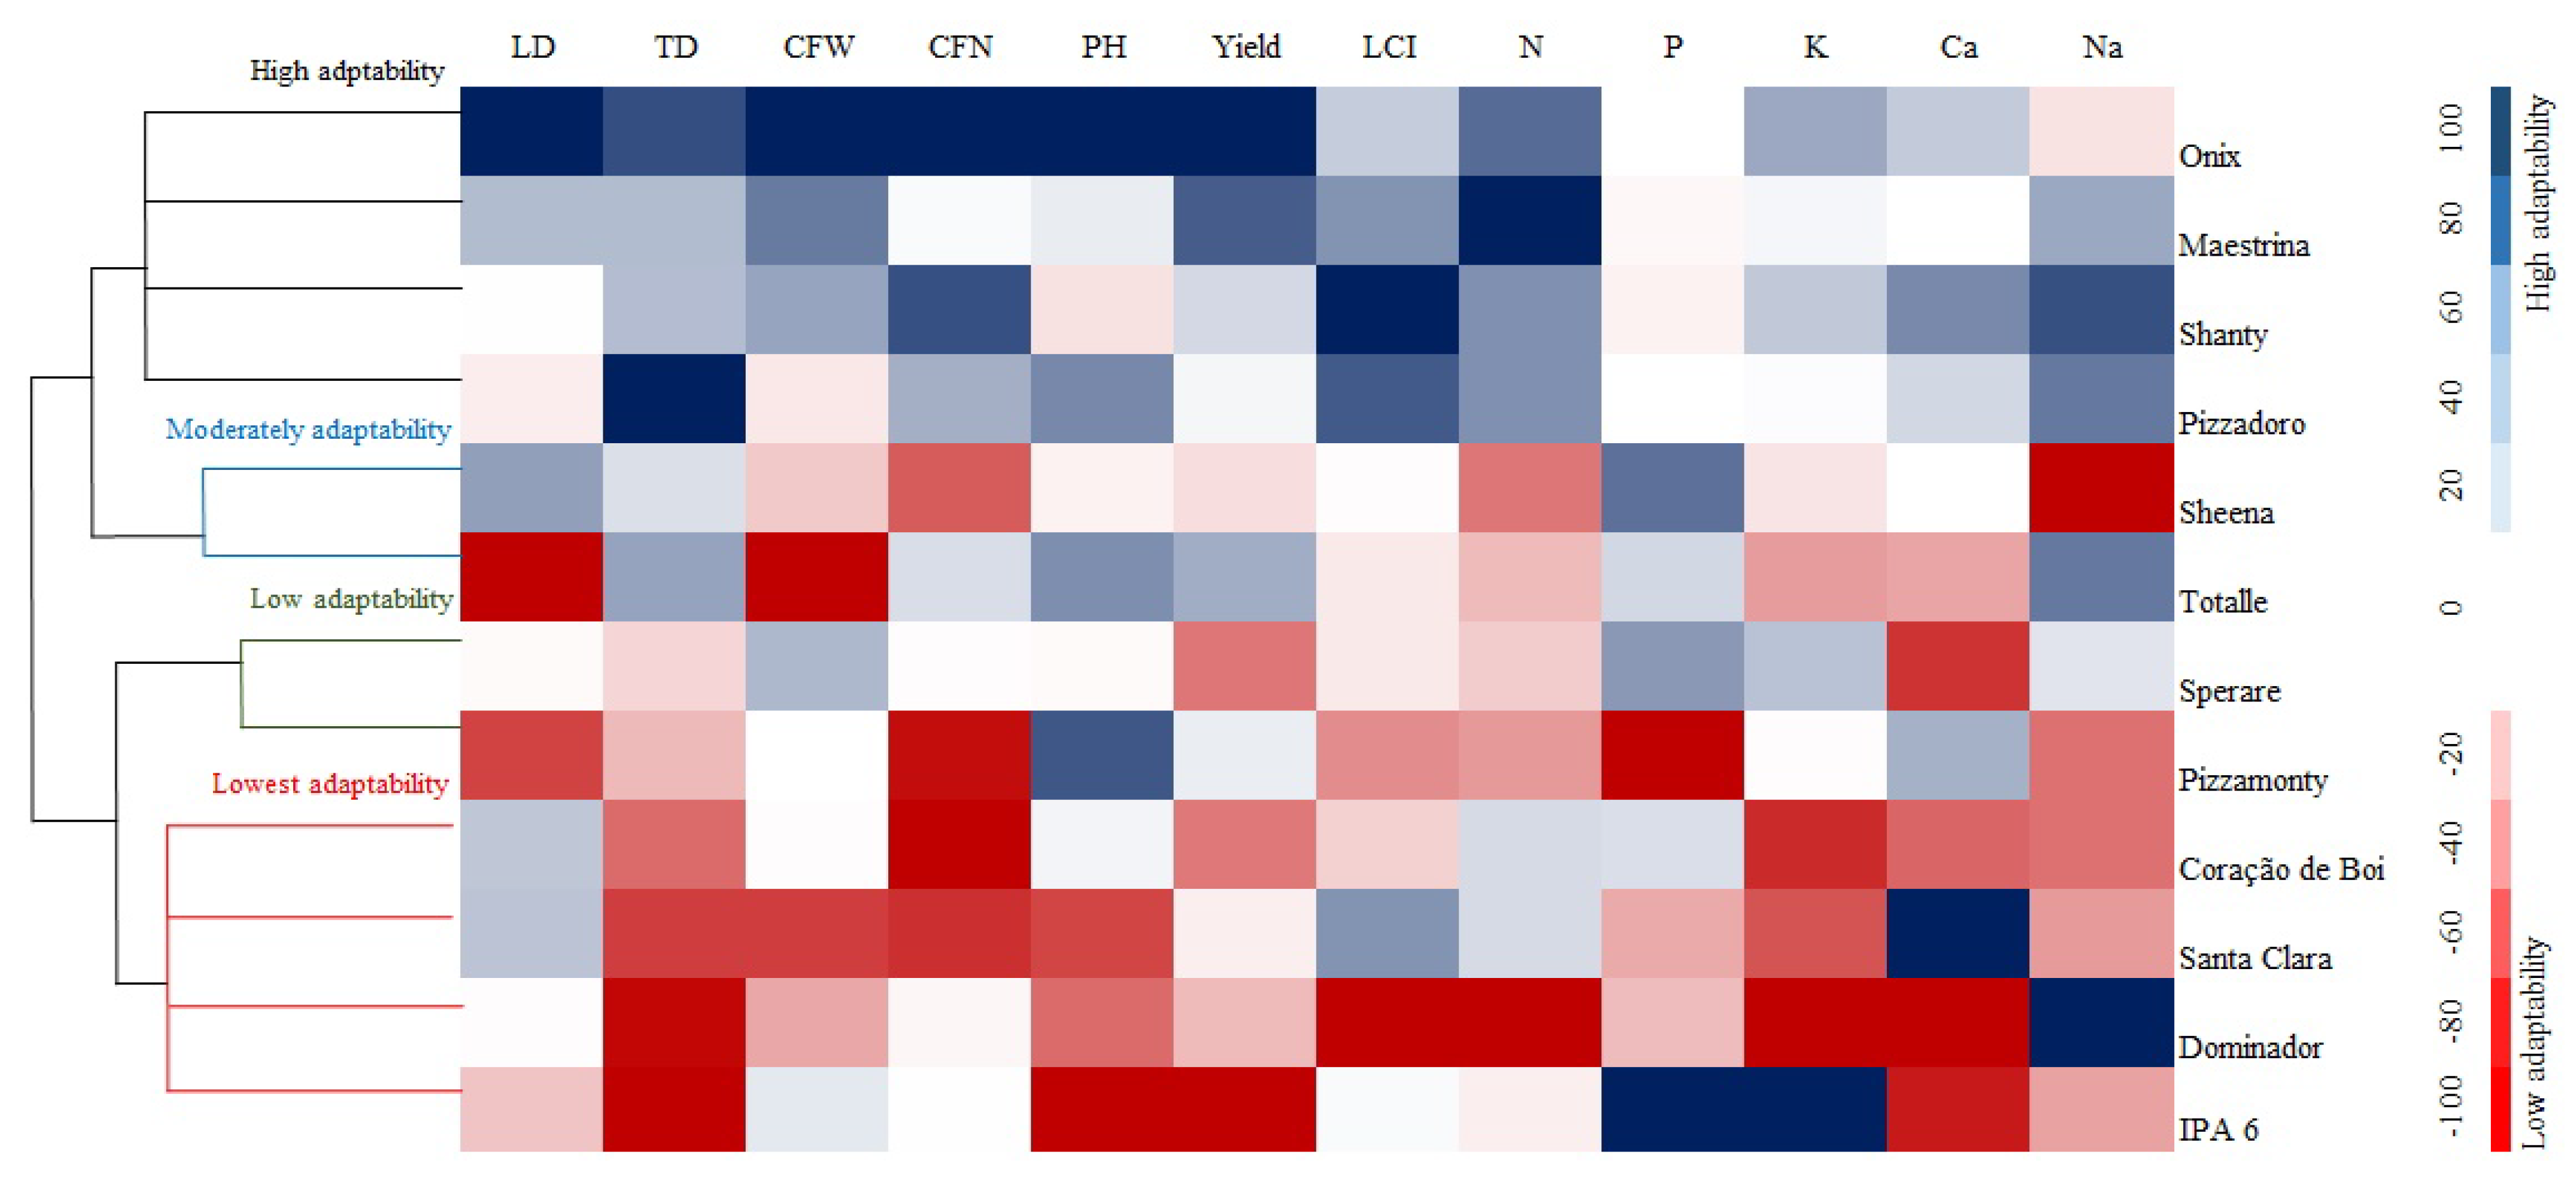
Onix, Maestrina, Shanty, and Pizzadoro were observed with adaptability and stability above 50% on the basis of TD, CFW, CNF, fruit yield, LCI, N concentration, K concentration, Ca concentration, and Na concentration. Onix, Maestrina, and Shanty were highly ranked even though, they had highest confidence indexes (Ii). Onix, Maestrina, Totalle, Coração de Boi, Sperare, and Pizzamonty were noted with highest Ii values and greater stability and adaptability for PH in the tested environments. The characteristics related to fruit yield can easily be altered by environmental effects and making it difficult to find stability in stressful environments. However, fruit yield variables with greater environmental dependence and highest Ii values were observed in Onix, Maestrina, Sheena, Shanty, and Pizzadoro, which had a greater adaptability and stability to unfavorable environments. The highest Ii values were verified by Onix, Shanty, Pizzadoro, Totalle, Sperare, and Dominador for Na concentrations with greater adaptability and stability in all three environments that allowed greater leaf Na accumulation. It enables greater absorption of other nutrients and water to increase tolerance to salt stress. Onix, Maestrina, Shanty, Pizzadoro, Sheena, and Santa Clara were observed with greater adaptability for LCI which stood with Coração de Boi for N-concentration and allowed for selecting genotypes with higher chlorophyll concentration and N uptake by tomato plants (Figure 4).

4. Discussion

Salinity commonly affects reproductive characteristics of tomato plants by hindering water uptake due to excess salts, and it causes abortion of flowers and fruit. Salinity also affects fruit size and weight and increases the number of non-commercial fruit that could drastically reduce tomato fruit yield [28]. The number of fruits per bunch was affected by severe salinity in all genotypes as compared to the control. The number of commercial fruits of IPA 6 were not affected by severe salt stress, while the other genotypes were harmed even at moderate salt stress conditions (Table 1). Previous research has shown that salinity can affect the number of tomato fruit by increasing flower abortion and reducing ovule and pollen fertility [29]. Onix had more fruit than other genotypes in control treatments, while Totalle, Onix, IPA 6, and Coração de Boi were observed with larger amounts of commercial fruit under moderate salinity. Both Coração de Boi and Onix were less affected by severe salinity stress than other genotypes and produced more fruit than others (Table 1), which aligns with previous work that reported significant genetic variability regarding salinity tolerance depending on the species and/or variety of plants [30]. The reduction in loss of fruit per plant may be due to the type of resistance to salinity and even developing embryo under stress-induced sterility [31].
Saline water irrigation harmed tomato fruit yield and also contributed to nutrient imbalance in plants due to the effect of imbalanced cation absorption. Siddiky et al. [32] reported that there was a significant reduction in fruit weight and yield of tomato under moderate saline conditions compared to the control in most of the genotypes. This damage is directly linked to the period of exposure, salt concentration, water potential and volume of water transpired by the plant [33]. Decreasing internal osmotic potential is generally reported as a strategy to maintain cell turgor, allowing growth through cell elongation under low external water potential [34].
Tomato fruit yields are affected by several factors related to salt stress, such as reduced water absorption, flower and fruit abortion, plant nutritional imbalance, physiological disturbances, and NaCl toxicity. Similarly, our study showed that moderate and severe saline irrigation impaired tomato fruit yields of all genotypes. Maestrina and Onix were noted with higher fruit yield under control conditions, while fruit yields of Onix, Maestrina, Shanty, Sperare, and Totalle were greater under moderate salt stress conditions. The genotypes Onix, Maestrina, Coração de Boi, Pizzamonty, Shanty, and Sheena were observed with greater yield under severe salt stress (Table 3). Fruit yield is negatively affected under salt stress by lower rates of water and nutrient absorption due to lower soil water potential, leading to lower rates of photosynthesis and transpiration [35].
IPA 6, Dominador, Coração de Boi, and Santa Clara were noted with highest yield losses (~55%) under moderate salt stress while the smallest losses (~24%) were observed in Sperare. In addition, genotypes with the greatest response to ideal growing conditions were the genotypes with the greatest fruit yield losses under severe stress conditions. The salt stress caused by saline irrigation may have a greater influence on fruit yield based on EC compared to a saline soil where EC can be reduced by a high level of irrigation during cultivation to dilute salinity in soil and water solution. Moderate saline irrigation reduces tomato fruit yield and causes fruit deformities and alters organoleptic characteristics of fruit [36].
The tolerance classification of tomato genotypes is based on agronomic characteristics. Additionally, multivariate techniques can be used to increase the precision of genotype selection for cultivation under salinity conditions. In this sense, the decision to choose genotypes under salt stress conditions requires indices related to all fruit characteristics, not just yield [13].
High salt concentrations imply a low soil water potential, transpiration, photosynthetic rates, and an imbalance in nutrient absorption [35]. Plants decrease internal osmotic potential to maintain cell turgor, allowing growth through cell elongation under low external water potential [34].
The toxic effects of salinity hinder plant development. Tomato traits related to concentrations of N, P, K, and Ca were affected by severe saline water irrigation as compared to without salinity stress (Table 4). The presence of NaCl in soil causes nutritional disturbances in plants because sodium hinders and/or inhibits cation absorption by roots, thus causing physiological disorders due to high ionic concentration and toxic effects of chloride ions [37]. The excess of Na+ in the soil reduces absorption of Ca2+ and K+, which are major nutrients contributing to cell wall structure and water balance [38]. The genotypes that managed to absorb greater amount of Ca2+ and K+ under salinity conditions can be linked to genotypic tolerance of tomato plants. The use of solutions with high NaCl concentrations can induce oxidative stress in plant cells and consequently increase ROS [39].
Correlations facilitate the identification of the most important traits with beneficial and harmful effects on yield and increase the possibility to select superior genotypes on the basis of allele dependent traits. The highest positive correlations were noted between fruit yield and CFW, CNF, LCI, N concentration, and Ca concentration. The Ca concentration had a positive correlation with all yield components, while there was a negative correlation of all variables with Na concentration. The largest negative correlation was between Ca and N concentration, LCI, YIELD, and CNF (Figure 2). These results demonstrated that salt stress reduces tomato fruit yields. The Ca and Na concentrations are directly related to fruit yield, and increasing these concentrations lead to the disturbance of nutritional status [28]. Sodium hinders or even inhibits the absorption of essential cations by roots, thus resulting in physiological disorders due to high toxicity of sodium ions [40].
Plants adopted a strategy of decreasing internal osmotic potential to maintain cell turgor, allowing growth by cell elongation under low external water potential [34]. Based on this information, traits that depend on a small number of alleles are easily selected with potential yield under salt stress conditions, thus accurately demonstrated that which traits are mainly affected by salinity.
Cluster analysis makes genotypic groups on the basis of all phenotypic characteristics in response to growing conditions (i.e., salt stress or without salt stress) to show similarities between genotypes. The hierarchical clustering method can show wide genetic variability among genotypes grown in any environment. Cluster analysis reveals the most promising groups to carry out crossing and originate superior genotypes with significant genetic gain [41]. Cluster analysis is a promising tool to select superior genotypes on the basis of genotypic characteristics for possible crossbreeding between parents under conditions of abiotic stress [41].
Plants under stress conditions alter metabolism intending to ameliorate osmotic and toxic effects of Na+, maintain K+ absorption, and increased K+: Na+ ratio under salt stress [9]. Plants can absorb and accumulate Na+ to maintain the absorption of water and nutrients; however, Na+ reduces availability of K+ and binding sites for critical metabolic processes in cytoplasm [8]. Plants restrict Na+ absorption and distribution by roots to protect themselves from the effects of salinity [42]. Sodium enters into the root cells and is transported from cytoplasm to apoplastic space and compartmentalized in the vacuole of cell wall to develop tissue tolerance [9]. Tissue tolerance is the capacity of plant cells to continue normal functioning even with high concentrations of internal Na+ without damage and forming a compartment of solute accumulations [10].
The stability and adaptability analysis under salt stress conditions provide safe results regarding cultivation of genotypes in stressful environment and enable the choice of ideal genotype for each unfavorable environment [43]. Onix, Maestrina, Shanty, and Pizzadoro showed an adaptability and stability above 50% for TD, CFW, CNF, YIELD, LCI, N-concentration, K-concentration, Ca-concentration, and Na-concentration. Onix, Maestrina, and Shanty were highly ranked even though, they had highest confidence indexes (Ii). The genotypes Onix, Maestrina, Totalle, Coração de Boi, Sperare, and Pizzamonty were noted with highest Ii value and greater stability and adaptability for PH in the tested environments.
The characteristics related to fruit yield can easily be altered by environmental effects and making it difficult to find stability in stressful environments. The highest Ii values were observed with Onix, Shanty, Pizzadoro, Totalle, Sperare, and Dominador for Na-concentration with greater adaptability and stability in all three environments that allowed greater leaf Na accumulation. It enables greater absorption of other nutrients and water to increase tolerance to salt stress.
The genotypes Onix, Maestrina, Shanty, Pizzadoro, Sheena, and Santa Clara were observed with greater adaptability for LCI which stood along with genotype Coração de Boi for N-concentration and allows for selecting genotypes with higher chlorophyll concentration and N uptake by tomato plants. In general, adaptability and stability of the best genotypes varied according to each evaluated trait, which makes it difficult to recommend and choose the adapted genotypes for a multi-trait breeding program [44]. In addition, genotypes Onix, Maestrina, Pizzadoro, and Shanty were observed with high Ii values in most of the variables and would be the best alternative for cultivation in environments under moderate and severe saline irrigation shown in heat map to represent these estimates.
The adaptability and stability confidence index (Ii) demonstrated the wide adaptation of genotypes under stressful conditions that reaffirm the adaptive potential of tomato plants to harmful effects of NaCl in water. These results also contributed to disseminate effective methods to select tomato genotypes through breeding programs, especially under cultivation conditions with high salinity levels. The tolerance of tomato genotypes to salt stress has been reported as an essential strategy to overcome the impacts of climate change that have harmed food production in the world [36]. In addition, it allows the expansion of cultivation in marginal areas with low technology and growing conditions [45]. It can promote greater profitability in the areas being unfavorable to cultivation and also increase food security.

5. Conclusions

Salt stress caused damage to all yield components and nutrition of tomato plants. Onix had greater tolerance to the effects of moderate salt stress (3.42 dS m1) on the basis of all evaluated characteristics, while Sheena, Sperare, Santa Clara, IPA 6, and Dominador had the lowest losses under severe salt stress (4.92 dS m1).
Sodium absorption increases with increasing salinity levels. The concentrations of phosphorus, potassium, and calcium decrease under salt stress conditions. The genotypes Dominator, Pizzamonty, Pizzadoro, and Totalle increased K absorption in the presence of Na by surpassing tolerance threshold for Na saline stress.
The genotypes Maestrina, Onix, Pizzadoro, and Shanty were identified with high adaptability and stability to be cultivated under ideal and salt stress conditions. In the two stressful conditions, the four genotypes did not belong to the same similarity group regarding tolerance to salt stress, which benefits breeding programs that aim to obtain genotypes with greater resistance to salinity stress.

Author Contributions

Conceptualization, C.E.D.S.O. and T.Z.; methodology, A.J. and M.C.M.T.F.; software, E.P.V.; validation, C.E.D.S.O., T.Z. and T.A.R.N.; formal analysis, C.E.D.S.O. and A.J.; investigation, C.E.D.S.O. and T.A.R.N.; resources, T.Z. and M.C.M.T.F.; data curation, C.E.D.S.O.; writing—original draft preparation, C.E.D.S.O. and A.D.J.; writing—review and editing, T.A.R.N., A.D.J. and M.C.M.T.F.; visualization, E.P.V.; supervision, M.C.M.T.F.; project administration, T.Z.; funding acquisition, T.Z. All authors have read and agreed to the published version of the manuscript.

Funding

This study was financed in part by the Coordenação de Aperfeiçoamento de Pessoal de Nível Superior—Brasil (CAPES/AUXPE Award Number 88887.592666/2020-00 | 0242/2021).

Institutional Review Board Statement

Not applicable.

Informed Consent Statement

Not applicable.

Data Availability Statement

Not applicable.

Conflicts of Interest

The authors declare no conflict of interest. This article does not contain any studies involving animals or human participants as objects of research.

References

  1. Oliveira, C.E.S.; Steiner, F.; Zuffo, A.M.; Zoz, T.; Alves, C.Z.; Aguiar, V.C.B. Seed priming improves the germination and growth rate of melon seedlings under saline stress. Ciênc. Rural 2019, 49, 1–11. [Google Scholar] [CrossRef]
  2. Pereira, F.A.L.; Medeiros, J.F.; Gheyi, H.R.; Dias, N.S.; Preston, W.; Vasconcelos, C.B.E.L. Tolerance of melon cultivars to irrigation water salinity. Rev. Bras. Eng. Agríc. Ambient. 2017, 21, 846–851. [Google Scholar] [CrossRef]
  3. Pacheco, J.; Plazas, M.; Pettinari, I.; Landa-Faz, A.; González-Orenga, S.; Boscaiu, S.; Prohens, J.; Vicente, O.; Gramazio, P. Moderate and severe water stress effects on morphological and biochemical traits in a set of pepino (Solanum muricatum) cultivars. Sci. Hortic. 2021, 284, 110143. [Google Scholar] [CrossRef]
  4. Safdar, H.; Amin, A.; Shafiq, Y.; Ali, A.; Yasin, R.; Shoukat, A.; Hussan, M.U.; Sarwar, M.I. A review: Impact of salinity on plant growth. Nat. Sci. 2019, 17, 34–40. [Google Scholar]
  5. Mohanavelu, A.; Naganna, S.R.; Al-Ansari, N. Irrigation Induced Salinity and Sodicity Hazards on Soil and Groundwater: An Overview of Its Causes, Impacts and Mitigation Strategies. Agriculture 2021, 11, 983. [Google Scholar] [CrossRef]
  6. Viana, J.S.; Palaretti, L.F.; Sousa, V.M.; Barbosa, J.A.; Bertino, A.M.P.; Faria, R.T.; Darli, A.B. Saline irrigation water indices affect morphophysiological characteristics of collard. Hortic. Bras. 2021, 39, 79–85. [Google Scholar] [CrossRef]
  7. Campos, C.A.B.; Fernandes, P.D.; Gheyi, H.R.; Blanco, F.F.; Gonçalves, C.B.; Campos, S.A.F. Yield and fruit quality of industrial tomato under saline irrigation. Sci. Agric. 2006, 63, 146–152. [Google Scholar] [CrossRef]
  8. Wei, D.; Zhang, W.; Wang, C.; Meng, Q.; Li, G.; Chen, T.H.H.; Yang, X. Genetic engineering of the biosynthesis of glycinebetaine leads toalleviate salt-induced potassium efflux and enhances salt tolerance in tomato plants. Plant Sci. 2017, 257, 74–83. [Google Scholar] [CrossRef]
  9. Almeida, D.M.; Oliveira, M.M.; Saibo, N.J.M. Regulation of Na+ and K+ homeostasis in plants: Towards improved salt stress tolerance in crop plants. Genet. Mol. Biol. 2017, 40, 326–345. [Google Scholar] [CrossRef]
  10. Munns, R.; James, R.A.; Gilliham, M.; Flowers, T.J.; Colmer, T.D. Tissue tolerance: An essential but elusive trait for salt-tolerant crops. Funct. Plant Biol. 2016, 43, 1103–1113. [Google Scholar] [CrossRef]
  11. Ali, A.A.M.; Romdhane, W.B.; Tarroum, M.; Al-Dakhil, M.; Al-Doss, A.; Alsadon, A.A.; Hassairi, A. Analysis of Salinity Tolerance in Tomato Introgression Lines Based on Morpho-Physiological and Molecular Traits. Plants 2021, 10, 2594. [Google Scholar] [CrossRef] [PubMed]
  12. Annicchiarico, P. Cultivar adaptation and recomendation from alfafa trials in Northern Italy. J. Genet. Breed. 1992, 46, 269–278. [Google Scholar]
  13. Schmildt, E.R.; Nascimento, A.L.; Cruz, C.D.; Oliveira, J.A.R. Evaluation of methodologies of adaptability and stability in corn cultivars. Acta Sci. Agron. 2011, 33, 51–58. [Google Scholar] [CrossRef]
  14. Chattopadhyay, K.; Marndi, B.C.; Sarkar, R.K.; Singh, O.N. Stability analysis of backcross population for salinity tolerance at reproductive stage in rice. Indian J. Genet. Plant Breed. 2017, 77, 51–58. [Google Scholar] [CrossRef]
  15. Yan, K.; He, W.; Bian, L.; Zhang, Z.; Tang, X.; An, M.; Li, L.; Han, G. Salt adaptability in a halophytic soybean (Glycine max) involves photosystems coordination. BMC Plant Biol 2020, 20, 155. [Google Scholar] [CrossRef] [PubMed]
  16. EL Sabagh, A.; Islam, M.S.; Skalicky, M.; Ali Raza, M.; Singh, K.; Anwar Hossain, M.; Hossain, A.; Mahboob, W.; Iqbal, M.A.; Ratnasekera, D.; et al. Salinity Stress in Wheat (Triticum aestivum L.) in the Changing Climate: Adaptation and Management Strategies. Front. Agron. 2021, 3, 661932. [Google Scholar] [CrossRef]
  17. Bakhshi, B.; Mohammad, S.; Tabatabaei, T.; Reza, M.; Rad, N. Identification of salt tolerant genotypes in wheat using stress tolerance indices. BioRxiv Genet. 2021. [Google Scholar] [CrossRef]
  18. Santos, H.G.; Jacomine, P.K.T.; Anjos, L.H.C.; Oliveira, V.A.; Oliveira, J.B.; Coelho, M.R.; Lumbreras, J.F.; Cunha, T.J.F. Sistema Brasileiro de Classificação de Solos, 4th ed.; EMBRAPA: Rio de Janeiro, Brazil, 2018. [Google Scholar]
  19. Marouelli, W.A.; Oliveira, Á.S.; Coelho, E.F.; Nogueira, L.C.; Sousa, V.F. Irrigation water management. In Irrigation and Fertigation in Fruit and Vegetables; Sousa, V.F., Marouelli, W.A., Coelho, E.F., Pinto, J.M., Coelho Filho, M.A., Eds.; Embrapa Informação Tecnológica: Brasília, Brazil, 2011; pp. 157–232. (In Portuguese) [Google Scholar]
  20. Silva, D.J.; Vale, F.X.R. Tomato—Production Tecnology; Suprema: Viçosa, Brazil, 2007. (In Portuguese) [Google Scholar]
  21. Oliveira, C.E.S.; Zoz, T.; Jalal, A.; Seron, C.C.; Silva, R.A.; Teixeira Filho, M.C.M. Tolerance of tomato seedling cultivars to different values of irrigation water salinity. Rev. Bras. Eng. Agríc. Ambient. 2022, 26, 10. [Google Scholar] [CrossRef]
  22. Malavolta, E.; Vitti, G.C.; Oliveira, S.A. Assessment of the Nutritional Status of Plants: Principles and Applications, 2nd ed.; Brazilian Association for the Research of Potash and Phosphate: Piracicaba, Brazil, 1997. [Google Scholar]
  23. Rao, C.R. Advanced Statistical Methods in Biometric Research; John Wiley & Sons: New York, NY, USA, 1952. [Google Scholar]
  24. Cargnelutti-Filho, A.; Ribeiro, N.D.; Reis, R.C.P.; Souza, J.R.; Jost, E. Comparison of cluster methods for the study of genetic diversity in common bean cultivars. Ciênc. Rural 2008, 38, 2138–2145. [Google Scholar] [CrossRef]
  25. Zuffo, A.M.; Steiner, F.; Sousa, T.O.; Aguilera, J.G.; Teodoro, P.E.; Alcântara Neto, F.; Ratke, R.F. How does water and salt stress affect the germination and initial growth of Brazilian soya bean cultivars? J. Agron. Crop Sci. 2020, 206, 837–850. [Google Scholar] [CrossRef]
  26. Schmildt, E.R.; Cruz, C.D. Análise da adaptabilidade e estabilidade do milho pelos métodos de Eberhart e Russell (1966) e de Annicchiarico (1992). Rev. Ceres 2005, 52, 45–58. [Google Scholar]
  27. R Core Team. R: A Language and Environment for Statistical Computing; R Foundation for Statistical Computing: Vienna, Austria, 2015; Available online: https://www.R-project.org/ (accessed on 20 July 2021).
  28. Oliveira, F.A.; Paiva, F.I.G.; Medeiros, J.F.; Melo, M.R.S.; Oliveira, M.K.T.; Silva, R.C.P. Salinity tolerance of tomato fertigated with different K+/Ca2+ proportions in protected environment. Braz. J. Agric. Environ. Eng. 2021, 25, 620–625. [Google Scholar] [CrossRef]
  29. Guo, J.; Dong, X.; Han, G.; Wang, B. Salt-Enhanced Reproductive Development of Suaeda salsa L. Coincided with Ion Transporter Gene Upregulation in Flowers and Increased Pollen K+ Content. Front. Plant Sci. 2019, 10, 333. [Google Scholar] [CrossRef] [PubMed] [Green Version]
  30. Ahmed, H.A.A.; Sahin, N.K.; Akdogan, G.; Yaman, C.; Kom, D.; Uranbey, S. Variability in salinity stress tolerance of potato (Solanum tuberosum L.) varieties using in vitro screening. Ciênc. Agrotecnol. 2020, 44, e004220. [Google Scholar] [CrossRef]
  31. Wilkinson, L.G.; Bird, D.C.; Tucker, M.R. Exploring the Role of the Ovule in cereal grain development and reproductive stress tolerance. Annu. Plant Rev. 2018, 1, 1–35. [Google Scholar] [CrossRef]
  32. Siddik, M.A.; Khan, M.S.; Rahman, M.M.; Uddin, M.K. Performance of tomato (Lycopersicon esculentum Mill.) germplasm to salinity stress. Bangladesh J. Bot. 2015, 44, 193–200. [Google Scholar] [CrossRef]
  33. Negrão, S.; Schmöckel, S.M.; Tester, M. Evaluating physiological responses of plants to salinity stress. Ann. Bot. 2017, 119, 1–11. [Google Scholar] [CrossRef]
  34. Tariq, A.; Pan, K.; Olatunji, O.A.; Graciano, C.; Li, Z.; Sun, F.; Zhang, L.; Wu, X.; Chen, W.; Song, D.; et al. Phosphorous fertilization alleviates drought effects on Alnus cremastogyne by regulating its antioxidant and osmotic potential. Sci. Rep. 2018, 8, 5644. [Google Scholar] [CrossRef]
  35. Alves, R.C.; Medeiros, A.S.; Nicolau, M.C.M.; Pizolato Neto, A.; Oliveira, F.A.; Lima, L.W.; Tezotto, T.; Gratão, P.L. The partial root-zone saline irrigation system and antioxidant responses in tomato plants. Plant Physiol. Biochem. 2018, 127, 366–379. [Google Scholar] [CrossRef]
  36. Meza, S.L.R.; Egea, I.; Massaretto, I.L.; Morales, B.; Purgatto, E.; Egea-Fernández, J.M.; Bolarin, M.C.; Flores, F.B. Traditional tomato varieties improve fruit quality without affecting fruit yield under moderate salt stress. Front. Plant Sci. 2020, 11, 587754. [Google Scholar] [CrossRef]
  37. Hajlaoui, H.; El Ayeb, N.; Garrec, J.P.; Denden, M. Differential effects of salt stress on osmotic adjustment and solutes allocation on the basis of root and leaf tissue senescence of two silage maize (Zea mays L.) varieties. Ind. Crops Prod. 2010, 31, 122–130. [Google Scholar] [CrossRef]
  38. Domingues, L.S.; Ribeiro, N.D.; Andriolo, J.L.; Possobom, M.T.D.F.; Zemolin, A.E.M. Growth, grain yield and calcium, potassium and magnesium accumulation in common bean plants as related to calcium nutrition. Acta Sci. Agron. 2016, 38, 207–217. [Google Scholar] [CrossRef]
  39. Alharby, H.F.; Metwali, E.M.; Fuller, M.P.; Aldhebiani, A.Y. Impact of application of zinc oxide nanoparticles on callus induction, plant regeneration, element content and antioxidant enzyme activity in tomato (Solanum lycopersicum Mill.) under salt stress. Arch. Biol. Sci. 2016, 68, 723–735. [Google Scholar] [CrossRef] [Green Version]
  40. Cruz, J.L.; Coelho, E.F.; Coelho Filho, M.A.; Santos, A.A. Salinity reduces nutrients absorption and efficiency of their utilization in cassava plants. Cienc. Rural 2018, 48, 1–12. [Google Scholar] [CrossRef]
  41. Oliveira, C.E.S.; Andrade, A.F.; Zoz, A.; Lustosa Sobrinho, R.; Zoz, T. Genetic divergence and path analysis in wheat cultivars under heat stress. Pesqui. Agropecu. Trop. 2020, 50, 1–9. [Google Scholar] [CrossRef]
  42. Hanin, M.; Ebel, C.; Ngom, M.; Laplaze, L.; Masmoudi, K. New insights on plant salt tolerance mechanisms and their potential use for breeding. Front. Plant Sci. 2016, 7, 1787. [Google Scholar] [CrossRef]
  43. Oliveira, C.E.S.; Steiner, F. Potassium nitrate priming to mitigate the salt stress on cucumber seedlings. Sci. Agrar. Parana. 2017, 16, 454–462. [Google Scholar] [CrossRef]
  44. Szareski, V.J.; Carvalho, I.R.; Kehl, K.; Levien, A.M.; Nardino, M.; Dellagostin, S.M.; Demari, G.H.; Lautenchleger, F.; Villela, F.A.; Pedó, T.; et al. Adaptability and stability of wheat genotypes according to the phenotypic index of seed vigor. Pesqui. Agropecu. Bras. 2018, 53, 727–735. [Google Scholar] [CrossRef]
  45. Wright, C.K.; Wimberly, M.C. Recent land use change in the Western Corn Belt threatens grasslands and wetlands. Proc. Natl. Acad. Sci. USA 2013, 110, 4134–4139. [Google Scholar] [CrossRef] [Green Version]
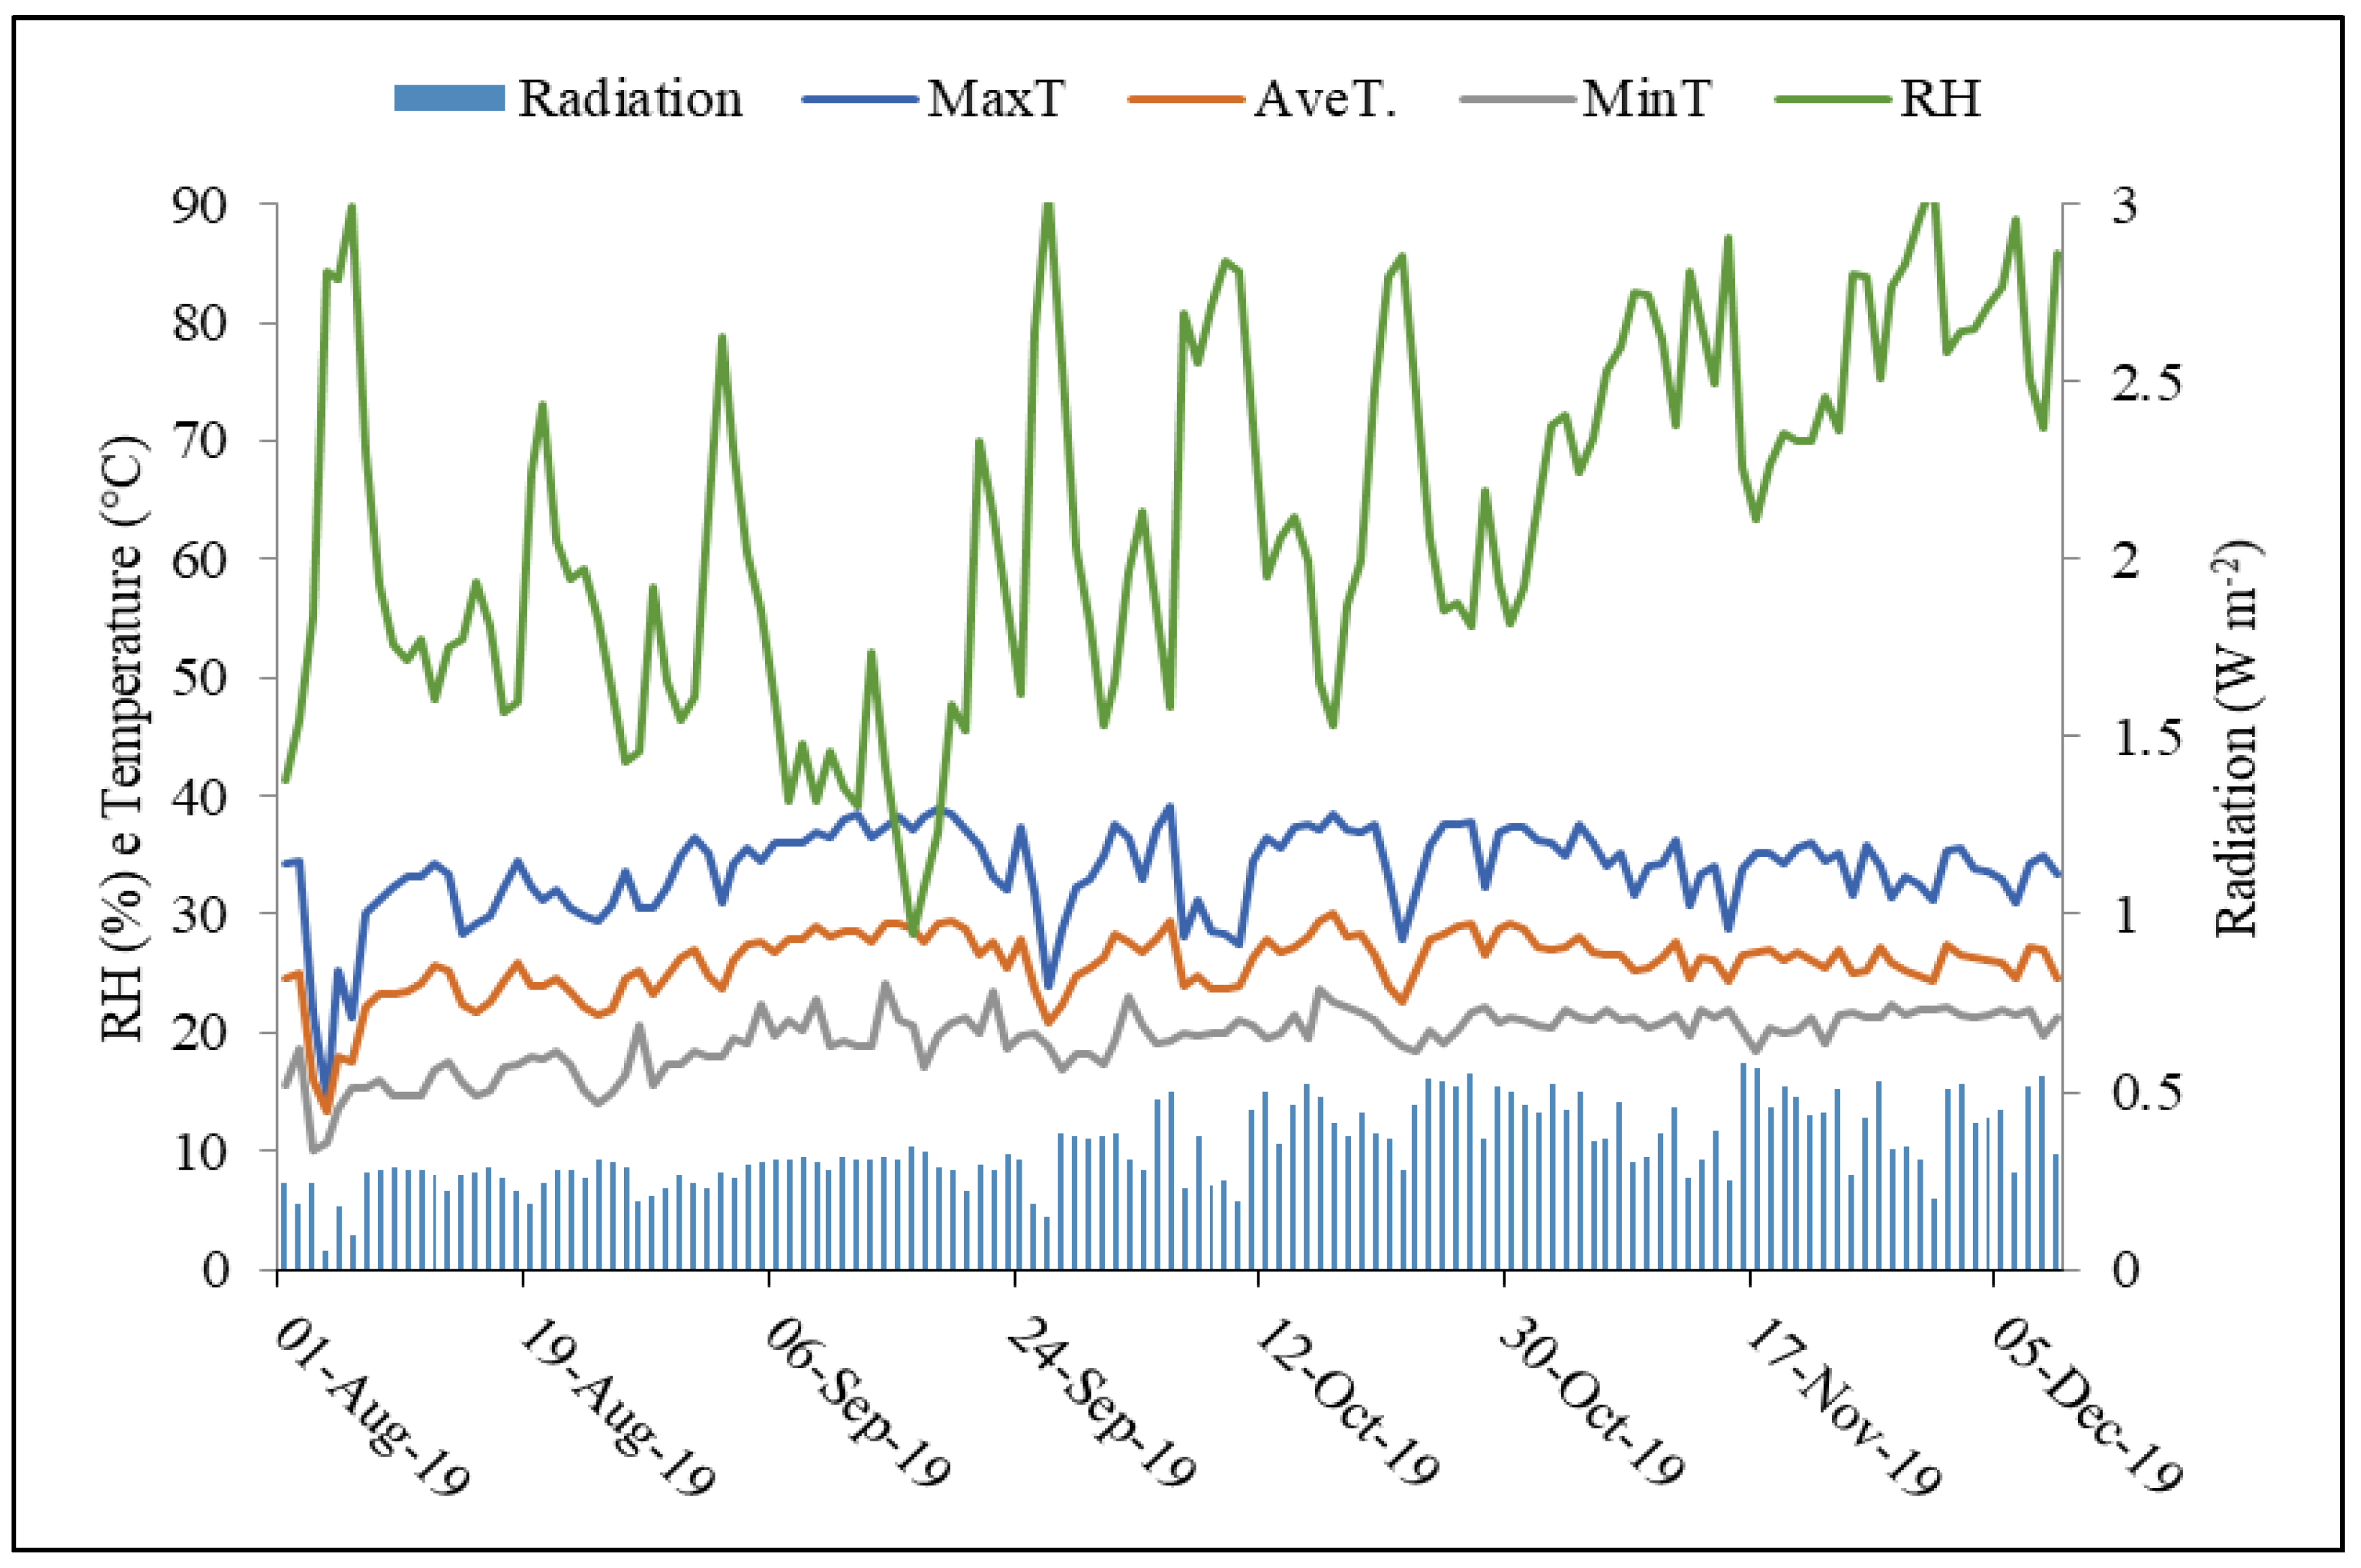
Figure 1. Relative air humidity (RH), maximum temperature (MaxT), average temperature (AveT), and minimum temperature (MinT), and radiation during the experiment.
Crops 02 00022 g001
Figure 2. Heatmap of the Pearson correlation coefficients obtained from variables analyzed in 12 tomato genotypes in response to salt stress. X Indicates no significant correlation (p = 0.05). Commercial fruit weight (CFW), plant height (PH), fruit yield (Yield), number of commercial fruits per bunch (CNF), transversal diameter of fruit (TD), longitudinal diameter of fruit (LD), leaf chlorophyll index (LCI), leaf nitrogen concentration (N concentration), leaf potassium concentration (K Concentration), leaf phosphorus concentration (P Concentration), leaf calcium concentration (Ca concentration), and leaf sodium concentration (Na concentration).
Crops 02 00022 g002
Figure 3. Dendrogram using Euclidean distance and Ward’s method from the hierarchical cluster analysis (HCA) of 12 tomato genotypes under conditions of the control treatment (A), moderate salinity (B), and severe salinity (C).
Crops 02 00022 g003
Figure 4. Heatmap for univariate adaptability and stability values (Ii) obtained by the method of Schimildt et al. (2011) between two unfavorable environments (moderate and severe salt stress) and one favorable environment (control condition) for longitudinal diameter of fruit (LD), transversal diameter of fruit (TD), commercial fruit weight (CFW), commercial fruit number per bunch (CFN), plant height (PH), fruit yield (Yield), leaf chlorophyll index (LCI), and leaf concentration of nitrogen (N), potassium (K), phosphor (P), calcium (Ca), and sodium (Na) evaluated in 12 tomato genotypes.
Crops 02 00022 g004
Table 1. Number of commercial fruits per bunch and commercial fruit weight of 12 tomato genotypes under irrigation with saline water.
GenotypesNumber of FruitsCommercial Fruit Weight
Fruits Bunch−1g Fruit−1
ControlModerateSevereControlModerateSevere
Coração de Boi5.64 bA4.93 aB4.20 aC79.08 bA45.02 cB39.36 bB
Dominador5.21 bA4.39 bB3.77 bC53.97 cA47.92 cAB36.77 bB
IPA 65.27 bA4.83 aA3.71 bB58.94 cA49.36 cAB38.26 bB
Maestrina5.57 bA4.46 bB3.68 bC89.17 bA54.54 bB47.26 aB
Onix6.75 aA5.18 aB3.63 bC111.58 aA68.98 aB50.08 aC
Pizzadoro5.57 bA4.25 bB3.68 bC57.66 cA36.18 cB30.67 bB
Pizzamonty5.29 bA4.51 bB4.46 aB46.84 cA34.02 cAB29.38 bB
S. Clara5.39 bA4.32 bB3.55 bC51.03 cA39.68 cB40.55 bB
Shanty5.28 bA4.36 bB3.72 bC76.63 bA47.68 cB50.81 aB
Sheena5.43 bA4.39 bB3.46 bC61.83 cA45.90 cB52.28 aB
Sperare5.27 bA4.39 bB3.49 bC56.44 cA45.64 cAB36.56 bB
Totalle5.49 bA4.83 aB3.81 bC57.31 cA39.60 cB37.71 bB
Mean5.514.593.7666.7146.2140.81
CV (%)10.1514.28
Standard error (±)1.031.00
Genotypes (G)0.00001 **0.00001 **
Salt stress (S)0.00001 **0.00001 **
GxS0.0026 **0.00001 **
** significant at 1%. Means followed by the same lowercase letter in the columns belong to the same group by the Scott and Knott (1974) clustering test at 1% probability. Means followed by the same uppercase letter in the lines differ from each other by the Tukey test at 1% probability for each trait.
Table 2. Transversal and longitudinal diameter of fruits of 12 genotypes of tomato under irrigation with saline water.
GenotypesTransversal DiameterLongitudinal Diameter
cmcm
ControlModerateSevereControlModerateSevere
Coração de Boi66.51 aA46.99 bB46.98 aB54.00 bA43.84 bB39.59 bC
Dominador51.72 cA44.36 bB42.37 bB44.92 bB56.06 aA39.00 bC
IPA 655.06 bA53.32 aA45.92 aB41.60 bB40.36 bC43.90 bA
Maestrina59.52 bA52.18 aB51.14 aB48.09 bA38.39 bC41.89 bB
Onix66.29 aA51.77 aB49.85 aB52.52 bA43.84 bB42.71 bB
Pizzadoro40.06 dA34.42 cB33.92 cB54.63 aA48.02 aB48.12 aB
Pizzamonty41.65 dA32.82 cAB29.76 cB51.72 bA50.70 aA45.42 bB
S. Clara55.98 bA44.95 bB41.82 bB45.75 bA39.53 bB41.02 bB
Shanty50.35 cA45.76 bAB42.65 bB64.02 aA54.88 aB55.08 aB
Sheena56.81 bA42.48 bB38.92 bC59.57 aA48.01 aB50.95 aB
Sperare51.47 cA42.56 bB41.20 bB55.60 aA46.20 bB44.21 bB
Totalle43.30 dA34.63 cB25.66 cC65.20 aA52.09 aB53.37 aB
Mean53.2143.8541.0253.1447.7545.44
CV (%) 11.42 14.26
Standard error (±)2.623.45
Genotypes (G)0.00001 **0.00001 **
Salt stress (S)0.00001 **0.00001 **
GxS0.009 **0.01 **
** significant at 1%. Means followed by the same lowercase letter in the columns belong to the same group by the Scott and Knott (1974) clustering test at 1% probability. Means followed by the same uppercase letter in the lines differ from each other by the Tukey test at 1% probability for each trait.
Table 3. Plant height and fruit yield of 12 genotypes of tomato under irrigation with saline water.
GenotypesPlant HeightFruit Yield
cmkg m−2
ControlModerateSevereControlModerateSevere
C. de Boi178 aA168 aA165 aA6.08 dA2.68 dB1.98 aB
Dominador166 aA137 aA145 aA6.09 dA2.52 dB1.10 bC
IPA 6120 bA114 bA136 aA4.34 fA1.70 eB1.03 bB
Maestrina198 aA162 aA159 aA11.84 bA4.69 bB2.23 aC
Onix182 aA185 aA158 aA14.66 aA6.90 aB2.44 aC
Pizzadoro187 aA152 aA98 bB4.97 eA2.45 dB1.35 bC
Pizzamonty185 aA171 aA148 aA5.29 eA3.47 cB1.97 aC
S. Clara191 aA166 aA150 aA6.23 dA2.94 cB1.04 bC
Shanty130 bA100 bA103 bA6.54 dA4.35 bB3.05 aC
Sheena103 bA105 bA100 bA5.37 eA3.26 cB2.51 aB
Sperare183 aA160 aA140 aA5.51 eA4.24 bB1.57 bC
Totalle168 aA148 aAB120 bB8.36 cA4.44 bB1.73 bC
Mean1661471357.113.641.83
CV (%) 14.86 11.54
Standard error (±)0.132.71
Genotypes (G)0.00001 **0.00001 **
Salt stress (S)0.00001 **0.00001 **
GxS0.003 **0.00001 **
** significant at 1%. Means followed by the same lowercase letter in the columns belong to the same group by the Scott and Knott (1974) clustering test at 1% probability. Means followed by the same uppercase letter in the lines differ from each other by the Tukey test at 1% probability for each trait.
Table 4. Leaf chlorophyll index and nitrogen (N), phosphorus (P), potassium (K), calcium (Ca), and sodium (Na) concentration of 12 tomato genotypes under irrigation with saline water.
GenotypesLCIN-Concentration
SPADg kg−1
ControlModerateSevereControlModerateSevere
Coração de Boi47.4 dA45.8 aA32.0 cB31.3 bA28.6 aB22.1 cC
Dominador46.0 dA42.4 bA28.7 dB25.6 dA26.5 bA19.8 dB
IPA 649.3 cA41.8 cB31.8 cC27.4 cA26.1 cA21.9 cB
Maestrina50.3 cA44.3 aB35.3 bC29.3 cA27.7 aA24.3 bB
Onix54.8 bA44.4 aB40.6 aB30.8 bA27.7 aB28.0 aB
Pizzadoro59.9 aA42.9 bB34.9 bC33.3 aA26.8 bB24.0 bC
Pizzamonty57.9 aA39.3 dB34.3 bC32.2 aA24.5 dB23.6 bB
S. Clara51.5 cA39.9 dB34.7 bC28.6 cA25.0 dB23.9 bB
Shanty51.4 cA45.7 aB34.7 bC28.6 cA28.6 aA23.9 bB
Sheena44.0 eA40.4 cB29.6 dC24.4 eA25.3 cA20.4 dB
Sperare50.6 cA38.7 dB36.2 bB28.1 cA24.2 dB24.9 bB
Totalle48.2 dA44.9 aB33.4 bC26.8 dA28.0 aA23.0 bB
Mean51.042.533.828.926.623.3
CV (%) 8.76 3.98
Standard error (±)0.670.49
Genotypes (G)0.0001 **0.0002 **
Salt stress (S)0.0003 **0.0001 **
GxS0.002 **0.0018 **
GenotypesP-ConcentrationK-Concentration
g kg−1g kg−1
ControlModerateSevereControlModerateSevere
C. de Boi4.95 gA4.47 dB3.33 fC48.12 aA39.28 bB21.94 gC
Dominador4.22 hA3.75 fB3.55 eC36.48 bB26.66 fC57.48 aA
IPA 69.76 aA8.56 aB5.69 aC38.41 bA37.95 bA37.92 bA
Maestrina4.56 hA3.51 gB3.86 dB34.69 cB41.18 aA31.39 dC
Onix4.27 hA3.65 gB2.83 gC27.50 dB32.08 cA27.75 eB
Pizzadoro5.81 eA4.30 eB3.31 fC35.24 cB30.82 dC39.68 bA
Pizzamonty6.01 dA3.15 hB2.31 hC27.63 dC30.97 dB32.19 dA
S. Clara3.48 iB4.09 eA2.71 gC29.59 dA30.08 dA19.08 gB
Shanty5.47 eB8.60 aA4.74 cC34.38 cB39.13 bA28.60 eC
Sheena6.70 bA6.95 cA5.17 bB28.53 dA28.74 eA25.01 fB
Sperare6.38 cB7.35 bA4.76 cC28.23 dA29.01 eA26.01 fB
Totalle5.28 fA4.62 dB3.64 eC23.78 eC32.89 cB35.24 cA
Mean5.585.253.8232.7133.2331.86
CV (%) 2.05 3.78
Standard error (±)0.070.71
Genotypes (G)0.00001 **0.00002 **
Salt stress (S)0.00002 **0.00001 **
GxS0.00001 **0.00002 **
GenotypesCa-ConcentrationNa-Concentration
g kg−1g kg−1
ControlModerateSevereControlModerateSevere
Coração de Boi32.18 cA22.48 dB22.14 eB4.00 aC27.88 bB33.20 dA
Dominador33.51 bA26.60 cB17.78 fC3.75 aC17.47 cB39.39 cA
IPA 638.08 aA26.33 cB19.24 fC4.11 aC11.42 dB30.72 eA
Maestrina35.48 aA25.46 cB17.50 fC3.05 aC33.30 aB49.50 aA
Onix36.95 aA29.18 bB22.57 eC2.98 aC12.58 dB35.67 dA
Pizzadoro34.43 bA26.88 cB24.49 dB3.58 aC15.76 cB48.74 aA
Pizzamonty34.16 bA27.89 cB27.22 cB5.41 aC17.70 cB24.99 fA
S. Clara36.39 aA30.03 bB28.63 bB3.28 aC16.70 cB20.98 gA
Shanty35.95 aA31.95 aB30.23 bB5.53 aC17.91 cB41.98 bA
Sheena30.96 cA33.27 aA32.44 aA3.25 aC11.09 dB50.48 aA
Sperare26.08 dB31.26 aA29.08 bA3.24 aC13.48 dB34.42 dA
Totalle29.40 cA29.82 bA26.17 cB3.73 aC16.10 cB38.15 cA
Mean33.6328.4324.793.8317.6237.35
CV (%) 4.57 6.76
Standard error (±)0.760.77
Genotypes (G)0.00001 **0.00001 **
Salt stress (S)0.00001 **0.00001 **
GxS0.0002 **0.0001 **
** significant at 1%. Means followed by the same lowercase letter in the columns belong to the same group by the Scott and Knott (1974) clustering test at 1% probability. Means followed by the same uppercase letter in the lines differ from each other by the Tukey test at 1% probability for each trait.
Publisher’s Note: MDPI stays neutral with regard to jurisdictional claims in published maps and institutional affiliations.