
The Effect of Electrical Conductivity on Fruit Growth Pattern in Hydroponically Grown Tomatoes


Abstract
1. Introduction
2. Materials and Methods
2.1. Growth Conditions
2.1.1. Greenhouse Environment
2.1.2. Plant Materials
2.1.3. Nutrient Solution Treatment
2.2. Sampling and Measurement
2.2.1. Continuous Measurement
2.2.2. Destructive Measurement
2.3. Statistics
3. Results
3.1. Greenhouse Environment and Treatment
3.2. Plant Growth
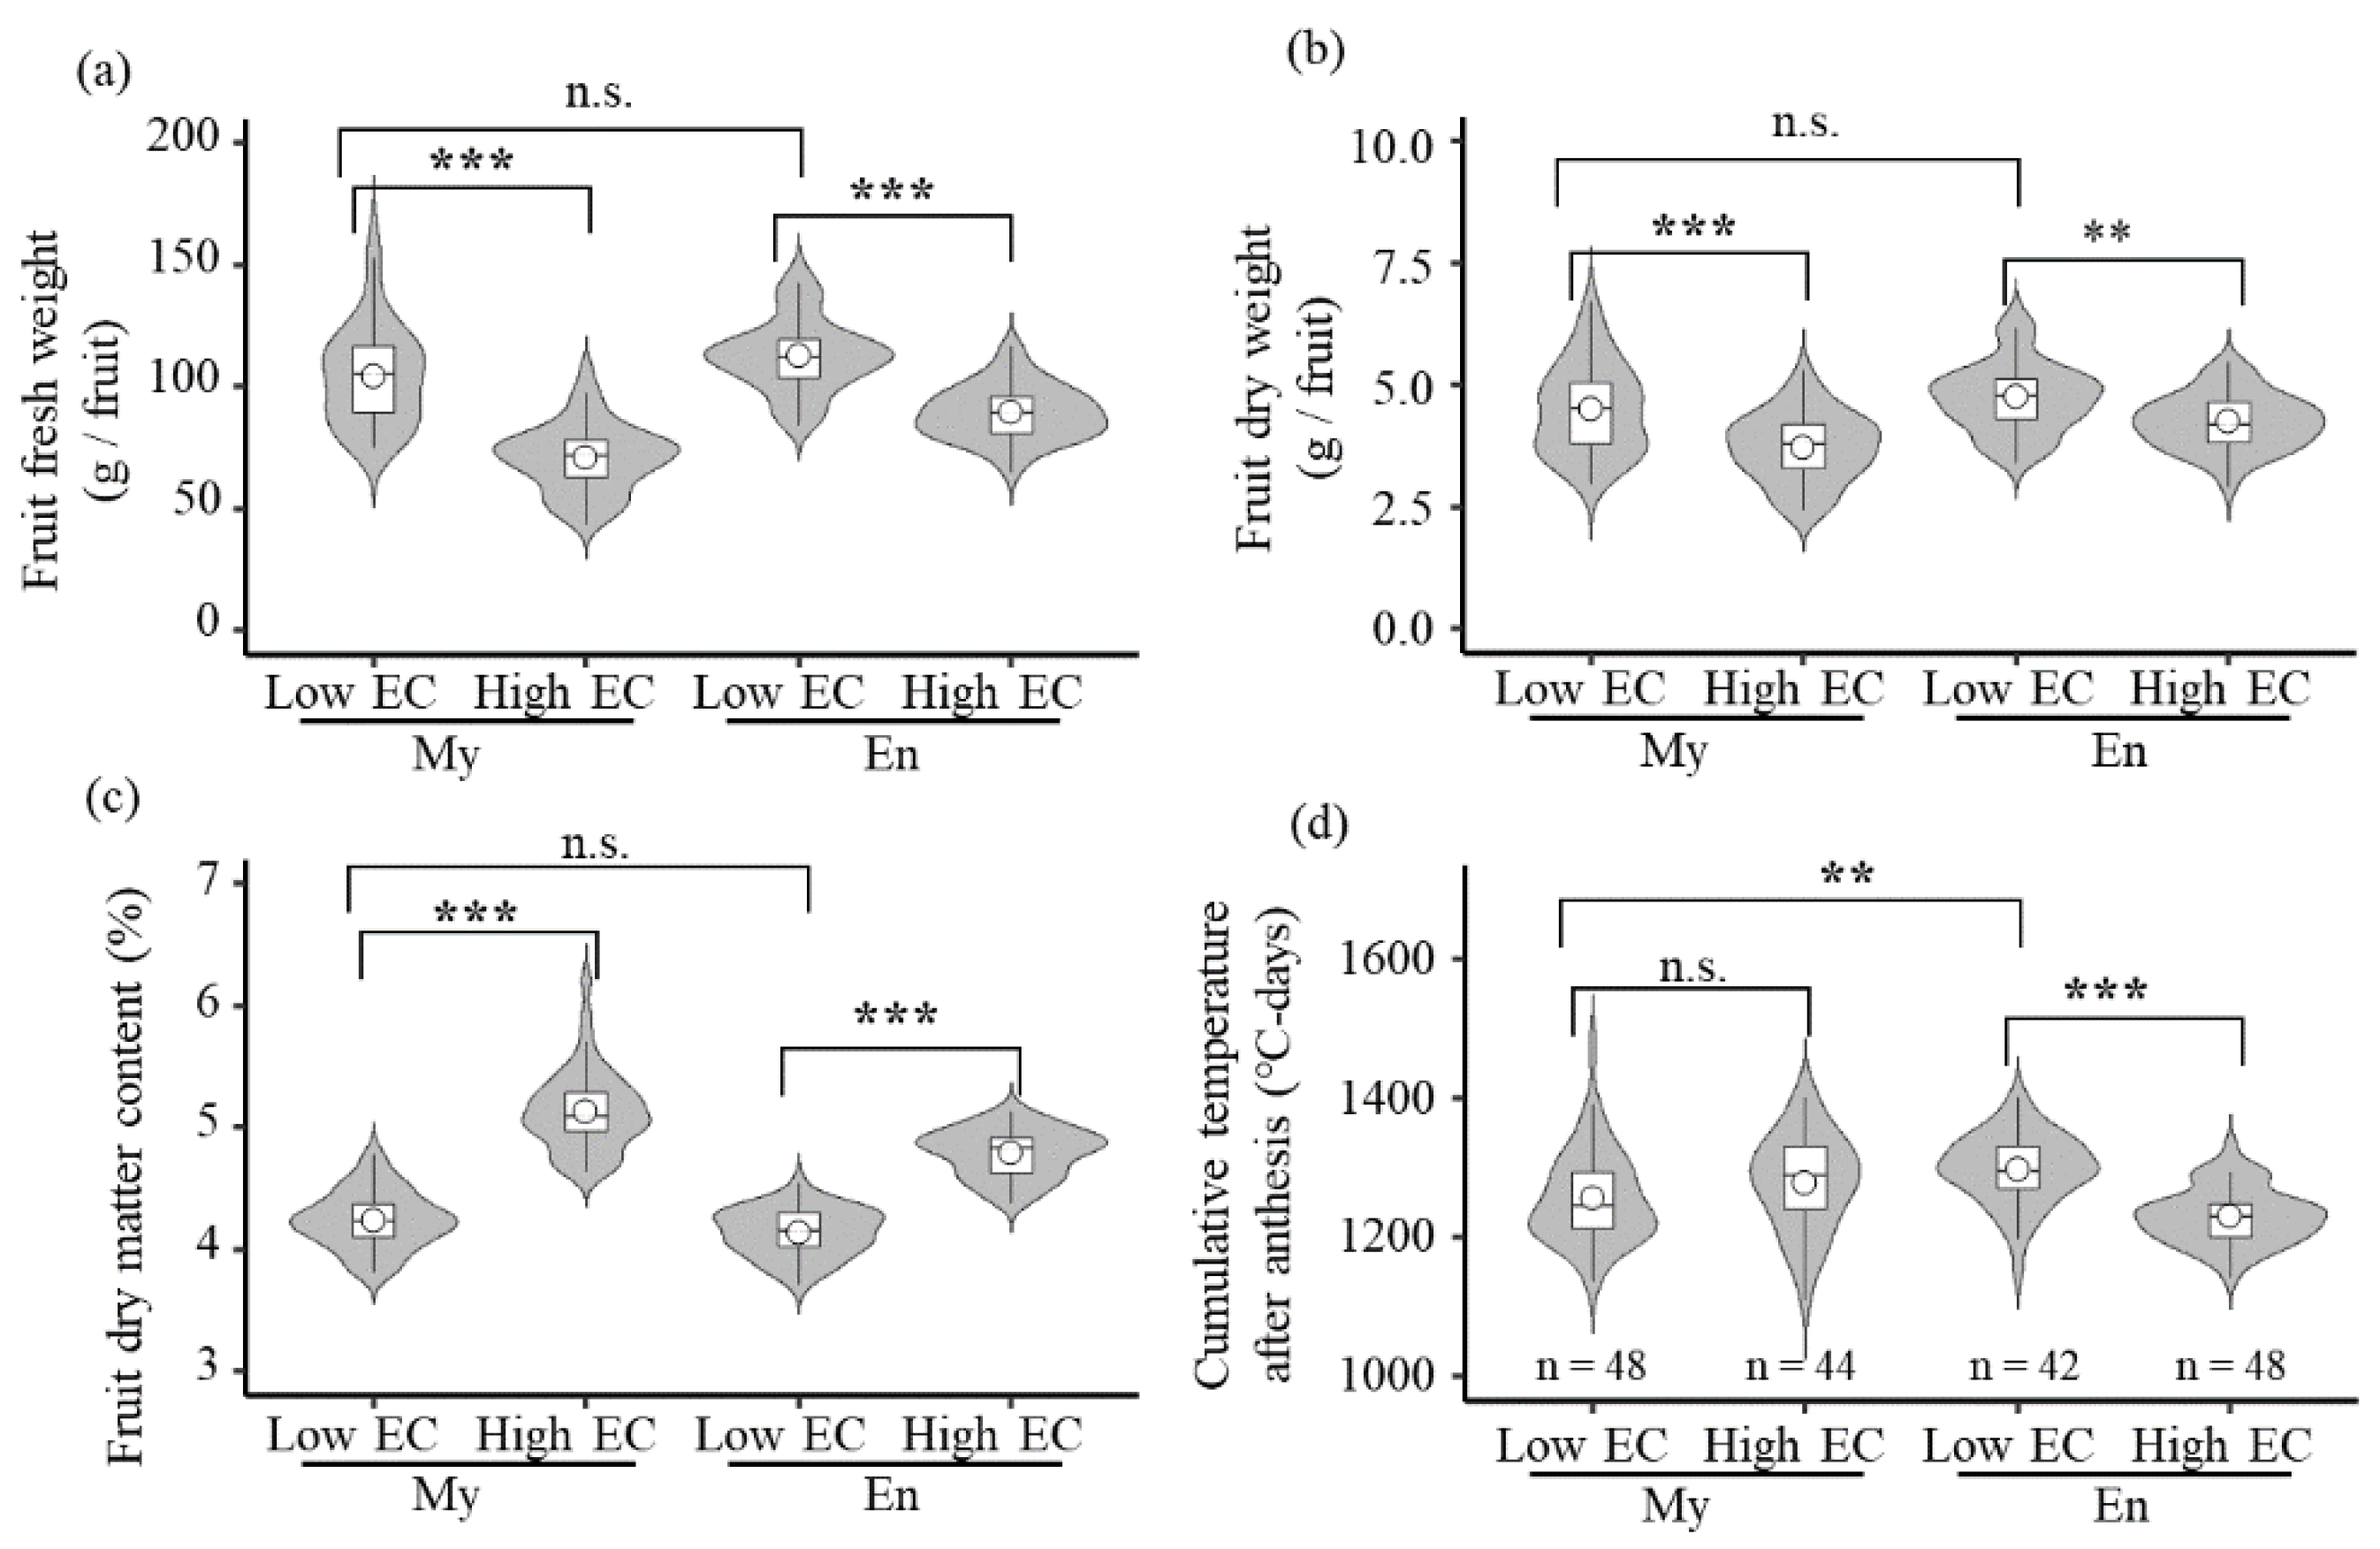
3.3. Fruit Weight
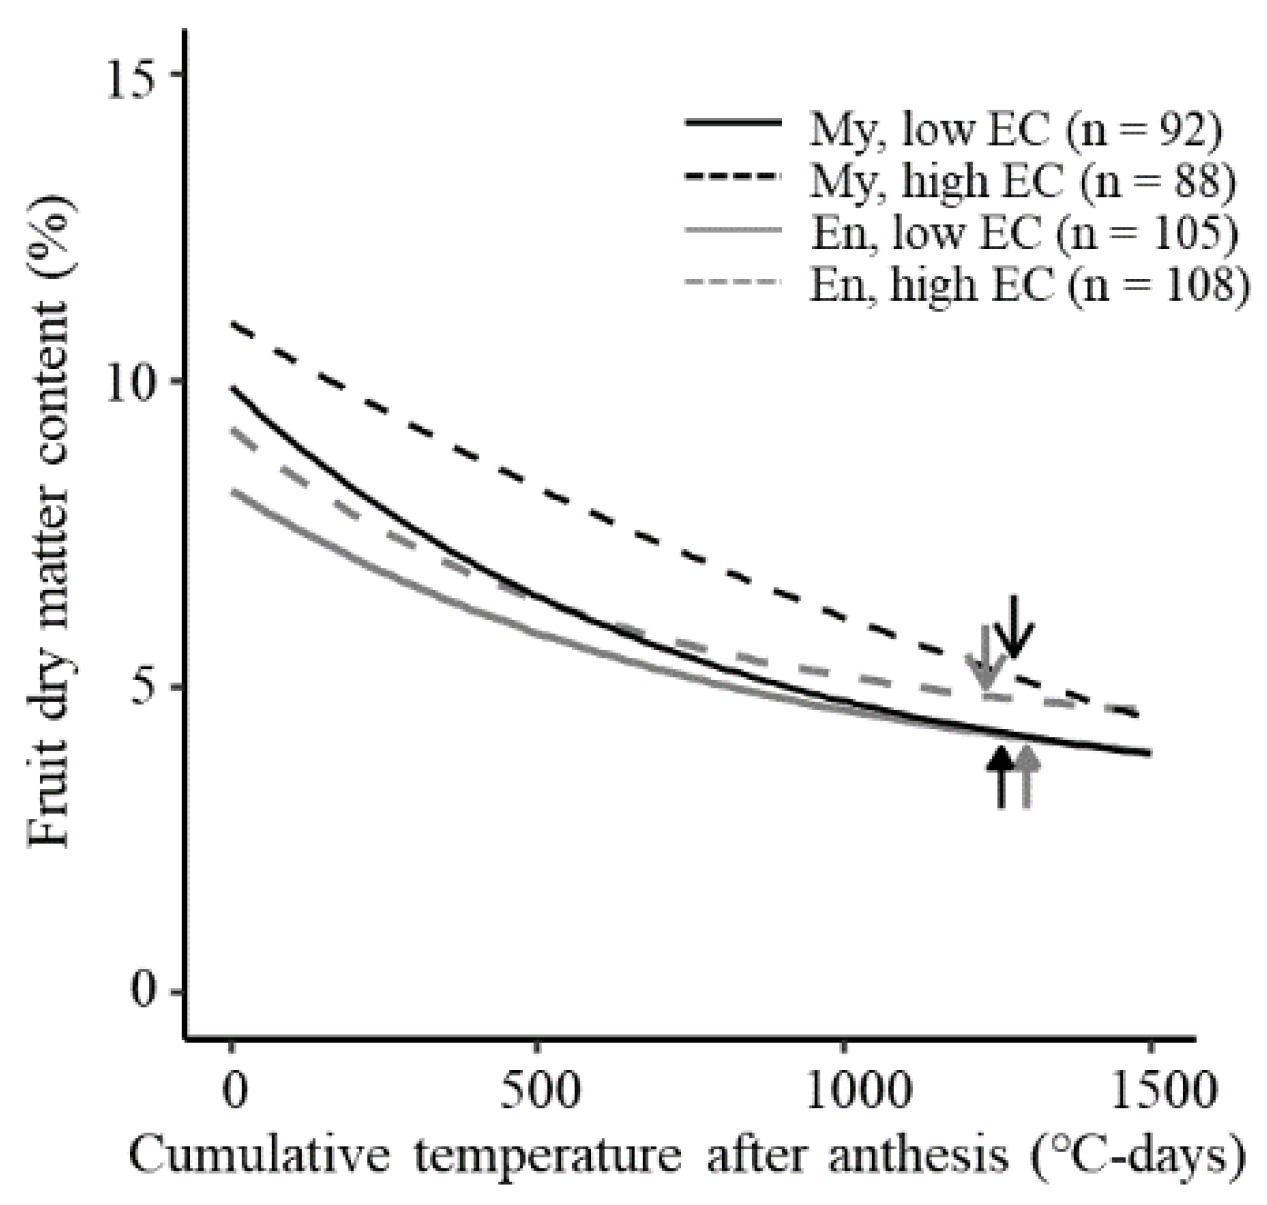
3.4. Fruit Dry Matter Content
3.5. Normalized Fruit Weight Growth
4. Discussion
5. Conclusions
Author Contributions
Funding
Data Availability Statement
Acknowledgments
Conflicts of Interest
References
- Ohta, K.; Ito, N.; Hosoki, T.; Higashimura, H. Influence of the concentrations of nutrient solution and salt supplement on quality and yield of cherry tomato grown hydroponically. J. Jpn. Soc. Hortic. Sci. 1991, 60, 89–95, (In Japanese with English Abstract). [Google Scholar] [CrossRef]
- Hohjo, M.; Ito, T.; Tanaka, S. Growth, yield, fruit quality and physiology of tomato plants grown under different levels of nutrient concentration at several growing stages. Environ. Control Biol. 1996, 34, 129–134, (In Japanese with English Abstract). [Google Scholar] [CrossRef]
- Schwarz, D.; Kuchenbuch, R. Growth analysis of tomato in a closed recirculating system in relation to the EC-value of the nutrient solution. Acta Hortic. 1997, 450, 169–176. [Google Scholar] [CrossRef]
- Hosokawa, T.; Komatsu, H.; Yoshida, T.; Fukumoto, Y. Effects of the addition of deep seawater to a nutrient solution in hydroponics on growth, fruit yield and quality of tomatoes. J. Soc. High Technol. Agric. 2005, 17, 26–33, (In Japanese with English Abstract). [Google Scholar] [CrossRef][Green Version]
- Zhou, S.; Yoshino, M.; Maejima, K.; Odani, H.; Widiastuti, A.; Yamoto, I.; Unuma, M.; Misu, H.; Eguchi, Y.; Kamoda, H.; et al. Yield and quality of tomato (Solanum lycopersicum L.) cultured in bittern-supplemented hydroponic solution. Jpn. J. Farm Work Res. 2018, 53, 73–79. [Google Scholar] [CrossRef]
- Zushi, K.; Matsuzoe, N. Effect of soil water deficit on vitamin C, sugar, organic acid, amino acid and carotene contents of large-fruited tomatoes. J. Jpn. Soc. Hortic. Sci. 1998, 67, 927–933, (In Japanese with English Abstract). [Google Scholar] [CrossRef]
- Dorais, M.; Papadopoulos, A.P.; Gosselin, A. Influence of electric conductivity management on greenhouse tomato yield and fruit quality. Agronomie 2001, 21, 367–383. [Google Scholar] [CrossRef]
- Zushi, K.; Matsuzoe, N.; Yoshida, S.; Chikushi, J. Comparison of chemical composition contents of tomato fruit grown under water and salinity stresses. J. Soc. High Technol. Agric. 2005, 17, 128–136, (In Japanese with English Abstract). [Google Scholar] [CrossRef]
- Saito, T.; Matsukura, C.; Ban, Y.; Shoji, K.; Sugiyama, M.; Fukuda, N.; Nishimura, S. Salinity stress affects assimilate metabolism at the gene-expression level during fruit development and improves fruit quality in tomato (Solanum lycopersicum L.). J. Jpn. Soc. Hortic. Sci. 2008, 77, 61–68. [Google Scholar] [CrossRef]
- Saito, T.; Fukuda, N.; Matsukura, C.; Nishimura, S. Effects of salinity on distribution of photosynthates and carbohydrate metabolism in tomato grown using nutrient film technique. J. Jpn. Soc. Hortic. Sci. 2009, 78, 90–96. [Google Scholar] [CrossRef]
- Sawamura, T.; Kiriiwa, Y.; Miyako, T.; Kano, A.; Suzuki, K. Effects of nutrient solution concentration, cultivars, and culture methods on leaf resistance of tomato plant. Hortic. Res. 2021, 20, 179–187, (In Japanese with English Abstract). [Google Scholar] [CrossRef]
- Guichard, S.; Bertin, N.; Leonardi, C.; Gary, C. Tomato fruit quality in relation to water and carbon fluxes. Agronomie 2001, 21, 385–392. [Google Scholar] [CrossRef]
- Stevens, M.A.; Rudich, J. Genetic potential for overcoming physiological limitations on adaptability, yield, and quality in the tomato. HortScience 1978, 13, 673–678. [Google Scholar]
- Okano, K.; Nakano, Y.; Watanabe, S.; Ikeda, T. Control of fruit quality by salinity stress at various fruit development stages of single-truss tomato grown in hydroponics. Environ. Control Biol. 2002, 40, 375–382, (In Japanese with English Abstract). [Google Scholar] [CrossRef][Green Version]
- Oka, I.; Sue, N.; Takahashi, H. Effects of salt application on total soluble solids and fruit weight of tomato grown in hydroponics. Hortic. Res. 2004, 3, 149–154, (In Japanese with English Abstract). [Google Scholar] [CrossRef][Green Version]
- Johkan, M.; Nagatsuka, A.; Yoshitomi, A.; Nakagawa, T.; Maruo, T.; Tsukagoshi, S.; Hohjo, M.; Lu, N.; Nakaminami, A.; Tsuchiya, K.; et al. Effect of moderate salinity stress on the sugar concentration and fruit yield in single-truss, high-density tomato production system. J. Jpn. Soc. Hortic. Sci. 2014, 83, 229–234. [Google Scholar] [CrossRef]
- Itoh, M.; Goto, C.; Iwasaki, Y.; Sugeno, W.; Ahn, D.-H.; Higashide, T. Production of high soluble solids fruits without reducing dry matter production in tomato plants grown in salinized nutrient solution controlled by electrical conductivity. Hortic. J. 2020, 89, 403–409. [Google Scholar] [CrossRef]
- Zhang, P.; Senge, M.; Dai, Y. Effects of salinity stress on growth, yield, fruit quality and water use efficiency of tomato under hydroponics system. Rev. Agric. Sci. 2016, 4, 46–55. [Google Scholar] [CrossRef]
- Mukarram, M.; Choudhary, S.; Kurjak, D.; Petek, A.; Khan, M.M.A. Drought: Sensing, signalling, effects and tolerance in higher plants. Physiol Plant. 2021, 172, 1291–1300. [Google Scholar] [CrossRef]
- Zhao, S.; Zhang, Q.; Liu, M.; Zhou, H.; Ma, C.; Wang, P. Regulation of plant responses to salt stress. Int. J. Mol. Sci. 2021, 22, 4609. [Google Scholar] [CrossRef]
- De Pascale, S.; Maggio, A.; Orsini, F.; Stanghellini, C.; Heuvelink, E. Growth response and radiation use efficiency in tomato exposed to short-term and long-term salinized soils. Sci. Hortic. 2015, 189, 139–149. [Google Scholar] [CrossRef]
- Quinet, M.; Angosto, T.; Yuste-Lisbona, F.J.; Blanchard-Gros, R.; Bigot, S.; Martinez, J.-P.; Lutts, S. Tomato fruit development and metabolism. Front. Plant Sci. 2019, 10, 1554. [Google Scholar] [CrossRef]
- Yin, Y.-G.; Kobayashi, Y.; Sanuki, A.; Kondo, S.; Fukuda, N.; Ezura, H.; Sugaya, S.; Matsukura, C. Salinity induces carbohydrate accumulation and sugar-regulated starch biosynthetic genes in tomato (Solanum lycopersicum L. cv. ‘Micro-Tom’) fruits in an ABA- and osmotic stress-independent manner. J. Exp. Bot. 2010, 61, 563–574. [Google Scholar] [CrossRef] [PubMed]
- Ikeda, H.; Hiraga, M.; Shirasawa, K.; Nishiyama, M.; Kanahama, K.; Kanayama, Y. Analysis of a tomato introgression line, IL8-3, with increased Brix content. Sci. Hortic. 2013, 153, 103–108. [Google Scholar] [CrossRef]
- Carrari, F.; Asis, R.; Fernie, A.R. The metabolic shifts underlying tomato fruit development. Plant Biotechnol. 2007, 24, 45–55. [Google Scholar] [CrossRef]
- Plaut, Z.; Grava, A.; Yehezkel, C.; Matan, E. How do salinity and water stress affect transport of water, assimilates and ions to tomato fruits? Physiol. Plant. 2004, 122, 429–442. [Google Scholar] [CrossRef]
- Bertin, N. Analysis of the tomato fruit growth response to temperature and plant fruit load in relation to cell division, cell expansion and DNA endoreduplication. Ann. Bot. 2005, 95, 439–447. [Google Scholar] [CrossRef]
- Beauvoit, B.P.; Colombié, S.; Monier, A.; Andrieu, M.-H.; Biais, B.; Bénard, C.; Chéniclet, C.; Dieuaide-Noubhani, M.; Nazaret, C.; Mazat, J.-P.; et al. Model-assisted analysis of sugar metabolism throughout tomato fruit development reveals enzyme and carrier properties in relation to vacuole expansion. Plant Cell 2014, 26, 3224–3242. [Google Scholar] [CrossRef]
- Stikić, R.; Jovanović, Z.; Vucelić-Radović, B.; Marjanović, M.; Savić, S. Tomato: A model species for fruit growth and development studies. Bot. Serb. 2015, 39, 95–102. [Google Scholar]
- Antônio, A.C.; Silva, D.J.; Araújo, W.L.; Cecon, P.R. Tomato growth analysis across three cropping systems. Hortic. Bras. 2017, 35, 358–363. [Google Scholar] [CrossRef][Green Version]
- Adams, S.; Cockshull, K.E.; Cave, C.R.J. Effect of temperature on the growth and development of tomato fruits. Ann. Bot. 2001, 88, 869–877. [Google Scholar] [CrossRef]
- Higashide, T.; Yasuba, K.; Suzuki, K.; Nakano, A.; Ohmori, H. Yield of Japanese tomato cultivars has been hampered by a breeding focus on flavor. HortScience 2012, 47, 1408–1411. [Google Scholar] [CrossRef]
- Hayakawa, F.; Ando, A.; Kazami, Y.; Nakano, Y.; Zhao, T.; Nakano, A. Multiple evaluation of flavor and texture in tomatoes produced under long-term hydroponic culture that identifies the differences among cultivars and harvest periods. Nippon Shokuhin Kagaku Kogaku Kaishi. 2019, 66, 408–419, (In Japanese with English Abstract). [Google Scholar] [CrossRef]
- Calpas, J. Commercial Greenhouse Tomato Production in Alberta; Alberta Agriculture, Food and Rural Development: Edmonton, AB, Canada, 2003. [Google Scholar] [CrossRef]
- USDA Agricultural Marketing Service. Color Classification Requirements in United States Standards for Grades of Fresh Tomatoes; John Henry Co.: Lansing, MI, USA, 1975.
- Winsor, C.P. The Gompertz curve as a growth curve. Proc. Nat. Acad. Sci. USA 1932, 18, 1–8. [Google Scholar] [CrossRef] [PubMed]
- Bertin, N.; Génard, M. Tomato quality as influenced by preharvest factors. Sci. Hortic. 2018, 233, 264–276. [Google Scholar] [CrossRef]
- Ito, H.; Kawai, S. Effect of watering control on the fruit qualities of tomato and cherry tomato. Res. Bull. Aichi-ken Agric. Res. Cent. 1994, 26, 191–199, (In Japanese with English Abstract). [Google Scholar]
- Kita, N. Growth analysis of semi-forced tomato plants. Bull. Agric. Res. Inst. Kanagawa Pref. 1987, 34, 22–26, (In Japanese with English Abstract). [Google Scholar]
- Kubota, C.; Thomson, C.A.; Wu, M.; Javanmardi, J. Controlled environments for production of value-added food crops with high phytochemical concentrations: Lycopene in tomato as an example. HortScience 2006, 41, 522–525. [Google Scholar] [CrossRef]
- Giannakoula, A.E.; Ilias, I.F. The effect of water stress and salinity on growth and physiology of tomato (Lycopersicon esculentum Mill.). Arch. Biol. Sci. 2013, 65, 611–620. [Google Scholar] [CrossRef]
- Nangare, D.D.; Singh, Y.; Kumar, P.S.; Minhas, P.S. Growth, fruit yield and quality of tomato (Lycopersicon esculentum Mill.) as affected by deficit irrigation regulated on phenological basis. Agric. Water Manag. 2016, 171, 73–79. [Google Scholar] [CrossRef]
- Tang, H.; Zhang, X.; Gong, B.; Yan, Y.; Shi, Q. Proteomics and metabolomics analysis of tomato fruit at different maturity stages and under salt treatment. Food Chem. 2020, 311, 126009. [Google Scholar] [CrossRef] [PubMed]
- Liu, H.-F.; Génard, M.; Guichard, S.; Bertin, N. Model-assisted analysis of tomato fruit growth in relation to carbon and water fluxes. J. Exp. Bot. 2007, 58, 3567–3580. [Google Scholar] [CrossRef] [PubMed]
- Saito, T.; Kawasaki, Y.; Ahn, D.-H.; Ohyama, A.; Higashide, T. Prediction and improvement of yield and dry matter production based on modeling and non-destructive measurement in year-round greenhouse tomatoes. Hortic. J. 2020, 89, 425–431. [Google Scholar] [CrossRef]


| Group | Leaf Area Index (m2·m−2) | No. of Trusses Reaching Anthesis per Plant | No. of Fruits per Plant | Fruit Fresh Weight Yield (kg·m−2) | Fruit Dry Weight Yield (kg·m−2) | Total Dry Matter Production x (kg·m−2) | Dry Matter Distributed to Fruit y (%) |
|---|---|---|---|---|---|---|---|
| My, low-EC | 3.66 ± 0.62 ab | 19.3 ± 0.7 a | 58.4 ± 3.7 b | 15.46 ± 2.15 ab | 0.71 ± 0.09 a | 1.34 ± 0.14 bc | 53.1 ± 3.0 a |
| My, high-EC | 3.65 ± 0.61 ab | 18.8 ± 1.0 a | 62.9 ± 3.5 b | 11.90 ± 0.82 c | 0.67 ± 0.05 a | 1.25 ± 0.10 c | 53.4 ± 3.3 a |
| En, low-EC | 4.40 ± 0.66 a | 19.8 ± 0.5 a | 76.0 ± 2.8 a | 16.18 ± 1.52 a | 0.72 ± 0.07 a | 1.61 ± 0.17 a | 44.9 ± 1.8 b |
| En, high-EC | 3.41 ± 0.38 b | 19.5 ± 0.9 a | 75.5 ± 3.0 a | 12.92 ± 0.63 bc | 0.66 ± 0.03 a | 1.39 ± 0.07 b | 47.5 ± 1.9 b |
| Model | Group | F | 95% CI (Lower–Upper) | G | 95% CI (Lower–Upper) | H | 95% CI (Lower–Upper) |
|---|---|---|---|---|---|---|---|
| 3-parameter exponential decay | My, low-EC | 3.03 *** | 2.32–3.75 | 9.89 *** | 9.10–10.67 | 1.38 × 10⁻³ *** | 9.33 × 10⁻⁴–1.82 × 10⁻³ |
| My, high-EC | −1.75 n.s. | −9.75–6.25 | 10.93 *** | 10.17–11.69 | 4.75 × 10⁻⁴ * | 2.47 × 10⁻⁵–9.26 × 10⁻⁴ | |
| En, low-EC | 3.12 *** | 2.56–3.68 | 8.20 *** | 7.77–8.64 | 1.23 × 10⁻³ *** | 8.60 × 10⁻⁴–1.59 × 10⁻³ | |
| En, high-EC | 4.14 *** | 3.69–4.58 | 9.20 *** | 8.50–9.90 | 1.59 × 10⁻³ *** | 1.09 × 10⁻³–2.10 × 10⁻³ |
| Model | Response Variable | Group | C | 95% CI (Lower–Upper) | D | 95% CI (Lower–Upper) | E | 95% CI (Lower–Upper) |
|---|---|---|---|---|---|---|---|---|
| Gompertz | rW | My, low-EC | 1.07 *** | 1.05–1.10 | 10.1 *** | 9.0–11.1 | 3.95 × 10⁻³ *** | 3.74 × 10⁻³–4.15 × 10⁻³ |
| My, high-EC | 1.11 *** | 1.08–1.15 | 8.7 *** | 7.8–9.7 | 3.44 × 10⁻³ *** | 3.24 × 10⁻³–3.65 × 10⁻³ | ||
| En, low-EC | 1.08 *** | 1.06–1.09 | 8.0 *** | 7.6–8.3 | 3.55 × 10⁻³ *** | 3.46 × 10⁻³–3.64 × 10⁻³ | ||
| En, high-EC | 1.08 *** | 1.06–1.09 | 8.4 *** | 8.0–8.8 | 3.82 × 10⁻³ *** | 3.72 × 10⁻³–3.93 × 10⁻³ | ||
| rD | My, low-EC | 1.04 *** | 1.02–1.05 | 13.7 *** | 11.8–15.6 | 5.46 × 10⁻³ *** | 5.15 × 10⁻³–5.76 × 10⁻³ | |
| My, high-EC | 1.06 *** | 1.04–1.08 | 13.1 *** | 11.1–15.0 | 5.18 × 10⁻³ *** | 4.86 × 10⁻³–5.49 × 10⁻³ | ||
| En, low-EC | 1.03 *** | 1.02–1.04 | 9.6 *** | 9.1–10.1 | 4.70 × 10⁻³ *** | 4.57 × 10⁻³–4.82 × 10⁻³ | ||
| En, high-EC | 1.03 *** | 1.02–1.04 | 9.4 *** | 8.8–10.0 | 4.73 × 10⁻³ *** | 4.59 × 10⁻³–4.86 × 10⁻³ |
Publisher’s Note: MDPI stays neutral with regard to jurisdictional claims in published maps and institutional affiliations. |
© 2022 by the authors. Licensee MDPI, Basel, Switzerland. This article is an open access article distributed under the terms and conditions of the Creative Commons Attribution (CC BY) license (https://creativecommons.org/licenses/by/4.0/).
Share and Cite
Watabe, T.; Nakano, Y.; Ahn, D.-H. The Effect of Electrical Conductivity on Fruit Growth Pattern in Hydroponically Grown Tomatoes. Crops 2022, 2, 323-335. https://doi.org/10.3390/crops2030023
Watabe T, Nakano Y, Ahn D-H. The Effect of Electrical Conductivity on Fruit Growth Pattern in Hydroponically Grown Tomatoes. Crops. 2022; 2(3):323-335. https://doi.org/10.3390/crops2030023
Chicago/Turabian StyleWatabe, Takafumi, Yuka Nakano, and Dong-Hyuk Ahn. 2022. "The Effect of Electrical Conductivity on Fruit Growth Pattern in Hydroponically Grown Tomatoes" Crops 2, no. 3: 323-335. https://doi.org/10.3390/crops2030023
APA StyleWatabe, T., Nakano, Y., & Ahn, D.-H. (2022). The Effect of Electrical Conductivity on Fruit Growth Pattern in Hydroponically Grown Tomatoes. Crops, 2(3), 323-335. https://doi.org/10.3390/crops2030023