1. Introduction
In recent years, a modal shift in urban transportation has been observed, with public transport such as light-rail, as well as active travel and micromobility, displacing car usage. In the United Kingdom (UK), the most recent National Travel Survey results show that, whilst overall distance travelled by the average resident is 14% lower than in 2004, distances travelled by walking and cycling in 2024 were the highest since records began in 2002 [
1]. In the UK, distance covered by trams on tramway systems (networks classified as tramways are: London Trams, Nottingham Express Transit, West Midlands Metro, Sheffield Supertram, Manchester Metrolink, Blackpool Tramway, Edinburgh Trams) has increased by 113%, from 12.6 million km in 2005 to 26.8 million km in 2025, with new routes and the expansion of existing routes in this time period acting as contributing factors to this growth [
2]. Increased light-rail uptake is a trend seen Europe-wide, with over 10 billion journeys conducted by light-rail in 2019, and 420 km of new routes opening between 2015 and 2018 [
3]. Rapid growth in micromobility is also observed, with increased usage of shared mobility infrastructures such as e-scooter and station-based bicycles observed [
4].
Urban transportation modal shift trends are expected to continue in the coming years. In 2020, the UK Department for Transport (DfT) predicted that 50% of urban journeys will be conducted by walking or cycling by 2030 [
5]. McKinsey predicted in 2022 that, by 2035, the proportion of journeys completed by car in urban areas will decrease, from 45% to 29%, displaced by public transport, micromobility, ride-hailing, and new forms of transportation [
6].
Given these changes in transportation, it is pragmatic to consider the safety of interactions between different modes, especially for Vulnerable Road Users (VRUs). In 2012, the UK Rail Accident Investigation Branch (RAIB) called for improved understanding of tram-to-pedestrian interactions, following a pedestrian fatality in a collision with a tram in Manchester the year prior [
7]. Expansion of tram networks in urban settings means that interactions between trams and pedestrians, and their implications on safety, are becoming increasingly important, according to Lackner [
8].
This paper proposes that a greater scope of VRUs, defined as road users with little-to-no external protection in a collision [
9], should be considered in interactions with trams, compared to what is considered presently in the literature. This would enable a cognisant approach to be taken to tram safety, ensuring that recommendations and regulatory requirements for VRU safety account for both current and projected behaviours in transportation. This paper adopts the UK Office of Road and Rail definition of trams [
10], considering a tram to be a type of light-rail vehicle which operates for a significant amount of its useful life in highway or public space.
The safety measures considered for Tram–VRU collisions can be categorised into three types: active safety, passive safety, and infrastructural safety. Active safety relates to technologies on vehicles to prevent collisions occurring, such as autonomous braking when hazards are detected. Passive safety refers to structural or geometric design of vehicles to mitigate against injury risk in collisions. Infrastructural safety refers to design of safer infrastructures to prevent injuries occurring, and can be supported through studies such as that of Mirzahossein et al. [
11], which uses machine learning to identify potential collision hotspots, which may enable further analysis and redesign of infrastructures.
This paper focuses on passive safety design of trams and sets about redefining how crash-compatibility is assessed for such vehicles. An investigative study into how different VRUs, such as e-scooter riders and cyclists, interact with trams, has been conducted. We conduct studies into the injury mechanisms observed for VRU casualties of tramway and road collisions, the speeds at which tram–VRU collisions occur and the relative positioning of VRUs around tram infrastructures and vehicles. Based on this analysis, recommendations are made which should inform future accidentology studies regarding VRU safety around trams.
At present, there are two sets of guidelines defining crash-compatibility for trams in collisions with VRUs. The governing body for light-rail in France, the Service Technique des Remontées Mécaniques et des Transports Guidés (STRMTG), published their guidelines into tram–pedestrian safety in 2016 [
12] before technical report CEN/TR 17420 was published in 2020 [
13]. The authors of this report have identified limitations of both STRMTG and CEN/TR 17420 guidance, which limit the capability for either set of guidelines to suitably represent real-world risks from tram–VRU collisions. Specifically, research gaps regarding the way in which VRUs are represented in tram–VRU interactions and the influence of secondary impact, between the pedestrian and the ground, in a collision have been identified. There are also questions over whether the injury criteria assessed and the vehicle collision speed specified are suitable for representing tram–pedestrian collisions resulting in serious injury, which this report addresses. Therefore, the purpose of this report is to evaluate the extent to which existing guidance captures real-world injury risks and interactions between trams and VRUs.
The novelty of this study lies in the synthesis of real-world data to determine where improvements are necessary to the existing tram–VRU crash-compatibility guidance. This study identifies areas where the existing guidance does not reflect real-world scenarios, and an analysis of existing data on these areas has been performed. Such analysis has then been synthesised to make recommendations on how improvements can be made to the existing guidance, specifically CEN/TR 17420 [
13], to better capture the real-world injury risks to VRUs around trams.
2. Literature Review
In the UK between 2005 and 2025, the RAIB reported that there were 146 instances of tram collisions with pedestrians, cyclists, users of e-scooters, mobility scooters or wheelchairs. These incidents caused 17 fatalities, 28 serious injuries and 24 minor injuries (Email from A. Lewis, Deputy Chief Inspector of Rail Accidents, RAIB, 11 July 2025). For reference, over this period, vehicular distance covered by trams in the UK was estimated to be 398 million kilometres [
2]. As part of a wider study on safe tram infrastructures, Saari [
14] evaluated the nature of tram collisions in three European cities. Over 15% of tram collisions in Helsinki (Finland), 28% of tram collisions in Gothenburg (Sweden), and 47% of tram collisions in Dublin (Republic of Ireland) involved VRUs.
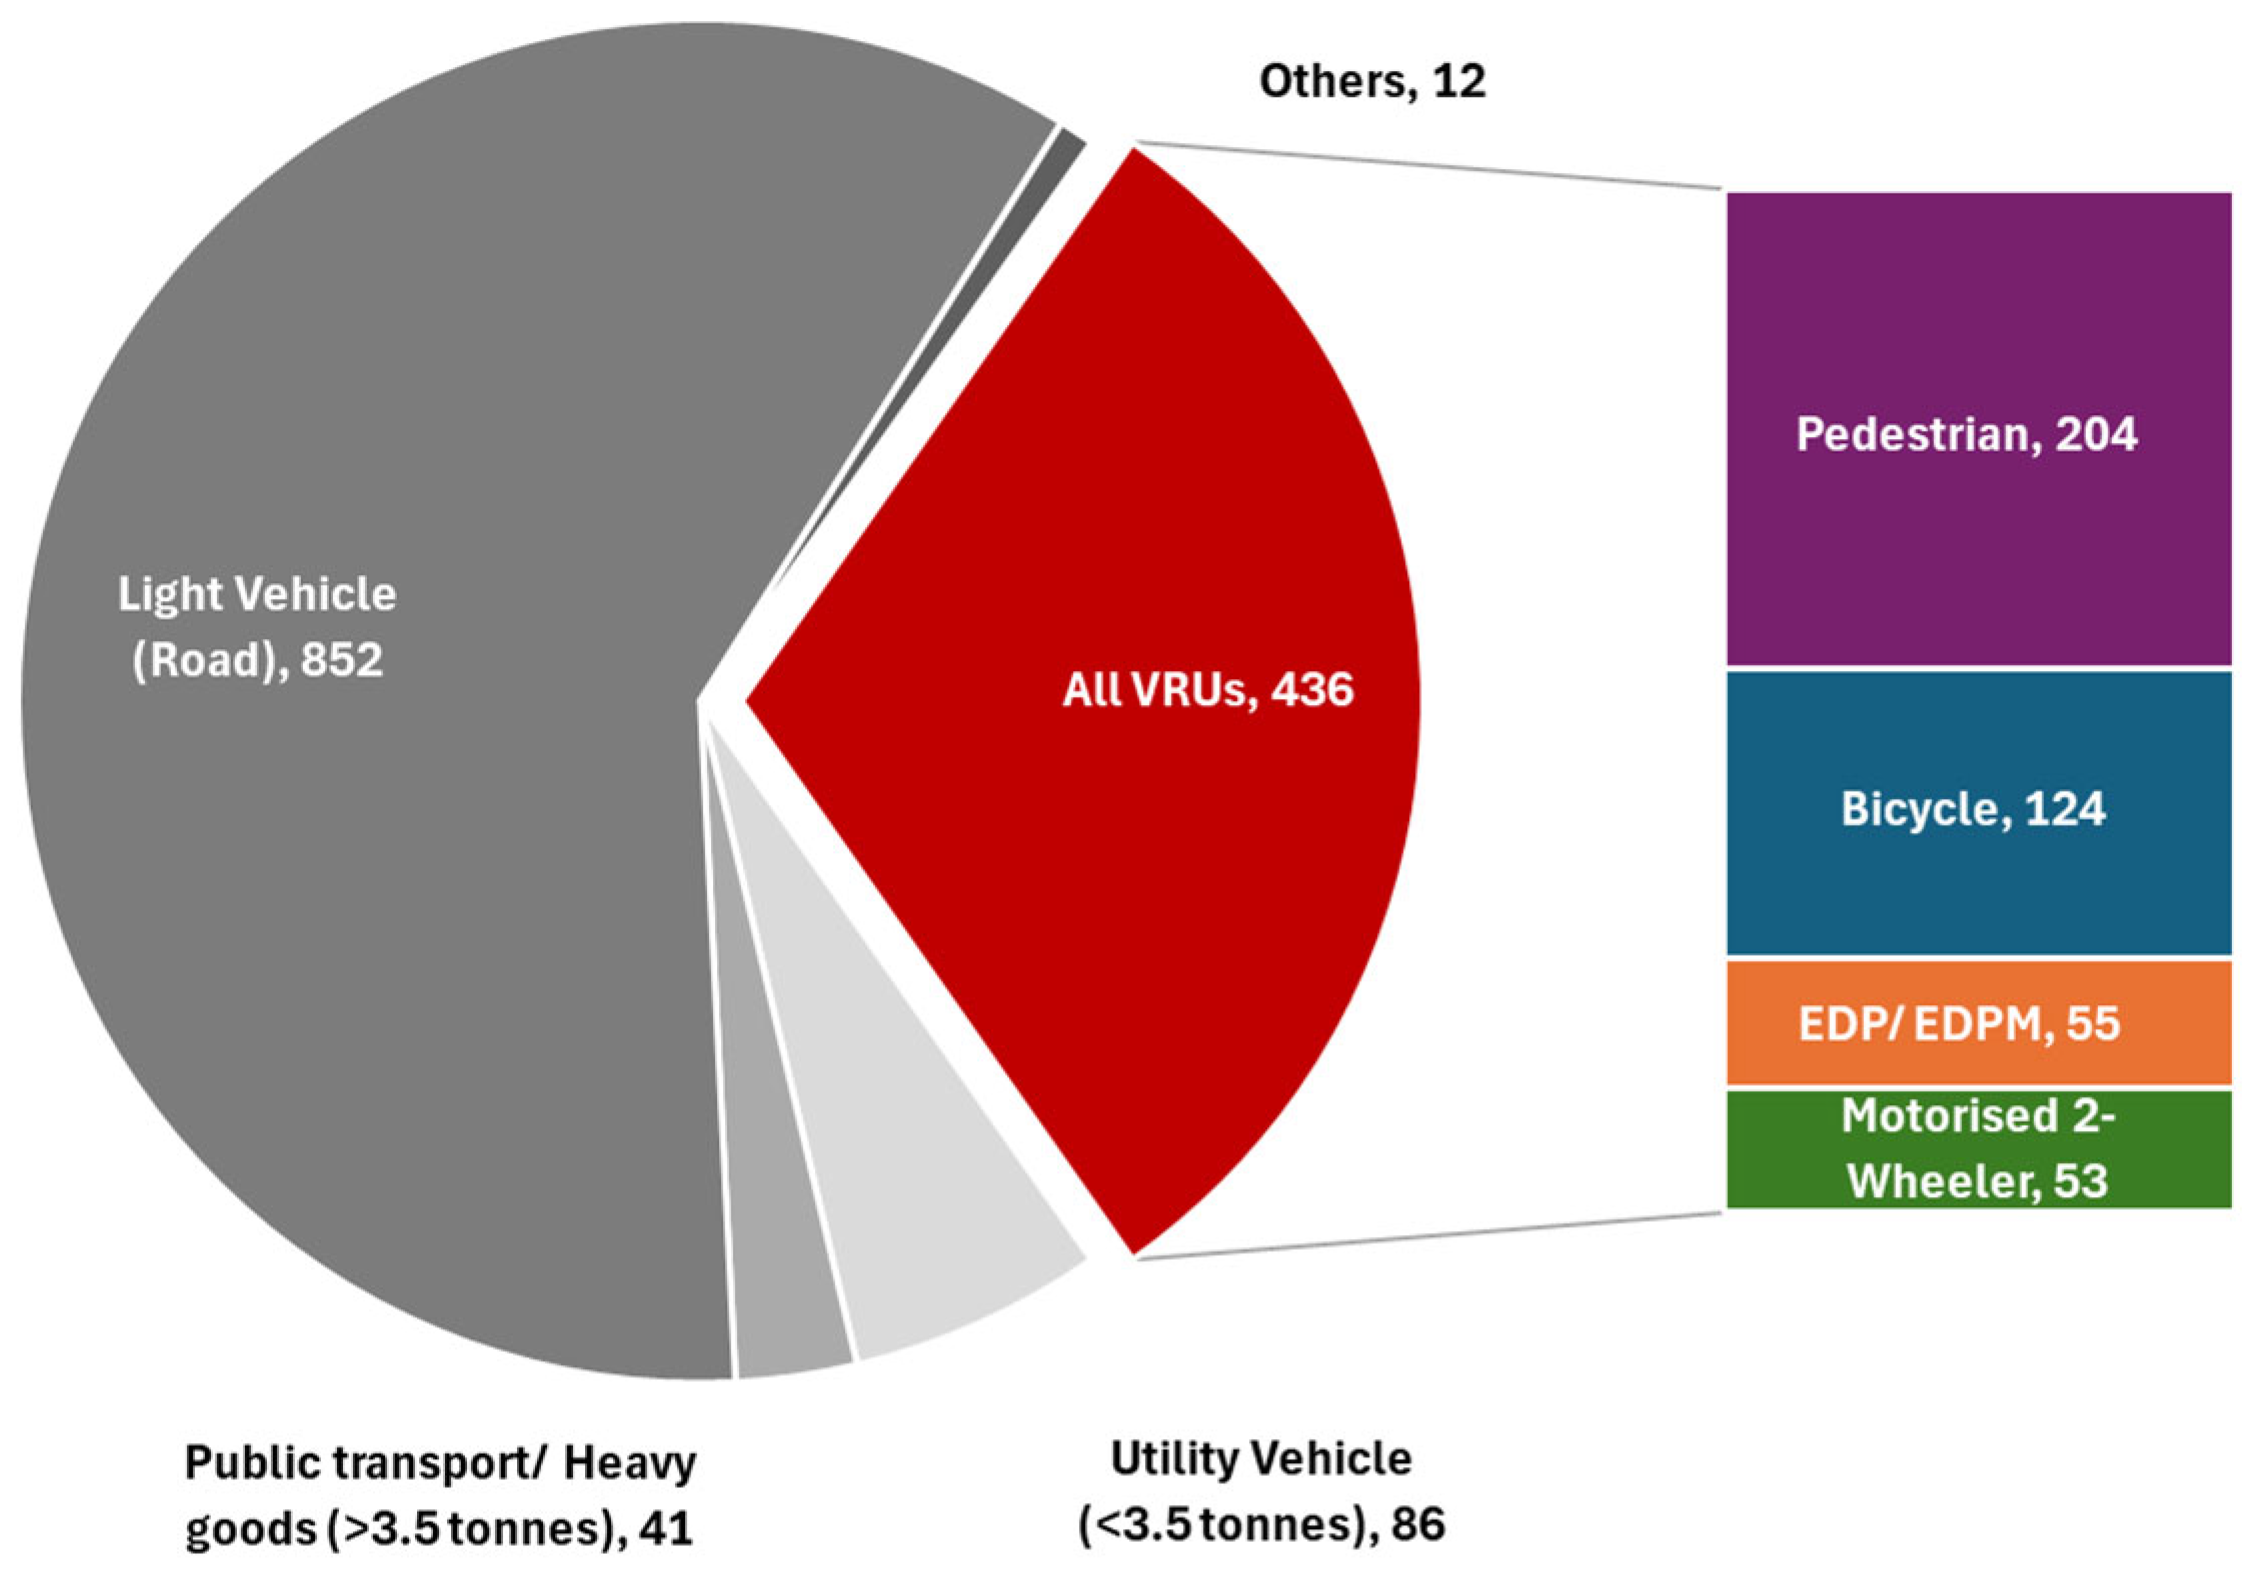
The STRMTG, who are the governing body for tramways in France, publish annual figures for tram incidents with other road users (referred to as “third-parties”). In the latest dataset, covering tram-to-third-party collisions in 2024 [
15], 1427 collisions were reported in France, with 31% of these involving VRUs (
Figure 1), a 26% increase from 2021. A significant increase in EDP/EDPMs (EDP = Engins de Déplacement Personnels (English: Personal Displacement Vehicles); EDPM = Engins de Déplacement Personnels Motorisés (English: Personal Motorised Displacement Vehicles)), which refers to micromobility solutions such as scooters, e-scooters, gyropods and unicycles [
16], in tram–VRU collisions was seen, from 25 in 2021 to 55 in 2024. Of the four identified types of VRU reported (pedestrian, bicycle, EDP/EDPM, motorised two-wheeler), pedestrians made up less than half of the VRUs involved in tram collisions in France in 2024.
2.1. VRU Injury Susceptibility
The physical characteristics of trams, combined with VRU susceptibility to injury, mean that risks of injury are greater for tram–VRU interactions than for other road interactions. Following analysis of over 400 collisions between trams and pedestrians, Gaca and Franek observed that, at 20 km/h impact speed, trams are 11 times more likely than a car to fatally injure a pedestrian [
17]. Non-motorised road users have been reported to be at nine times greater risk of being killed due to impact with a tram than motorised road users [
18]. A study of tram crashes in Melbourne, Australia showed that tram–pedestrian crashes are over three times as likely to lead to serious injury or fatality, and tram–cyclist crashes are over twice as likely to result in severe injury, compared to tram crashes with other vehicle types [
19]. In their study reviewing tram-related injuries in Sheffield based on hospital records, Cameron et al. [
20] identified that cyclists were the road user group most frequently hospitalised due to their injuries.
Taking data from 16 different tram networks in Europe, the risk of tram–pedestrian collisions was quantified by Lackner et al. [
21]: a risk of 1.444 VRU casualties per million tram-kilometres travelled was reported. This is striking when compared to UK DfT statistics for bus mileage [
22] and road casualties with pedestrians [
23], which gives a risk of 0.281 casualties per million km travelled by bus rolling stock. This indicates that trams could be five times more likely than a bus to injure a pedestrian. However, comparisons between the two findings have limitations, since they are based on data from different countries with differences in how collision data is collected and collision severity categorised.
Recent studies have demonstrated that micromobility users are particularly susceptible to specific types of injury. Compared to motorcyclists, e-scooter riders are more than three times more likely to sustain traumatic brain injury or vascular trauma in a road collision, with e-scooter users also being at 74% higher risk of traumatic head injury relative to cyclists [
24]. The rapid rise in electric bicycle (e-bike) and e-scooter usage has led to increasing numbers of hospitalisations for riders of such vehicles in recent years [
25].
2.2. Tram–VRU Guidelines and Incident Reporting
The earliest reported study on the VRU crash-compatibility of trams was authored by Grzebieta and Rechnitzer in 2000 [
26]. In their experiment, two different tram models used in Melbourne, Australia (A-Class, Z-Class) were assessed, using Finite Element Analysis (FEA), in collision scenarios with a pedestrian, represented with an Anthropomorphic Test Device (ATD). Both tram designs which were assessed were deemed “unnecessarily aggressive” on pedestrians in collisions. According to the tram operator, Yarra Trams, 69 A-Class and 86 Z-class trams are still in commercial operation today [
27].
Guidelines have been developed for crash-compatibility testing of light-rail vehicles. The STRMTG published guidelines in 2016 [
12], before the Comité Européen de Normalisation (CEN) produced technical report CEN/TR 17420 [
13], which is perceived to be the basis of a future European standard [
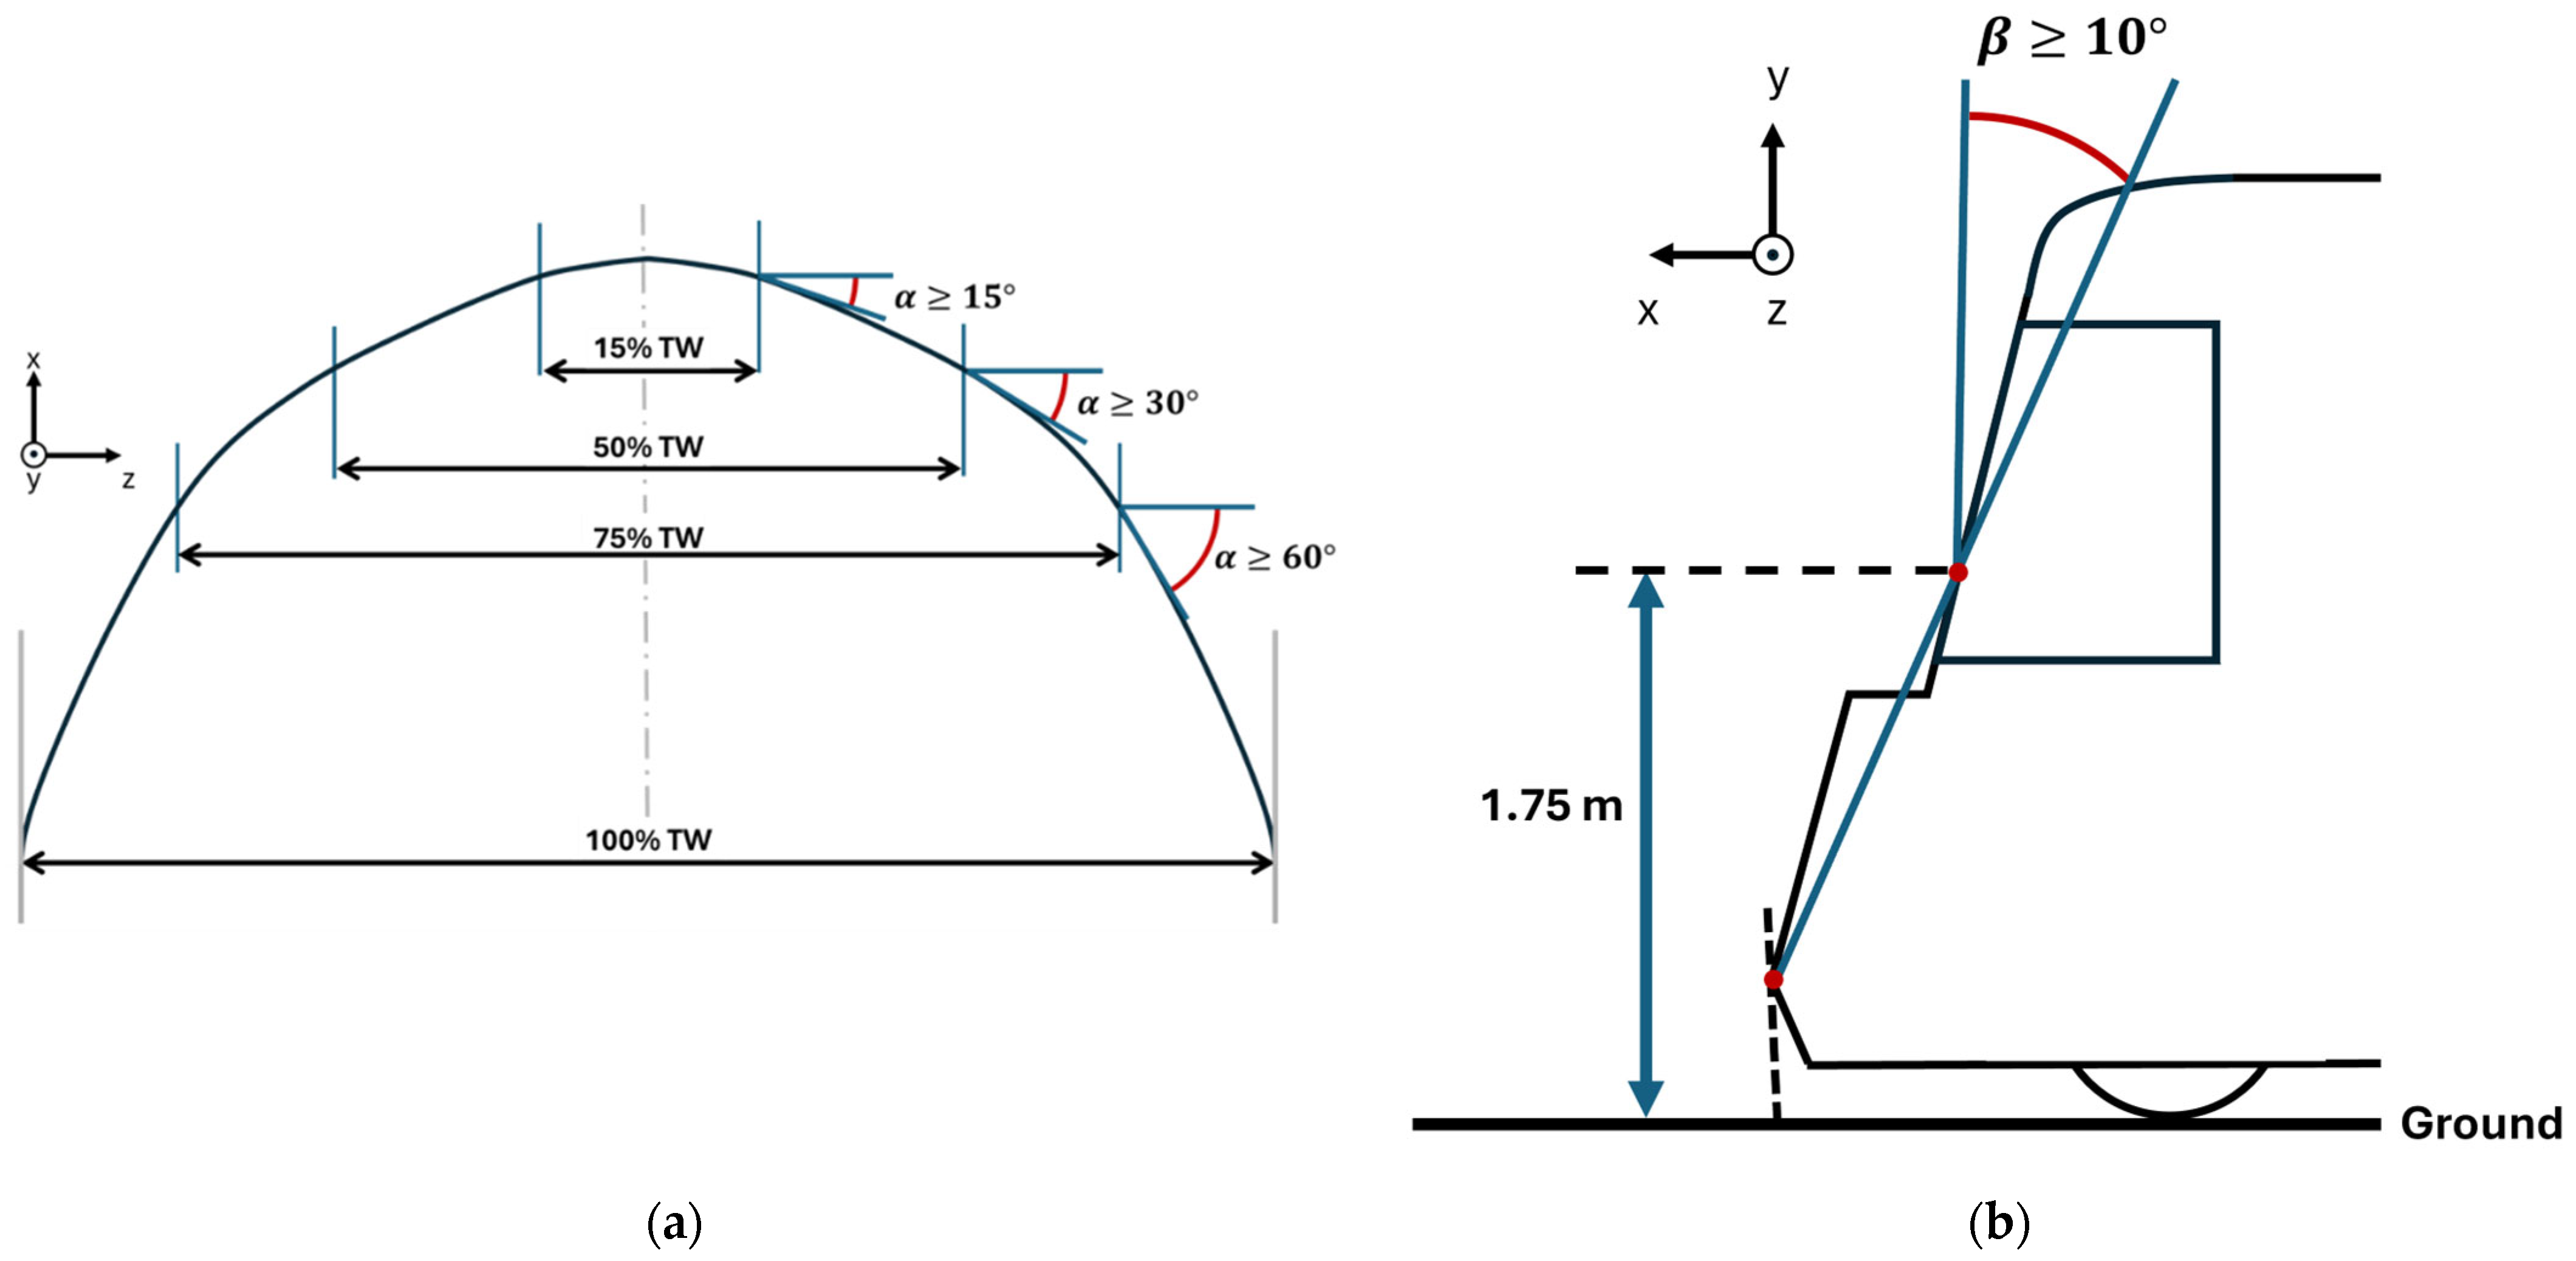
28]. There are many similarities between STRMTG guidance and CEN/TR 17420 testing methodologies, including the impact speed considered (20 km/h), the use of Head Injury Criterion (HIC) to assess head injury risk, and the metrics used to assess primary (initial collision) and tertiary (runover) collision phases. Both reports specify vehicular geometries which would make a vehicle exempt from testing. CEN/TR 17420 specifies minimum α angles, defined as the angle between the vehicle body and the lateral axis at defined points along the tram width (TW) (
Figure 2a). The β angle refers to the angle between the vertical axis, and an imaginary line which goes from the furthest forward point of the tram to the external body of the front of the tram at a height of 1.75 metres above the ground (
Figure 2b). A minimum β angle of 10° is specified by CEN/TR 17420. A tram conforming to such geometric features may be said to have an “optimised front-end design”.
Since its publication, studies have been conducted on tram safety using the methodology stated in CEN/TR 17420. Human Body Models (HBMs) have been used in tram-to-pedestrian FEA studies [
29], considering sex-based differences in collision biomechanics and injury risk. Lackner [
8] also critically evaluated the impact of α and β angles in pedestrian protection in tram–VRU collisions, and observed reduced head injury risks when vehicles conform with minimum α and β angles defined in CEN/TR 17420.
Real-world crash-compatibility testing to CEN/TR 17420 methodologies has also been conducted, using ATD representation of a pedestrian. Such studies have looked at head injury risk to pedestrians in both the primary [
30] and secondary impact [
31] phases, which concern the initial vehicle-to-pedestrian impact and subsequent pedestrian impact with the ground, respectively. Tram-to-pedestrian FEA crash-compatibility studies have been conducted for both a tram with “optimised front-end design” according to CEN/TR 17420 guidance, and for a novel tram [
32]. Correlation studies between virtual, FEA tram–pedestrian experiments and real-world equivalences carried out with ATD representation of pedestrians are, however, rare. One such study found in the literature was a preliminary experiment, where a different tram model was used for FEA representation of a tram compared to the vehicle used for real-world, tram-ATD testing [
33].
STRMTG [
12] and CEN/TR 17420 [
13] consider primary and tertiary impact, but secondary impact is not considered in either report. This is despite Weber et al. [
18] reporting that secondary impact is frequently observed in tram–VRU collisions, and dangers associated with secondary impact being highlighted [
31]. In the automotive sector, Otte and Pohlemann [
34] reported that approximately 1 in 3 pedestrian injuries in car-to-pedestrian collisions can be attributed to secondary impact, and vehicle geometry is evidenced to influence kinematics and secondary impact risk [
35,
36]. The authors therefore recommend addressing weaknesses in CEN/TR 17420 and STRMTG methodologies so that future tram–VRU accidentology studies account for secondary impact, ensuring that designing for passive safety does not inadvertently increase secondary impact risks to VRUs.
There is the question over whether the injury criteria measured in CEN/TR 17420 are sufficient to capture real-world risks to pedestrians or other categories of VRU. One of the purposes of this paper is to definitively address this question, by evaluating real-world data to understand the nature of injuries suffered by VRUs in road and tram collisions. From this insight, appropriate injury criteria for tram-to-VRU collisions can be determined.
In automotive crash testing, the European New Car Assessment Programme (Euro NCAP) conducts crash safety tests which assess head, pelvic and leg injury risks for VRUs [
37]. For reviewing safety in two-vehicle collisions, Euro NCAP assesses injury risks to the head, neck, chest, pelvis and legs of the driver and passenger, as well as the abdomen and ankles of the driver [
38]. By contrast, the only physical injury criterion discussed in CEN/TR 17420 is HIC, for head injury risk. In this paper, we therefore include evaluation of VRU injury patterns in collisions, to determine the suitability of a crash-compatibility methodology which solely focuses on head injury risks.
Furthermore, CEN/TR 17420 only considers pedestrians in crash-compatibility scenarios. Automotive studies on VRU crash-compatibility have highlighted differences in injury mechanics of different vehicle–VRU collision scenarios [
39,
40]. Whilst, at present, the amount of reported tram collisions with cyclists or e-scooter users is significantly below the number of tram-to-pedestrian collisions, it would be prudent to consider that modal shift in urban transportation may lead to a greater number of tram–VRU collisions. This is especially important when inter-modal development of urban transport networks is considered, given that shared micromobility has potential as a first-mile and last-mile mode to compliment conventional “hop-on, hop-off” public transportation [
41].
2.3. Accidentology
When categorising injury severity, the Abbreviated Injury Scale (AIS) is often used. Developed by the Association for the Advancement of Automotive Medicine (AAAM) [
42], the AIS enables codification and severity classification of individual injuries. The full AIS code for a specific injury is a seven-digit number, providing information on the body region and anatomic structure affected, the nature of the injury, and anatomic detail, with the final digit being a severity categorisation (AIS Score) [
43]. AIS scores are based on survivability of injuries [
44], ranging from 1 (minor) to 6 (maximal). AIS scores of 0 (no injury) and 9 (unknown severity) may also be reported.
The Maximum Abbreviated Injury Scale (MAIS) looks at the maximum AIS score recorded for a specific body region or injury type [
44]. For a casualty who suffers multiple injuries, the MAIS highlights the most severe injuries in a particular area. MAIS is used to quantify the Injury Severity Score (ISS), which is where five body regions (head/neck, face, chest, abdomen, extremities/pelvis) and external injuries (e.g., burns, lacerations) are categorised by MAIS scores. The sum of the squares of the three highest MAIS scores for each region gives the ISS. The ISS is a scale from 0 to 75, with the presence of any single AIS 6 injury leading to an ISS value of 75 being assigned [
45]. There are limitations to the use of AIS as an injury metric, such as the fact that consequences of injury such as long-term impairments or clinical complexity are not accounted for in the description of injury severity [
44].
Many road collision databases, such as the German In-Depth Accident Study (GIDAS) [
46], the Rhône Road Trauma Registry (Rhône region, France) [
47], and the Swedish Traffic Accident Data Acquisition (STRADA) database [
48] use AIS scores to categorise injuries. In the UK, the STATS19 database records severity differently, with three categories of injury severity (killed, serious injury, slight injury) defined, and a list of defined injuries and their defined severities used to assess severity [
49]. This reduces uncertainty based on individual perceptions by non-medical professionals of injuries sustained. This paper analyses injuries sustained in tram and road traffic collisions, and many of the studies considered in this process use AIS or MAIS to categorise injury severity.
Correlating injury severity to economic impact is of interest. The National Highway Traffic Safety Administration (NHTSA) in the United States of America (USA) published a report in 2002 concerning the financial impact of road collisions for casualties based on AIS scores [
50]. In their report based on economic data from the year 2000, NHTSA estimated costs of
$62,020 for each casualty with MAIS2 (moderate) injuries, and
$186,097 per casualty with MAIS3 (serious) injuries [
50]. The use of a US Bureau of Labour Statistics inflation calculator [
51] has estimated that this correlates to approximately
$119,000 per MAIS2 casualty, and
$357,000 per MAIS3 casualty, as of November 2025. In the UK, Birmingham City Council estimated, in a report published in 2024, costs for road traffic collisions of £271,000 per seriously injured casualty and £2.4 million per fatality [
52].
Injury criteria correlate the physical parameters of an event, such as forces and accelerations, to a quantifiable metric from which the risk of injury can be observed [
44], and are essential for assessing injury risk in passive safety studies. For head injuries, HIC, which defines a score based on the acceleration-time response of the head in a collision [
53], is commonly used in the automotive and transport sectors. The viscous compression criterion (VC), which is the product of the deflection and velocity of deformation of the chest [
54], is an injury criterion used to assess thoracic injury risk. At present, HIC is the only biomechanical injury criterion used to assess injury risks in tram–pedestrian guidelines. In this paper, we will identify whether HIC adequately captures pedestrian and VRU injuries in collisions with other vehicles, especially trams, and identify which body regions require consideration in future accidentology studies.
3. Materials and Methods
In this paper, a study has been conducted, enabling future tram–VRU safety research to account for real-world usage scenarios and injury biomechanics of VRUs. Three factors concerning the nature of VRU interactions with infrastructures or injury risk in collisions have been defined:
Body regions susceptible to injury.
VRU interactions with road/tram infrastructures.
Speed and location of tram–VRU collisions.
Factor 1 (body regions susceptible to injury) allows for improved understanding of the nature and severity of injuries obtained by VRUs. This is achieved by determining the body regions most commonly injured by VRUs, accounting for severity of injuries (e.g., AIS scores) where possible. Improved understanding in this area will enable suitable injury risk criteria to be identified for future tram-to-VRU collision studies.
Tools such as Scopus and Google Scholar were used to source tram-to-VRU safety studies, supplemented by a search for the “grey” literature, such as communications from conference proceedings. A search was conducted for papers referring to injuries sustained in tram collisions with VRUs, with papers explicitly referring to the body regions injured being considered. Papers categorising injuries sustained based on severity were preferred. This search led to 7 papers being identified covering injuries from tram–VRU collisions, of which 3 were excluded from the overall findings due to significant limitations (discussed in greater detail in
Section 4.1.1).
None of the studies identified addressed micromobility users in tram collisions. Due to the limited number of papers covering tram collision data, this was supplemented by VRU road collision data. Studies were identified which categorised injuries into body regions and injury severity, and were used to validate whether the injury patterns and mechanisms in tram–VRU collisions were typical of all VRU casualties. A total of 10 papers covering injury data from VRU road collisions, deemed by the authors to be most relevant and covering injury data from over 57,000 VRU casualties, were identified.
Factor 2 (VRU interactions with road/tram infrastructures) considers how VRUs prefer to utilise road and tram infrastructures, as well as the ways in which it is recommended that VRUs utilise tram or tram-adjacent infrastructure. For future tram–VRU crash-compatibility experiments, this information will inform positioning of VRUs relative to the tram direction of travel. By implementing recommendations made in this paper, simulated environments will be brought more in line with real-world collision scenarios.
For Factor 2, preferences for VRUs around tram and road infrastructures are based on analysis of previous works evaluating infrastructure usage. For e-scooter users, studies which investigate preferences for infrastructure use were considered. This was focused on e-scooter users given that e-scooters are a relatively new technology, with rules on where they can and cannot be used varying by country [
55]. The assumption was made that cyclists would use roads if cycle lanes or paths are unavailable along their preferred route, therefore adhering to the UK Highway Code [
56].
Recommendations for design of tramways for cyclist safety, and papers highlighting specific dangers of tramways for cyclists, were used to consider how micromobility users may use shared road and tramway infrastructures. From this information, recommendations of the positioning of different micromobility modes, such as cyclists and e-scooter users, in tram-to-VRU accidentology studies may be made.
On the topic of VRU preferences around road and tram infrastructures, a total of 8 papers were identified which were deemed suitable for this study: 6 were journal publications, 1 was a postgraduate degree thesis and 1 was design guidelines for safe tram infrastructures.
Factor 3 (speed and location of tram–VRU collisions) considers the literature where either the relative location of tram–VRU collisions (e.g., proximity to tram stops or intersections) or the impact speeds of tram–VRU collisions are evaluated. The purpose of this study is to determine whether current CEN/TR 17420 and STRMTG guidelines, which use an impact speed of 20 km/h for tram–VRU collisions, are representative of real-world injury risks.
For Factor 3, analysis of works commenting on collision speeds in tram–VRU collisions was performed, enabling it to be determined whether 20 km/h is an appropriate impact speed to capture real-world collision scenarios. By considering the site or location of tram–VRU collisions, the assumption was made that, at interfaces, such as pedestrian crossings or otherwise signalised crossings, and at tram stops, trams would be moving at a low speed, due to the close proximity of a stop or intersection.
A total of 4 papers were identified where tram–VRU collision data was analysed which considered the speed or location of tram collisions, with all 4 referring to the location of collisions in some capacity and two also looking at collision speed and the influence speed has on outcomes in tram–pedestrian collisions. Whilst ideally a larger sample size of the literature would be desired for this study, the small sample size is reflective of the limited amount of tram–VRU accidentology studies which have been conducted previously, which highlights the need for the research presented in this report.
5. Discussion
5.1. Body Regions Susceptible to Injury
There are strong similarities between existing research investigating injury patterns in tram-to-pedestrian collision scenarios. The works of Hedelin et al. [
59], Lackner et al. [
21] and Erian et al. [
58] identified the head, thorax and lower extremities as the three body regions for which injuries were most prominent in high-severity (AIS 3+) injuries. The similarities in findings observed for body regions susceptible to injury occur despite the time periods captured and the locations of tram networks being different, and vehicle fleets inevitably differing between the tram networks captured in each study. This demonstrates a universality of the body regions which are most frequently affected in tram–pedestrian collision scenarios.
Another finding from tram–pedestrian collision data is that certain body regions make up greater shares of AIS 3+ injuries. Frequent AIS 2+ injuries are observed to the face [
21,
58] and upper extremities [
58,
59], which are regions making up significantly lower shares of observed AIS 3+ injuries. The thorax is often one of the most likely body regions to sustain AIS 3+ injury, despite not being one of the most frequent regions to experience AIS 2+ injury.
This raises questions over the intended purpose of selection of injury criteria in passive safety studies, and the factors affecting decision-making in this area. A compelling argument could be made that body regions with the greatest risk of AIS 3+ injury should be focused on, given that AIS scores comment on the severity and survivability of injuries, i.e., the purpose of passive safety is to reduce the likelihood of life-threatening or debilitating injury. Another argument which could be made is the economic impact of casualties should be considered: focusing on designing vehicles around the associated costs of each injury criteria and the relative frequencies of each criterion could therefore be factored into assessments of designing vehicles for passive safety.
Similarities in the body regions most frequently at-risk of injury can be observed between tram–pedestrian injuries and VRU injuries in road collisions or falls overall. Injuries to the lower extremities, head, thorax and upper extremities are prevalent for pedestrians, e-scooter users and cyclists. Additionally, when findings were categorised by injury severity, similar patterns emerge for the body regions affected by tram–pedestrian collisions and VRU casualties as a whole. Thoracic injuries are of greater importance as overall injury severity increases, whilst upper extremities are less likely to suffer higher severity injuries. The parallels in these findings provide validation for the argument that a data-driven approach which accounts for all VRU casualties can be used to identify body regions most susceptible to injury for tram–VRU interactions.
From the data presented by Lackner et al. [
21], Erian et al. [
58] and Hedelin et al. [
59], the existing guidance for tram–pedestrian collisions captures ~22–36% of real-world AIS3+ (serious-to-fatal) injuries by using HIC as the sole injury criterion. This is based on the assumption that HIC, as a metric, is representative of all head injury mechanisms. From analysing the data of these three sources, it is recommended in this study that updated guidance for tram–VRU crash-compatibility should consider thoracic and lower extremity injuries. If suitable injury criteria are selected for analysing head, thorax and lower extremity injury risks in collisions, there is the potential for ~78–84% of AIS3+ severity injuries from real-world tram–pedestrian collisions to be captured in improved guidelines. Analysis of 10 further studies covering data from over 57,000 VRU casualties (16,029 pedestrians, 38,910 cyclists, 2369 scooter, e-scooter or PMD riders) supports evidence from tram–pedestrian studies that the head, thorax and lower extremities are the three body regions most susceptible to injury in VRUs. Therefore, the head, thorax and lower extremities should be focused on when expanding tram crash-compatibility guidelines to better account for a wider scope of VRU transportation.
5.2. VRU Interactions with Road and Tram Infrastructures
For e-scooter users, the analysis conducted in this report shows that segregation away from other road users, especially away from motorised vehicles such as cars and buses, is a leading factor in route choice and/or perceptions of safety. Studies which utilise GPS data to understand e-scooter users and the use of road infrastructures show that e-scooter users are prepared to travel further to use their preferred infrastructure on journeys, with perceived journey distances decreasing when using dedicated cycling infrastructures.
Cycling infrastructures and pavements are also preferred to the road in field observations. Survey results support the idea that e-scooter riders feel safer when sharing infrastructures with cyclists or pedestrians, as opposed to using the road where they share infrastructures with heavy vehicles such as cars, buses or trams. This finding is consistent, even when e-scooter use on such infrastructures contradicts the law or guidance on safe e-scooter usage.
Furthermore, the dangers of grooved rails used for tramway infrastructures have been highlighted. Previous research has highlighted the risk of track wedging, where the wheels of a micromobility vehicle get caught in the track grooves, when a micromobility user such as a cyclist travels parallel to the grooves on the rails. Track-skid, where a cyclist loses balance on the tracks due to lack of grip, has also been highlighted as a risk to cyclist safety around light-rail infrastructures. Previous research has recommended that cyclist routes are appropriately segregated from tram routes and that crossings be designed to be perpendicular where space allows.
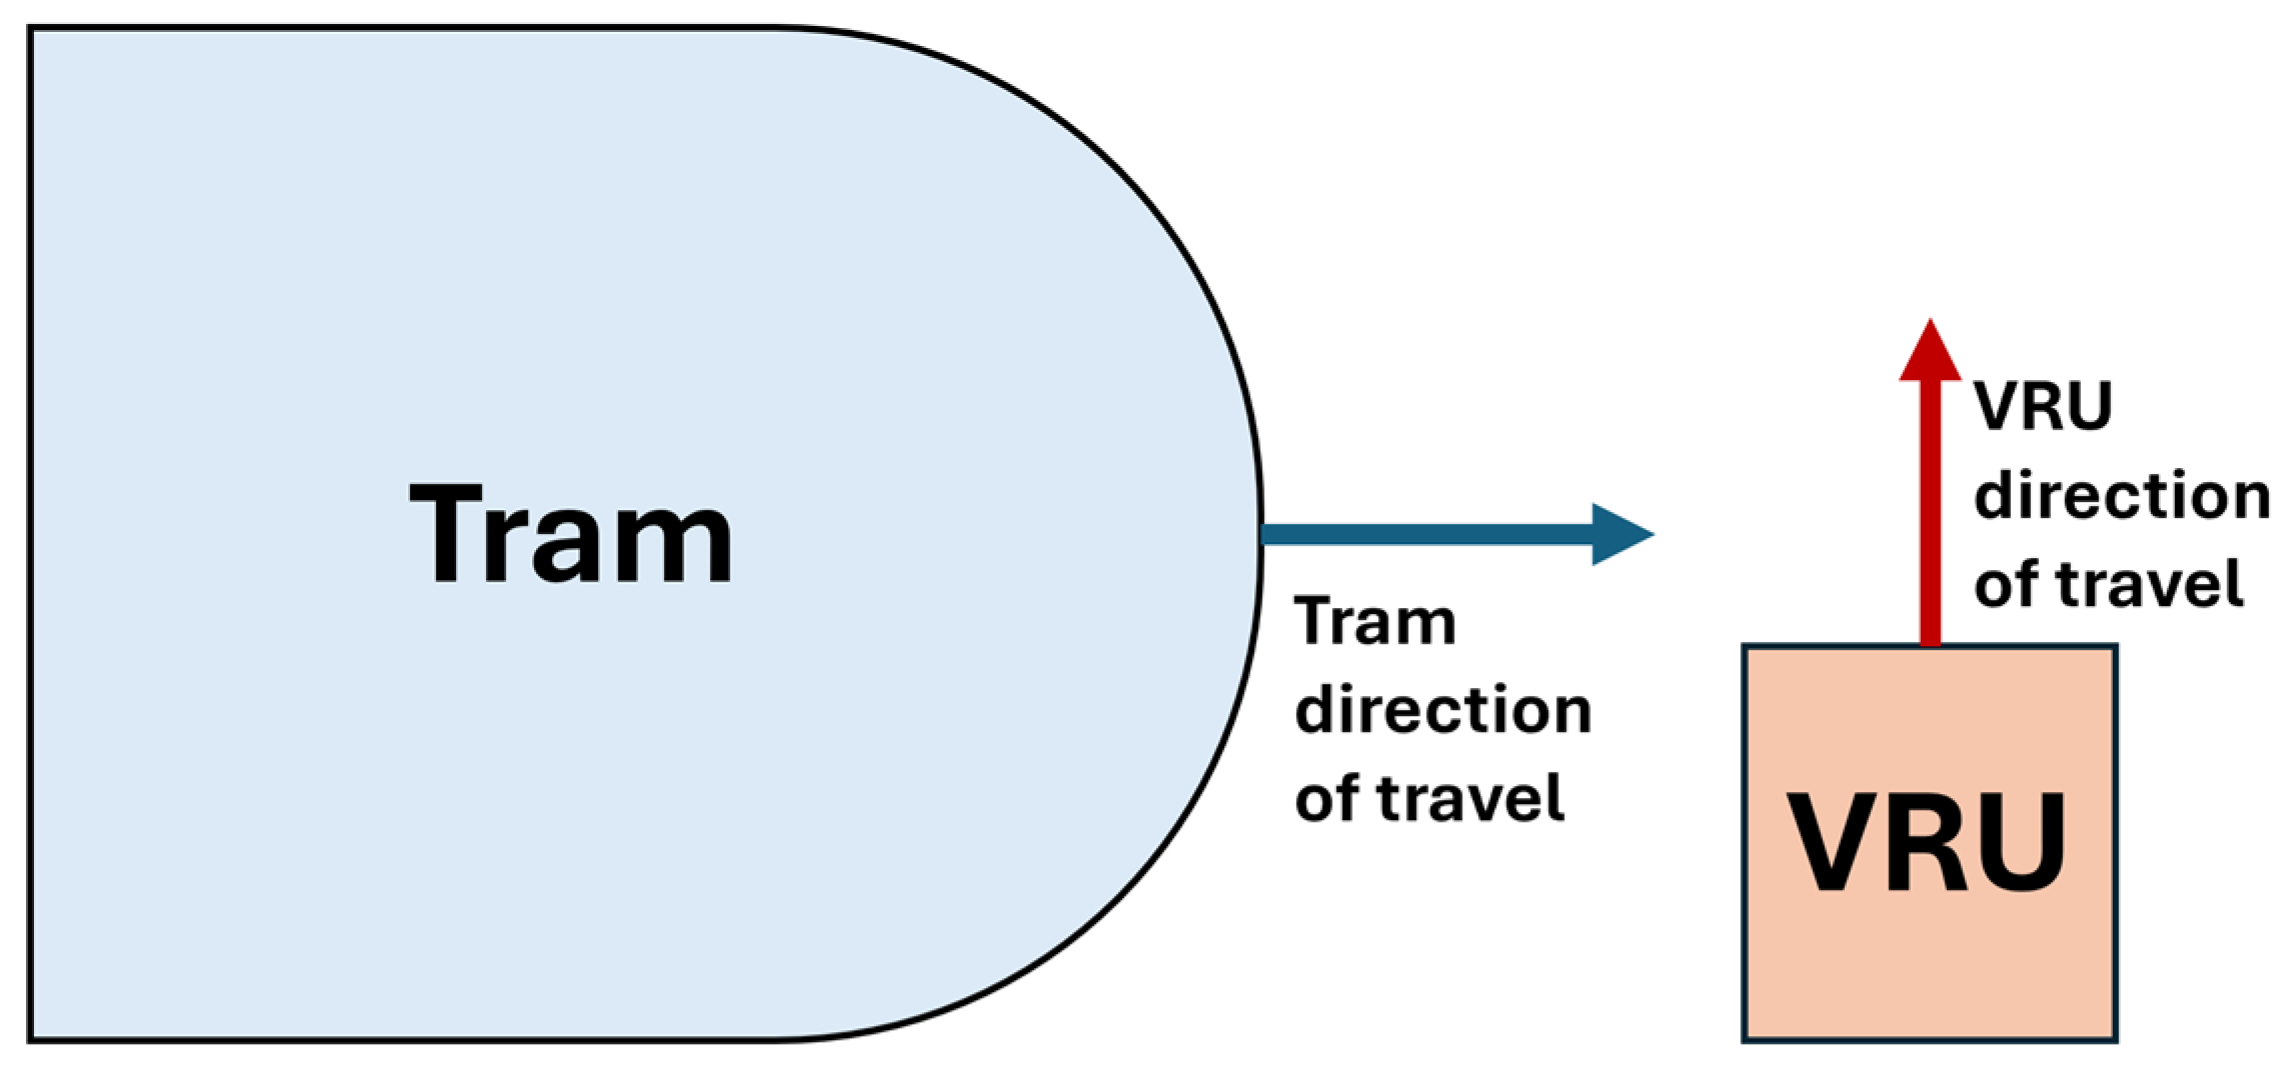
From this information, the design of clear, segregated cycling (including e-scooter) infrastructures could encourage safe VRU uptake. From the perspective of designing tram–VRU passive safety studies, e-scooter user preferences for segregated infrastructures imply that a typical e-scooter rider would be crossing the grooved rails in interactions with trams and tramway infrastructures, as opposed to riding in parallel with the direction of travel of trams. Therefore, road vehicle interactions with e-scooters should be considered with the e-scooter rider travelling perpendicular to the road vehicle, including for studies of trams. This point is illustrated in the diagram presented in
Figure 3.
The scope of this report does not extend to the design of the road or tram infrastructures. For the purpose of this report, the key findings are that, both from the perspective of micromobility users themselves and from urban planning guidance, micromobility users are perceived to be safer on infrastructures segregating them from road vehicles or trams. This analysis has led to the recommendation that, for micromobility users in tram–VRU collisions, it should be assumed that most interactions with trams will occur at intersections or crossings. In tram-micromobility collisions being modelled as part of crash-compatibility studies, the micromobility user should therefore be modelled as travelling perpendicular to the direction of tram travel.
5.3. Speed and Location of Tram–VRU Collisions
Two reports were found which provide insight into the impact speeds of tram–VRU collisions, and both reports focus on pedestrian safety only. From the data published in both papers, an argument can be presented that the 20 km/h impact speed, which is applied in experiment methodologies in both CEN/TR 17420 [
13] and STRMTG guidelines [
12], is unsuitable for capturing a majority of real-world scenarios. Research published by Gaca and Franek [
17] and Lackner et al. [
21] presents a convincing case for increasing the impact speed in crash-compatibility studies involving trams and VRUs to 30 km/h, to ensure that the majority of real-world scenarios for tram–VRU collisions are captured. Lackner et al. [
21] recommended that CEN/TR 17420 should be updated, adding crash tests at a 30 km/h impact speed to better reflect more serious collision scenarios.
Collisions frequently occur at interfaces between different road user types, as has been observed by many studies. There is variance regarding the locations reported for collisions between trams and pedestrians depending on the cities or countries captured by particular studies. Data from Krakow, Poland showed that approximately 80% of collisions involving trams and pedestrians occurred at public transport stops [
17], whilst for German tram networks, 13.1% of collisions occurred at tram stops, and a further 8.3% at pedestrian crossings [
21]. The variance in outcomes of relatively similar studies could derive from a variety of factors, including the design of tramways and highways in different towns and cities, the prominence of safety campaigns around safe tram interactions, and human factors such as perceived risk.
From this analysis, the recommendation is made that tram–VRU collisions should be modelled at a speed of 30 km/h in crash-compatibility guidelines. However, if it is assumed that trams would naturally be travelling at lower speeds around interfaces such as tram stops or pedestrian crossings, findings between studies focused on collision speed and collision location in real-world tram–pedestrian collisions conflict with each other. Tram–VRU collision studies which consider vehicle speed present a clear case that increasing impact speed in vehicle testing to 30 km/h would enable the majority of higher-severity injuries in collisions to be captured. However, studies focusing on location of tram–VRU collisions show that most collisions occur at interfaces where trams and VRUs interact, such as crossings or tram stops. Whilst it is recognised that increased impact speed in crash-compatibility guidance would increase the proportion of real-world collisions captured by the guidance, it is unclear whether the existing guidance captures the majority of real-world tram–VRU collisions or not based on vehicle impact speed.
5.4. Limitations of the Study
Due to Europe making up the majority of the global light-rail market [
79], there is a strong European bias in the analysis conducted in this report. There are differences in rolling stock design across Europe, with factors such as the age of the light-rail network affecting the nature of the rolling stock on particular networks. The performance of different generations of rolling stock in terms of crash-compatibility with pedestrians has been studied in previous works [
30,
31]. This paper does not account for the specific tram models in operation, nor the typical age of rolling stock in use, in places where tram–pedestrian collision data was studied, and this would influence the injury susceptibilities seen. For instance, data from tram networks with newer rolling stock, or rolling stock with less aggressive front-end geometry, may be less likely to inflict severe injuries in collisions with pedestrians. Furthermore, infrastructural design is known to have an influence on VRU safety around trams [
14], and may influence outcomes in different collision studies.
Whilst this work proposes that the head, thorax and lower extremities should be considered with appropriate injury criteria in tram–VRU collisions, this report does not explicitly propose which injury criteria are recommended for such studies. It is recognised that decision-making on which injury criteria to apply, and how such decisions are made, is complex and requires further investigation before a definitive recommendation is made on specific injury criteria. Given that injury criteria in collision scenarios have typically been derived from the perspective of analysing occupant safety in automotive collisions, there is the potential that many of the state-of-the-art injury criteria may not be suitable for pedestrian safety studies. Therefore, FEA studies of tram–VRU collisions may be necessary to validate the selection of specific injury criteria. The authors of this report propose that validation work for injury criteria used in tram–VRU collision studies should be performed, and at the time of writing, are actively looking at addressing this concern.
When discussing the nature and severity of injuries sustained in tram–pedestrian or VRU road collisions, some of the reports discussed are based on hospital records for injury. This naturally induces biases towards more serious injuries which required hospital treatment, as more minor injuries would not lead to hospital visits. Given that the purpose of this report is to identify body regions susceptible to more serious injuries, the authors believe that the impact of this limitation on the findings of this report are minimal. Under-reporting of less serious collisions may similarly be observed from police data.
There are implications for tram front-end design of increasing collision speed to 30 km/h for tram–VRU collisions. Such an increase in experimental impact speed, if applied to formalised standards on vehicle crash-compatibility, would influence the structural stiffness expected of the front-end of a vehicle, and this may have implications for the stiffness of both the chassis and the external body of the vehicle. Optimising of stiffness of vehicle front-ends for crash-compatibility, both to VRUs and larger road and rail vehicles, is critical to ensuring that crash-compatibility measures do not inadvertently make light-rail vehicles less safe for other road users.
Whilst this report recommends that tram–VRU collisions should be modelled with VRUs travelling perpendicular to the direction of travel of a tram, it is recognised that the injury risks in tram–VRU collisions where the VRU is travelling parallel, or diagonally in a direction relative to the tram, are significant. The purpose of this report is to identify the most likely and feasible scenarios for tram–VRU collisions, and it was determined that tram–VRU interactions are most likely to occur when the VRU crosses the path of the tram. It is worth noting that, depending on space availability and the layout of urban environments, cycle lanes may be provided on locations with close proximity to tram networks.
In this report, findings from heterogeneous datasets have been analysed to identify weaknesses within existing guidelines and make recommendations for future guidance or standards. The ways in which data was collected for different sources, which have been considered as part of the same topic, may therefore vary. For the identification of body regions susceptible to injury, an attempt was made to prioritise data where AIS was used to define injury severity to enable a consistent benchmark to be used, though different works use different definitions of body regions (e.g., amalgamating head, face and neck into a single body region, or considering the pelvis as part of lower extremities or abdomen). Without being able to access the raw data from which the initial reports were written, it was not possible to homogenise these works into a single dataset. Each report on injury patterns in tram–pedestrian collisions may also reflect unique characteristics of vehicle design or infrastructure layouts on the tramways for which injury data was collected, which this report is unable to account for.
The heterogeneous nature of the data collected may also influence investigations into speed and location of collisions as well as with studies used to understand VRU preferences around road and tram infrastructures. For all studies considered in this report, location has an influence on the data obtained. The extent to which tram infrastructures were segregated from VRUs cannot be identified for each individual collision identified in the literature, nor whether tram speeds and speed limits in zones where collisions occurred were appropriate for the degree of risk to VRUs. Different methods were used in different works studied to identify impact speeds, with vehicle kinematic data often unavailable for capturing tram speed at impacts for such studies. For VRU preference studies, survey-based studies may ask different questions, and both survey and field-based studies are often conducted in the context of specific street layouts. Synthesis of the findings of the different studies reported on in this report, however, does generally show similar findings, and the findings of this report reflect that.
Due to the heterogeneous nature of the data analysed in this study, it was not feasible for a meta-analysis to be performed on this topic. As has been documented in this paper, data on tram–pedestrian collisions is limited, and of the studies which have been performed, methodologies around data collection differ. In the case of VRU injury patterns, the way in which injury severity and the body regions for injuries are categorised may differ. For speed and location data for collisions, different methods are used to identify impact speed in vehicle collisions between studies, and the nature of how collision data is collected affects the results captured when location data is analysed.
5.5. Recommendations and Future Work
Three recommendations are made in this study which relate to future crash-compatibility studies or guidance concerning trams and VRUs. Firstly, when modelling for injury risks to VRUs, focusing on head injuries is insufficient to capture a majority of serious injuries, and thoracic and lower extremity injury risks should be considered through the use of appropriate injury criteria. Secondly, for micromobility users in tram collisions, it should be assumed that micromobility users are travelling perpendicular to the direction of tram travel, or otherwise using pedestrian or cyclist infrastructures, such as crossings, at interfaces between tram and road or cyclist infrastructures. The third recommendation is that, in order to capture a higher proportion of serious injuries in tram–VRU collisions, an impact speed of 30 km/h should be considered.
This study has identified three body regions for which appropriate injury criteria should be identified for future tram-to-VRU crash-compatibility studies: the head, thorax and lower extremities. From this, the next step is to evaluate the injury criteria which can evaluate these three body regions and determine the most appropriate criteria for each body region. This could be achieved by considering real-world injury mechanisms affecting specific body regions and evaluating the applicability of particular injury criteria.
Evaluation of the location and speeds of reported tram–pedestrian collisions has validated existing arguments made by Lackner et al. [
21] about conducting future passive safety studies at a 30 km/h collision speed, either in conjunction with or replacing existing methodologies which use a 20 km/h initial impact speed. Therefore, in future studies conducted by FEA or real-world testing, the authors recommend that an increased collision speed of 30 km/h is applied, to better reflect a wider range of real-world scenarios.
This study highlighted that VRUs are likely to be travelling perpendicular to the direction of travel of trams in tram-to-VRU collisions. Tramway design guidance encourages perpendicular crossings for tram–cyclist interfaces, whilst e-scooter users expressed preferences towards being segregated from heavy vehicles. From this information, future tram–VRU crash-compatibility studies should consider VRUs as travelling perpendicular to trams, as this reflects likely collision scenarios between trams and VRUs.
Whilst this paper has focused on three concerns related to capturing real-world tram–VRU collision scenarios, including increasing the scope of VRUs considered, concerns around the secondary impact phase, where a VRU falls onto the external environment following collision with a vehicle, has not been addressed in this paper. Assessment of injury risks of both primary and secondary collision phases should be conducted, ideally using FEA modelling. From this, the risks of injury in each collision phase should be evaluated, with further investigations to determine how to reduce risks of injury in the secondary collision phase.
Finally, it is crucial that future tram–VRU research takes a standardised approach. As has been highlighted when discussing the limitations of this study, heterogeneous datasets have been amalgamated in order to identify the gaps in the existing tram–VRU guidance and make recommendations on how to address these gaps. For injury data, different means of categorising injury severity have been implemented in different locations, whilst different datasets analysing tram–VRU collisions apply different methodologies, reducing confidence in the data obtained. A standardised approach could be implemented through a codified vehicle standard, potentially based on existing guidance such as CEN/TR 17420. Such considerations in future research would enable recommendations made by the RAIB in 2012 [
7], stating that research must be performed to improve the understanding of tram–pedestrian collisions and safety measures, to be implemented in an effective manner.
6. Conclusions
Modal shift in urban transportation, towards greater uptake of light-rail, active travel and micromobility modes, is forecast for the foreseeable future. This has the implication that VRU safety around trams is becoming increasingly important to consider. Current guidance on the passive safety of trams (CEN/TR 17420) fails to account for micromobility users such as cyclists and e-scooter users. This paper seeks to address gaps around tram–VRU interactions, capturing real-world experiences of a wider range of VRUs than are currently accounted for by crash-compatibility studies. This is achieved by analysis focused on three areas which require attention to ensure future crash-compatibility guidance is suitable for a wider scope of VRUs. The following recommendations for tram–VRU passive safety experimental frameworks are made:
On injury criteria assessed: head injuries should continue to be assessed, as they are amongst the leading causes of injury both for more minor (AIS 1–2) and severe (AIS 3+) injuries observed for VRUs. Lower extremity injuries are also prominent for injuries of various severity levels. When considering more serious (AIS 3+) casualties, thoracic injuries should be accounted for with an appropriate injury criterion. These findings are consistent both for tram–pedestrian collision scenarios and for VRU injuries in general. It is proposed that work should commence to determine the appropriate injury criteria for thoracic and lower extremity assessments, which can be applied to future simulations of tram–VRU collisions.
On VRU orientation: for future passive safety studies, cyclists and e-scooter users should be considered travelling perpendicular to the direction of trams. E-scooter users are shown to feel safest when segregated from road vehicles, and this is supported by reports into the design of safe cyclist–tramway interfaces recommending the perpendicularity of crossings and segregated cycling infrastructures away from tramways.
On impact speeds: future tram–VRU accidentology studies should be conducted at impact speeds of 30 km/h, aligning with the findings of previous research on collision speed. Previous studies analysing real-world collision scenarios have shown median impact speeds of between 20 km/h and 30 km/h, and therefore increasing impact speeds in experimental methods to 30 km/h would better capture interactions between trams and VRUs.
With application of the recommendations made in this study, there is an expectation that future tram–VRU crash-compatibility studies will better represent real-world tram–VRU interactions in Europe. The recommendations made by this study should ensure that a higher proportion of real-world injuries in tram–VRU collisions are captured, by considering a wider scope of body regions susceptible to head injury. Increased impact speed in guidelines would ensure that a higher proportion of high-severity injuries are captured. An additional focus on micromobility users would enable differences between different modes of VRU transport in terms of injury risk to be better understood, demonstrating a proactive approach to the influences of urban transportation modal shift on transportation safety.