Systematic Review

Evaluation Approaches and Indicator Architectures for Smart Urban Mobility in Smart City Contexts: A Review


by
Jorge Becerra-Moreno
1,
Antonio Hurtado-Beltran
1,*,
Francisco J. Domínguez-Mota
2 and
Agustín Guerra
3
1
School of Civil Engineering, Universidad Michoacana de San Nicolás de Hidalgo, Morelia 58030, Mexico
2
School of Physical and Mathematical Sciences, Universidad Michoacana de San Nicolás de Hidalgo, Morelia 58030, Mexico
3
Instituto Nacional de Investigaciones Científicas Avanzadas en Tecnologías de Información y Comunicación (INDICATIC AIP), Panama City 0801, Panama
*
Author to whom correspondence should be addressed.
Future Transp. 2026, 6(3), 113; https://doi.org/10.3390/futuretransp6030113
Submission received: 24 April 2026 / Revised: 17 May 2026 / Accepted: 22 May 2026 / Published: 26 May 2026

Abstract

Rapid urbanization has intensified congestion, environmental pressures, and transport inequities, thereby increasing interest in Smart Urban Mobility (SUM) as an approach that combines digital technologies, sustainable transport strategies, and data-informed decision-making to respond to these challenges. However, the evaluation of SUM remains fragmented due to the absence of harmonized assessment frameworks and the diversity of methodologies applied across smart city contexts. This study presents a systematic literature review of evaluation approaches and indicator architectures for SUM in smart city contexts. Using a PRISMA-guided screening process, 33 eligible studies were selected from 412 retrieved records. Three main methodological groups were identified: quantitative approaches, multi-criteria decision-making methods, and qualitative or participatory frameworks. A total of 273 indicators were organized into eight factor categories, confirming the multidimensional nature of smart mobility assessment while also revealing limited consistency in indicator selection and application across studies. Across the selected studies, current evaluation practices are increasingly linked to project prioritization, planning, and decision support; however, their effectiveness remains constrained by data inconsistencies, governance fragmentation, and insufficient user inclusion. These findings highlight the need for assessment frameworks that are sufficiently comparable to enable cross-city learning, yet flexible enough to reflect local contexts and institutional realities.

1. Introduction

Rapid urbanization has intensified congestion, environmental pressures, and unequal access to transport services, challenging cities to improve mobility while advancing efficiency, sustainability, and social inclusion [1]. In this context, Smart Urban Mobility (SUM) has emerged as an integrative approach that combines digital technologies, multimodal transport systems, and data-informed decision-making to improve urban mobility performance [2]. Rather than focusing only on infrastructure supply, this approach expands mobility assessment toward sustainability, digital integration, service quality, and user-oriented outcomes [3,4].
Despite the growing implementation of smart mobility initiatives, their evaluation remains fragmented and difficult to compare across urban contexts [5,6,7]. This fragmentation is reflected in the following recurring problems: heterogeneous indicator selection, uneven data availability, and limited integration of governance and user perspectives. Although standardized tools such as the Sustainable Urban Mobility Indicators (SUMI) provide useful references, they may not fully capture regional, socioeconomic, and institutional differences across cities [8,9,10].
Data availability is one major source of this difficulty. Some cities now rely on big data, IoT-enabled monitoring, digital twins, mobile phone records, smart cards, and GPS traces, whereas others continue to depend on fragmented or outdated datasets [11,12,13]. These differences limit the comparability and robustness of evaluation results. Methodological diversity adds another layer of complexity. Multi-Criteria Decision-Making (MCDM) methods such as Analytic Hierarchy Process (AHP), Technique for Order of Preference by Similarity to Ideal Solution (TOPSIS), and VIšekriterijumska optimizacija i kompromisno rešenje (VIKOR) are widely used, but their outcomes remain sensitive to expert judgment, weighting assumptions, and contextual priorities [8,14,15,16].
Governance and institutional barriers continue to hinder coherent assessment practices. Effective evaluations require coordination among government agencies, private sector stakeholders, and research institutions [10,17]. However, fragmented policy frameworks, weak interdepartmental coordination, and selective reporting can produce inconsistent assessment practices [6,18,19]. These limitations are reinforced by context-specific differences in population density, infrastructure quality, socioeconomic conditions, and institutional capacity. Consequently, while high-income cities often emphasize electric vehicles, shared mobility, and data-driven services, lower-income cities may prioritize basic infrastructure, informal transit regulation, and accessibility improvements [20,21]. This contrast highlights the need for adaptable evaluation frameworks that remain comparable across cities while responding to local institutional and socioeconomic conditions [12,22].
Finally, many evaluation frameworks remain centered on technical and economic dimensions, with limited incorporation of user experience, public perception, and the needs of marginalized groups [9,23]. Recent citizen-centered and behavior-aware approaches address this gap by incorporating perception-based evidence, participatory assessment, and user experience into mobility evaluation [6,21,24,25]. This is relevant because digital services, travel behavior, and social perceptions can strongly influence the acceptance and effectiveness of smart mobility interventions [26,27].
Given these limitations, a systematic literature review of SUM assessment in smart city contexts is needed to clarify how it has evolved, which methodological approaches dominate the literature, what indicator architectures are most frequently applied, and to what extent current studies support planning and decision-making processes. Accordingly, the main objective of this paper is to systematically review existing evaluation approaches to SUM in smart city contexts. This aims to compare methodological frameworks, identify the most frequently used indicator architectures, and examine their relevance for planning and decision support [9,16]. To achieve these objectives, the study addresses the following research questions:
(1) What evaluation frameworks and methodological approaches are used in the assessment of smart urban mobility in smart city contexts? (2) Which indicator architectures are most frequently employed in this literature, and how consistently are they applied across studies? (3) To what extent do existing studies support urban planning and policy processes, and what methodological or contextual gaps limit their practical application?
This review contributes to the literature in three ways. First, it synthesizes the main methodological approaches used to assess SUM in smart city contexts. Second, it organizes the indicator landscape into comparable indicator architectures and analytical dimensions, highlighting both recurring patterns and persistent inconsistencies. Third, it identifies the methodological and contextual gaps that limit the transferability and policy relevance of existing evaluation frameworks. Across the reviewed literature, however, cities operate under heterogeneous data, governance, and technology conditions; thus, while multiple assessment tools exist, comparability remains limited. Rather than proposing a single universal model, this review emphasizes the need for adaptable yet comparable evaluation frameworks that combine a core set of shared indicators with context-sensitive criteria.
Unlike broader reviews that encompass all aspects of intelligent transport systems (ITS) or general traffic engineering, this study specifically isolates the intersection between urban mobility evaluation and overarching smart city frameworks. By focusing on this niche, the review aims to understand how mobility projects are assessed and prioritized when embedded into holistic smart city planning.
The remainder of this paper is structured as follows. Section 2 reviews the historical evolution and foundational concepts of SUM. Section 3 details the systematic review methodology, including search strategies, inclusion criteria, and the descriptive characterization of the retrieved literature. Section 4 examines the principal indicator architectures identified across the reviewed studies. Section 5 compares the main methodological approaches employed in SUM assessment. Section 6 examines project prioritization as a decision-support function in SUM evaluation. Section 7 discusses the main trends, challenges, and future directions identified in the reviewed literature. Finally, Section 8 presents the conclusions and implications for future research and practice.

2. Background and Evolution of Smart Urban Mobility

2.1. Historical Evolution

The concept of SUM has evolved in response to changing urban transport challenges and technological advances. In the 1990s, efforts focused primarily on improving operational efficiency and road safety through Intelligent Transportation Systems (ITS), which enabled real-time traffic monitoring, congestion mitigation, and traffic flow management [28,29]. However, early developments were largely infrastructure-centric, with limited emphasis on sustainability or social inclusivity [13,14]. These early approaches remained largely centered on transport operations rather than broader mobility outcomes [3].
By the early 2000s, mobility debates increasingly incorporated sustainability concerns, influenced by global environmental agendas and policy frameworks [19]. During this period, policies began promoting non-motorized transport, public transit investments, and vehicle electrification to reduce greenhouse gas emissions [1,20]. The growing recognition of social equity in mobility planning also led to the incorporation of accessibility considerations, particularly for vulnerable populations [23,30,31].
From the 2010s onward, technological innovation has played an increasingly central role in redefining smart mobility. The proliferation of Information and Communication Technologies (ICTs) and the rise of big data analytics facilitated the integration of digital tools such as real-time navigation systems, shared mobility platforms, and predictive traffic modeling [7,17]. A broader wave of innovations, including ITS, electrification, shared mobility, MaaS, predictive modeling, and digital twins, expanded both the operational scope of mobility systems and the dimensions considered relevant for assessment [4,11,16,32,33]. At the same time, multimodal integration and user-centered service design gained importance as cities sought to reduce congestion and improve accessibility and sustainability [14]. In sum, the evolution of SUM reflects a transition from infrastructure-focused transport management to a multidimensional paradigm that integrates technology, sustainability, and inclusivity. This shift is directly relevant to evaluation, as it helps explain why contemporary assessment frameworks rely on diverse indicators and methodological approaches [14,21,34].

2.2. Defining Smart Urban Mobility

SUM is a multidimensional concept that combines technological innovation, sustainable transport strategies, accessibility, and governance to improve urban mobility systems. As defined by Zapolskyte et al. [15] and Qonita et al. [9], the term encompasses the use of digital solutions, efficient transport planning, and user-oriented services aimed at reducing congestion, emissions, and travel inefficiencies. At its core, SUM seeks to align mobility demand with multimodal transport systems, real-time data, and urban policies.
Three broad components are central to this concept. ICT, through ITS, enables dynamic traffic control, predictive analytics, and enhanced connectivity among various transport modes [28]. Sustainable mobility emphasizes the transition toward low-carbon transport options, such as electric vehicles, shared mobility services, and active transportation infrastructure [20]. Additionally, governance frameworks play a critical role in implementing policies that ensure mobility systems remain equitable and accessible to all urban residents [6]. Equity must be treated explicitly, horizontally (treating equals equally) and vertically (supporting vulnerable groups), with clear indicators for each [35]. In practice, smart governance operationalizes these goals via ICT-enabled services and multi-actor collaboration [22].
A critical aspect of SUM is the integration of multimodal transport options to optimize urban travel. Multimodal systems incorporate public transport, non-motorized mobility (walking and cycling), and shared mobility solutions to create seamless, efficient transport networks [14,36]. This integration is reinforced by data-driven planning tools, including large-scale mobility datasets and digital twins, which support real-time analysis and predictive modeling [11,12].
In addition to technological advancements, social equity and inclusivity remain essential components of these systems. Accessible infrastructure, universal design principles, and policies that prioritize the needs of vulnerable populations, such as individuals with disabilities and low-income communities, contribute to the broader goal of equitable mobility [23]. However, digital divides and affordability concerns pose significant barriers to achieving truly inclusive urban transport solutions [2,31].
Taken together, these elements show that the concept is not limited to technological modernization. Rather, it represents a broader transformation in urban transport planning that integrates operational efficiency, environmental sustainability, accessibility, governance, and user-centered mobility. This multidimensional character helps explain why its evaluation requires diverse indicator sets and context-sensitive assessment frameworks [10].

2.3. Regional Perspectives

The development and implementation of SUM vary significantly across global regions, influenced by economic conditions, governance frameworks, and technological advancements. These differences are important not only for understanding mobility transitions, but also for explaining why evaluation frameworks are difficult to transfer directly from one context to another [10,12,21,22].
European studies commonly emphasize institutional support, Sustainable Urban Mobility Plans, multimodal integration, and sustainability-oriented policies [9,19,37,38]. In contrast, North American and Asian cases show more uneven trajectories, shaped by car dependency, fragmented governance, rapid urban growth, congestion, affordability constraints, and different levels of digitalization [1,10,11,21,28,30,36]. In Latin America and Africa, evaluation remains especially affected by informal transport systems, limited infrastructure, constrained public investment, fragmented governance, and weaker data availability [2,6,15,16,38]. These patterns confirm that regional context influences not only implementation capacity, but also the type of indicators, data sources, and evaluation methods that can realistically be applied.
In conclusion, regional differences show that SUM cannot be assessed through a purely uniform lens. Variations in data availability, institutional capacity, transport structure, and policy priorities influence both the selection of indicators and the feasibility of specific assessment approaches. For this reason, regional diversity reinforces the need for evaluation frameworks that are adaptable to local conditions while retaining a degree of comparability across contexts [10].

3. Literature Search

3.1. Search Strategy and Inclusion Criteria

A systematic literature search was conducted to identify studies addressing the evaluation and assessment of SUM. The process followed the PRISMA framework (Preferred Reporting Items for Systematic Reviews and Meta-Analyses) [39,40] and the established recommendations for literature reviews in transportation research [41], ensuring transparency and reproducibility in study identification and selection. Searches were carried out across five major databases: TRID, Scopus, ScienceDirect, Web of Science, and Google Scholar. The structured Boolean queries were adapted to each database but consistently combined the terms “evaluation,” “assessment,” or “examination” with “urban,” “suburban,” or “metropolitan,” and “smart mobility,” “urban mobility project,” or “sustainable urban mobility,” along with “smart city.” The general query formulation was: [(evaluation OR assessment OR examination) AND (urban OR suburban OR metropolitan) AND (smart mobility OR urban mobility project OR sustainable urban mobility) AND (smart city)]. This search string was applied in TRID, Scopus, Web of Science, and Google Scholar. In ScienceDirect, the search string was adapted due to the platform’s limitation on the number of Boolean connectors allowed in a single query, resulting in the following formulation: [(evaluation OR assessment OR examination) AND (urban OR suburban) AND (smart mobility OR urban mobility project OR sustainable urban mobility) AND (smart city)].
In Scopus and ScienceDirect, the query was refined using subject areas and document types, including articles, review papers, and book chapters, as well as language restrictions to English. Subject-area filters related to engineering, transportation, environmental sciences, technology, and transport-related sciences were applied, while areas not directly aligned with the scope of the review, such as health sciences, arts and humanities, psychology, economics, and other unrelated fields, were excluded. Since not all databases provide the same search fields, subject-area filters, or refinement options, these parameters were adapted according to the structure and technical capabilities of each platform.
In Web of Science, the search was primarily applied to abstracts (AB=) to improve topical specificity and reduce retrieval of marginally related studies. Since abstracts summarize the objectives, methods, and principal findings of publications, this strategy facilitated the identification of studies explicitly addressing smart urban mobility assessment while improving screening efficiency and consistency within the PRISMA process. In TRID and Google Scholar, the same set of terms was applied with broader search parameters to maximize coverage. As part of the database search strategy, filters related to language, document type, and subject area were applied where appropriate.
The screening process was conducted in two sequential stages: (1) title and abstract screening and (2) full-text eligibility assessment. Both stages were independently performed by two reviewers to ensure consistency in the application of inclusion criteria. Discrepancies were resolved through discussion, and a third reviewer was consulted when consensus was not achieved. This procedure reduced selection bias and enhanced the reliability of the review process.
The review considered studies published between 2014 and 2025 to capture recent developments in smart mobility evaluation. Following retrieval, records were screened sequentially through language filtering, document-type refinement, field-of-study assessment, duplicate removal across databases, title screening, abstract screening, and full-text eligibility review. Studies were retained only when they explicitly addressed smart mobility, sustainable urban mobility, or urban mobility projects within urban, suburban, or metropolitan contexts and provided evaluation methodologies, indicator-based frameworks, assessment approaches, or decision-support structures relevant to smart city mobility assessment. Studies unrelated to smart mobility evaluation, lacking methodological or empirical contributions, or not providing evaluative structures or indicators were excluded.
In addition, during data extraction, each selected study was coded according to its level of smart city embedding. This coding distinguished between studies explicitly framed within smart city or smart mobility strategies, studies that partially incorporated smart mobility, ICT, ITS, digital governance, or data-driven elements, and studies primarily focused on general urban mobility or sustainable transport evaluation.
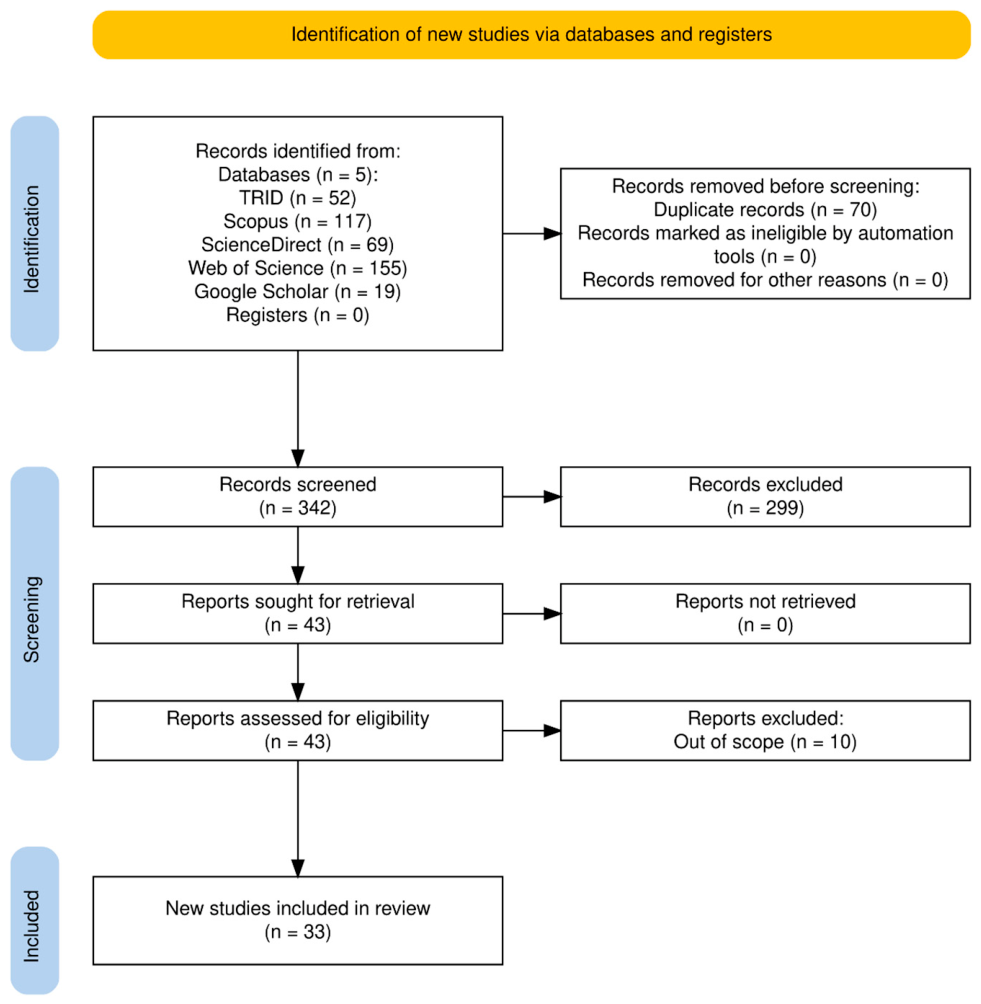
The search process identified 412 records across the five databases. After merging the results, 70 duplicate records were removed, leaving 342 records for title and abstract screening. During this stage, 299 records were excluded because they did not meet the inclusion criteria, resulting in 43 reports being sought for retrieval. All of these reports were successfully retrieved and assessed for eligibility in full text. During the full-text review, 10 studies were excluded because they were out of scope with respect to the objectives of the review. Consequently, a final sample of 33 studies was retained for content analysis. This dataset represents a focused body of literature that explicitly incorporates evaluative methods, indicator-based structures, or decision-support frameworks within the context of SUM. Therefore, the sample should be interpreted as analytically targeted rather than exhaustive of the broader smart mobility literature. The study selection process is summarized in Figure 1, following the PRISMA flow diagram format.

3.2. Descriptive Mapping of the Retrieved Literature

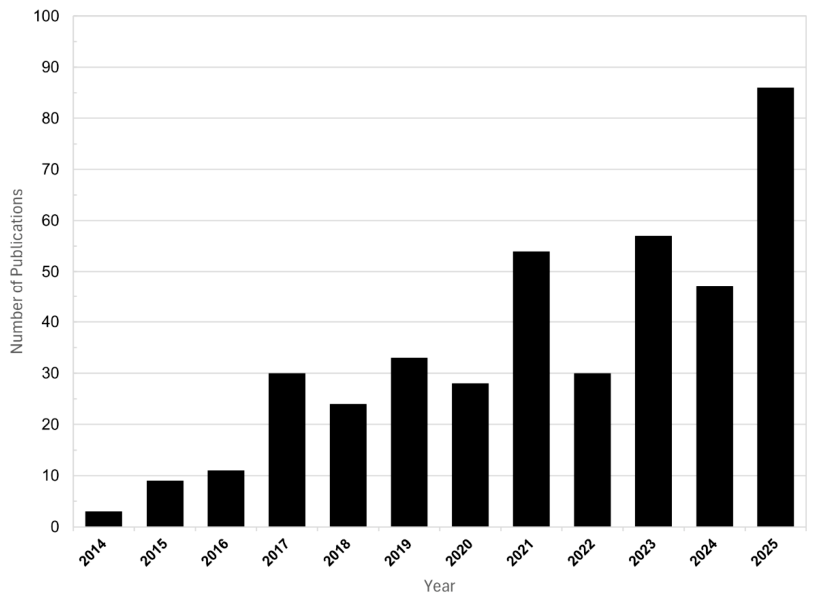
As a complementary step, a descriptive mapping of the retrieved literature was conducted to characterize the broader research landscape surrounding SUM assessment. This mapping examined publication trends, geographical distribution, and keyword patterns in the retrieved corpus, preserving closely related keyword variants where relevant in order to reflect the terminological diversity of the field, while removing terms clearly unrelated to the thematic scope of SUM assessment. The temporal distribution of records reveals a marked increase in research activity after 2016, with especially strong growth in the most recent years. As shown in Figure 2, the annual trend of records identified through the systematic literature search reflects growing academic interest aligned with global policy shifts toward sustainable and data-informed urban transportation.
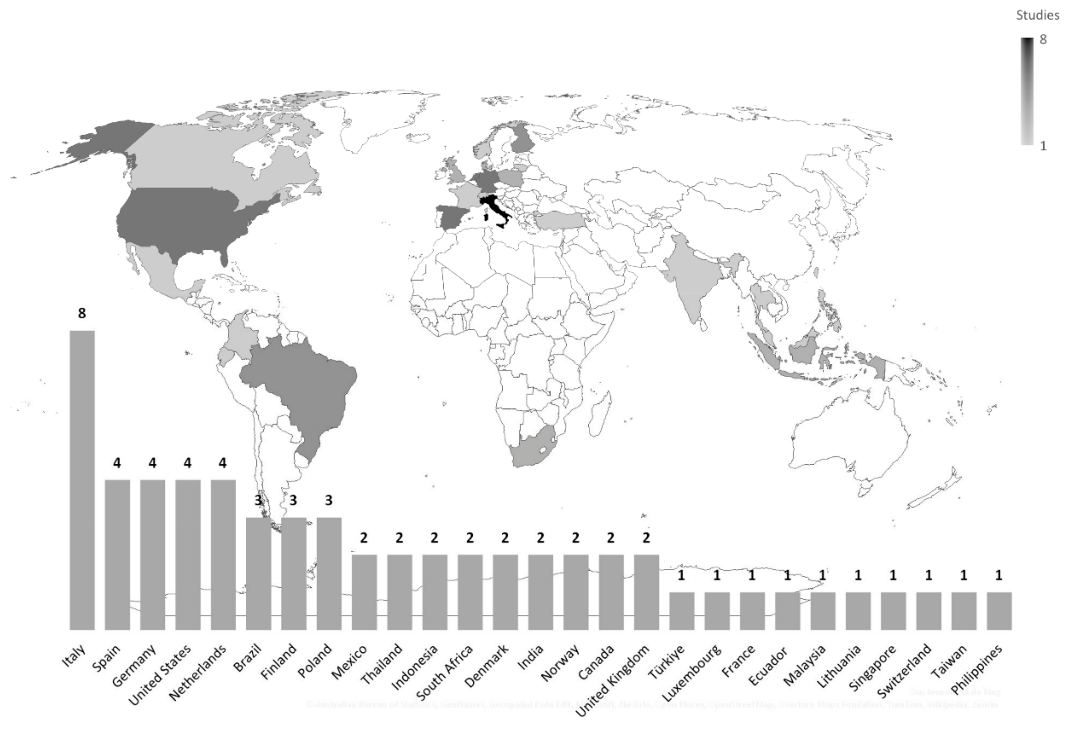
Figure 3 shows the geographical distribution of the case-study contexts represented in the included studies and reveals a strong concentration of research in Europe. Since some publications examine more than one country, country frequencies are not equivalent to the number of included studies and may exceed the final sample size (n = 33). Contributions from Latin America, Africa, and parts of Asia remain comparatively limited, highlighting the need for more research in developing and institutionally constrained contexts.
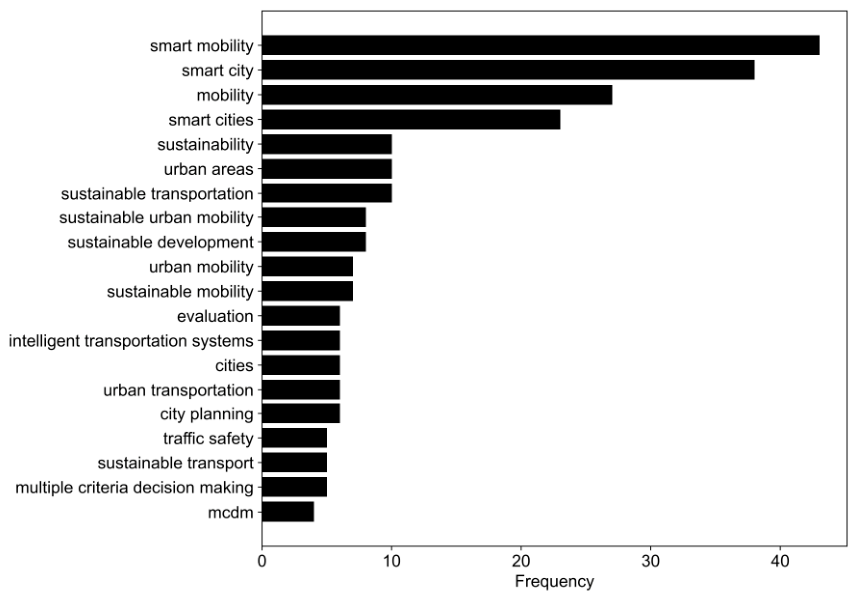
In thematic terms, Figure 4 displays the most frequent keywords as observed in the retrieved literature corpus. Terms such as smart mobility, smart city, mobility, and sustainability dominate the landscape, while closely related variants reflect the terminological diversity of the field and the lack of full conceptual harmonization across studies.
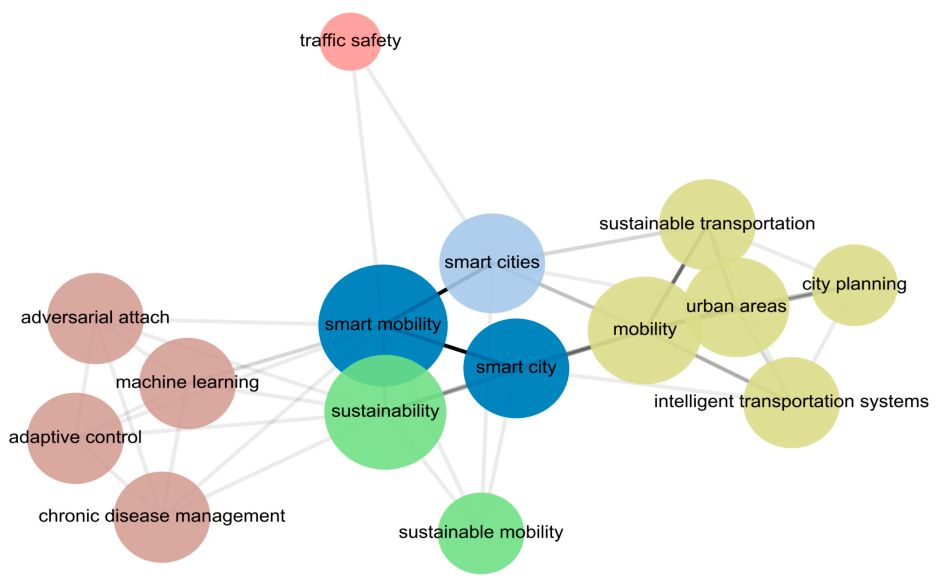
Keyword co-occurrence analysis (Figure 5) provides an exploratory view of the thematic structure of the retrieved literature corpus. The resulting network suggests several prominent thematic groupings, including a cluster centered on smart city infrastructure and governance, another related to sustainability-oriented transport systems, and a smaller cluster associated with digital and algorithmic tools. In addition, terms linked to mobility, urban areas, city planning, and intelligent transportation systems form a planning-oriented subcluster, while traffic safety appears more peripheral, suggesting a more specialized position within the literature. Smart mobility appears as the most central and connected term, reflecting its interdisciplinary relevance. Taken together, the map highlights the thematic breadth and terminological diversity of the retrieved corpus, supporting the broader conclusion that SUM research remains heterogeneous in both focus and methodological orientation.
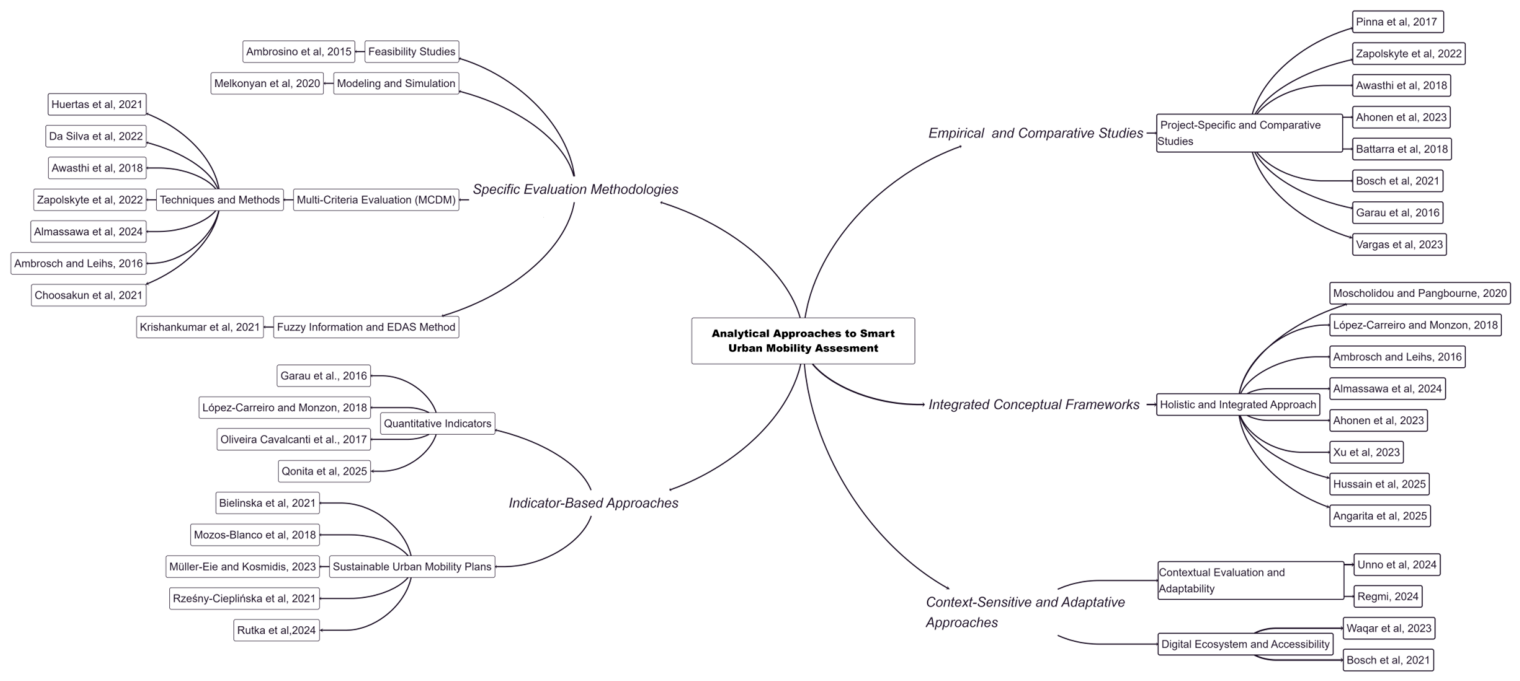
Figure 6 provides a typological classification of the included studies based on the main analytical approaches identified in the review. The figure synthesizes the diversity of perspectives represented in the corpus, including indicator-based approaches, specific evaluation methodologies, integrated conceptual frameworks, empirical and comparative studies, and context-sensitive approaches. This typological overview serves as a bridge to the following sections, which examine in greater detail the principal indicator dimensions and methodological strategies used in SUM assessment.
Taken together, these descriptive patterns provide contextual support for the subsequent analysis, which examines in greater depth the indicator architectures, methodological approaches, and transferability challenges identified across the selected studies. Although research on SUM has expanded rapidly, the retrieved literature remains geographically uneven, terminologically diverse, and methodologically fragmented. As a result, existing assessment approaches differ substantially in scope, data requirements, and transferability across contexts.

4. Key Indicator Architectures for Smart Urban Mobility Evaluation

Table 1 provides a comparative summary of the number and types of factors and indicators used across the 33 selected studies in this review. To identify the “most frequently addressed” dimensions, indicators reported in each paper were manually extracted, mapped to eight factor groups Information and Communication Technologies (ICT), Environmental Sustainability (ENV), Accessibility (ACC), Economic Aspects (ECO), Social Aspects (SOC), Technical and Technological Aspects (TEC), Governance and Policy (GOV), and Public Transport (PT), and counted at the dimension level for each study; therefore, table cells may contain values greater than 1 when a study reports multiple indicators within the same dimension. Frequencies reported in the text refer to coverage across studies (i.e., the share of papers with ≥1 operational indicator in the dimension). The most frequently addressed dimensions are (ENV), (ACC), and (GOV), followed by (ECO) and (SOC) considerations. In particular, studies such as Krishankumar et al. [1], Regmi [10], and Almassawa et al. [42] incorporate a broad range of factor groups, reflecting a multidimensional evaluation approach. Conversely, earlier studies like Ambrosino et al. [28] and Mozos-Blanco et al. [19] focus on a narrower set of dimensions, often limited to technical or governance aspects. The total number of indicators also varies substantially, from as few as 3 to more than 96, highlighting the methodological diversity across the field.
Overall, this heterogeneity underscores the lack of a standardized framework for smart mobility evaluation and reveals how study scope, context, and objectives shape the selection of evaluation criteria across the literature. Beyond the volume of indicators identified, two analytical issues recur across the reviewed studies. First, indicators related to technology, infrastructure, and public transport tend to be more operationally specific and measurable than those associated with governance, equity, or social inclusion. Second, several dimensions overlap conceptually across studies, particularly where accessibility, sustainability, and governance are operationalized through mixed proxy variables, which weakens comparability and complicates cross-context application. The following discussion should therefore be read not only as a categorization of indicators, but also as evidence of uneven operational clarity across the literature.

4.1. Commonly Used Indicators in the Literature

Table 2 presents a comprehensive corpus-level categorization of 273 distinct indicators identified in the reviewed studies, organized into eight key factor groups: Information and Communication Technologies (ICT), Environmental (ENV), Accessibility (ACC), Economic (ECO), Social (SOC), Technical (TEC), Government (GOV), and Public Transport (PT). Unlike the by-author summary in the previous subsection, which reports coverage by dimension, Table 2 lists each indicator only once under its canonical label, after merging duplicates and near-synonyms across studies; counts therefore reflect the breadth of distinct indicator types within each dimension rather than per-study coverage.
The table highlights the multidimensional nature of SUM evaluation, with each factor group encompassing a wide variety of specific indicators. Rather than functioning only as an inventory of isolated indicators, this categorization can be interpreted as a three-level conceptual architecture. The first level refers to technological and operational capacity, mainly represented by ICT, TEC, and PT indicators related to digital systems, infrastructure, traffic management, and public transport performance. The second level captures urban performance and sustainability outcomes, including ENV, ACC, and ECO indicators associated with environmental quality, accessibility, affordability, investment efficiency, and service coverage. The third level reflects institutional and social conditions, represented by GOV and SOC indicators linked to policy coordination, stakeholder involvement, equity, safety, and user acceptance. Thus, this detailed mapping highlights the richness and diversity of current evaluation approaches and underscores the need for integrated, multi-criteria frameworks capable of capturing the complexity of urban mobility systems.
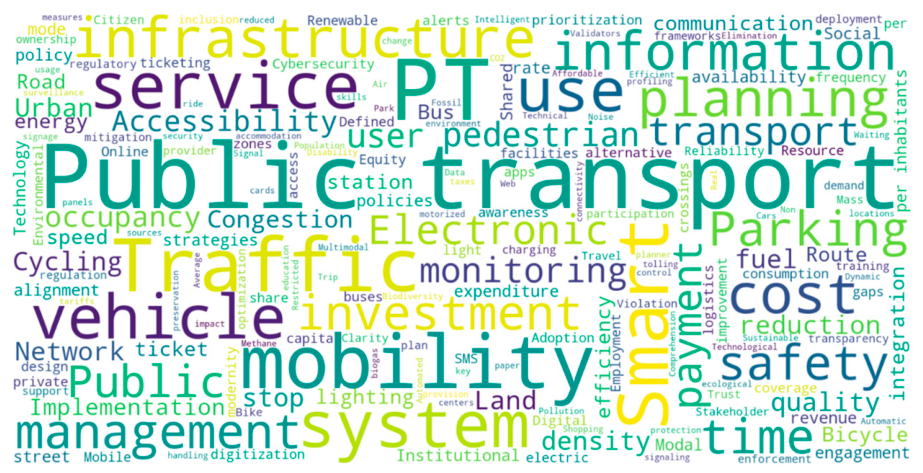
Figure 7 presents a semantic word cloud generated from the normalized indicator labels listed in Table 2. The visualization provides a lexical overview of the most recurrent terms across the indicator set, with concepts such as “public transport,” “infrastructure,” “management,” “planning,” “vehicle,” “traffic,” “investment,” “system,” “service,” and “safety” appearing prominently. Terms related to “information,” “electronic,” “monitoring,” “accessibility,” “cost,” “smart,” and “mobility” also occupy central positions, highlighting the strong emphasis on digitalization, inclusivity, and efficiency. Environmental and governance-related words such as “energy,” “biodiversity,” “renewable,” “policy,” and “engagement” appear less frequently but remain visible, suggesting growing attention to sustainability and participatory governance. The word cloud complements Table 2 by illustrating the thematic breadth of the indicator landscape, although the table itself remains the primary source for the analytical categorization of indicators. In the following subsections, each of the eight factor groups and their associated indicators is discussed in greater detail.

4.1.1. Information and Communication Technologies (ICT)

Information and Communication Technologies (ICT) provide the digital foundation of SUM, enabling real-time monitoring, predictive analytics, and integrated decision-making [14,28]. Intelligent Transportation Systems (ITS), IoT devices, and digital twins enhance traffic efficiency and multimodal coordination [11,29,43]. ITS applications include adaptive signaling and vehicle-to-infrastructure (V2I) communication, while IoT sensors collect data on flow, emissions, and road conditions [30]. Digital twins replicate transport networks for scenario testing and system optimization but face challenges of interoperability, cost, and data security [11,17,23]. Across the reviewed studies, ICT-related indicators are commonly operationalized through measures associated with digital infrastructure, real-time information systems, monitoring capacity, payment technologies, and traffic management applications. These indicators typically capture the extent to which mobility systems incorporate data-driven, connected, and responsive technologies. As cities expand data-driven mobility, ethical and governance frameworks ensuring transparency and privacy become increasingly vital [10].

4.1.2. Environmental (ENV)

Environmental indicators assess the sustainability of transport systems through emission reduction, energy efficiency, and air-quality improvement [19,20]. Low-emission zones, electrification, and renewable fuels are key strategies to reduce CO2 and GHG emissions [10,14,17]. Energy performance is commonly evaluated via fuel use per kilometer and renewable energy share [1,2,7]. Cities applying congestion pricing and promoting active mobility report measurable livability gains [13,43,44]. However, limited resources in developing contexts constrain implementation. Strengthening environmental data and renewable integration remains essential for resilient urban transport [10].

4.1.3. Accessibility (ACC)

Accessibility ensures that citizens can reach essential destinations safely, efficiently, and affordably [21,23,30]. Indicators include network coverage, multimodal connectivity, affordability, and walkability [1,15]. Universal design and inclusive infrastructure improve access for older adults, women, and people with disabilities [6,17]. Affordability measures, such as fare subsidies and integrated ticketing, support equitable access, particularly in low-income areas [6,10]. Nonetheless, data limitations and unregulated paratransit systems hinder accurate evaluation in developing regions [16,21].

4.1.4. Economic (ECO)

Economic evaluation focuses on investment efficiency, resource allocation, and cost–benefit outcomes of mobility systems [1,8,10]. Key metrics include public expenditure on sustainable transport, operational costs, and productivity gains [20,30]. Strategies like smart ticketing, congestion pricing, and demand-responsive transit enhance cost-effectiveness [6]. Public–private partnerships (PPPs) and multi-criteria decision methods (AHP, TOPSIS) aid project prioritization under budget constraints [8,10,45]. Balancing fiscal performance with social and environmental benefits ensures long-term economic sustainability.

4.1.5. Social (SOC)

The social dimension emphasizes inclusivity, equity, and safety as core outcomes of smart mobility [6,30]. Indicators assess accessibility for women, older adults, low-income groups, and persons with disabilities [17,23,31]. Gender-sensitive interventions, improved lighting, surveillance, and safe transit design, enhance user confidence [17,30]. Citizen participation in planning and evaluation further supports legitimacy and accountability [6,10]. Embedding social equity in mobility frameworks ensures that technological and economic progress translates into inclusive outcomes.

4.1.6. Technical (TEC)

Technical indicators evaluate infrastructure efficiency, safety, and interoperability across mobility systems [14,28]. ITS and IoT tools enable real-time data collection and adaptive traffic control [29,43]. Metrics such as travel time, energy use, and system reliability quantify performance improvements [11,14]. Integrating digital twin models strengthens technical precision and scenario planning, though interoperability and maintenance costs remain challenges [10,11,23]. Technical reliability thus underpins the scalability of smart mobility solutions.

4.1.7. Government (GOV)

Governance defines the institutional capacity and policy coherence required for smart mobility implementation [6,10,17]. Indicators include the existence of integrated mobility plans, inter-agency collaboration, and participatory decision processes [19,38]. Effective cases, such as cities applying Sustainable Urban Mobility Plans (SUMPs), demonstrate improved policy alignment and stakeholder coordination [10]. However, recent work on SUMP monitoring also shows that governance effectiveness depends on the ability of institutions to define baseline values, harmonize monitoring procedures, and operationalize a core set of indicators for long-term evaluation [46]. Financial instruments, PPPs, subsidies, and incentives promote low-carbon transitions, while citizen engagement enhances legitimacy [14]. Strengthening institutional expertise and data governance remains key to advancing coherent and accountable mobility strategies.

4.1.8. Public Transport (PT)

Public transport (PT) is central to sustainable urban mobility, providing efficient, low-emission, and equitable mobility options [10,14,20]. Core metrics include reliability, frequency, network coverage, and modal share [6,15]. Electrified fleets, smart ticketing, and real-time information improve performance and user satisfaction [2,11]. Affordable fares and accessible infrastructure reduce transport poverty, particularly in underserved areas [21,34]. Integrating PT with shared, cycling, and walking systems enhances multimodal connectivity and advances sustainability objectives [10,14].
Across the eight factor groups, two broad patterns emerge. First, indicators associated with digital infrastructure, technical performance, and public transport operations tend to be more numerous and operationally specific than those related to social inclusion, governance quality, or equity. Second, several dimensions overlap conceptually, particularly where accessibility, social inclusion, governance, and public transport are concerned, which helps explain why cross-study comparability remains limited. These patterns suggest that current smart mobility evaluation frameworks are broad in scope but uneven in operational clarity, reinforcing the need for more coherent and transferable indicator architectures.

4.2. Challenges in Indicator Application

4.2.1. Lack of Uniform Data Across Regions

One of the primary challenges identified across the reviewed literature is the lack of uniform and standardized data across different regions [6,16]. Variations in data collection methodologies, inconsistencies in indicator definitions, and disparities in technological infrastructure create significant barriers to conducting comparative analyses of mobility systems [10].
Differences in data collection processes across cities and countries hinder the establishment of consistent evaluation frameworks [13,28]. While some cities leverage advanced sensor networks, digital twins, and real-time analytics, others rely on manual data entry, surveys, and fragmented records [21]. This variation impacts the accuracy and reliability of mobility assessments, making it difficult to draw meaningful comparisons [7].
The reviewed studies also show that the absence of universally agreed-upon indicators further complicates mobility evaluations [19]. For instance, key performance indicators (KPIs) such as congestion levels, accessibility metrics, and sustainability measures often differ in definition and scope between studies [5]. Some regions prioritize environmental impact assessments, while others focus on economic efficiency or social equity [30]. This inconsistency limits the transferability of best practices and weakens cross-city benchmarking efforts [14].
Many cities, particularly in developing regions, face challenges in acquiring high-quality, real-time data due to limited financial and technical resources [6,21]. Public and private sector data silos further restrict access to comprehensive datasets, as proprietary concerns often limit open data initiatives [23]. Moreover, inconsistencies in timeframes for data collection, ranging from annual reports to real-time streaming, introduce additional barriers to comparative assessments [23].
Efforts to establish harmonized data standards, such as SUMI and the Global Mobility Indicators Framework, aim to address these challenges [10]. However, widespread adoption remains limited due to political, economic, and institutional barriers [17]. Strengthening international collaboration and promoting open data policies are critical steps toward enhancing data comparability and improving mobility evaluation methodologies [14].
Overall, the literature reviewed indicates that the lack of uniform data across regions remains a major obstacle in SUM assessment. Addressing this issue requires more consistent indicator definitions, interoperable data collection methods, and stronger open-data practices. Without these conditions, cross-city benchmarking and the transferability of evaluation frameworks remain limited.

4.2.2. Adaptability Issues

The reviewed studies also show that the adaptability of SUM assessment frameworks remains a significant challenge due to the diverse socio-economic, geographic, and infrastructural contexts of cities [6]. While standardized evaluation models aim to provide a universal basis for comparison, their applicability varies depending on local conditions, technological maturity, and policy environments [10].
A major obstacle identified in the reviewed literature is the variation in urban infrastructure, governance structures, and financial resources [23,38]. Cities with well-developed public transport networks and digital infrastructure can readily integrate smart mobility indicators, while those with informal transport systems or inadequate digitalization face difficulties in applying the same criteria [21]. This discrepancy leads to the need for context-specific adaptations, as global best practices may not seamlessly translate into all urban settings [7].
Many assessment models struggle with scalability when applied to cities of different sizes or economic capacities [19]. Indicators designed for megacities with high investment in smart mobility may not be applicable to small or medium-sized cities, where financial and technical constraints limit implementation [36]. The reviewed studies further suggest that while some frameworks prioritize sustainability and governance, others emphasize technological integration, leading to inconsistencies in comparative evaluations [30].
The integration of digital technologies, real-time data analytics, and intelligent transport systems varies significantly across regions [14]. While developed cities benefit from sensor networks and automated data collection, others rely on manual surveys and periodic reports, leading to inconsistencies in data accuracy and comparability [21]. This disparity affects the reliability of adaptability models, as data availability and interoperability play crucial roles in determining the effectiveness of mobility assessments [7].
The adaptability of SUM evaluation also depends on regulatory frameworks and institutional coordination [34]. Some cities lack legal provisions to support innovative mobility solutions, such as shared mobility services or digital transport platforms, limiting the application of key indicators [10]. Additionally, institutional fragmentation often leads to incoherent policy implementation, further complicating the integration of global mobility assessment methodologies [21].
Taken together, these studies suggest that adaptability is not simply a matter of adjusting indicator lists, but of aligning evaluation frameworks with local institutional capacity, infrastructure conditions, and policy priorities. This helps explain why frameworks that appear robust in one urban context may be only partially transferable to another.

5. Methods for Evaluating Smart Urban Mobility

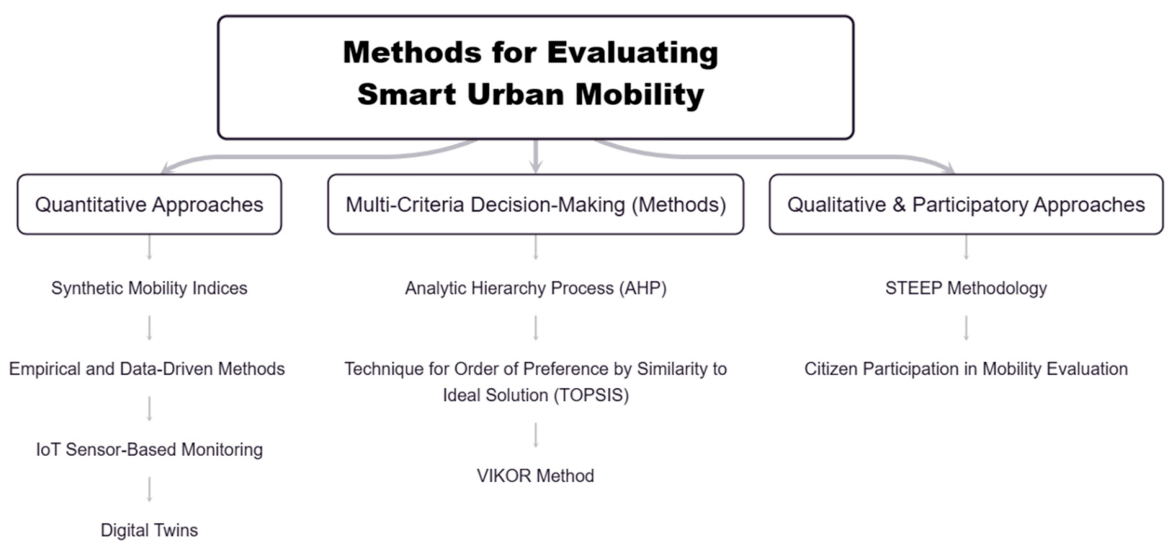
Table 3 summarizes the methodological approaches, smart city embedding, and key findings reported in selected studies on SUM evaluation. To differentiate between generic urban mobility evaluation and evaluations explicitly embedded within smart city contexts, each study was classified according to its level of smart city embedding as Explicit, Partial, or General urban mobility. This classification indicates whether the study directly frames mobility evaluation within a smart city or smart mobility strategy, partially incorporates smart mobility, ICT, ITS, digital governance, or data-driven elements, or primarily addresses urban mobility from a broader sustainability or transport planning perspective. The table reflects a wide range of analytical techniques, including synthetic indices, empirical and data-driven methods, MCDM models, simulation-based tools, and qualitative or participatory approaches. To complement this overview, Figure 8 groups these methodologies into three broad families: quantitative approaches, MCDM methods, and qualitative or participatory frameworks. Hybrid approaches are also increasingly reported, suggesting a shift toward integrated evaluation models that combine benchmarking, prioritization, monitoring, and stakeholder-oriented assessment.
Taken together, the reviewed methods differ not only in analytical technique, but also in their data requirements, transferability, and policy function. Synthetic indices and indicator-based approaches facilitate cross-city comparison, but often simplify contextual complexity. MCDM methods provide stronger support for prioritization and structured decision-making, yet remain sensitive to weighting assumptions and expert judgment. Qualitative and participatory approaches capture governance, inclusion, and user experience more effectively, although their outputs are generally less standardized and more difficult to compare across cases. Hybrid approaches attempt to reconcile these trade-offs, but their implementation typically requires higher analytical capacity and more diverse data inputs.

5.1. Quantitative Approaches

5.1.1. Synthetic Mobility Indices

Synthetic mobility indices provide a structured way to evaluate SUM by aggregating normalized and weighted indicators into composite scores. These indices are mainly used for cross-city comparison, temporal monitoring, and evidence-based policy support [19]. They integrate dimensions such as accessibility, sustainability, technological adoption, public transport performance, and environmental quality [6,43].
Several reviewed studies use synthetic indices to compare urban mobility systems. López-Carreiro and Monzon [44] developed a Smart Mobility Index for six Spanish cities, incorporating environmental, social, economic, and technological indicators. Garau et al. [30] constructed a synthetic index for Cagliari, Italy, using variables related to public transport, bike-sharing, and private mobility support systems. Pinna et al. [20] analyzed 22 Italian cities over a ten-year period through a Synthetic Smart Mobility Index, showing regional disparities associated with infrastructure provision and access to funding. Other frameworks, such as the Sustainable Urban Mobility Indicators (SUMI), emphasize non-motorized transport, public transport quality, and air quality [8,19].
The main advantage of synthetic indices is their ability to summarize complex urban mobility conditions into comparable scores. However, their reliability depends on indicator selection, normalization, weighting procedures, and data availability [5,13]. These indices may also oversimplify context-specific mobility dynamics when applied across highly heterogeneous urban settings [14,21].

5.1.2. Empirical and Data-Driven Methods

Empirical and data-driven methods support more dynamic forms of SUM assessment by using information from surveys, administrative records, GPS traces, smart cards, mobile phone data, connected vehicles, and other digital sources [11,14]. These methods help monitor mobility patterns, evaluate transport performance, and support adaptive planning.
The reviewed studies use different empirical strategies. Bielińska-Dusza et al. [31] employed survey data and Structural Equation Modeling to analyze public perceptions of smart mobility solutions in Krakow. Rześny-Cieplińska et al. [38] used qualitative and statistical tools to examine stakeholder priorities in sustainable urban logistics.
Real-time operational data have also been used to assess public transport reliability, infrastructure deficiencies, passenger flows, and route planning, as shown in studies such as Garau et al. [30] and Almassawa et al. [42]. In addition, smart ticketing, contactless payment systems, AI, and machine learning can support demand-responsive planning and predictive analysis, although their application depends on local data capacity [11,14,23]. These approaches strengthen evidence-based evaluation, but they also face limitations. Data integration across heterogeneous sources remains difficult because of interoperability, standardization, privacy, and institutional access barriers [10,11,28]. These constraints are especially relevant in cities with limited technical and governance capacity.

5.1.3. IoT Sensor-Based Monitoring

IoT sensor-based monitoring is a specific data-driven approach that enables continuous and high-resolution observation of traffic flow, public transport operations, parking availability, emissions, and environmental conditions [6,11,14].
These sensors are commonly embedded in traffic lights, intersections, public transport vehicles, road infrastructure, and parking systems, allowing adaptive responses to changing urban conditions [28]. Key applications include:
  • Traffic Flow and Congestion Monitoring: IoT sensors deployed at intersections and along roadways collect data on vehicle density, speed, and congestion trends, enabling adaptive traffic control and dynamic signal timing [11,23];
  • Public Transport Optimization: Real-time passenger tracking can improve route planning, scheduling, and service reliability [21,30,42];
  • Environmental Monitoring: Air quality sensors can support the evaluation of transport-related emissions and environmental impacts [6,31];
  • Smart Parking Solutions: Sensor-equipped parking spaces provide real-time availability data, reducing search time and vehicle idling [14,28].
The primary advantage of IoT monitoring is its ability to generate continuous, high-resolution data for real-time system adjustment and predictive analysis [11,14].
However, privacy, cybersecurity, interoperability, implementation costs, and long-term maintenance remain major challenges, particularly in resource-constrained cities [11,14,28,30].

5.1.4. Digital Twins

Digital twins represent a more integrative and simulation-oriented extension of data-driven monitoring. A digital twin is a virtual representation of a physical urban mobility system that integrates real-time data, simulation, geospatial analytics, and predictive modeling [11]. This allows planners to test scenarios, optimize traffic flows, and evaluate infrastructure or policy interventions before implementation.
Xu et al. [11] implemented the Chattanooga Digital Twin, combining IoT sensor data, real-time simulations, and cyber-physical control to optimize traffic signal synchronization and reduce vehicle energy consumption. Digital twins can also support infrastructure planning, public transport reliability analysis, pedestrian and cyclist safety assessment, accessibility planning, and multimodal integration [11,14,28].
However, digital twins require continuous high-quality data, strong technical capacity, and interagency data coordination. High development and maintenance costs, interoperability issues, and privacy concerns limit their adoption in cities with weaker digital infrastructure or fragmented institutional systems [11,17,42].

5.2. Multi-Criteria Decision-Making (MCDM) Methods

Multi-Criteria Decision-Making (MCDM) methods are widely used in SUM evaluation because they allow decision-makers to compare alternatives under multiple and often conflicting criteria. These methods are especially relevant for assessing sustainability, accessibility, cost, governance, technological innovation, and project prioritization [1,8]. The reviewed studies include AHP, TOPSIS, VIKOR, Simple Additive Weighting (SAW), Complex Proportional Assessment (COPRAS), Preference Ranking Organization Method for Enrichment Evaluation (PROMETHEE), Evaluation Based on Distance from Average Solution (EDAS), and fuzzy or hybrid variants.

5.2.1. Analytic Hierarchy Process (AHP)

AHP is mainly used to structure complex mobility problems hierarchically and derive criteria weights from expert judgments [8,15]. In the reviewed studies, it appears both as a stand-alone weighting method and as part of hybrid frameworks.
Zapolskytė et al. [15] used AHP to determine the relative importance of smart mobility factors and indicators. Rodrigues da Silva et al. [45] combined AHP with TOPSIS and a 2-tuple linguistic model to select urban mobility projects in Pato Branco, Brazil. Huertas et al. [6] also applied AHP to assess sustainable mobility in Saltillo, Mexico, incorporating criteria related to environmental impact, accessibility, and governance. Recent applications further show the relevance of AHP-based weighting in public transport and citizen-centered mobility frameworks [24,47].
The main strength of AHP is its transparency and ability to incorporate expert knowledge. Its main limitation is dependence on subjective judgments, which may affect consistency and reproducibility when expert panels are small or highly context-specific [1,5].

5.2.2. Technique for Order of Preference by Similarity to Ideal Solution (TOPSIS)

TOPSIS ranks alternatives according to their distance from an ideal positive solution and an ideal negative solution [8]. In SUM evaluation, it is commonly used to compare cities, assess mobility systems, and prioritize project alternatives.
Awasthi et al. [8] applied fuzzy TOPSIS, together with fuzzy VIKOR and GRA, to evaluate sustainable urban mobility projects in Luxembourg. Rodrigues da Silva et al. [45] used TOPSIS to rank urban mobility projects after deriving criteria weights with AHP and processing expert assessments through a 2-tuple linguistic model. Zapolskytė et al. [15] also used TOPSIS as part of a hybrid MCDM framework to compare smart mobility systems across cities.
TOPSIS is valued for its computational simplicity, intuitive interpretation, and suitability for comparative ranking. However, its outputs depend on the selected criteria, weighting procedure, normalization method, and quality of the input data [5,8].

5.2.3. VIKOR Method

VIKOR is designed to identify compromise solutions when criteria conflict, making it useful in mobility planning contexts where environmental, economic, social, and operational objectives must be balanced [1,8]. Unlike methods focused only on closeness to an ideal solution, VIKOR emphasizes trade-offs and compromise-based decision-making.
In the reviewed literature, VIKOR appears less frequently than AHP or TOPSIS. Awasthi et al. [8] applied fuzzy VIKOR alongside fuzzy TOPSIS and GRA to evaluate alternatives such as tram implementation, bus system reorganization, and electric vehicle sharing. The method helped assess mobility projects under sustainability-oriented criteria while considering conflicting decision objectives.
The main advantage of VIKOR is its ability to represent compromise solutions. Its limitations include sensitivity to criteria weights and the assumption that decision-makers are willing to accept compromise over strict optimality [1,8].

5.3. Qualitative & Participatory Approaches

5.3.1. STEEP Methodology

The STEEP methodology evaluates SUM through social, technological, economic, environmental, and political dimensions [13]. This makes it useful for assessments that go beyond technical performance and incorporate governance, social inclusion, sustainability, and institutional conditions.
The social dimension addresses equity, accessibility, user satisfaction, and public acceptance. The technological dimension focuses on ITS, IoT, digital twins, and smart infrastructure. The economic dimension considers investment, cost-effectiveness, and financial sustainability. The environmental dimension examines emissions, energy efficiency, and non-motorized transport. Finally, the political or governance dimension considers institutional coordination, regulatory frameworks, and policy alignment [6,10,17,23].
Studies such as Bosch et al. [23], Xu et al. [11], Awasthi et al. [8], Huertas et al. [6], Regmi [10], and Moscholidou and Pangbourne [17] illustrate how these dimensions appear across smart mobility evaluations. The main value of STEEP is its ability to organize complex mobility issues into a multidimensional framework, although its application depends on the availability of qualitative and institutional data.

5.3.2. Citizen Participation in Mobility Evaluation

Citizen participation strengthens SUM evaluation by incorporating user experience, public perception, and stakeholder priorities into assessment frameworks [6,9].
Participatory methods include surveys, interviews, focus groups, participatory mapping, Delphi processes, crowdsourced data, public consultations, and citizen advisory mechanisms [19]. Bosch et al. [23] examined the digital divide in access to smart mobility services in the Barcelona Metropolitan Area. Almassawa et al. [42] incorporated surveys, interviews, and focus groups to assess smart mobility readiness in South Tangerang. Rześny-Cieplińska et al. [38] used Delphi-based stakeholder analysis to identify urban logistics priorities in Tricity, Poland.
Other studies emphasize the role of participatory governance in improving transparency, accountability, and public trust [10,17].
These approaches are valuable because they reveal implementation gaps that technical indicators alone may miss. However, participation may be affected by low engagement, digital literacy gaps, unequal representation, and demographic bias [10,30]. For this reason, participatory methods are most useful when combined with quantitative indicators or MCDM frameworks, creating hybrid approaches that balance technical rigor with contextual and social relevance.
Across the reviewed literature, no single methodological family is sufficient to evaluate SUM comprehensively. Synthetic indices are useful for benchmarking, data-driven methods strengthen monitoring, IoT and digital twins support real-time and simulation-based assessment, MCDM approaches support prioritization and structured decision-making, and participatory methods capture governance and user-centered dimensions. The main challenge is therefore not choosing one superior method, but aligning the evaluation approach with the purpose of the assessment, the available data, the institutional context, and the type of decision to be supported.

6. Project Prioritization in Smart Urban Mobility Evaluation

Project prioritization is a critical component of SUM planning. Beyond simply measuring system performance, evaluation frameworks can actively support decision-makers in identifying which interventions should be implemented first under conditions of limited resources, competing objectives, and institutional constraints. In this context, project prioritization becomes a practical extension of evaluation, linking analytical assessment with implementation-oriented decision support. Within the reviewed literature, however, explicit prioritization frameworks remain relatively scarce. In this review, project prioritization was interpreted in a strict sense as the evaluation of specific urban mobility project alternatives leading to a ranking, selection, or priority order based on predefined criteria. Under this definition, only two of the 33 reviewed studies directly address the prioritization of urban mobility projects. Awasthi et al. [8] evaluated alternative urban mobility projects using fuzzy TOPSIS, fuzzy VIKOR, and fuzzy GRA, while da Silva et al. [45] proposed a multi-criteria approach for selecting urban mobility projects in medium-sized cities. Other studies in the reviewed sample apply decision-support, indicator-based, or MCDM approaches to related purposes, such as assessing smart mobility systems, ranking cities, prioritizing indicators, evaluating policy readiness, or comparing mobility strategies; however, they do not explicitly prioritize alternative urban mobility projects. Table 4 compares the approaches proposed by Awasthi et al. [8] and da Silva et al. [45], emphasizing differences in methodological complexity, contextual adaptability, and practical applicability.
Da Silva et al. [45] adopt a pragmatic approach tailored to a medium-sized city with limited resources, namely Pato Branco, Brazil. Their primary objective is to identify cost-effective and rapidly implementable mobility solutions that address immediate challenges like congestion and inefficient use of public space. Their framework emphasizes feasibility, budget constraints, and local mobility needs, prioritizing interventions that can deliver tangible short-term benefits, such as parking space reallocation and dedicated public transport lanes.
From a methodological standpoint, da Silva et al. [45] combine AHP and TOPSIS to weight and rank 13 context-specific criteria, producing a relatively transparent and accessible framework that is well suited to cities with limited technical capacity.
In contrast, Awasthi et al. [8] propose a more comprehensive, sustainability-oriented framework applied in Luxembourg. Their approach evaluates long-term impacts using 31 criteria aligned with broader sustainability objectives and selected through a literature review and expert consultation. This design favors high-impact projects such as tram system implementations, with stronger emphasis on multimodal integration, emissions reduction, and advanced transport technologies.
Methodologically, Awasthi et al. [8] apply AHP for weighting and combine fuzzy TOPSIS, fuzzy VIKOR, and Grey Relational Analysis (GRA), complemented by veto rules and extensive sensitivity testing across 39 scenarios. Their model emphasizes analytical rigor and robustness, although it relies heavily on expert-driven qualitative inputs and shows limited empirical validation beyond the evaluated case context.
Both studies conduct sensitivity analyses to test the stability of their rankings. While Awasthi et al. [8] confirm the dominance of the tram project through extensive scenario testing, da Silva et al. [45] demonstrate the consistency of their framework by showing that parking space reallocation remains a priority under different weight configurations.
Each approach presents clear trade-offs. Awasthi et al. [8] offer a technically sophisticated and methodologically robust model better suited to cities with stronger institutional capacity and more advanced infrastructure, whereas da Silva et al. [45] provide a streamlined and adaptable framework oriented toward actionable outcomes in constrained settings. The former offers broader analytical depth but may be harder to operationalize in lower-capacity contexts; the latter is easier to implement, but its transferability is constrained by its dependence on local expert judgments and case-specific criteria.
Taken together, these two studies show that project prioritization in SUM is not governed by a single preferred framework, but by the fit between methodological design and urban context. More complex MCDM structures may improve robustness and multidimensional coverage, whereas simpler configurations may enhance usability and policy relevance under real-world constraints. This comparison therefore suggests that future prioritization frameworks should seek a better balance between analytical rigor, contextual adaptability, and practical implementation.

7. Discussion: Trends, Challenges, and Future Directions

7.1. Current Trends in Smart Urban Mobility Evaluation

The reviewed literature suggests three major trends in the evaluation of SUM: increasing reliance on data-driven monitoring, growing incorporation of participatory approaches, and continued diversification of methodological frameworks. Together, these trends indicate that the field is evolving toward more dynamic, multidimensional, and context-sensitive forms of assessment [6,11,14].
First, real-time and data-driven approaches have become increasingly prominent. Digital sensing, GPS-enabled systems, smart ticketing, and large-scale mobility datasets are now used to improve traffic management, public transport performance, and multimodal integration [21,28,43]. These tools allow evaluation frameworks to capture temporal variability and system responsiveness more effectively than static assessments. However, their implementation remains uneven because of privacy concerns, interoperability problems, platform fragmentation, and unequal digital infrastructure across cities [17,21,23].
Second, the literature shows a growing participatory turn in mobility evaluation. Citizen perspectives, stakeholder consultation, and community-generated feedback are increasingly used to improve accessibility, legitimacy, and responsiveness in mobility planning [6,19]. Digital platforms, GIS-based participatory mapping, open-data interfaces, and crowdsourced information expand the interaction between users and institutions [10,23,38]. However, participation does not automatically ensure inclusion. Digital divides, socioeconomic disparities, uneven technological literacy, and weak institutional capacity can limit who participates and whether citizen feedback is translated into policy action [10,23,30].
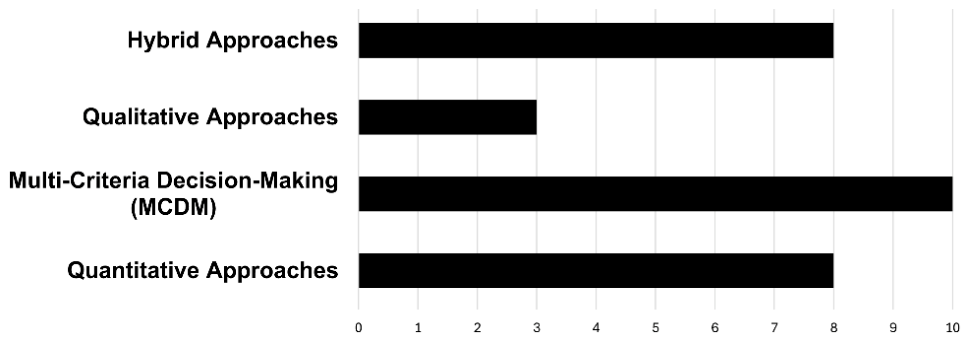
Third, the review reveals increasing methodological pluralism. As shown in Figure 9, MCDM methods predominate among the selected studies, followed by quantitative, hybrid, and qualitative approaches. This reflects the need for structured evaluations that can balance multiple dimensions, such as sustainability, accessibility, governance, and technological readiness. The emergence of hybrid approaches further suggests an effort to combine analytical rigor with contextual sensitivity. Overall, SUM evaluation is moving toward more data-rich, participatory, and methodologically integrated forms of assessment.

7.2. Challenges and Future Directions

Despite recent advances, the evaluation of SUM remains fragmented. A central challenge is the absence of widely accepted frameworks capable of supporting both cross-city comparison and contextual adaptation. Many methodologies rely on locally defined indicators, case-specific weighting structures, and context-dependent assumptions, which limits benchmark development and weakens the transferability of findings [5,6]. This issue is reinforced by the heterogeneity of urban environments, since cities differ in institutional capacity, digital readiness, infrastructure quality, social conditions, and policy priorities [10,21,23].
Methodological choices also remain highly context-dependent. MCDM methods such as AHP, TOPSIS, and VIKOR support structured decision-making, but their results depend on weighting schemes, indicator selection, and expert judgment. Similarly, synthetic indices can summarize performance across multiple dimensions, but may overlook local disparities and behavioral complexity [1,8,14,20]. Therefore, the main methodological challenge is not only selecting robust tools, but ensuring that their assumptions remain transparent and transferable.
Structured initiatives such as Sustainable Urban Mobility Plans (SUMPs) illustrate one possible path toward more coherent assessment practices [19]. However, their broader transfer outside Europe is constrained by data scarcity, limited institutional capacity, and fragmented governance, especially in developing and resource-constrained cities [1,6,21]. Improving comparability will therefore require frameworks that combine a standardized core of indicators with locally tailored metrics [6].
Another persistent limitation is the lack of high-quality, interoperable data. Differences in digital infrastructure, open-data availability, and data governance hinder the use of AI, machine learning, predictive analytics, and real-time assessment tools [11,23]. Although these technologies can strengthen dynamic mobility evaluation, their broader use remains constrained by privacy concerns, implementation costs, and unequal technical capacity [5,11,21].
Future research should prioritize four directions. First, evaluation architectures should combine standardized core indicators with context-sensitive extensions. Second, more attention is needed to developing approaches suitable for cities with resource constraints, fragmented governance, informal transit systems, and limited data capacity [10,14]. Third, future studies should validate assessment frameworks across multiple urban contexts rather than relying primarily on single-case applications [6]. Fourth, research should examine financing, governance, and regulatory arrangements that make smart mobility interventions feasible while protecting equity and data privacy [1,10,17].
Taken together, these challenges show that SUM evaluation continues to face a persistent tension between comparability and contextual adaptability. While methodological innovation and data-driven tools have significantly expanded the analytical possibilities of the field, their broader applicability still depends on governance capacity, data quality, institutional coordination, and the ability to reflect local mobility realities.

8. Conclusions

This systematic literature review examined evaluation approaches and indicator architectures for SUM in smart city contexts, revealing a field characterized by methodological diversity, uneven indicator selection, and limited cross-study comparability. While MCDM methods—particularly AHP, TOPSIS, and VIKOR—are the most widely applied tools, their overall effectiveness remains constrained by subjective weighting and highly context-dependent application.
A total of 273 indicators were identified and classified into eight factor categories (ICT, ENV, ACC, ECO, SOC, TEC, GOV, and PT), confirming the multidimensional nature of smart mobility assessment while also highlighting the absence of harmonized evaluation standards. Digital tools such as digital twins, IoT-based monitoring, and real-time analytics are increasingly integrated to enhance system responsiveness and optimization; however, their adoption remains uneven due to data, governance, and infrastructure constraints.
Across the selected studies, mobility evaluations increasingly support urban planning and policymaking by guiding project prioritization, informing resource allocation, and strengthening evidence-based decisions within mobility plans and related frameworks. However, their practical impact remains constrained by fragmented governance, heterogeneous data conditions, and the limited incorporation of user perspectives.
Significant regional disparities persist across smart city contexts. While frameworks such as SUMPs are well established in Europe, cities in developing regions often face institutional fragmentation, informal transport dominance, and limited evaluation capacity. In this sense, these differences underscore the need for assessment frameworks that are adaptable enough to reflect local contextual realities, yet sufficiently comparable to support cross-city learning and effective policy transfer.
Although the PRISMA-guided process provides methodological rigor, transparency, and reproducibility, the final corpus of 33 studies should be interpreted as a focused analytical sample derived from strict eligibility criteria specifically targeting SUM evaluation within smart city contexts. The relatively selective final corpus highlights that structured SUM evaluation frameworks remain a specialized and still developing area within the broader smart mobility literature. Additionally, future work should expand multilingual search strategies to reduce language bias, as relevant local or region-specific evidence may be documented in languages other than English.
Future research should prioritize four complementary directions: (1) developing harmonized yet context-sensitive indicator architectures to enable cross-city benchmarking; (2) validating assessment frameworks across multiple urban contexts rather than relying primarily on single-case applications; (3) integrating real-time, participatory, and user-centered data sources for more comprehensive evaluations; and (4) examining financing, governance, and regulatory arrangements that can improve the feasibility of smart mobility interventions in institutionally constrained settings. Advancing SUM evaluation will depend on balancing methodological rigor with contextual adaptability, inclusivity, institutional feasibility, and effective data governance in order to foster sustainable, efficient, and equitable urban transport systems worldwide.

Author Contributions

Conceptualization, J.B.-M. and A.H.-B.; methodology, J.B.-M. and A.H.-B.; validation, J.B.-M., A.H.-B., F.J.D.-M. and A.G.; formal analysis, J.B.-M.; investigation, J.B.-M.; resources, A.H.-B.; data curation, J.B.-M.; writing—original draft preparation, J.B.-M. and A.H.-B.; writing—review and editing, F.J.D.-M. and A.G.; visualization, J.B.-M. and A.H.-B.; supervision, A.H.-B., F.J.D.-M. and A.G.; project administration, A.H.-B.; funding acquisition, J.B.-M. and A.H.-B. All authors have read and agreed to the published version of the manuscript.

Funding

This research was funded by the Coordination of Scientific Research, managed by the Universidad Michoacana de San Nicolás de Hidalgo (UMSNH), grant number 19665.

Institutional Review Board Statement

Not applicable.

Informed Consent Statement

Not applicable.

Data Availability Statement

The original contributions presented in this study are included in the article and are openly available in GitHub at https://github.com/jorgebecerra-ing/Evaluation-Approaches-and-Indicator-Architectures-for-Smart-Urban-Repository (accessed on 24 April 2026). Further inquiries can be directed to the corresponding author.

Acknowledgments

The authors would like to thank the Universidad Michoacana de San Nicolás de Hidalgo for their valuable support in the development of this study, and the Ministry of Science, Humanities, Technology, and Innovation (SECIHTI) of Mexico for supporting the doctoral studies of Jorge Becerra-Moreno. During the preparation of this manuscript, the authors used ChatGPT 5.3 for the purposes of spelling, grammar, clarity, and word choice. The authors have reviewed and edited the output and take full responsibility for the content of this publication.

Conflicts of Interest

The authors declare no conflicts of interest.

Abbreviations

The following abbreviations are used in this manuscript:
ACCAccessibility
AHPAnalytic Hierarchy Process
ECOEconomic Aspects
ENVEnvironmental Sustainability
EVsElectric Vehicles
GOVGovernance and Policy
ICTInformation and Communication Technologies
IoTInternet of Things
ITSIntelligent Transportation Systems
KPIKey Performance Indicator
MaaSMobility as a Service
MCDAMulti-Criteria Decision Analysis
MCDMMulti-Criteria Decision-Making
PRISMAPreferred Reporting Items for Systematic Reviews and Meta-Analyses
PTPublic Transport
QCAQualitative Comparative Analysis
SDGSustainable Development Goal
SEMStructural Equation Modeling
SMISmart Mobility Index
SOCSocial Aspects
SUMISustainable Urban Mobility Indicators
SUMSmart Urban Mobility
SUMPSustainable Urban Mobility Plans
TECTechnical and Technological Aspects
TOPSISTechnique for Order of Preference by Similarity to Ideal Solution
VIKORVIšekriterijumska optimizacija i kompromisno rešenje

References

  1. Krishankumar, R.; Pamucar, D.; Deveci, M.; Ravichandran, K.S. Prioritization of zero-carbon measures for sustainable urban mobility using integrated double hierarchy decision framework and EDAS approach. Sci. Total Environ. 2021, 797, 149068. [Google Scholar] [CrossRef]
  2. Ahonen, V.; Merisalo, V.; Hussain, S.; Pekkala, V.; Leviäkangas, P. Are smart mobility pilots in finland fostering sustainability?—An assessment. Transp. Res. Procedia 2023, 72, 3869–3876. [Google Scholar] [CrossRef]
  3. Banister, D. The sustainable mobility paradigm. Transp. Policy 2008, 15, 73–80. [Google Scholar] [CrossRef]
  4. Butler, L.; Yigitcanlar, T.; Paz, A. Smart urban mobility innovations: A comprehensive review and evaluation. IEEE Access 2020, 8, 196034–196049. [Google Scholar] [CrossRef]
  5. Zapolskyte, S.; Trepanier, M.; Burinskiene, M.; Survile, O. Smart urban mobility system evaluation model adaptation to Vilnius, Montreal and Weimar cities. Sustainability 2022, 14, 715. [Google Scholar] [CrossRef]
  6. Huertas, J.I.; Stöffler, S.; Fernández, T.; García, X.; Castañeda, R.; Serrano-Guevara, O.; Mogro, A.E.; Alvarado, D.A. Methodology to assess sustainable mobility in LATAM cities. Appl. Sci. 2021, 11, 9592. [Google Scholar] [CrossRef]
  7. Müller Eie, D.; Kosmidis, I. Sustainable mobility in smart cities a document study of mobility initiatives of mid sized Nordic smart cities. Eur. Transp. Res. Rev. 2023, 15, 36. [Google Scholar] [CrossRef]
  8. Awasthi, A.; Omrani, H.; Gerber, P. Investigating ideal solution based multicriteria decision making techniques for sustainability evaluation of urban mobility projects. Transp. Res. Part A Policy Pract. 2018, 116, 247–259. [Google Scholar] [CrossRef]
  9. Qonita, M.; Rachmawati, R.; Rijanta, R. Assessing Amsterdam’s urban mobility through the lens of smart mobility goals. Case Stud. Transp. Policy 2025, 20, 101443. [Google Scholar] [CrossRef]
  10. Regmi, M.B. Governance of urban mobility policies and plans in Asian cities. Transp. Policy 2024, 149, 108–121. [Google Scholar] [CrossRef]
  11. Xu, H.; Berres, A.; Yoginath, S.B.; Sorensen, H.; Nugent, P.J.; Severino, J.; Tennille, S.A.; Moore, A.; Jones, W.; Sanyal, J. Smart mobility in the cloud Enabling real time situational awareness and cyber physical control through a digital twin for traffic. IEEE Trans. Intell. Transp. Syst. 2023, 24, 3145–3156. [Google Scholar] [CrossRef]
  12. Wang, A.; Zhang, A.; Chan, E.H.W.; Shi, W.; Zhou, X.; Liu, Z. A Review of Human Mobility Research Based on Big Data and Its Implication for Smart City Development. ISPRS Int. J. Geo-Inf. 2021, 10, 13. [Google Scholar] [CrossRef]
  13. de Oliveira Cavalcanti, C.; Limont, M.; Dziedzic, M.; Fernandes, V. Sustainability assessment methodology of urban mobility projects. Land Use Policy 2017, 60, 334–342. [Google Scholar] [CrossRef]
  14. Melkonyan, A.; Koch, J.; Lohmar, F.; Kamath, V.; Munteanu, V.; Schmidt, J.A.; Bleischwitz, R. Integrated urban mobility policies in metropolitan areas A system dynamics approach for the Rhine Ruhr metropolitan region in Germany. Sustain. Cities Soc. 2020, 61, 102358. [Google Scholar] [CrossRef]
  15. Zapolskyte, S.; Burinskiene, M.; Trepanier, M. Evaluation criteria of smart city mobility system using MCDM method. Balt. J. Road. Bridge Eng. 2020, 15, 196–224. [Google Scholar] [CrossRef]
  16. Hussain, S.; Ahonen, V.; Leviäkangas, P. Assessing the sustainability alignment of smart mobility projects. Transp. Res. Procedia 2025, 84, 161–168. [Google Scholar] [CrossRef]
  17. Moscholidou, I.; Pangbourne, K. A preliminary assessment of regulatory efforts to steer smart mobility in London and Seattle. Transp. Policy 2020, 98, 170–177. [Google Scholar] [CrossRef]
  18. Marsden, G.; Reardon, L. Questions of governance Rethinking the study of transportation policy. Transp. Res. Part A Policy Pract. 2017, 101, 238–251. [Google Scholar] [CrossRef]
  19. Mozos Blanco, M.; Pozo Menéndez, E.; Arce Ruiz, R.; Baucells Aletà, N. The way to sustainable mobility A comparative analysis of sustainable mobility plans in Spain. Transp. Policy 2018, 72, 45–54. [Google Scholar] [CrossRef]
  20. Pinna, F.; Masala, F.; Garau, C. Urban policies and mobility trends in Italian smart cities. Sustainability 2017, 9, 494. [Google Scholar] [CrossRef]
  21. Waqar, A.; Alshehri, A.H.; Alanazi, F.; Alotaibi, S.; Almujibah, H.R. Evaluation of challenges to the adoption of intelligent transportation system for urban smart mobility. Res. Transp. Bus. Manag. 2023, 51, 101060. [Google Scholar] [CrossRef]
  22. Nastjuk, I.; Trang, S.; Papageorgiou, E.I. Smart cities and smart governance models for future cities. Electron Mark. 2022, 32, 1917–1924. [Google Scholar] [CrossRef]
  23. Bosch, E.R.; Wybraniec, B.; Lazzarini, B.; Junyent, M.V.; Garola Crespo, A. The dignity project toward a system of inclusive digital mobility in the Barcelona metropolitan area. Transp. Res. Procedia 2021, 58, 134–141. [Google Scholar] [CrossRef]
  24. Angarita-Lozano, D.; Hidalgo-Guerrero, D.; Díaz-Márquez, S.; Morales-Puentes, M.; Mendoza-Moreno, M.A. Multidimensional evaluation model for sustainable and smart urban mobility in Global South cities: A citizen-centred comprehensive framework. Sustainability 2025, 17, 4684. [Google Scholar] [CrossRef]
  25. Vargas-Maldonado, R.C.; Lozoya-Reyes, J.G.; Ramírez-Moreno, M.A.; Lozoya-Santos, J.d.J.; Ramírez-Mendoza, R.A.; Pérez-Henríquez, B.L.; Velasquez-Mendez, A.; Jimenez Vargas, J.F.; Narezo-Balzaretti, J. Conscious mobility for urban spaces: Case studies review and indicator framework design. Appl. Sci. 2023, 13, 333. [Google Scholar] [CrossRef]
  26. Lyons, G. Getting smart about urban mobility aligning the paradigms of smart and sustainable. Transp. Res. Part A Policy Pract. 2018, 115, 4–14. [Google Scholar] [CrossRef]
  27. Gössling, S. The Psychology of the Car: Automobile Admiration, Attachment, and Addiction; Elsevier: Amsterdam, The Netherlands, 2017. [Google Scholar]
  28. Ambrosino, G.; Finn, B.; Gini, S.; Mussone, L. A method to assess and plan applications of its technology in public transport services with reference to some possible case studies. Case Stud. Transp. Policy 2015, 3, 421–430. [Google Scholar] [CrossRef]
  29. Ambrosch, K.E.; Leihs, D. Assessment of smart city implementations. In Proceedings of the 2016 Smart Cities Symposium Prague (SCSP 2016), Prague, Czech Republic, 26–27 May 2016; pp. 1–6. [Google Scholar] [CrossRef]
  30. Garau, C.; Masala, F.; Pinna, F. Cagliari and smart urban mobility: Analysis and comparison. Cities 2016, 56, 35–46. [Google Scholar] [CrossRef]
  31. Bielinska-Dusza, E.; Hamerska, M.; Zak, A. Sustainable mobility and the smart city: A vision of the city of the future. The case study of Cracow (Poland). Energies 2021, 14, 7936. [Google Scholar] [CrossRef]
  32. Jittrapirom, P.; Caiati, V.; Feneri, A.; Ebrahimigharehbaghi, S.; Alonso-González, M.J.; Narayan, J. Mobility as a service: A critical review of definitions, assessments of schemes, and key challenges. Urban Plan. 2017, 2, 13–25. [Google Scholar] [CrossRef]
  33. Geels, F.W.; Sovacool, B.K.; Schwanen, T.; Sorrell, S. Sociotechnical transitions for deep decarbonization. Science 2017, 357, 1242–1244. [Google Scholar] [CrossRef]
  34. Unno, G.; Herthogs, P.; von Richthofen, A. Evaluating the context adaptiveness of mobility visions for future smart cities. In Lecture Notes in Electrical Engineering 1209 LNEE, Proceedings of the ICSTTE: International Conference on SmartRail, Traffic and Transportation Engineering, Changsha, China, 28–30 July 2023; Springer: Berlin/Heidelberg, Germany, 2024; pp. 433–456. [Google Scholar] [CrossRef]
  35. Litman, T.M. Evaluating Transportation Equity: Guidance for Incorporating Distributional Impacts, Accessibility, and Options into Transport Planning; Victoria Transport Policy Institute: Victoria, BC, Canada, 2022; Available online: https://www.vtpi.org/equity.pdf (accessed on 22 August 2025).
  36. Battarra, R.; Zucaro, F.; Tremiterra, M.R. Smart mobility: An evaluation method to audit Italian cities. In Proceedings of the 2017 5th IEEE International Conference on Models and Technologies for Intelligent Transportation Systems (MT-ITS), Naples, Italy, 26–28 June 2017; pp. 421–426. [Google Scholar] [CrossRef]
  37. European Commission. SUMP Guidelines and Decisionmakers Summary. 2019. Available online: https://urban-mobility-observatory.transport.ec.europa.eu/sustainable-urban-mobility-plans/sump-guidelines-and-decision-makers-summary_en (accessed on 11 October 2025).
  38. Rześny Cieplińska, J.; Szmelter Jarosz, A.; Moslem, S. Priority based stakeholders analysis in the view of sustainable city logistics Evidence for Tricity, Poland. Sustain. Cities Soc. 2021, 67, 102751. [Google Scholar] [CrossRef]
  39. Moher, D.; Liberati, A.; Tetzlaff, J.; Altman, D.G. Preferred reporting items for systematic reviews and meta analyses The PRISMA statement. Int. J. Surg. 2010, 8, 336–341. [Google Scholar] [CrossRef]
  40. Haddaway, N.R.; Page, M.J.; Pritchard, C.C.; McGuinness, L.A. Prisma2020: An R package and Shiny app for producing PRISMA 2020 compliant flow diagrams, with interactivity for optimised digital transparency and open synthesis. Campbell Syst. Rev. 2022, 8, e1230. [Google Scholar] [CrossRef]
  41. Avni, A.; Burley, P.; Casey, P.; Cherney, J.; Christiansen, L.; Daly, J.S.; Evans, R.; Jared, D.M.; Landgraf, G.; Meier, A.; et al. Literature searches and literature reviews for transportation research projects. How to search, where to search, and how to put it all together: Current practices. In Transportation Research Circular; The National Academies of Sciences, Engineering, and Medicine: Washington, DC, USA, 2015. [Google Scholar]
  42. Almassawa, S.F.; Rustiadi, E.; Fauzi, A.; Sutriadi, R. Policy on the implementation of smart mobility in the south Tangerang city, Indonesia based on public transportation using the promethea method. Plan. Malays. 2024, 22, 293–306. [Google Scholar] [CrossRef]
  43. Battarra, R.; Gargiulo, C.; Tremiterra, M.R.; Zucaro, F. Smart mobility in Italian metropolitan cities: A comparative analysis through indicators and actions. Sustain. Cities Soc. 2018, 41, 556–567. [Google Scholar] [CrossRef]
  44. Lopez-Carreiro, I.; Monzon, A. Evaluating sustainability and innovation of mobility patterns in spanish cities. analysis by size and urban typology. Sustain. Cities Soc. 2018, 38, 684–696. [Google Scholar] [CrossRef]
  45. da Silva, R.R.; Santos, G.D.; Setti, D. A multi criteria approach for urban mobility project selection in medium sized cities. Sustain. Cities Soc. 2022, 86, 104096. [Google Scholar] [CrossRef]
  46. Rutka, A.; Michnej, M.; Zwoliński, T.; Gabory, M. Core indicators for monitoring the Sustainable Urban Mobility Plan: A case study. Sustainability 2024, 16, 5632. [Google Scholar] [CrossRef]
  47. Choosakun, A.; Yeom, C. Developing evaluation framework for intelligent transport system on public transportation in Bangkok metropolitan regions using fuzzy AHP. Infrastructures 2021, 6, 182. [Google Scholar] [CrossRef]
Figure 1. PRISMA 2020 flow diagram of the study selection process used in this review. A final sample of 33 studies was included for content analysis.
Futuretransp 06 00113 g001
Figure 2. Annual trend of records identified through the systematic literature search.
Futuretransp 06 00113 g002
Figure 3. Geographical distribution of case-study contexts in the included studies.
Futuretransp 06 00113 g003
Figure 4. Most frequent keywords as observed in the retrieved literature corpus.
Futuretransp 06 00113 g004
Figure 5. Keyword co-occurrence network based on the full set of records identified through the systematic literature search.
Futuretransp 06 00113 g005
Figure 6. Typological classification of the included studies based on the main analytical approaches identified in the review [1,2,5,6,7,8,9,10,11,13,14,16,17,19,20,21,23,24,25,28,29,30,31,34,38,42,43,44,45,46,47].
Futuretransp 06 00113 g006
Figure 7. Semantic word cloud of all identified indicators in the selected studies.
Futuretransp 06 00113 g007
Figure 8. Methodological approaches for smart urban mobility evaluation.
Futuretransp 06 00113 g008
Figure 9. Distribution of dominant methodological approaches in selected studies.
Futuretransp 06 00113 g009
Table 1. Number of factors and indicators reported in selected studies.
AuthorsICTENVACCECOSOCTECGOVPTΣ FactorsΣ Indicators
Ambrosino et al., 2015 [28]1 17
Ambrosch and Leihs, 2016 [29] 21 11529
Garau et al., 2016 [30]221 1618
Cavalcanti et al., 2017 [13] 1 11 317
Pinna et al., 2017 [20] 21 148
Battarra et al., 2017 [36]111 328
Awasthi et al., 2018 [8] 1 111 431
Battarra et al., 2018 [43]111 328
Mozos-Blanco et al., 2018 [19] 1 123
López-Carreiro et al., 2018 [44]12 1 416
Moscholidou et al., 2020 [17] 1 13
Zapolskyte et al., 2020 [15]12 1 1 523
Melkonyan et al., 2020 [14]11 11 1 525
Krishankumar et al., 2021 [1] 2 2221 98
Rześny-Cieplińska et al., 2021 [38] 1 11 320
Huertas et al., 2021 [6] 11 11445
Bosch et al., 2021 [23]1 1 1396
Choosakun et al., 2021 [47]211 1 1621
Bielinska et al., 2021 [31]11112 1718
Zapolskyte et al., 2022 [5]12 1 1 522
Da Silva et al., 2022 [45] 1 11 1443
Xu et al., 2023 [11]2 2 412
Müller-Eie et al., 2023 [7]211 414
Vargas et al., 2023 [25]111 1 1 522
Ahonen et al., 2023 [2] 1 11 340
Waqar et al., 2023 [21]1 11 12623
Rutka et al., 2024 [46] 21 1 44
Unno et al., 2024 [34]11 11111630
Regmi, 2024 [10] 2122 746
Almassawa et al., 2024 [42]1 212 1 77
Angarita et al., 2025 [24]12 112 836
Qonita et al., 2025 [9] 1111 2623
Hussain et al., 2025 [16] 211221 975
Note: Eight factor groups were considered. ICT = Information and Communication Technologies; ENV = Environmental; ACC = Accessibility; ECO = Economic; SOC = Social; TEC = Technical; GOV = Government; PT = Public Transport.
Table 2. Indicators identified in selected studies by factor group.
Factor GroupIndicatorsΣ
ICTElectronic payment; Information provision; Dynamic information; Mobile apps; SMS traffic alerts; Electronic signaling; Ticket payment; Route information; Route planner; Online ticketing; Road signage; SMS alerts; Mobile ticketing; Electronic information panels; Web communication; Online planning and payment; Signal information; Lighting management; Traffic surveillance; IT integration; Public transport stop digitization; Public transport vehicle digitization; PT apps; Communication networks; Technical skills; Technological security; Smart public transport education; Efficient traffic management; Data handling; Cybersecurity; Network management; Smart cards; Monitoring; Electronic tolling; Automated safety systems; Traffic light management; Trip planning; Validators and payment systems; Traffic monitoring; Smart streets; Smart lighting; Digital environment; Real-time information; Automatic public transport and pedestrian prioritization.44
ENVElimination of paper tickets; Population coverage; Bus density; Bikes per 10,000 inhabitants; Cars per 10,000 inhabitants; Bicycle station density; Stations per 10,000 inhabitants; Pedestrian zones; Restricted traffic zones; Park-and-ride facilities; Urban density; Shopping centers per capita; Public transport usage; Intelligent mobility; Sustainable transport modes; Fossil fuel consumption; Land consumption; Land impact; Non-motorized traffic; Land use change; CO2 taxes; Renewable fuels in public transport; Methane and biogas logistics; Renewable energy sources; Environmental protection; Environmental awareness; Air quality; Noise reduction; Biodiversity preservation; Cycling frequency; Reduction in cycling infrastructure gaps; Average speed improvement; Energy efficiency; Pollution control; Use of ecological vehicles; Adoption of alternative fuels in public transport. 36
ACCComprehension of measures; User profiling; Waiting times at bus stops; Accessibility to key locations; Multimodal connectivity; Disability accommodation; Accessibility for reduced mobility users; Public transport coverage; Affordable tariffs; Bicycle access and rentals; Pedestrian-friendly block designs; Availability of ramps; Defined pedestrian crossings; Accessibility for vulnerable users; Access to public transport stops; Use of electric buses; Walkability; Cycling infrastructure; Informal mobility; Universal design principles; Streets with sidewalks. 21
ECOParking pricing and occupancy; Investment volume; Operational costs; Investment in public transport; Public transport infrastructure; Mobility policy expenditures; Net value of investments; GDP per capita; Employment generation; Revenue streams; Municipal expenditure; Public transport cost; Parking ticket revenue; Life-cycle cost; Resource utilization; Supplier revenue; Economies of scale; Delivery time performance; User costs; Household expenditure; Government subsidies; Employment growth; Development of new services; Service efficiency; Operator costs; Infrastructure quality and cost; Public and private investment; Time speed and distance metrics; Congestion levels; Vehicle occupancy; Modal share; Recurrent PT investment. 32
SOCEquity; Social safety; Cleanliness and infrastructure modernity; Reliability; Willingness to use PT; Public transport modernity; Engagement in mobility planning; Traffic accident rates; Citizen participation; Perceived quality; Trust in public transport; Public service quality; Civic engagement; Urban health outcomes; Cultural inclusiveness; Public acceptance; Trust in service providers; Monitoring and transparency; Voluntary participation; Social inclusion; Accessibility for persons with disabilities; Gender equity; Social infrastructure; Crime prevention; Workspaces; Stakeholder training; Financial and regulatory support; Public transport safety; Passenger safety. 29
TECTime occupancy rates; Travel outliers; Occupancy anomalies; Shuttle services; Implementation of PT systems; Public vehicle management; Info-mobility services; Centralized traffic lights; Infrastructure safety standards; Vehicle occupancy; Motorization rate; Congestion-linked land use; Annual PT investment; Travel time; Use of alternative fuels in PT; Modern parking facilities; Emission reduction strategies; Smart pedestrian crossings; Speed mitigation; Smart logistics; Shared mobility systems; Smart paving; Smart lighting systems; Ease of implementation; Documented planning procedures; Total cost of ownership; Resource optimization; Mobility and energy use; Transparency in mobility systems; Adaptation of transport modes; On-street charging infrastructure; Digital parking systems; Road technology deployment; People and goods movement; Traffic flow monitoring; Traffic management efficiency; Modal distribution; Vehicle customization; Technology adoption; System compatibility; Investment in smart PT; Costs of smart PT systems; Connected fleet management; Smart transport networks; Alignment with master plans. 45
GOVParking regulation enforcement; Service provider oversight; Information validity; Electronic payment integrity; Reservation fee predictability; Parking availability; Charging accuracy; Violation trends; Sanction response time; Awareness of violations; Urban planning and regulations; Public transport regulatory bodies; Mobility policy frameworks; Cybersecurity policies; Institutional coordination; Clarity in institutional responsibilities; Institutional expertise; Planning frameworks; Staff competencies; Legal adequacy; Decision-making clarity; Authority decentralization; Implementation monitoring; Elected official engagement; Representative training; Public communication; Defined mobility goals; Transport mode inclusion in policies; Technology-related policies; Policy formulation gaps; Political commitment to mobility; Clear mobility guidelines; Strategic plan responsiveness; Sectoral alignment; National urban strategy alignment; Citizen-focused planning; Stakeholder involvement; Traffic law enforcement; Governmental support. 39
PTPublic transport demand; Use of green buses; Supplementary PT services; Carpooling demand and supply; Bike lane and station density; Bicycle ownership; PT reliability and frequency; Network service area; Road safety; Congestion mitigation; Replacement of private vehicles; Public parking space conversion; Integration of shared transport; Shared electric vehicles; ITS deployment; Public transport improvement strategies; Mass PT project implementation; Bus stop enhancements; Route optimization; PT prioritization strategies; Modal share increase for PT; Promotion of walking and cycling; Congestion reduction; Accessible PT for disabled and elderly users; PT availability scheduling and convenience; PT integration and safety; Accessibility and expansion of mass transit corridors. 27
Note: Eight factor groups were considered. ICT = Information and Communication Technologies; ENV = Environmental; ACC = Accessibility; ECO = Economic; SOC = Social; TEC = Technical; GOV = Governance and Policy; PT = Public Transport.
Table 3. Summary of selected studies by methodological approaches, smart city embedding, and key findings.
AuthorsMethodological ApproachSmart City EmbeddingKey Findings
Ambrosino et al., 2015 [28]ITS analysis, feasibility studiesExplicitDesign of technical specifications adapted to PT contexts
Ambrosch et al., 2016 [29]Generic model, categorization of measuresPartialEvaluation of the impact of parking fees
Garau et al., 2016 [30]Synthetic indicator, city comparisonPartialComprehensive analysis of urban mobility
Cavalcanti et al., 2017 [13]Urban Mobility Projects Sustainability Index (UMPSI)General urban mobilityImprovements in accuracy and communication of results
Pinna et al., 2017 [20]Synthetic indicator, spatial analysisExplicitEvaluation of changes in sustainable mobility
Battarra et al., 2017 [36]Nine-step methodology, results comparisonPartialDistribution of indicators, local action analysis
Awasthi et al., 2018 [8]MCDM techniques (Fuzzy TOPSIS, Fuzzy VIKOR, Fuzzy GRA)ExplicitSustainability evaluation under uncertainty conditions
Battarra et al., 2018 [43]Empirical research, mobility parametersExplicitIdentification of strengths and weaknesses in urban mobility
López-Carreiro et al., 2018 [44]Smart Mobility Index, indicator standardizationPartialComparison of urban transport systems
Mozos-Blanco et al., 2018 [19]Comparative evaluation of SUMPsGeneral urban mobilityEvaluation of proposed measures in mobility plans
Zapolskyte et al., 2020 [15]Hybrid MCDM framework (AHP + SAW/COPRAS)PartialDefines a comprehensive criteria set for smart-city mobility assessment
Melkonyan et al., 2020 [14]Simulation model (SD, CIB, MDS), participatory modelingExplicitEvaluation of sustainable urban mobility patterns
Moscholidou et al., 2020 [17]Case study in London and SeattleExplicitEvaluation of smart mobility services
Krishankumar et al., 2021 [1]Fuzzy information structure, zero-emission prioritizationExplicitEffective prioritization of zero-emission measures
Rześny-Cieplińska et al., 2021 [38]Mixed methods (Delphi, text analysis, text mining)ExplicitIdentification of key characteristics and priorities
Huertas et al., 2021 [6]Three-phase approach, KPI comparisonPartialEvaluation of sustainable mobility in urban centers
Bosch et al., 2021 [23]Literature review, quantitative surveyPartialInsights into mobility situation in Barcelona
Bielinska et al., 2021 [31]Structural Equation Modeling (SEM)PartialEvaluation of smart-city solutions
Zapolskyte et al., 2022 [5]Hybrid MCDM method (SAW, COPRAS, TOPSIS, AHP)ExplicitComprehensive evaluation of smart-mobility levels
Da Silva et al., 2022 [45]MCDM (AHP, TOPSIS, 2-tuple)PartialSelection of urban-mobility projects
Choosakun et al., 2021 [47]Fuzzy AHP, expert-based weighting, hierarchical indicator frameworkExplicitPrioritization of APTS indicators for smart mobility
Xu et al., 2023 [11]Componentization paradigm, micro-services architecturePartialDecision-support platform (CTwin)
Müller-Eie et al., 2023 [7]Evaluation of SUMP and S.M.A.R.T. objectivesPartialComprehensive evaluation of sustainable-mobility strategies
Ahonen et al., 2023 [2]Qualitative Comparative Analysis (QCA)ExplicitEvaluation of smart-mobility pilots in Finland
Vargas et al., 2023 [25]Case-study review, indicator frameworkExplicitPreliminary conscious-mobility framework for Monterrey
Waqar et al., 2023 [21]Literature review, expert interviews, SEM analysisExplicitAnalysis of challenges in ITS implementation
Regmi, 2024 [10]Comparative policy governance analysis across Asian citiesGeneral urban mobilityHighlights coordination gaps; proposes integrated governance frameworks
Rutka et al., 2024 [46]Core-indicator validationGeneral urban mobilityBaseline framework for SUMP monitoring indicators
Unno et al., 2024 [34]Mobility evaluation framework, comparative analysisGeneral urban mobilityComparative evaluation of Smart-City projects
Almassawa et al., 2024 [42]MCDA (PROMETHEE), qualitative and quantitative approachExplicitPolicy-strategy model for transport
Qonita et al., 2025 [9]Goal-based framework; semi-quantitative indicators approachExplicitSystem diagnosis safety efficiency trade-off
Angarita et al., 2025 [24]AHP-based multidimensional frameworkExplicitCitizen-centred evaluation model for Global South cities
Hussain et al., 2025 [16]Alignment matrix with SDGs for projects, keyword-based coding; urban rural comparisonExplicitSDG coverage assessment and coherence application
Table 4. Comparison of project prioritization approaches in Awasthi et al. [8] and da Silva et al. [45].
StepAwasthi et al. (2018) [8]Da Silva et al. (2022) [45]
Context DefinitionDefine a framework based on global sustainability dimensions (economic, social, environmental, technical).Define the local context and mobility needs, including constraints such as budget, time, and technical capacity.
Project IdentificationSelect technically advanced projects (e.g., tram, car sharing, bus reorganization).Collect practical project proposals (e.g., elimination of parking spaces, smart signaling).
Criteria DefinitionIdentify 31 evaluation criteria from literature and expert input; classify them as cost or benefit criteria.Reduce from 43 to 12 criteria relevant to the local context.
Weighting MethodApply fuzzy AHP to assign relative weights to criteria.Use AHP to assign weights based on expert judgments.
Evaluation MethodUse TOPSIS, VIKOR, and GRA to evaluate alternatives from different perspectives.Apply TOPSIS to compare alternatives against selected criteria.
Robustness Check Apply veto rules to unify rankings and conduct sensitivity analysis to validate robustness. Modify weights and assess their impact on rankings through sensitivity analysis.
PrioritizationClassify and identify the most balanced alternative in terms of overall sustainability.Rank projects based on feasibility and local relevance.
Final Project SelectionSelect the final project based on aggregated outcomes.Select the most viable project with immediate benefits.
Disclaimer/Publisher’s Note: The statements, opinions and data contained in all publications are solely those of the individual author(s) and contributor(s) and not of MDPI and/or the editor(s). MDPI and/or the editor(s) disclaim responsibility for any injury to people or property resulting from any ideas, methods, instructions or products referred to in the content.