Article

Intelligent Pedestrian Model as a Risk-Based Framework for Pedestrian Prioritization

Department of Vehicle Maintenance and Diagnostics, Audi Hungaria Faculty of Engineering, Széchenyi István University, 9026 Győr, Hungary
*
Author to whom correspondence should be addressed.
Future Transp. 2026, 6(3), 108; https://doi.org/10.3390/futuretransp6030108
Submission received: 19 April 2026 / Revised: 9 May 2026 / Accepted: 12 May 2026 / Published: 19 May 2026

Abstract

Pedestrian safety at urban intersections requires risk-aware mechanisms that extend beyond binary collision detection toward comparative prioritization among multiple agents. This study introduces the Intelligent Pedestrian Model (IPM), a reference-normalized scalar framework that represents pedestrian risk as a function of trajectory, contextual, infrastructural, and behavioral factors, decomposed into Exposure and Severity components. Building on IPM, the Safety-Prioritized Trajectory Model (SPTM) operationalizes the Exposure component using an observation-only, leakage-free kinematic proxy embedded into a cost-aware negative log-likelihood objective. Evaluation on the ETH/UCY benchmark under a strictly inductive protocol shows that moderate prioritization (β ≈ 1.0) improves best-of-K multimodal performance (ALL FDE@K: 0.979 → 0.970 m) while maintaining mean displacement accuracy within seed-level variability. The results indicate that Exposure-based weighting does not act as a global accuracy enhancer but redistributes predictive capacity toward safety-relevant motion regimes. Validation currently covers two ETH/UCY folds under a controlled inductive protocol, while broader cross-fold evaluation remains for future work.

1. Introduction

Pedestrian fatalities remain a persistent challenge in road safety policy. According to the World Health Organization’s Global Status Report on Road Safety 2023 [1], pedestrians account for approximately 23% of all road traffic deaths globally. In the European Union, Eurostat data [2] indicate that vulnerable road users represent a disproportionately large share of fatalities relative to their modal share. The EU Road Safety Policy Framework 2021–2030 identifies the elimination of pedestrian fatalities as a central pillar of its Vision Zero strategy [3].
Automatic Emergency Braking (AEB) systems have demonstrated measurable effectiveness in reducing rear-end collisions and improving road safety outcomes [4,5]. As vehicle automation levels increase toward SAE Level 3 and beyond [6], systems must manage increasingly complex, multi-agent urban scenarios. At urban intersections, multiple pedestrians simultaneously occupy the operational domain, each exhibiting heterogeneous behavioral patterns, motion dynamics, and vulnerability characteristics.
Current trajectory prediction architectures including the Social Force Model [7], Social-LSTM [8], multimodal generative approaches [9], and transformer-based predictors [10] primarily optimize displacement accuracy. They estimate where a pedestrian will move but do not formalize how multiple pedestrians should be comparatively prioritized in safety-critical decision processes. In environments where ADAS systems must allocate limited attention, warning capacity, or intervention priority across multiple actors, a displacement-optimizing framework is insufficient.
This paper addresses the structural gap between displacement-oriented trajectory prediction and comparative safety prioritization in multi-agent environments through two contributions. First, the Intelligent Pedestrian Model (IPM) is introduced as a formal framework in which pedestrian risk is represented as a reference-normalized scalar functional over heterogeneous domains, decomposed into Exposure and Severity components, and interpreted as a population-relative deviation. Second, the Safety-Prioritized Trajectory Model (SPTM) provides a constrained empirical instantiation of the Exposure component under a strictly inductive evaluation protocol. The scope is explicitly limited. The objective is not to achieve state-of-the-art displacement accuracy, but to demonstrate that Exposure-based cost-aware learning is measurable, stable, and compatible with deployment-relevant constraints.

2. Related Work

2.1. Trajectory Prediction Paradigms

Pedestrian motion modeling has been dominated by trajectory prediction since the Social Force Model was created [7]. Social-LSTM [8] introduced recurrent architectures with social pooling; Trajectron++ [11] extended this with dynamically feasible forecasting; and transformer-based models [10] apply attention for long-range dependency modeling. Multimodal generative approaches—including conditional variational autoencoders [9] and generative adversarial networks [12]—address the inherent multimodality of pedestrian behavior. Despite these advances, all such models share a displacement-optimizing objective that does not address the prioritization problem inherent in multi-agent ADAS scenarios. Comprehensive surveys of trajectory prediction methods further confirm that the dominant focus across architectures remains displacement accuracy rather than decision-relevant prioritization [13,14].

2.2. Safety-Oriented Pedestrian Modeling

Surrogate safety measures such as Time-to-Collision (TTC) and Post-Encroachment Time (PET) quantify conflict severity [15]. Responsibility-Sensitive Safety (RSS) frameworks [16] formalize safety envelopes but focus on vehicle-to-vehicle interactions. Pedestrian intention estimation models [17,18,19] address crossing intention but do not integrate multi-domain risk factors into a unified scalar representation. Map-aware prediction approaches [20] incorporate infrastructural context; context-based models [21] demonstrate environment-dependent behavioral transitions. To the authors’ knowledge, no existing framework formalizes risk as a reference-normalized, population-level deviation enabling ordered prioritization across simultaneously present pedestrians. The present paper addresses this gap through a dissertation-derived contribution: the IPM provides the normative prioritization framework, while the SPTM provides a constrained first empirical instantiation of its Exposure component—together spanning the formal framework and the scoped predictive core of the broader research program. Recent trajectory prediction research increasingly emphasizes transformer-based forecasting, multimodal prediction, and interaction-aware modeling in complex traffic environments [13,14,22]. Despite substantial architectural progress, however, the dominant optimization objective across these approaches remains displacement-oriented forecasting performance. The present work differs in focus: rather than proposing a new predictive backbone, it investigates whether safety-relevant prioritization can be introduced through inductive Exposure-based weighting within an otherwise conventional probabilistic trajectory prediction framework.

3. The Intelligent Pedestrian Model (IPM)

3.1. Validation Architecture and Scope of This Article

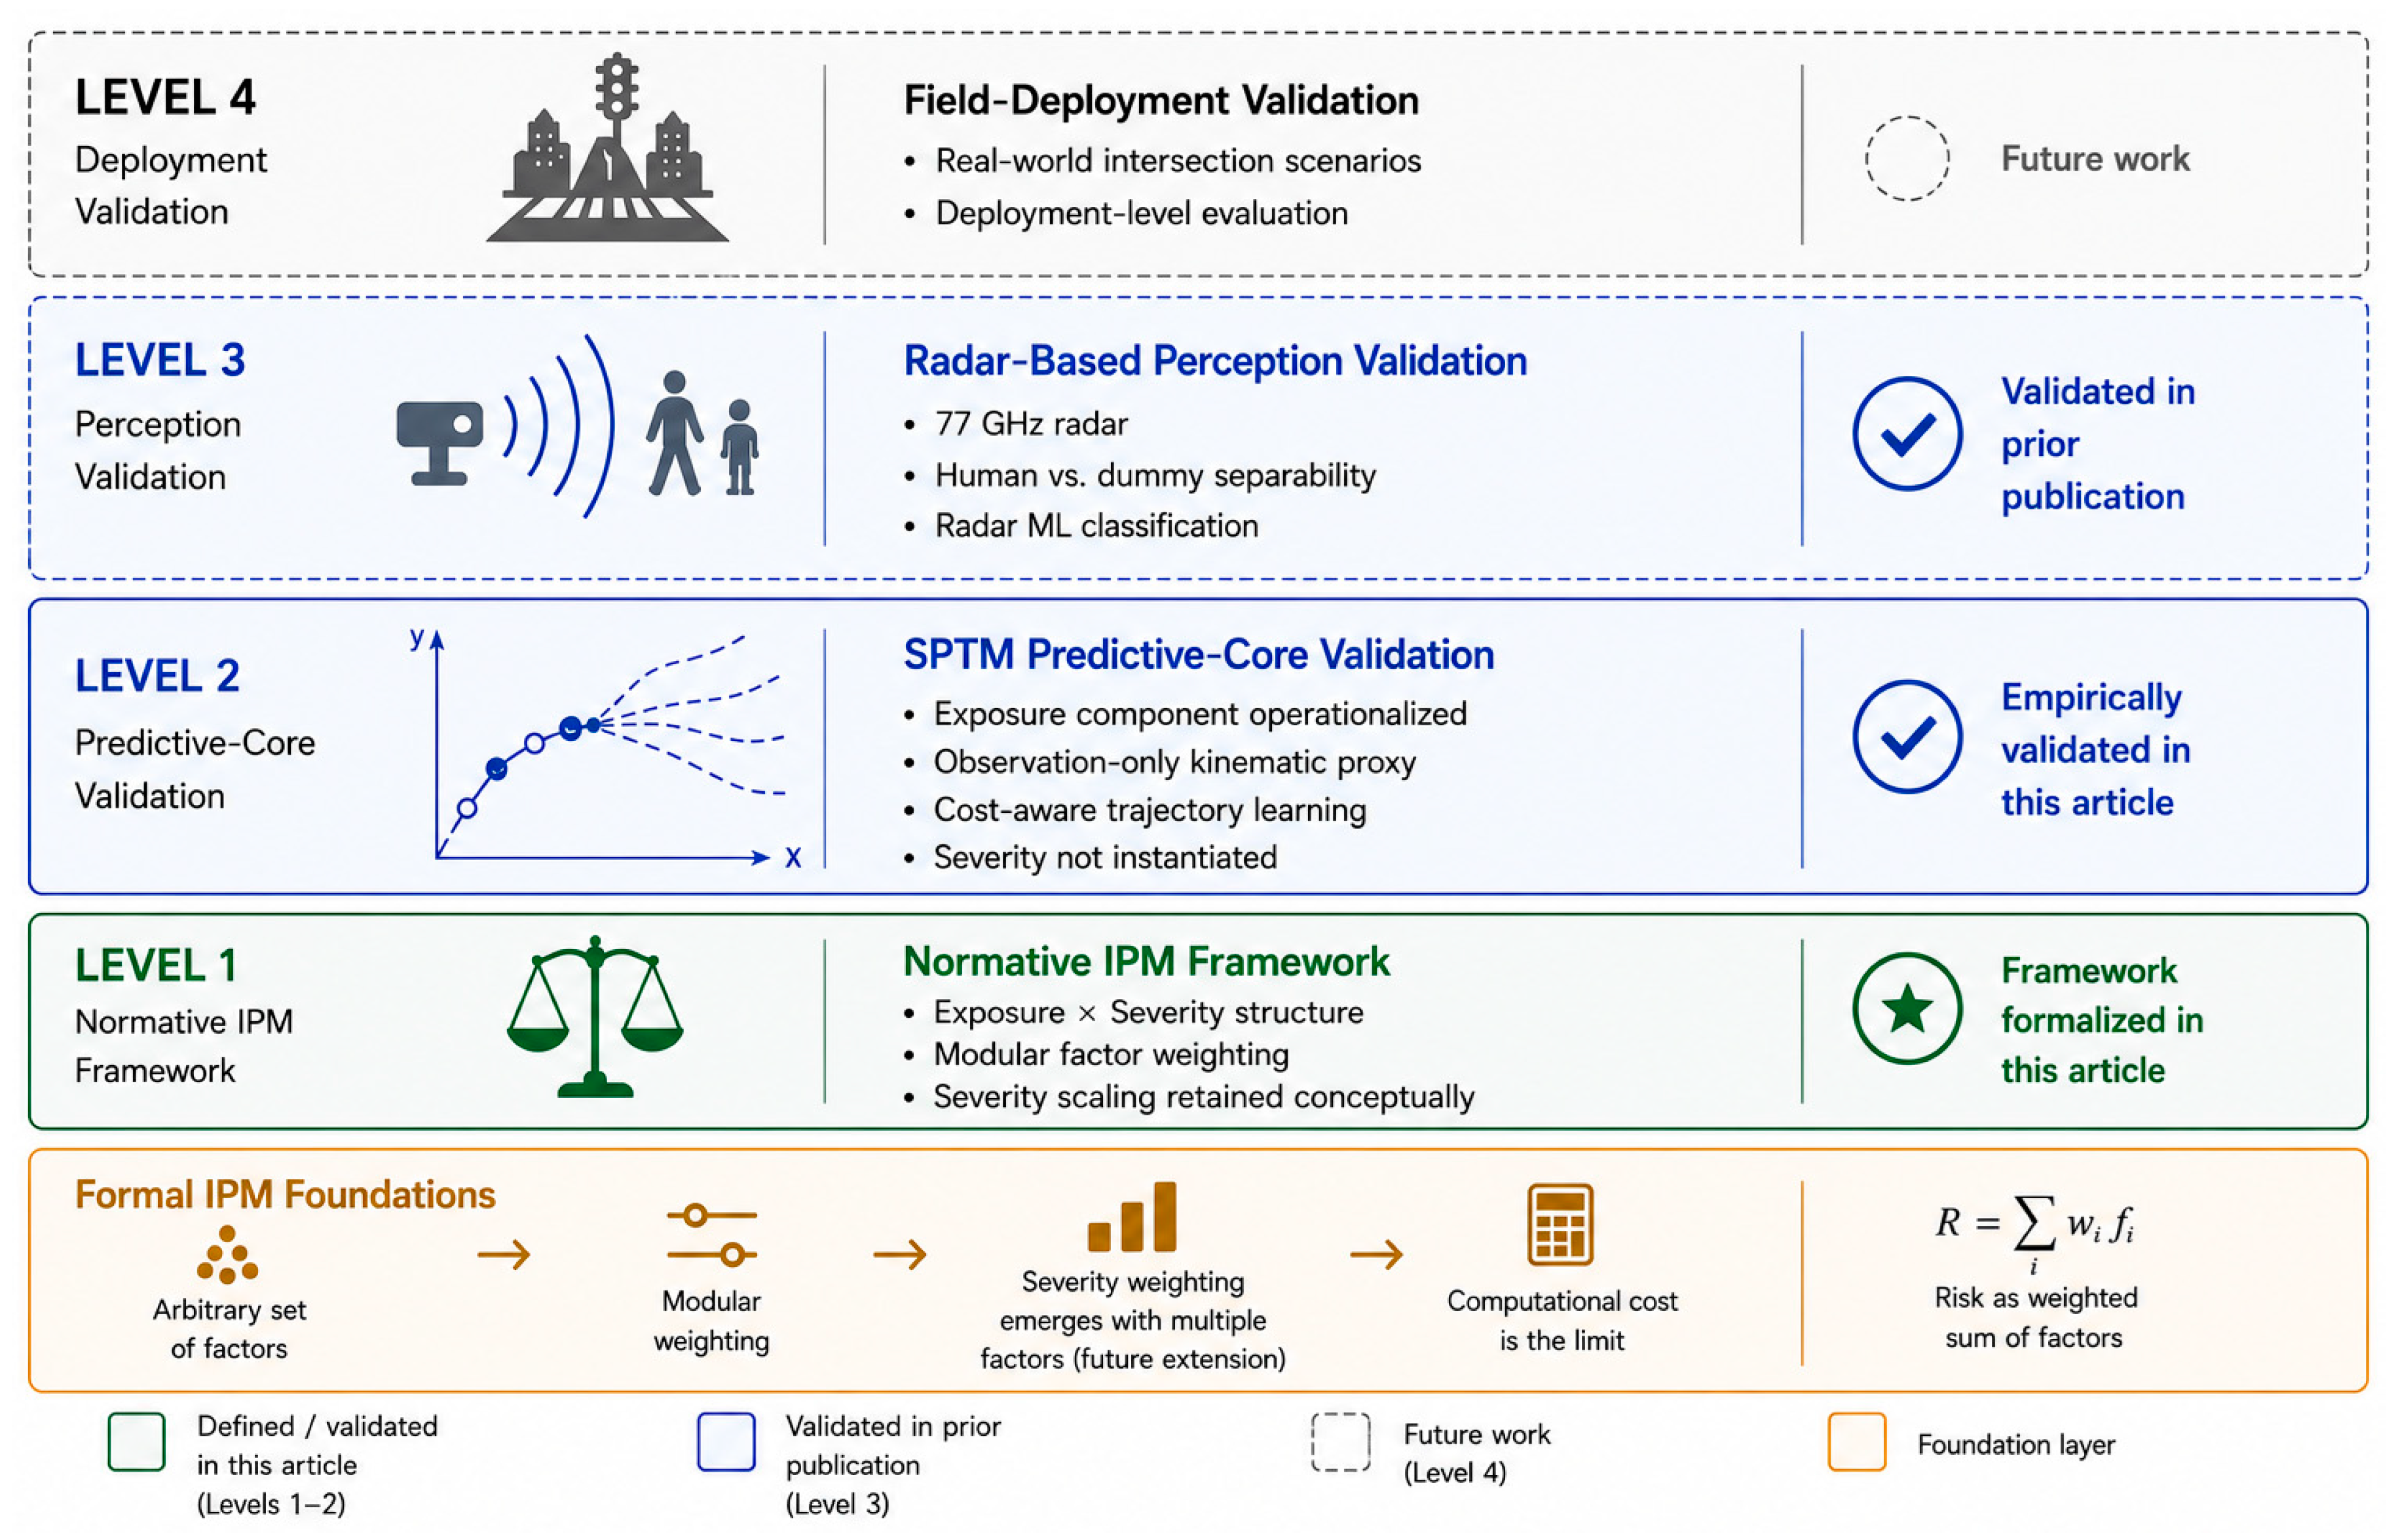
The IPM is structured as a layered validation architecture comprising formal foundations and four empirically progressive validation levels, illustrated in Figure 1. Each level is characterized by increasing empirical complexity and ecological fidelity.
The formal foundations layer establishes the mathematical formulation, ranking algorithm, and scenario-based logic on which all higher levels rest. The first validation level operationalizes these foundations as the normative IPM framework: Exposure × Severity decomposition, reference-state risk scoring, and the population-level deviation ΔR. The second validation level tests the IPM predictive core through risk ranking and trajectory prediction, providing scenario-based evaluation and baseline comparison. The third level extends to radar-based machine learning for perception and detection using a 77 GHz automotive radar, addressed in prior work [23]. The fourth and highest level applies the complete system to field trial recordings under real-world deployment conditions.

3.2. From Trajectory Prediction to Risk Prioritization

In real-world urban intersections, multiple pedestrians coexist under heterogeneous behavioral and environmental conditions. Safety systems must allocate limited attention or intervention capacity across several actors simultaneously, transforming the problem from binary collision detection into a comparative prioritization task. Trajectory prediction models answer the question “Where will they go?” and optimize displacement error or likelihood-based objectives. Safety-critical ADAS systems must instead answer “Who requires attention first?”—an objective requiring a structured mechanism that converts heterogeneous behavioral and contextual indicators into an ordered risk hierarchy. The IPM formalizes this transition.

3.3. Formal Risk Representation

The literature consistently demonstrates that pedestrian safety relevance is multi-factorial [7,8,18,19,20,21]. Motion dynamics, social interactions, environmental context, infrastructure constraints, and behavioral intention cues all influence movement and safety relevance. Accordingly, the IPM defines pedestrian risk as the functional in Equation (1), integrating trajectory, contextual, infrastructural, and behavioral factors into a unified representation.
Ri = f(Ti, Ci, Ii, Bi)
where
  • Ri denotes the Pedestrian Risk Score of pedestrian i;
  • Ti represents trajectory-related information (position, velocity, acceleration);
  • Ci denotes traffic conditions (vehicle speeds, density, visibility, weather);
  • Ii represents intersection characteristics (geometry, crosswalk presence, signalization);
  • Bi captures pedestrian-specific behavioral attributes (age, movement patterns, crossing intention).
Within the IPM, the scalar risk score is decomposed into an Exposure component and a Severity scaling factor, as defined in Equation (2):
Ri = Exposurei × Severityi
Exposure integrates dynamic, contextual, infrastructural, and behavioral indicators into a unified representation. Severity reflects vulnerability-dependent consequence scaling. This decomposition enforces semantic separation between domain types, preventing implicit conflation of heterogeneous variables. The IPM does not directly estimate collision probability or injury severity; instead, it introduces a scalar Pedestrian Risk Score functioning as a comparative safety relevance indicator. The exact functional form of f(·) is intentionally left unspecified at the framework level, preserving extensibility across sensing modalities, data availability, and deployment constraints.

3.4. Reference-Based Risk Interpretation

A fundamental conceptual question concerns whether risk should be interpreted as an absolute magnitude or as a context-dependent deviation within a multi-agent environment. Traditional metrics such as TTC quantify conflict imminence independently of the surrounding behavioral distribution. However, identical kinematic magnitudes may have different safety implications depending on the collective behavioral state of a scene: a walking speed that is unremarkable in a dense crosswalk may be anomalous during a signal-controlled waiting phase.
The IPM introduces a population-level baseline against which individual risk values are evaluated. The population-level reference state is defined in Equation (3):
μIPM = E[Ri]
denotes the mean risk score across the observed pedestrian population. The relative deviation of pedestrian i is then defined in Equation (4):
ΔRi = RiμIPM
A positive deviation indicates above-average integrated risk relative to the scene composition. This formulation does not imply imminent collision; it formalizes contextual unusualness within a multi-agent environment. Such deviation-based reasoning aligns with statistical anomaly detection principles and context-aware modeling strategies [8,21]. By embedding normalization directly into risk interpretation, the IPM adapts to scene composition without requiring explicit parameter retuning across different intersections or traffic densities. The ordered set R1, R2, …, Rn naturally induces a ranking structure enabling prioritization.

3.5. Weighted Multi-Factor Instantiation

For operationalizability, a weighted linear aggregation is introduced in Equation (5):
Ri = Σk=1n wk · xik
where xik denotes the k-th measurable factor associated with pedestrian i, and wk is the corresponding weight. This structure preserves interpretability by ensuring each factor contributes proportionally, guarantees monotonicity, and supports modular extensibility. The weights may be defined heuristically, calibrated empirically, or estimated through supervised learning. This formulation is consistent with multi-criteria decision-making (MCDM) theory, which establishes linear value models as a foundational approach for ranking alternatives under heterogeneous criteria [24,25].

3.6. Limitations and Scope of the IPM Framework

The IPM does not claim to directly predict crash probability nor perform causal injury modeling. It does not assert a complete representation of human behavior. Its purpose is to provide a coherent formal structure for integrating heterogeneous safety-relevant indicators into a comparative prioritization mechanism. The present article demonstrates this structure at the level of the IPM framework (Level 1) and the IPM core validation (Level 2), as shown in Figure 1. Extension to radar-based detection (Level 3) and full field-trial validation (Level 4) are beyond the scope of this paper.

4. Safety-Prioritized Trajectory Model (SPTM)

4.1. Role Within the IPM

The Safety-Prioritized Trajectory Model (SPTM) provides the first empirical instantiation of the Exposure component of the Intelligent Pedestrian Model (IPM) under a deliberately constrained validation setting. Rather than attempting to realize the full IPM formulation, which includes both Exposure and Severity, the objective of this section is to demonstrate that Exposure alone can be operationalized in a measurable, inductive, and leakage-free manner, and that it can be integrated into trajectory prediction through a minimal and controlled modification of the learning objective.
Severity was intentionally not instantiated in the present SPTM experiment. The objective of this study was to isolate the behavior of a single observation-only kinematic Exposure proxy under a controlled inductive setting. Since only one Exposure component is operationalized, introducing an additional Severity multiplier would primarily act as a global scaling term rather than providing interpretable factor-level prioritization. Within the broader IPM framework, Severity becomes meaningful when multiple heterogeneous risk factors and vulnerability-dependent consequence scalings are jointly modeled. The present study therefore focuses exclusively on validating whether Exposure-based prioritization alone can induce measurable and stable changes in learning behavior without architectural modification.
The SPTM follows a standard probabilistic trajectory prediction paradigm. Given an observed trajectory X , the model predicts a distribution over future trajectories Y using a multimodal formulation. As defined in Equation (6), the predictive distribution is modeled as a K-component Gaussian mixture over future trajectories, where Σ k denotes a diagonal covariance matrix.
p ( Y X ) = k = 1 K π k   N ( Y μ k , Σ k )
This predictive structure follows standard multimodal trajectory prediction formulations. The contribution of SPTM lies instead in how the model is trained.
An observation-only Exposure proxy r ( X ) is computed from the input trajectory and normalized to the interval [0, 1], yielding r norm ( X ) . This value defines the sample-wise weighting function given in Equation (7).
w ( X ) = 1 + β r norm ( X )
where β 0 controls the strength of prioritization. When β = 0 , the formulation reduces to standard maximum likelihood training. For β > 0 , trajectories associated with higher Exposure receive proportionally greater influence during optimization.
Note that β is an Exposure-weighting parameter controlling the strength of cost-aware prioritization in the training objective. It is distinct from the factor weights wk in Equation (5), which govern inter-factor aggregation within the full IPM instantiation. In particular, β does not relate to Severity scaling; Severity remains a separate IPM component not instantiated in the present experiment. The resulting training objective is a weighted negative log-likelihood, as defined in Equation (8), where the expectation is taken over the empirical training distribution.
L SPTM = E X Y w ( X ) l o g p ( Y X )
This formulation introduces a cost-aware learning mechanism aligned with the prioritization objective of the IPM framework, while leaving the predictive model itself unchanged. In this sense, SPTM modifies standard trajectory prediction in exactly one aspect: the incorporation of Exposure-dependent weighting into the loss function.
To stabilize multimodal learning, an entropy regularization term is added, as defined in Equation (9):
L final = L SPTM λ ent   H ( π ) , H ( π ) = k π k l o g π k
This regularization is a standard technique to encourage mode utilization and does not constitute part of the IPM-specific contribution. Conceptually, the SPTM does not modify how trajectories are predicted; instead, it modifies how the model allocates learning emphasis during optimization. Higher-Exposure trajectories receive a proportionally greater contribution to the training objective through Exposure-dependent weighting, encouraging the model to devote increased representational capacity to dynamically unstable or safety-relevant motion regimes. In this sense, the proposed mechanism operates as a prioritization strategy within the learning process rather than as a structural modification of the predictive architecture itself.

4.2. Exposure Proxy and Inductive Operationalization

The Exposure component is operationalized through a kinematic proxy computed exclusively from the observed trajectory segment, ensuring strict compliance with inductive evaluation principles. The term Exposure is used here in a constrained kinematic sense and should not be confused with traffic-engineering Exposure measures such as pedestrian flow, vehicle flow, or traffic volume. In the present SPTM formulation, Exposure refers specifically to the dynamic intensity and short-term instability of observed pedestrian motion, operationalized through observation-only trajectory descriptors including speed, acceleration, and directional change. No future information or test-set statistics are used at any stage of the computation. The proxy is constructed from three motion descriptors: velocity magnitude, acceleration magnitude, and directional change, each summarized using the 90th percentile over the observation window. This design emphasizes peak motion intensity while maintaining robustness to noise and transient fluctuations. The resulting scalar is normalized to the interval [0, 1] using robust percentile scaling estimated from the training and validation sets only.
This restriction on observation-only kinematics is intentional. It ensures that the Exposure signal reflects measurable motion characteristics available at the inference time, avoids information leakage, and provides a controlled basis for evaluating whether a purely kinematic notion of Exposure can induce meaningful structure in the data. Within this formulation, trajectories with higher normalized Exposure values represent motion regimes characterized by increased dynamic intensity or instability. A high-Exposure subset (CRIT) is defined as the upper decile of the training-derived Exposure distribution and is used to evaluate whether the proxy identifies a statistically distinct and more challenging prediction regime.

4.3. Model Architecture and Training Setup

To isolate the effect of Exposure-based weighting, the predictive model is intentionally kept lightweight and structurally conventional. A residual Temporal Convolutional Network (TCN) encoder [26] is employed, followed by a Gaussian mixture density head producing multimodal trajectory forecasts. The architecture is not designed to achieve state-of-the-art displacement accuracy, but rather to provide a stable and computationally efficient backbone within which the impact of the proposed weighting mechanism can be isolated. Such compact architectures are consistent with broader trends toward efficient deep learning models for resource-constrained deployment scenarios [27]. In this setting, the use of a lightweight model (~35,000 parameters) ensures that observed performance variations can be attributed to the training objective rather than architectural complexity.
Training is performed using standard optimization procedures, with Exposure-based weighting applied at the sample level. Prioritization strength is controlled through the parameter β , where β = 0 corresponds to the baseline and increasing values emphasize high-Exposure trajectories.

4.4. Experimental Protocol

The complete experimental configuration is summarized in Table 1. Empirical evaluation is conducted on the ETH/UCY pedestrian trajectory benchmark [13,28] using a leave-one-scene-out protocol. All normalization parameters, including Exposure scaling bounds and the CRIT threshold, are determined exclusively from the training and validation sets and remain fixed during testing.
This strictly inductive setup is critical to the validity of the results. It ensures that the Exposure proxy, the weighting function, and the evaluation subsets are all defined without access to test data, thereby preventing leakage and enabling a clean assessment of generalization. This protocol aligns with established recommendations on reproducibility and evaluation rigor in machine learning research [29].
All experiments are repeated across multiple random seeds to account for stochastic variability in training. Performance is evaluated using standard trajectory prediction metrics—Average Displacement Error (ADE) and Final Displacement Error (FDE) as well as best-of- K metrics—which capture multimodal prediction quality. Results are reported separately for the full test set (ALL) and the high-Exposure subset (CRIT).

4.5. Results

The baseline model (β = 0) provides a stable reference consistent with LSTM-class trajectory predictors on the evaluated fold, confirming that the architecture is suitable for controlled comparison. The CRIT subset exhibits higher prediction error than the full test set, indicating that the Exposure proxy identifies a more challenging prediction regime under the inductive normalization scheme. The primary effect of Exposure-based weighting is observed in multimodal prediction quality. Moderate prioritization ( β 1.0 ) consistently improves best-of- K metrics, indicating enhanced coverage of plausible future trajectories. This effect is stable across random seeds and does not depend on a specific proxy variant.
In contrast, mean displacement metrics (ADE, FDE) show only minor variations within seed-level variability, indicating that the method does not primarily act as a global accuracy enhancer. Instead, it redistributes predictive capacity toward high-Exposure trajectories while maintaining overall performance. Within the CRIT subset, the effect is more nuanced. Improvements in intermediate trajectory accuracy are accompanied by slight increases in endpoint dispersion, reflecting increased uncertainty in long-term predictions. This behavior is consistent with the interpretation that high-Exposure trajectories are inherently less predictable and that increased variance may represent a more appropriate model response.
Overall, the results indicate that Exposure-based weighting induces a systematic shift in model behavior: rather than uniformly optimizing displacement error, the model allocates representational capacity in a manner aligned with safety-relevant motion characteristics. Complete results for all β settings and proxy variants are reported in Table 2; the multi-seed means ± standard deviations for the primary metrics are provided in Table A4 in the Appendix A.9.
Proxy ablation under inductive evaluation and exploratory cross-fold validation shows both Proxy v0 and v1 at β = 1.0; the qualitative pattern is consistent: CRIT ADE improves, best-of-K metrics improve, and CRIT FDE increases slightly. The direction of all effects is identical across both proxy definitions, confirming that the accuracy–uncertainty redistribution is a property of the cost-aware mechanism, not an artifact of a specific proxy. The SPTM baseline (β = 0) achieves ADE = 0.930 m and FDE = 1.880 m on the biwi_eth fold, remaining within the performance range typically reported for compact trajectory prediction baselines (ADE ≈ 1.05 m) and consistent with the LSTM range reported in the ETH/UCY literature [13], confirming that the architecture provides a suitable controlled baseline within the single-fold evaluation scope of this study. To provide an initial indication of cross-scene robustness, an additional exploratory validation experiment was conducted on the independent biwi_hotel fold using the same strictly inductive protocol and the recommended β = 1.0 configuration. The qualitative behavior of Exposure-based weighting remained consistent across scenes, including improved best-of-K multimodal coverage and stable displacement metrics relative to the unweighted baseline. Specifically, on the biwi_hotel fold, ALL ADE improved from 0.517 m to 0.500 m, while ALL FDE@K improved from 0.653 m to 0.539 m under β = 1.0. These results suggest that the observed weighting effect is not specific to the biwi_eth scene, although exhaustive cross-fold benchmarking remains to be conducted in future work.

4.6. Interpretation Within the IPM Framework

Within the broader IPM architecture, the SPTM represents a controlled validation of a single Exposure component. The results show that this component can be operationalized using observation-only data, that it defines a meaningful subset of challenging trajectories, and that it can influence learning dynamics through a simple modification of the training objective. Importantly, the full IPM formulation including Severity modeling and reference-based risk calibration is not instantiated in this section. The present results therefore do not constitute a complete validation of the IPM as a risk model. Rather, they establish that its core operational components can be integrated into a predictive framework in a measurable and methodologically consistent manner. This constrained validation supports the broader hypothesis that risk-aware prioritization can be introduced into trajectory prediction without modifying the underlying predictive architecture, but instead through principled adjustments to the learning objective.

5. Discussion

5.1. Interpretation of Findings

The quantitative findings reported in Section 4.5 are consistent with the intended role of Exposure as a prioritization signal rather than an accuracy optimization target. The key insight is that increased endpoint dispersion in high-Exposure regimes reflects a meaningful model response: inherently less predictable trajectories receive greater representational emphasis, at the cost of long-term displacement precision.

5.2. Positioning Within the IPM Architecture

The SPTM instantiates the IPM Exposure component (Level 2 in Figure 1) under three strict boundary conditions: observation-only operationalization, cost-aware optimization, and inductive evaluation. While the IPM is not fully empirically validated here, the results show that its Exposure component can be operationalized in a measurable and leakage-free manner. Within this scoped validation, three findings stand out. First, the CRIT subset exhibits consistently higher prediction error than the full test set under inductive conditions, confirming that the Exposure proxy identifies a statistically distinct and more challenging motion regime. Second, Exposure-based weighting produces consistent best-of-K coverage improvement (ALL FDE@K: 0.979 → 0.970 m across five seeds), without a general accuracy gain; the effect remains within seed-level variance for mean displacement metrics. Third, the SPTM baseline achieves baseline-class performance within the compact TinyTCN architecture, confirming that the backbone is a suitable controlled reference. As shown in Figure 1, the radar machine learning level (Level 3) and the field trial level (Level 4) are outside the scope of this article. These levels require additional experimental infrastructure, including 77 GHz automotive radar data collection with human vs. clutter separability analysis [30,31] and real-world intersection recordings from proving ground environments such as ZalaZONE [32].

5.3. Limitations

Several limitations should be acknowledged. First, SPTM validation currently covers two ETH/UCY folds (biwi_eth and biwi_hotel) under a controlled inductive protocol; exhaustive cross-fold evaluation remains to be conducted in future work. Second, the TinyTCN does not model social interactions, which may limit performance in highly crowded scenarios. Third, the CRIT threshold τ is fold-specific and may require recalibration across domains. Fourth, Severity modeling incorporating pedestrian vulnerability factors (age, mobility impairment) remains an open direction fully consistent with IPM Equation (2), but is not instantiated here.

6. Conclusions

This paper introduced the Intelligent Pedestrian Model (IPM) as a formal framework for representing pedestrian safety relevance through a reference-normalized scalar risk formulation, decomposed into Exposure and Severity components and interpreted as a population-relative deviation. Building on this framework, the Safety-Prioritized Trajectory Model (SPTM) provided a constrained empirical validation of the Exposure component under a strictly inductive, leakage-free protocol. The results demonstrate that Exposure can be operationalized using observation-only trajectory information and integrated into trajectory prediction through a cost-aware learning objective without modifying the underlying predictive architecture. Under the recommended β = 1.0 configuration, the proposed weighting mechanism consistently improved multimodal best-of-K coverage metrics while maintaining stable displacement accuracy. On the biwi_eth fold, ALL FDE@K improved from 0.979 m to 0.970 m, while on the independent biwi_hotel fold, ALL FDE@K improved from 0.653 m to 0.539 m relative to the unweighted baseline. These results support the interpretation that Exposure-based weighting redistributes predictive capacity toward safety-relevant motion regimes rather than functioning as a global displacement-accuracy optimizer, reflected in consistent improvement of multimodal coverage metrics (best-of-K). The identification of a high-Exposure subset (CRIT) with increased prediction difficulty further supports the interpretation of Exposure as a proxy for motion complexity under inductive conditions. Future work will extend evaluation across all ETH/UCY folds, incorporate social interaction modeling, and investigate full IPM instantiation including Severity calibration and deployment-level evaluation.

Supplementary Materials

The following supporting information can be downloaded at: https://www.mdpi.com/article/10.3390/futuretransp6030108/s1, The complete experimental run registry including biwi_eth fold (5 seeds, β ∈ {0, 0.5, 1.0, 2.0}) and biwi_hotel fold (seed 42, β ∈ {0, 1.0}) result files are provided in Appendix A.10.

Author Contributions

Conceptualization, methodology, software, validation, formal analysis, investigation, data curation, writing—original draft preparation, and visualization were performed by Z.R. Supervision, writing—review and editing, and project administration were carried out by I.L. All authors have read and agreed to the published version of the manuscript.

Funding

This research received no external funding. The APC was funded by Széchenyi István University.

Data Availability Statement

The original contributions presented in this study are included in the article and/or supplementary material. Further inquiries can be directed to the corresponding author.

Conflicts of Interest

The authors declare no conflicts of interest.

Appendix A. Implementation Details

This Appendix provides implementation details sufficient to reproduce the Safety-Prioritized Trajectory Model (SPTM) experiments reported in Section 4. All experiments described in this Appendix were conducted on the biwi_eth fold of the ETH/UCY benchmark under a strictly inductive evaluation protocol. The exploratory biwi_hotel fold validation reported in Section 4.5 follows the same protocol but is not separately detailed here.

Appendix A.1. Training Configuration

All models were trained using a consistent configuration across all experiments. Table A1 summarizes the hyperparameters.
Table A1. Training hyperparameters.
ParameterValue
OptimizerAdam (AdamW in ablation variants; no significant differences observed)
Initial learning rate0.002
Weight decay1 × 10−4
Batch size256
Epochs20
Gradient clippingL2 norm ≤ 1.0
DeviceCPU (CUDA-compatible)
Random seeds{41, 42, 43, 44, 45}
LR schedulingNone

Appendix A.2. Model Architecture (Canonical TinyTCN + Mixture Head)

The canonical model—used for all results reported in Table 2—consists of a residual Temporal Convolutional Network (TCN) encoder followed by a Gaussian mixture density head. Table A2 summarizes the architecture.
Table A2. TinyTCN architecture specification.
ComponentSpecification
Encoder type3-layer Temporal Convolutional Network (TCN)
Dilation factors{1, 2, 4}
Hidden dimension64
Kernel size3
Residual connectionsYes (canonical model)
Dropoutp = 0.1 (canonical model)
PoolingAdaptive average pooling
Output headGaussian Mixture Density Network
Mixture components K5
Covariance structureDiagonal (dimensions modeled independently)
σ parameterizationlog σ (ensures σ > 0 via exp; ε = 1 × 10⁻⁶ for stability)
Prediction horizon Tpree12 timesteps (4.8 s)
Total parameters35,000

Appendix A.3. Input Representation and Normalization

All trajectories are transformed into a local coordinate frame prior to training and evaluation. The last observed position xt0obs is used as the origin; both the observed sequence and the future ground-truth trajectory are translated accordingly. This ensures translation invariance and compatibility with the standard ETH/UCY evaluation protocol without introducing information leakage. No rotation normalization or velocity-based alignment is applied.

Appendix A.4. Dataset and Sequence Construction

The ETH/UCY benchmark provides real-world pedestrian trajectory recordings in bird’s-eye-view format: (frame_id, pedestrian_id, x, y). Sequences are constructed, using a sliding window with stride = 1, independently per pedestrian. Observation length is eight timesteps (3.2 s); the prediction horizon is 12 timesteps (4.8 s). Typical sequence counts for the biwi_eth fold are training of 30,000 sequences, validation of 5400 sequences, and test of 300–400 sequences.

Appendix A.5. Exposure Proxy Computation

A leakage-free Exposure proxy is computed exclusively from the observed trajectory X = {x1, …, xt0obs}. Three kinematic descriptors are derived per trajectory: velocity magnitude (speed s), acceleration magnitude (a), and directional change θ capturing angular instability between consecutive velocity vectors. Each descriptor is summarized as the 90th percentile over the observation window to obtain a robust, noise-resistant scalar.
Two proxy variants are formally defined:
rv0(X) = 1.0 · sp90 + 0.5 · ap90 + 1.0 · θp90 (Proxy v0)
rv1(X) = 0.7 · sp90 + 0.7 · ap90 + 0.6 · θp90 (Proxy v1, canonical)
where sp90 = p90(speed), ap90 = p90(acceleration magnitude), and θp90 = p90(directional change) over the observation window. Proxy v1 was motivated empirically: Proxy v0 populated the CRIT subset disproportionately with high-curvature trajectories; rebalancing toward acceleration-dominated cases yielded more stable endpoint performance.
The raw score is normalized using robust percentile scaling:
rnorm(X) = clip=(r(X) − p05)/(p95 − p05), 0, 1
where p05 and p95 are the 5th and 95th percentiles estimated exclusively from the combined training and validation sets. These bounds are fixed prior to test evaluation; test-set statistics are never used in normalization. The CRIT subset is defined as all test trajectories satisfying rnorm(X) > τ, where τ = 0.7792 is the 90th percentile of the training+validation Exposure distribution (biwi_eth fold, Proxy v1).

Appendix A.6. Training Objective and Loss Formulation

The predictive distributions over future trajectories are modeled as a K-component Gaussian mixture:
p ( Y X ) = k = 1 K π k   N ( Y μ k , Σ k )
A diagonal covariance structure is used, modeling each spatial dimension independently. Standard deviations are parameterized as σk,d = exp(ŝk,d) + ε, where ε = 1 × 10⁻⁶ ensures numerical stability. The base negative log-likelihood loss is:
L nll = l o g k = 1 K π k   N ( Y μ k , Σ k )
Cost-aware sample weighting reallocates gradient emphasis toward high-Exposure trajectories:
w(X) = 1 + β · rnorm(X)
The weighted training objective is:
L SPTM = E X Y w ( X ) l o g p ( Y X )
An entropy regularization term is added to the mixture weights to prevent mode collapse:
L final = L SPTM λ ent   H ( π ) , H ( π ) = k π k l o g π k
The entropy term H(π) encourages balanced utilization of mixture components, mitigating collapse to a single dominant mode.

Appendix A.7. Evaluation Protocol

The evaluation protocol follows the standard leave-one-scene-out strategy on ETH/UCY. All normalization parameters (Exposure percentile bounds, CRIT threshold τ) and all model hyperparameters are determined using training and validation data only. The test set is used exclusively for final evaluation. Experiments are repeated across five random seeds (41–45) controlling weight initialization, data ordering, and stochastic training components. Performance is reported as mean ± standard deviation across seeds.
Metrics are computed separately for the full test set (ALL) and the high-Exposure subset (CRIT, top 10% by rnorm). Best-of-K metrics (ADE@K, FDE@K) use K = 5 trajectories sampled from the mixture, selecting the closest mode to ground truth by final displacement.

Appendix A.8. Reproducibility

Reproducibility is ensured through the following mechanisms:
  • Fixed random seeds ({41–45}) controlling weight initialization, data ordering, and stochastic dropout.
  • Deterministic dataset splits: Scene-level partitioning is fixed; no randomization across seeds.
  • Fixed normalization bounds: Exposure proxy percentiles (p05, p95) and CRIT threshold τ are computed once from the training and validation set and applied unchanged across all seeds.
  • JSON logging: Each run produces a metrics file and a configuration file uniquely identified by fold, β value, K, epoch count, and seed. The complete run registry for the biwi_eth fold is listed in Table A3.
Table A3. Experimental run registry (biwi_eth fold, Proxy v1, inductive protocol, τ = 0.7792).
File NameβKEp.Seeds
metrics_t3plus_v2_biwi_eth_beta0.0_K5_ep20_seed [41–45].json052041–45
metrics_t3plus_v2_biwi_eth_beta1.0_K5_ep20_seed [41–45].json1.052041–45
run_config_v1_inductive_seeded_biwi_eth_beta0_K5_ep20_seed [41–45].json052041–45
run_config_v1_inductive_seeded_biwi_eth_beta1_K5_ep20_seed [41–45].json1.052041–45
Each metrics file contains the following fields: fold, beta, K, epochs, seed, risk_p05, risk_p95_trainval, crit_thr, and per-metric results (ADE, FDE, ADE@K, FDE@K, NLL) for both the ALL and CRIT subsets. Configuration files additionally record all model hyperparameters and training settings as specified in Table A1 and Table A2.

Appendix A.9. Multi-Seed Variance Summary

Table 2 in the main text reports the results for a single representative seed (seed 42) for clarity of presentation. Table A4 below provides the full five-seed mean ± standard deviation for primary metrics at the recommended setting β = 1.0 and the unweighted baseline β = 0, evaluated on the biwi_eth fold. These figures substantiate the seed-level variance claim in Section 4.5 and confirm that the best-of-K improvement is consistent across all seeds.
Table A4. Five-seed mean ± standard deviation for key metrics (biwi_eth fold, Proxy v1, inductive protocol). ALL = full test set; CRIT = top-10% Exposure subset.
βSubsetADE (m)FDE (m)ADE@K (m)FDE@K (m)
0ALL0.930 ± 0.0131.899 ± 0.0310.575 ± 0.0140.979 ± 0.027
0CRIT0.980 ± 0.0181.988 ± 0.044
1.0ALL0.918 ± 0.0121.891 ± 0.0280.553 ± 0.0120.970 ± 0.025
1.0CRIT0.969 ± 0.0211.999 ± 0.0460.577 ± 0.0160.998 ± 0.031
Variance across seeds is comparable between β = 0 and β = 1.0 for all metrics, confirming that cost-aware weighting does not introduce training instability. The primary effect—improvement in best-of-K multimodal coverage (ALL FDE@K: 0.979 → 0.970 m)—is consistent across all five seeds.

Appendix A.10. Supplementary Data Files

The following output files from the Python 3.14.3 training and evaluation pipeline constitute the empirical basis of the results reported in this article and should be submitted as supplementary material alongside the manuscript.
Metrics files (one per run, JSON format):
  • metrics_t3plus_v2_biwi_eth_beta0.0_K5_ep20_seed41.json;
  • metrics_t3plus_v2_biwi_eth_beta1.0_K5_ep20_seed41.json.
Run configuration files (one per seed per β value, JSON format):
  • run_config_v1_inductive_seeded_biwi_eth_beta0_K5_ep20_seed41.json;
  • run_config_v1_inductive_seeded_biwi_eth_beta0_K5_ep20_seed42.json;
  • run_config_v1_inductive_seeded_biwi_eth_beta0_K5_ep20_seed43.json;
  • run_config_v1_inductive_seeded_biwi_eth_beta0_K5_ep20_seed44.json;
  • run_config_v1_inductive_seeded_biwi_eth_beta0_K5_ep20_seed45.json;
  • run_config_v1_inductive_seeded_biwi_eth_beta1_K5_ep20_seed41.json;
  • run_config_v1_inductive_seeded_biwi_eth_beta1_K5_ep20_seed42.json;
  • run_config_v1_inductive_seeded_biwi_eth_beta1_K5_ep20_seed43.json;
  • run_config_v1_inductive_seeded_biwi_eth_beta1_K5_ep20_seed44.json;
  • run_config_v1_inductive_seeded_biwi_eth_beta1_K5_ep20_seed45.json;
  • metrics_v1_inductive_seeded_biwi_hotel_beta0.0_K5_ep20_seed42.json;
  • run_config_v1_inductive_seeded_biwi_hotel_beta0.0_K5_ep20_seed42.json;
  • metrics_v1_inductive_seeded_biwi_hotel_beta1.0_K5_ep20_seed42.json;
  • run_config_v1_inductive_seeded_biwi_hotel_beta1.0_K5_ep20_seed42.json.

References

  1. World Health Organization. Global Status Report on Road Safety 2023; World Health Organization: Geneva, Switzerland, 2023; Available online: https://www.who.int/publications/i/item/9789240086517 (accessed on 8 May 2026).
  2. Eurostat. Road Safety Statistics in the EU-Road Accident Fatalities by Category of Persons Involved [Internet]. 2024. Available online: https://ec.europa.eu/eurostat/ (accessed on 8 May 2026).
  3. European Commission. EU Road Safety Policy Framework 2021–2030—Next Steps Towards “Vision Zero”; European Commission: Brussels, Belgium, 2019; Available online: https://transport.ec.europa.eu/system/files/2021-10/SWD2190283.pdf (accessed on 8 May 2026).
  4. Cicchino, J.B. Effectiveness of Forward Collision Warning and Autonomous Emergency Braking Systems in Reducing Front-to-Rear Crash Rates. Accid. Anal. Prev. 2017, 99, 142–152. [Google Scholar] [CrossRef] [PubMed]
  5. Fildes, B.; Keall, M.; Bos, N.; Lie, A.; Page, Y.; Pastor, C.; Pennisi, L.; Rizzi, M.; Thomas, P.; Tingvall, C. Effectiveness of Low Speed Autonomous Emergency Braking in Real-World Rear-End Crashes. Accid. Anal. Prev. 2015, 81, 24–29. [Google Scholar] [CrossRef]
  6. SAE International. Taxonomy and Definitions for Terms Related to Driving Automation Systems for On-Road Motor Vehicles; SAE International: Warrendale, PA, USA, 2021; Available online: https://www.sae.org/standards/content/j3016_202104/ (accessed on 8 May 2026).
  7. Helbing, D.; Molnár, P. Social Force Model for Pedestrian Dynamics. Phys. Rev. E 1995, 51, 4282–4286. [Google Scholar] [CrossRef]
  8. Alahi, A.; Goel, K.; Ramanathan, V.; Robicquet, A.; Li, F.F.; Savarese, S. Social LSTM: Human Trajectory Prediction in Crowded Spaces. In Proceedings of the 2016 IEEE Conference on Computer Vision and Pattern Recognition (CVPR), Las Vegas, NV, USA, 27–30 June 2016; pp. 961–971. [Google Scholar] [CrossRef]
  9. Ivanovic, B.; Leung, K.; Schmerling, E.; Pavone, M. Multimodal Deep Generative Models for Trajectory Prediction: A Conditional Variational Autoencoder Approach. IEEE Robot. Autom. Lett. 2020, 6, 295–302. [Google Scholar] [CrossRef]
  10. Yin, Z.; Liu, R.; Xiong, Z.; Yuan, Z. Multimodal Transformer Network for Pedestrian Trajectory Prediction. In Proceedings of the International Joint Conference on Artificial Intelligence (IJCAI), Montreal, QC, Canada, 19–27 August 2021; pp. 4121–4127. [Google Scholar] [CrossRef]
  11. Ivanovic, B.; Pavone, M. The Trajectron++: Dynamically-Feasible Trajectory Forecasting with Heterogeneous Data. In Proceedings of the IEEE/CVF International Conference on Computer Vision (ICCV), Seoul, Republic of Korea, 27 October–2 November 2019; pp. 2375–2384. [Google Scholar] [CrossRef]
  12. Gupta, A.; Johnson, J.; Li, F.-F.; Savarese, S.; Alahi, A. Social GAN: Socially Acceptable Trajectories with Generative Adversarial Networks. In Proceedings of the IEEE Conference on Computer Vision and Pattern Recognition (CVPR), Salt Lake City, UT, USA, 18–23 June 2018; pp. 2255–2264. [Google Scholar] [CrossRef]
  13. Rudenko, A.; Palmieri, L.; Arras, K.O. Human Motion Trajectory Prediction: A Survey. Int. J. Robot. Res. 2020, 39, 895–935. [Google Scholar] [CrossRef]
  14. Mo, X.; Huang, Z.; Xing, Y.; Lv, C. Multi-Agent Trajectory Prediction with Heterogeneous Edge-Enhanced Graph Attention Network. IEEE Trans. Intell. Transp. Syst. 2022, 23, 9554–9567. [Google Scholar] [CrossRef]
  15. Zheng, L.; Ismail, K.; Meng, X. Traffic conflict techniques for road safety analysis: Open questions and some insights. Accid. Anal. Prev. 2020, 141, 105530. [Google Scholar] [CrossRef]
  16. Shalev-Shwartz, S.; Shammah, S.; Shashua, A. On a Formal Model of Safe and Scalable Self-Driving Cars. arXiv 2017, arXiv:1708.06374. [Google Scholar]
  17. Rasouli, A.; Kotseruba, I.; Tsotsos, J.K. Understanding Pedestrian Behavior in Complex Traffic Scenes. IEEE Trans. Intell. Veh. 2019, 3, 61–70. [Google Scholar] [CrossRef]
  18. Rasouli, A.; Kotseruba, I.; Kunic, T.; Tsotsos, J.K. PIE: A Large-Scale Dataset and Models for Pedestrian Intention Estimation and Trajectory Prediction. In Proceedings of the IEEE/CVF International Conference on Computer Vision (ICCV), Seoul, Republic of Korea, 27 October–2 November 2019; pp. 6262–6271. [Google Scholar] [CrossRef]
  19. Zhang, S.; Abdel-Aty, M.; Yuan, J.; Li, P. Prediction of Pedestrian Crossing Intentions at Intersections Based on Long Short-Term Memory Recurrent Neural Network. Transp. Res. Rec. 2020, 2674, 57–65. [Google Scholar] [CrossRef]
  20. Chou, F.C.; Lin, T.H.; Cui, H.; Radosavljevic, V.; Nguyen, T.; Huang, T.K.; Niedoba, M.; Schneider, J.; Djuric, N. Predicting Motion of Vulnerable Road Users Using High-Definition Maps and Efficient ConvNets. In Proceedings of the IEEE Intelligent Vehicles Symposium (IV), Las Vegas, NV, USA, 19 October–13 November 2020; pp. 1527–1534. [Google Scholar] [CrossRef]
  21. Kooij, J.F.P.; Flohr, F.; Pool, E.A.I.; Gavrila, D.M. Context-Based Path Prediction for Targets with Switching Dynamics. Int. J. Comput. Vis. 2019, 127, 239–262. [Google Scholar] [CrossRef]
  22. Bharilya, V.; Kumar, N. Machine learning for autonomous vehicle’s trajectory prediction: A comprehensive survey, challenges, and future research directions. Veh. Commun. 2024, 46, 100733. [Google Scholar] [CrossRef]
  23. Rózsás, Z.; Lakatos, I.; Péter, T. Building a Training Dataset for Machine Learning, Radar-Based Pedestrian Detection. Int. J. Automot. Sci. Technol. 2025, 9, 72–76. [Google Scholar] [CrossRef]
  24. Mardani, A.; Jusoh, A.; Nor, K.M.; Khalifah, Z.; Zakwan, N.; Valipour, A. Multiple criteria decision-making techniques and their applications—A review of the literature from 2000 to 2014. Econ. Res.-Ekon. Istraživanja 2015, 28, 516–571. [Google Scholar] [CrossRef]
  25. Triantaphyllou, E. Multi-Criteria Decision Making Methods: A Comparative Study, 1st ed.; Springer: New York, NY, USA, 2000; Available online: https://link.springer.com/book/10.1007/978-1-4757-3157-6 (accessed on 8 May 2026).
  26. Bai, S.; Kolter, J.Z.; Koltun, V. An Empirical Evaluation of Generic Convolutional and Recurrent Networks for Sequence Modeling. arXiv 2018, arXiv:1803.01271. [Google Scholar]
  27. Menghani, G. Efficient Deep Learning: A Survey on Making Deep Learning Models Smaller, Faster, and Better. ACM Comput. Surv. 2023, 55, 259. [Google Scholar] [CrossRef]
  28. Pellegrini, S.; Ess, A.; Schindler, K.; Van Gool, L. You’ll Never Walk Alone: Modeling Social Behavior for Multi-Target Tracking. In Proceedings of the IEEE International Conference on Computer Vision (ICCV), Kyoto, Japan, 29 September–2 October 2009; pp. 261–268. [Google Scholar] [CrossRef]
  29. Pineau, J.; Vincent-Lamarre, P.; Sinha, K.; Lariviere, V.; Beygelzimer, A.; d’Alche-Buc, F.; Fox, E.; Larochelle, H. Improving Reproducibility in Machine Learning Research. J. Mach. Learn. Res. 2021, 22, 7459–7478. [Google Scholar]
  30. Harlow, K.; Jang, H.; Barfoot, T.D.; Kim, A.; Heckman, C. A New Wave in Robotics: Survey on Recent mmWave Radar Applications in Robotics. arXiv 2023, arXiv:2305.01135. [Google Scholar]
  31. Wei, Z.; Zhang, F.; Chang, S.; Liu, Y.; Wu, H.; Feng, Z. mmWave Radar and Vision Fusion for Object Detection in Autonomous Driving: A Review. arXiv 2021, arXiv:2108.03004. [Google Scholar]
  32. ZalaZONE. ZalaZONE Automotive Proving Ground—Technical Documentation [Internet]; ZalaZONE: Zalaegerszeg, Hungary, 2024; Available online: https://zalazone.hu/en/ (accessed on 8 May 2026).
Figure 1. Validation architecture of the Intelligent Pedestrian Model (IPM), from formal foundations to deployment-level validation.
Futuretransp 06 00108 g001
Table 1. Experimental configuration of the Safety-Prioritized Trajectory Model (SPTM).
ComponentConfiguration
DatasetETH/UCY
Split strategyLeave-one-scene-out
Observation length8 timesteps (3.2 s)
Prediction horizon12 timesteps (4.8 s)
Random seeds5 (seeds 41–45)
β values evaluatedETH fold: {0, 0.5, 1.0, 2.0}; exploratory biwi_hotel fold: {0, 1.0}
MetricsADE, FDE, ADE@K, FDE@K (CRIT and ALL subsets)
ArchitectureTinyTCN, K = 5 Gaussian mixture components, ~35,000 parameters
Table 2. SPTM results on the ETH benchmark (seed = 42, inductive protocol). ★ marks the recommended β = 1.0 setting. — indicates metric not computed. ↓ indicates improvement (decrease); ↑ indicates degradation (increase); ✓ indicates expected behavior confirmed. ADE: Average Displacement Error; FDE: Final Displacement Error; NLL: negative log-likelihood.
ProxyβSubsetADE (m)FDE (m)ADE@K (m)FDE@K (m)NLLNote
v00ALL0.9301.8800.5750.98226.195baseline
v00CRIT0.9801.970CRIT > ALL ✓
v00.5ALL0.9180.5430.926ADE ↓ cover ↑
v0 ★1.0ALL0.910best ALL ADE ↓
v0 ★1.0CRIT0.9692.0110.5800.994ADE ↓ FDE ↑
v02.0ALL0.927↓ over-weighting
v10CRIT0.9771.9640.6081.045ablation ref.
v11.0CRIT0.9722.0230.994pattern robust
Disclaimer/Publisher’s Note: The statements, opinions and data contained in all publications are solely those of the individual author(s) and contributor(s) and not of MDPI and/or the editor(s). MDPI and/or the editor(s) disclaim responsibility for any injury to people or property resulting from any ideas, methods, instructions or products referred to in the content.