Article

Measuring the Impact of Recovery Resource Delay on Traffic Incident Management Clearance Times

by
Myles W. Overall
1,*,
Justin Mukai
1,
Rahul Suryakant Sakhare
1,
Jairaj Desai
1,
Hillary Lowther
2 and
Darcy M. Bullock
1
1
Lyles School of Civil and Construction Engineering, Purdue University, West Lafayette, IN 47906, USA
2
Freeway Operations Engineer, Indiana Department of Transportation, 8620 E 21st St., Indianapolis, IN 46219, USA
*
Author to whom correspondence should be addressed.
Future Transp. 2025, 5(4), 171; https://doi.org/10.3390/futuretransp5040171
Submission received: 25 September 2025 / Revised: 27 October 2025 / Accepted: 4 November 2025 / Published: 10 November 2025

Abstract

Traffic incident management (TIM) practices have been widely demonstrated to reduce congestion and secondary crashes. TIM performance measures have evolved over the years and have been a critical tool for agencies to benchmark their operations and identify opportunity for improvement. This paper discusses how the deployment of incident resources can be tracked to improve the fidelity of those performance measures to help guide their TIM program management. Specifically, the paper focuses on integrating a new TIM reference point that identifies when all necessary recovery resources are on scene (T4,ANRR). The value of this reference point is explained through four detailed case studies, and the ability to tabulate this value at scale is demonstrated for 128 incidents. Subsequently, statistics from 128 incidents are presented. Median recovery resource mobilization time for car crashes, semi crashes, car fires, and semi fires were 32, 42, 45, and 66 min, respectively. However, the upper quartile values for those same types of incidents increased to 55, 66, 69, and 105 min, respectively. Of particular note, the paper demonstrates the importance of careful proactive planning for response resources on incidents involving large vehicles that require significant recovery resources and how those response times extend incident clearance times. Tracking T4,ANRR is a first step toward identifying training and perhaps incentive programs to mitigate delays in obtaining all of the needed recovery resources on scene.

1. Introduction

Secondary crashes, associated with queued traffic, are a national concern. Traffic incident management (TIM), the coordination of multiple stakeholders involved in incident response, is widely viewed as an important tool for reducing secondary crashes. According to the National Highway Traffic Safety Administration (NHTSA), 42,514 people were killed in motor vehicle crashes in the year 2022 alone [1]. Roadway fatalities have increased in the last decade. Nationwide, police reported motor vehicle traffic crashes totaled 5,930,496 in 2022 [2]. Of this total, 39,221 were fatal crashes, 1,664,598 were injury-related crashes, and 4,226,677 were property damage only. NHTSA estimates the economic cost of traffic crashes at USD 340 billion in 2019 [2].
Incidents, particularly on interstates, can have a significant impact on mobility and in many cases can result in secondary crashes occurring upstream of the incident in or at the back of the queued traffic, which can greatly increase the duration of incidents and congestion [3,4,5,6]. A three-year study of interstate crashes showed that the crash rate during congested traffic conditions on Indiana’s interstates was 24 times higher than the crash rate under uncongested conditions [7]. Figure 1 shows cumulative weekly crashes by year across the Indiana interstate system as reported by law enforcement agencies through the Automated Reporting Information Exchange System (ARIES) and then curated to remove crashes that occurs on entry ramps and crashes where a location cannot be determined. Not all of these are major incidents, and this does not include all vehicle crashes and fires, but there is clearly a large number of interstate incidents that highlights the importance of TIM practices and training for first responders.
This paper is structured to first provide a background on the current TIM literature, with particular focus on incident clearance improvements and secondary crashes. The next section highlights the Federal Highway Administration (FHWA) TIM event sequence timeline and introduces a new performance metric designed to track the arrival time of recovery resources on scene. A repository of after-action reports is then presented, followed by several case studies illustrating the range of incident types analyzed in this study. Finally, the paper discusses the findings from 128 after-action reviews and identifies key trends and implications for improving incident response and recovery operations.

2. Background

Motorists involved in roadside incidents and first responders are exposed to significant traffic risks. In 2024, 46 emergency responder struck-by deaths occurred within the United States [8]. While studies have been conducted regarding struck-by crashes and their contributing factors [9,10,11], reducing the total incident time, therefore reducing the exposure time, is where some opportunities for improvement exist. There is a broad consensus that it is important to engage all partners such as public safety, transportation, towing companies, etc., to ensure the safety of both those at the scene and queued traffic [12,13].
Safety at the incident scene is important, while at the same time clearing and restoring traffic as soon and as safely as possible is also important to reduce secondary crashes. Safety service patrol programs can also reduce incident clearance times [14,15,16,17,18,19]. In general, safety service patrol programs are very effective at mitigating the impact of minor crashes and disabled vehicles, but larger events involving major crashes or fire require considerable resources and careful coordination to ensure those resources arrive at the incident in a timely manner. In those cases that require more advanced recovery resources such as front-end loaders, garbage haul bins, large rotator trucks, or hazardous material responses, it is important to track when those resources arrive on scene because they typically directly influence when the recovery and road clearance will be completed. Furthermore, previous studies have shown that strong TIM programs have significantly reduced incident clearance time [20], while other characteristics like weather, time, location, or type of incident can have a strong effect on the range of the incident recovery time [21,22,23,24,25,26,27].

3. Research Objective

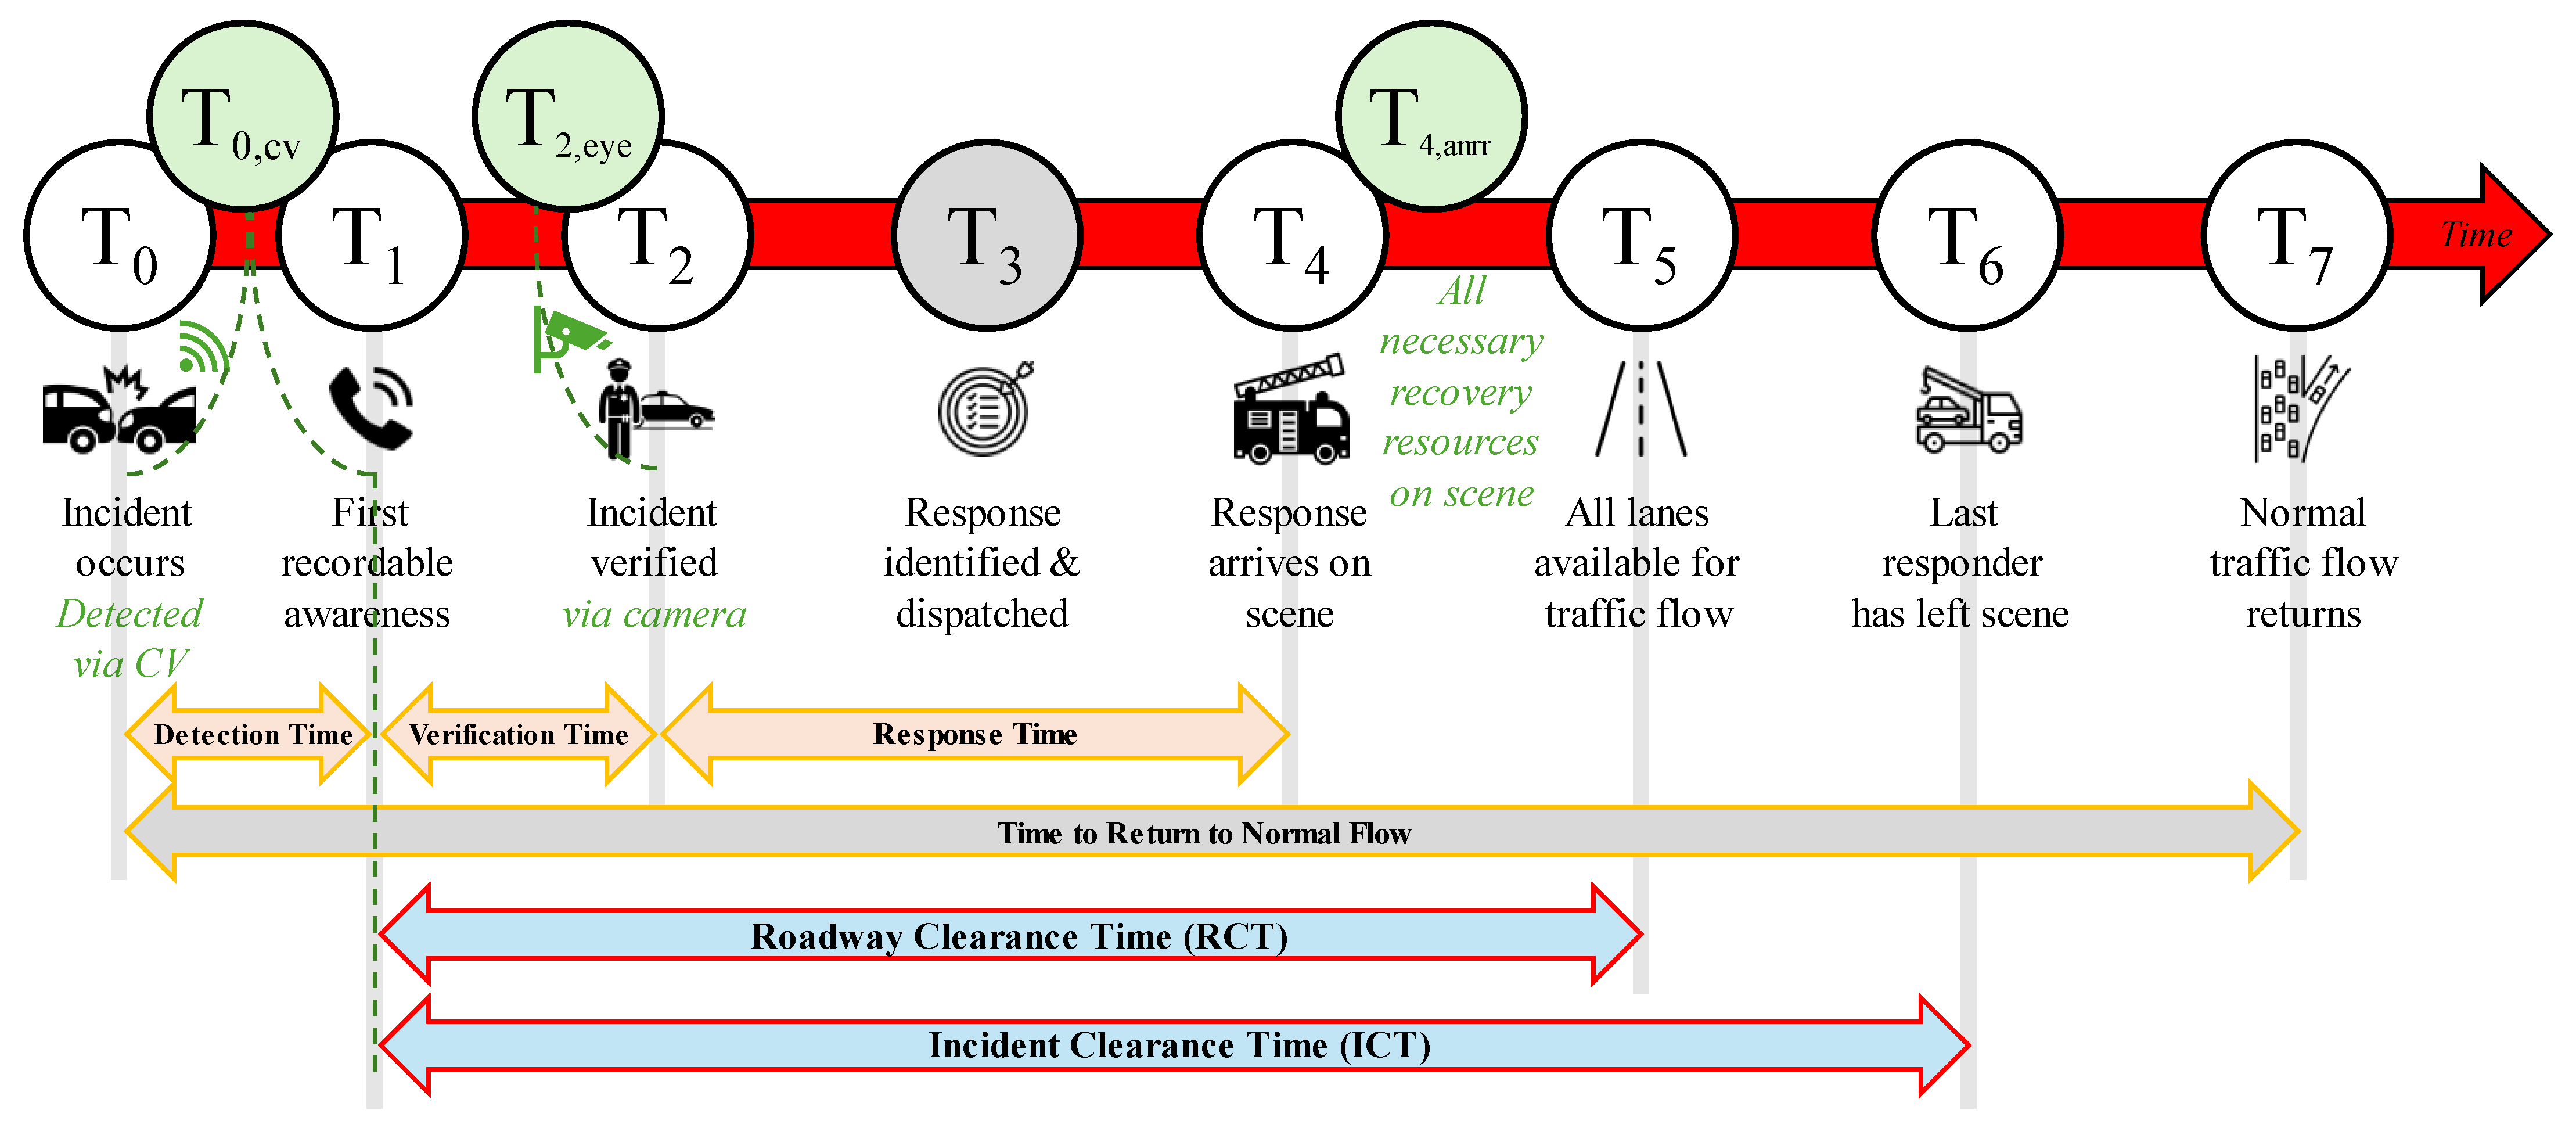
The objective of this paper is to introduce a new TIM reference point that identifies when all necessary recovery resources are on scene (T4,ANRR). Many agencies are particularly effective at minimizing their detection, verification, and response times, but these intervals are usually the smallest intervals along the FHWA TIM timeline (Figure 2), and there is not much opportunity for further improvement in reducing total incident time. An area that does have a significant opportunity for improvement is when responders are waiting for the recovery resources to arrive and start the recovery portion of the incident. If incident commanders have the recovery resources staged a few minutes before the recovery portion can begin, there is often an opportunity for a significant reduction in total incident times. The T4,ANRR reference point fills an existing gap in TIM performance measure tracking by explicitly capturing the time at which specialized assets, such as wreckers, maintenance teams, semi recovery vehicles, and fire debris clean-up crews arrive on scene and the recovery phase can fully begin. While FHWA has established consistent definitions for response, roadway clearance, and incident clearance times, few studies or state-level programs have directly measured or benchmarked the arrival of recovery resources as a discrete event. By quantifying this previously unmeasured component, T4,ANRR enables agencies to identify bottlenecks in the mobilization of specialized resources, evaluate interagency coordination, and better communicate operational needs to stakeholders. The premise of introducing the T4,ANRR metric is quite simple: what gets measured gets done.

4. Traffic Incident Management Event Sequence

The FHWA has established a standardized timeline to promote consistency and clarity in TIM practices across agencies. Figure 2 is a modified version of the FHWA TIM timeline with the addition of three reference points highlighted in green. This timeline is a valuable tool for articulating the various phases of an incident and calculating important performance measures. Currently, the FHWA has defined eight reference points within the TIM event sequence, which are termed as follows:
  • T0—time at which incident actually occurs;
  • T1—time of first recordable awareness of incident by a responsible agency;
  • T2—time at which incident is verified;
  • T3—time at which required response for the incident is identified and dispatched;
  • T4—time at which response arrives on scene;
  • T5—time of first confirmation that all lanes are available for traffic flow;
  • T6—time at which the last responder has left the scene;
  • T7—time at which traffic flow returns to normal.
These reference points can then be used to determine the following event intervals and performance measures:
  • Detection Time (DT): The time from when the incident occurs (T0) to when it is reported (T1).
  • Verification Time (VT): The time when the incident was reported (T1) to when it was verified (T2).
  • Response Time (RT): The time from verification (T2) to the arrival of responders (T4).
  • Roadway Clearance Time (RCT): The time from the initial detection (T1) to all the travel lanes reopening (T5).
  • Incident Clearance Time (ICT): The time from the initial detection (T1) to when all responders have left the scene (T6).
  • Time to Return to Normal Flow: The time from when the incident occurs (T0) to when traffic conditions return to normal flow (T7).
These standardized reference points and intervals allow agencies to perform further analysis of incidents to determine where opportunities for improvement may be present.

Improving the Fidelity of FHWA TIM Reference Points

In general, it is very difficult to identify the exact time at which the incident occurred, i.e., T0 time. While crash reports can record the time of incident, the accuracy of when the incident occurred is determined by what was reported by the officer on scene. Furthermore, if the incident does not warrant a crash report, a good example being vehicle fires, the need to gather additional ways to determine when the incident occurred is important. Connected vehicles (CVs) have been proposed as a source of identifying the initial traffic disruption as a good indicator of when the incident occurred [21]. In Figure 2, T0,cv is shown near the time at which an incident occurred and is often a good proxy for both T0 and T1.
Historically, T2 has often been defined by when dispatch received a call or is concurrent with T4, when public safety arrives on scene and provided factual verification of location and direction of travel. More recently, intelligent transportation system (ITS) cameras can serve that purpose in urban areas with good camera coverage. T2,eye is defined as the time at which a traffic management center (TMC) operator locates the event using the available ITS cameras [28].
Since T4 is often defined as when the first response has arrived on scene and T5 is when all the lanes have opened for traffic flow, there lies a gap between these two reference points where opportunities for improvement may be present. While first responders like police, fire, and emergency medical services (EMSs) can arrive on scene within a few minutes of the incident occurring, the arrival of the recovery vehicles, front-end loaders, garbage haulers, and specialized hazard material personnel often occur later. Many of these resources often come from outside agencies that are not dispatched concurrently with public safety to incidents. These recovery resources are usually dispatched once the on-scene incident commander identifies the required recovery resources and then they are requested through a dispatcher. While some recovery resources may be able to respond within several minutes as well, the time between when they were dispatched and when the responders initially arrived on scene can be where opportunities exist to decrease the total incident time.
The introduction of a new reference point, All Necessary Recovery Resources on Scene (T4,ANRR), can allow agencies to document when all necessary recovery resources are on scene. With this addition, we also add a new summary interval, the Recovery Resource Mobilization Time (RRMT), calculated as T4,ANRR–T4. This RRMT value provides an estimate of the response delay where there may be opportunity to improve with either training or perhaps incentive programs. The following sections describe a repository of incidents, a detailed analysis of four incidents, and subsequent calculation of the incident clearance times defined by FHWA, as well as the new RRMT, for 128 interstate incidents involving cars and semi-trucks.

5. Repository of After-Actions

Over the last 9 years, the research team has completed after-action reports for over 300 incidents along Indiana roadways, allowing for the creation of a repository of these reports. Incidents ranging from single car crashes that are a few minutes in length, several vehicle fires that may close the roadway for several hours, and even weather events that impact roadways like winter weather, heavy rainstorms, and flooding are some of the reports that have been completed. To conduct further analysis of the performance metrics listed above, the after-action reports were grouped into categories of a car crash, semi crash, car fire, semi fire, or other. A link to the repository [29] is as follows: https://docs.lib.purdue.edu/jtrpafteractions/.
For this paper, four after-actions were selected to illustrate the importance of T4,ANRR. Table 1 provides a QR code and link to the after-action videos for further reference, as well as the repository ID. The T4,ANRR is also included as a column. Briefly, these four incidents are summarized below:
  • An overturned semi blocking four lanes for 3 h and 48 min with a total incident duration of 4 h and 31 min. The estimated RRMT was 92 min.
  • A passenger vehicle slide-off with entanglement in a cable median barrier. One lane blocked for 3 h with a total incident duration of 3 h and 12 min. The estimated RRMT was 112 min.
  • A passenger vehicle fire with two lanes blocked for 18 min and a total incident duration of 1 h and 4 min. The estimated RRMT was 34 min.
  • A semi fire with four lanes blocked for 6 h and a total incident duration of 7 h and 46 min. The estimated RRMT was 34 min.
Although not critical for understanding the case studies, viewing these timelapse videos that shows images from the incident can help the reader gain a better understanding of the number of resources required for some of these incidents.

6. Case Studies and Example Extraction of TIM Event Sequence

This section will cover four case studies, including a semi crash, car crash, car fire, and semi fire, respectively. Each case study includes a traffic speed heatmap of the incident showing the impacts it had on traffic. Furthermore, the case studies include several ITS camera images to contextualize the incident. The first case study will show how each TIM event is captured from T0 to T7, which will correlate with some of the ITS camera images. Finally, the end of the section will include the TIM event sequence (Table 2) for all four case studies, as well as the TIM summary intervals (Table 3).

6.1. Case Study 1: Overturned Semi

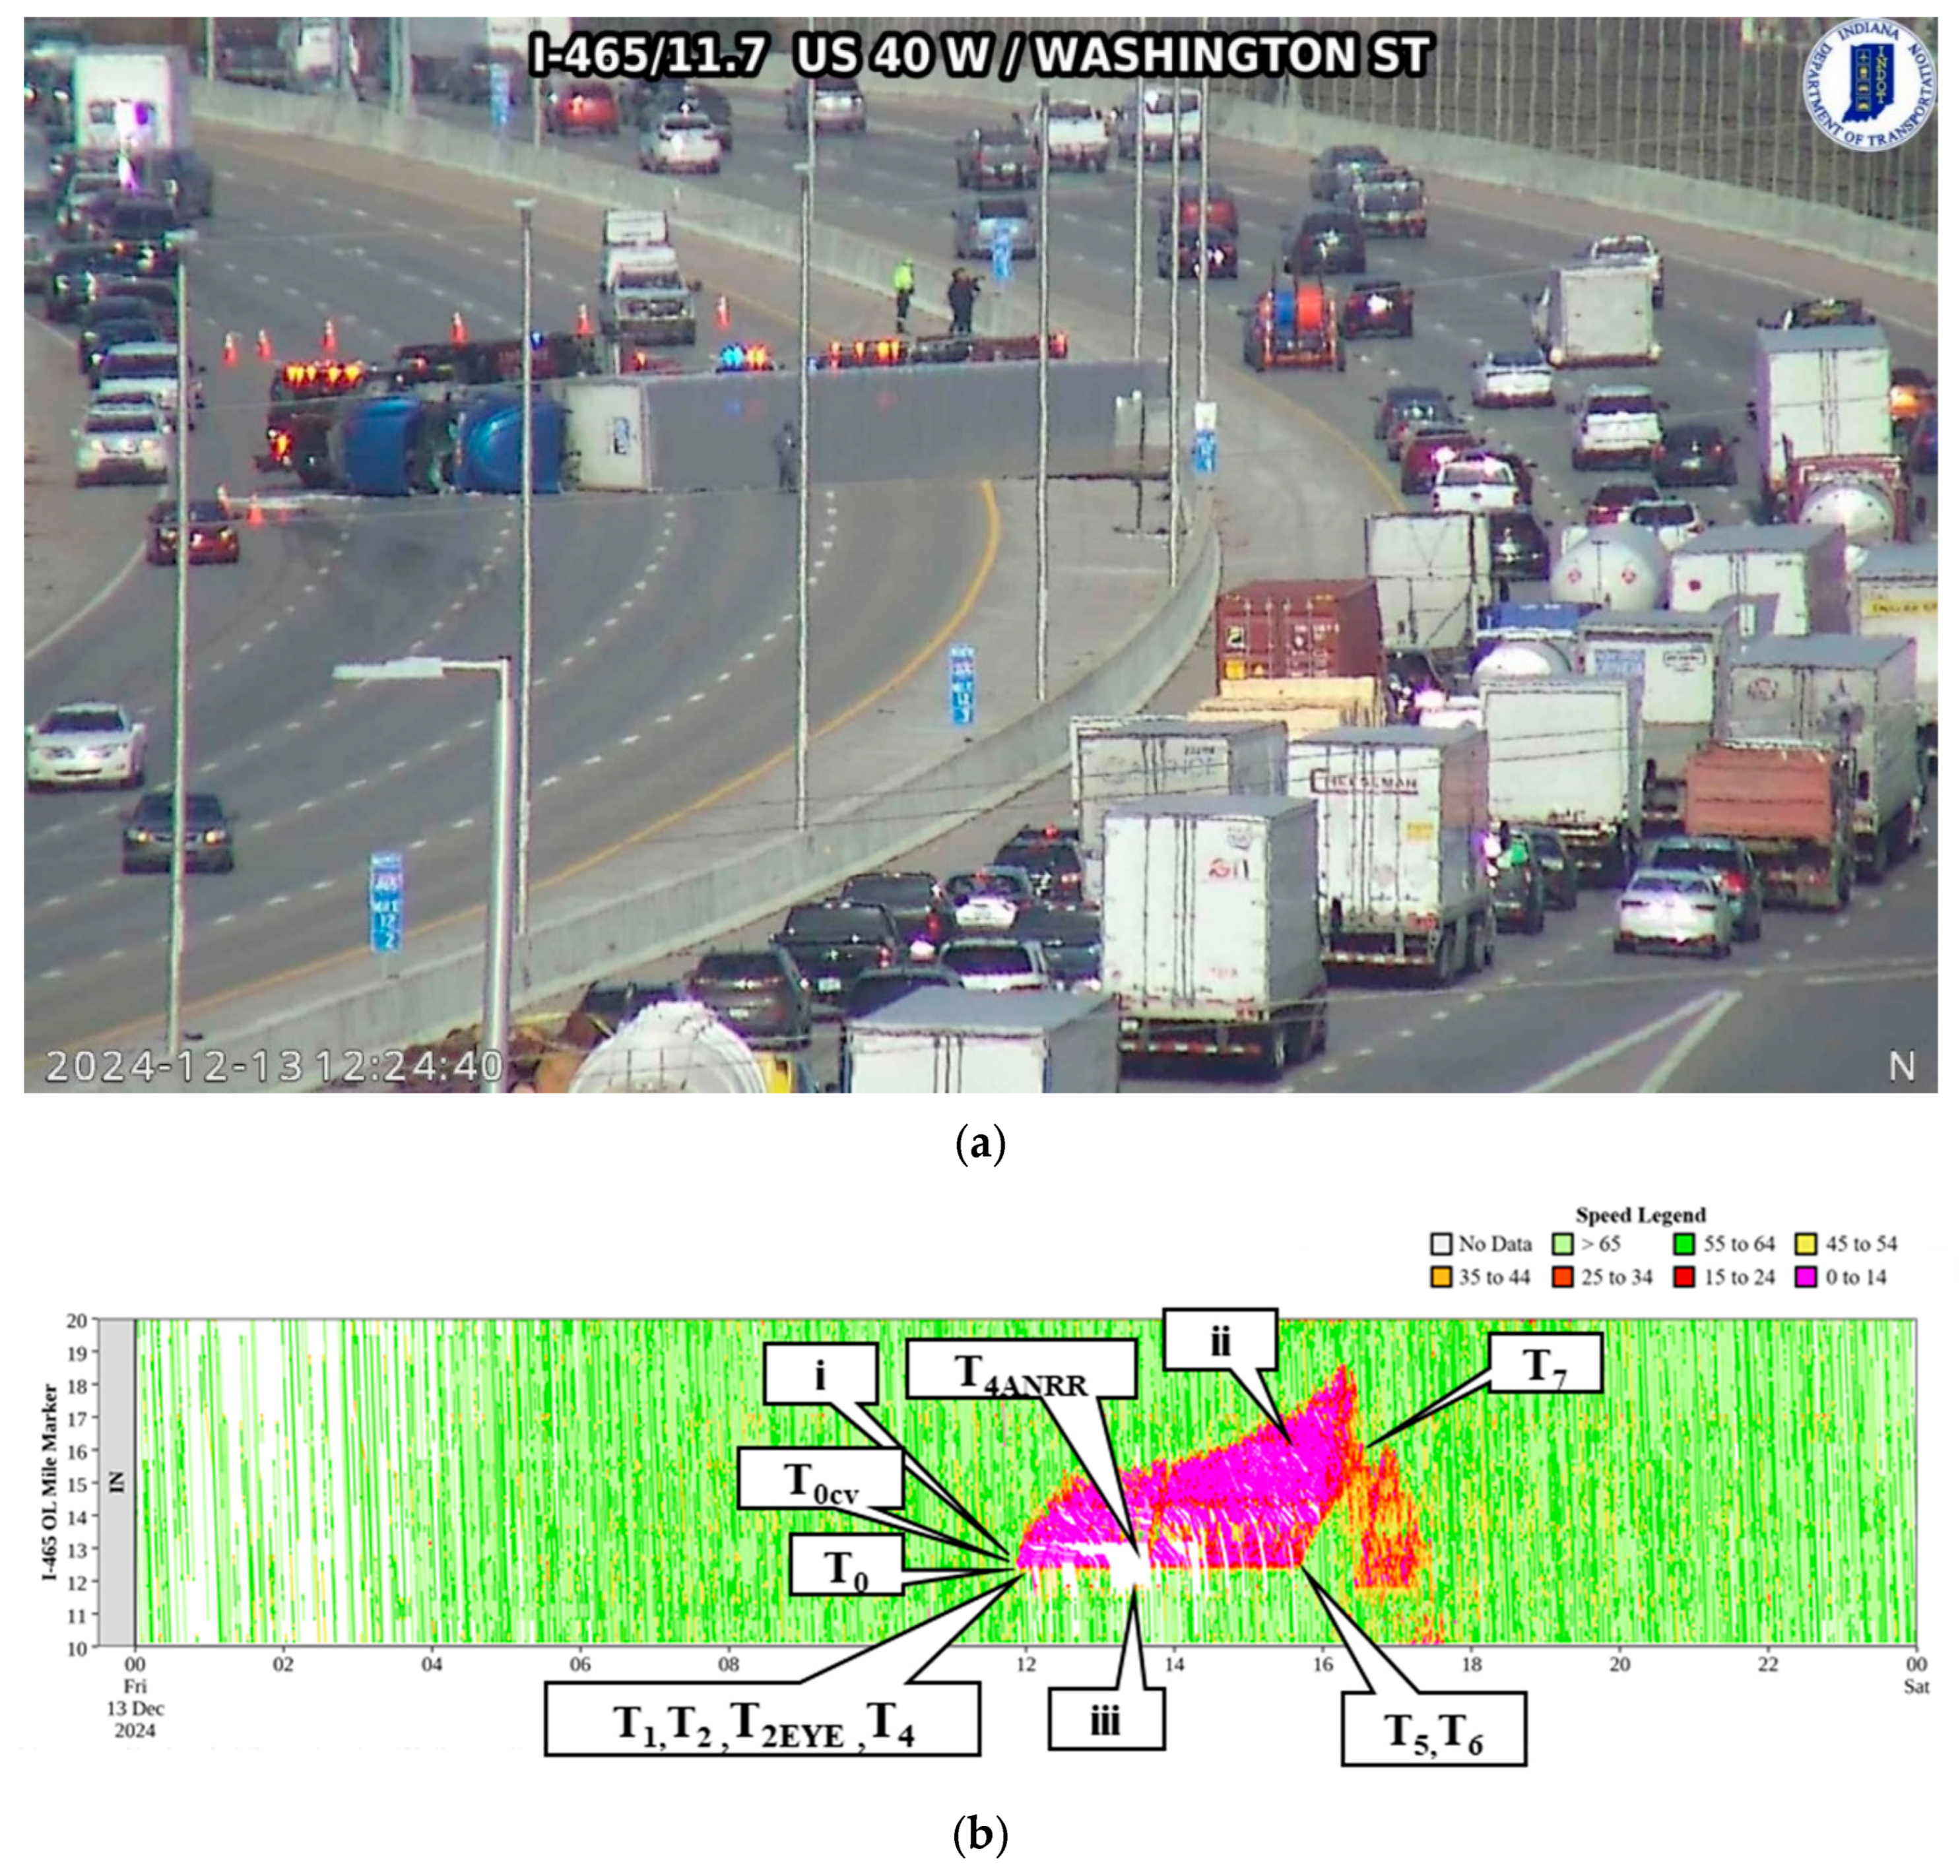
This incident took place on the morning of 13 December 2024 at 11:54 a.m. along the outer loop of I-465 at mile marker 12.5 in Marion County. In this case study, an incident occurred in the outer loop direction at 11:54 AM (T0), where a passenger vehicle was changing lanes when it sideswiped a semi-truck, resulting in the semi hitting the concrete median barrier and knocking over a light pole into the other direction of travel, where the semi then rolled onto its side across three lanes of travel (Figure 3a), as shown in the traffic speed heatmap in Figure 3b.

Example of Extraction of TIM Event Sequence

The heatmap in Figure 3b shows a 10-mile section of I-465 in Indiana from mile marker 10 to 20 with the TIM event sequences called out. In this example, an incident occurred in the outer loop direction at 11:54 a.m. This is verified by the camera image in Figure 3a marked by callout i, which is also the TIM event of T0, also shown in Figure 4b. The incident generates a backwards-forming shockwave, as shown by callout T0 in Figure 4b. Figure 4c shows that crews were on scene within 2 min at 11:56 a.m. (T1 through T4). Figure 4d shows when the last necessary recovery vehicle arrived on scene (T4ANRR). Figure 4e shows the roadway once all the lanes were open (T5) and also when all the responders had left the scene (T6). This is when recovery can be seen in the heatmap with the callouts of T5–T6 in Figure 3b. Finally, Figure 4f provides T7, which is when the roadway returned to normal flow.
For this case study, the need for a third rotator to recover the overturned semi contributed to the delay in the incident clearance. While crews were on scene within 2 min of the crash, the third rotator was not on scene until 92 min later, delaying the recovery. These types of incidents require very specialized recovery resources that may not be readily available in close proximity. Although not ideal, 92 min for a third rotator to arrive is probably a reasonable time for the deployment of three very expensive recovery assets.

6.2. Case Study 2: Passenger Vehicle Slide-off

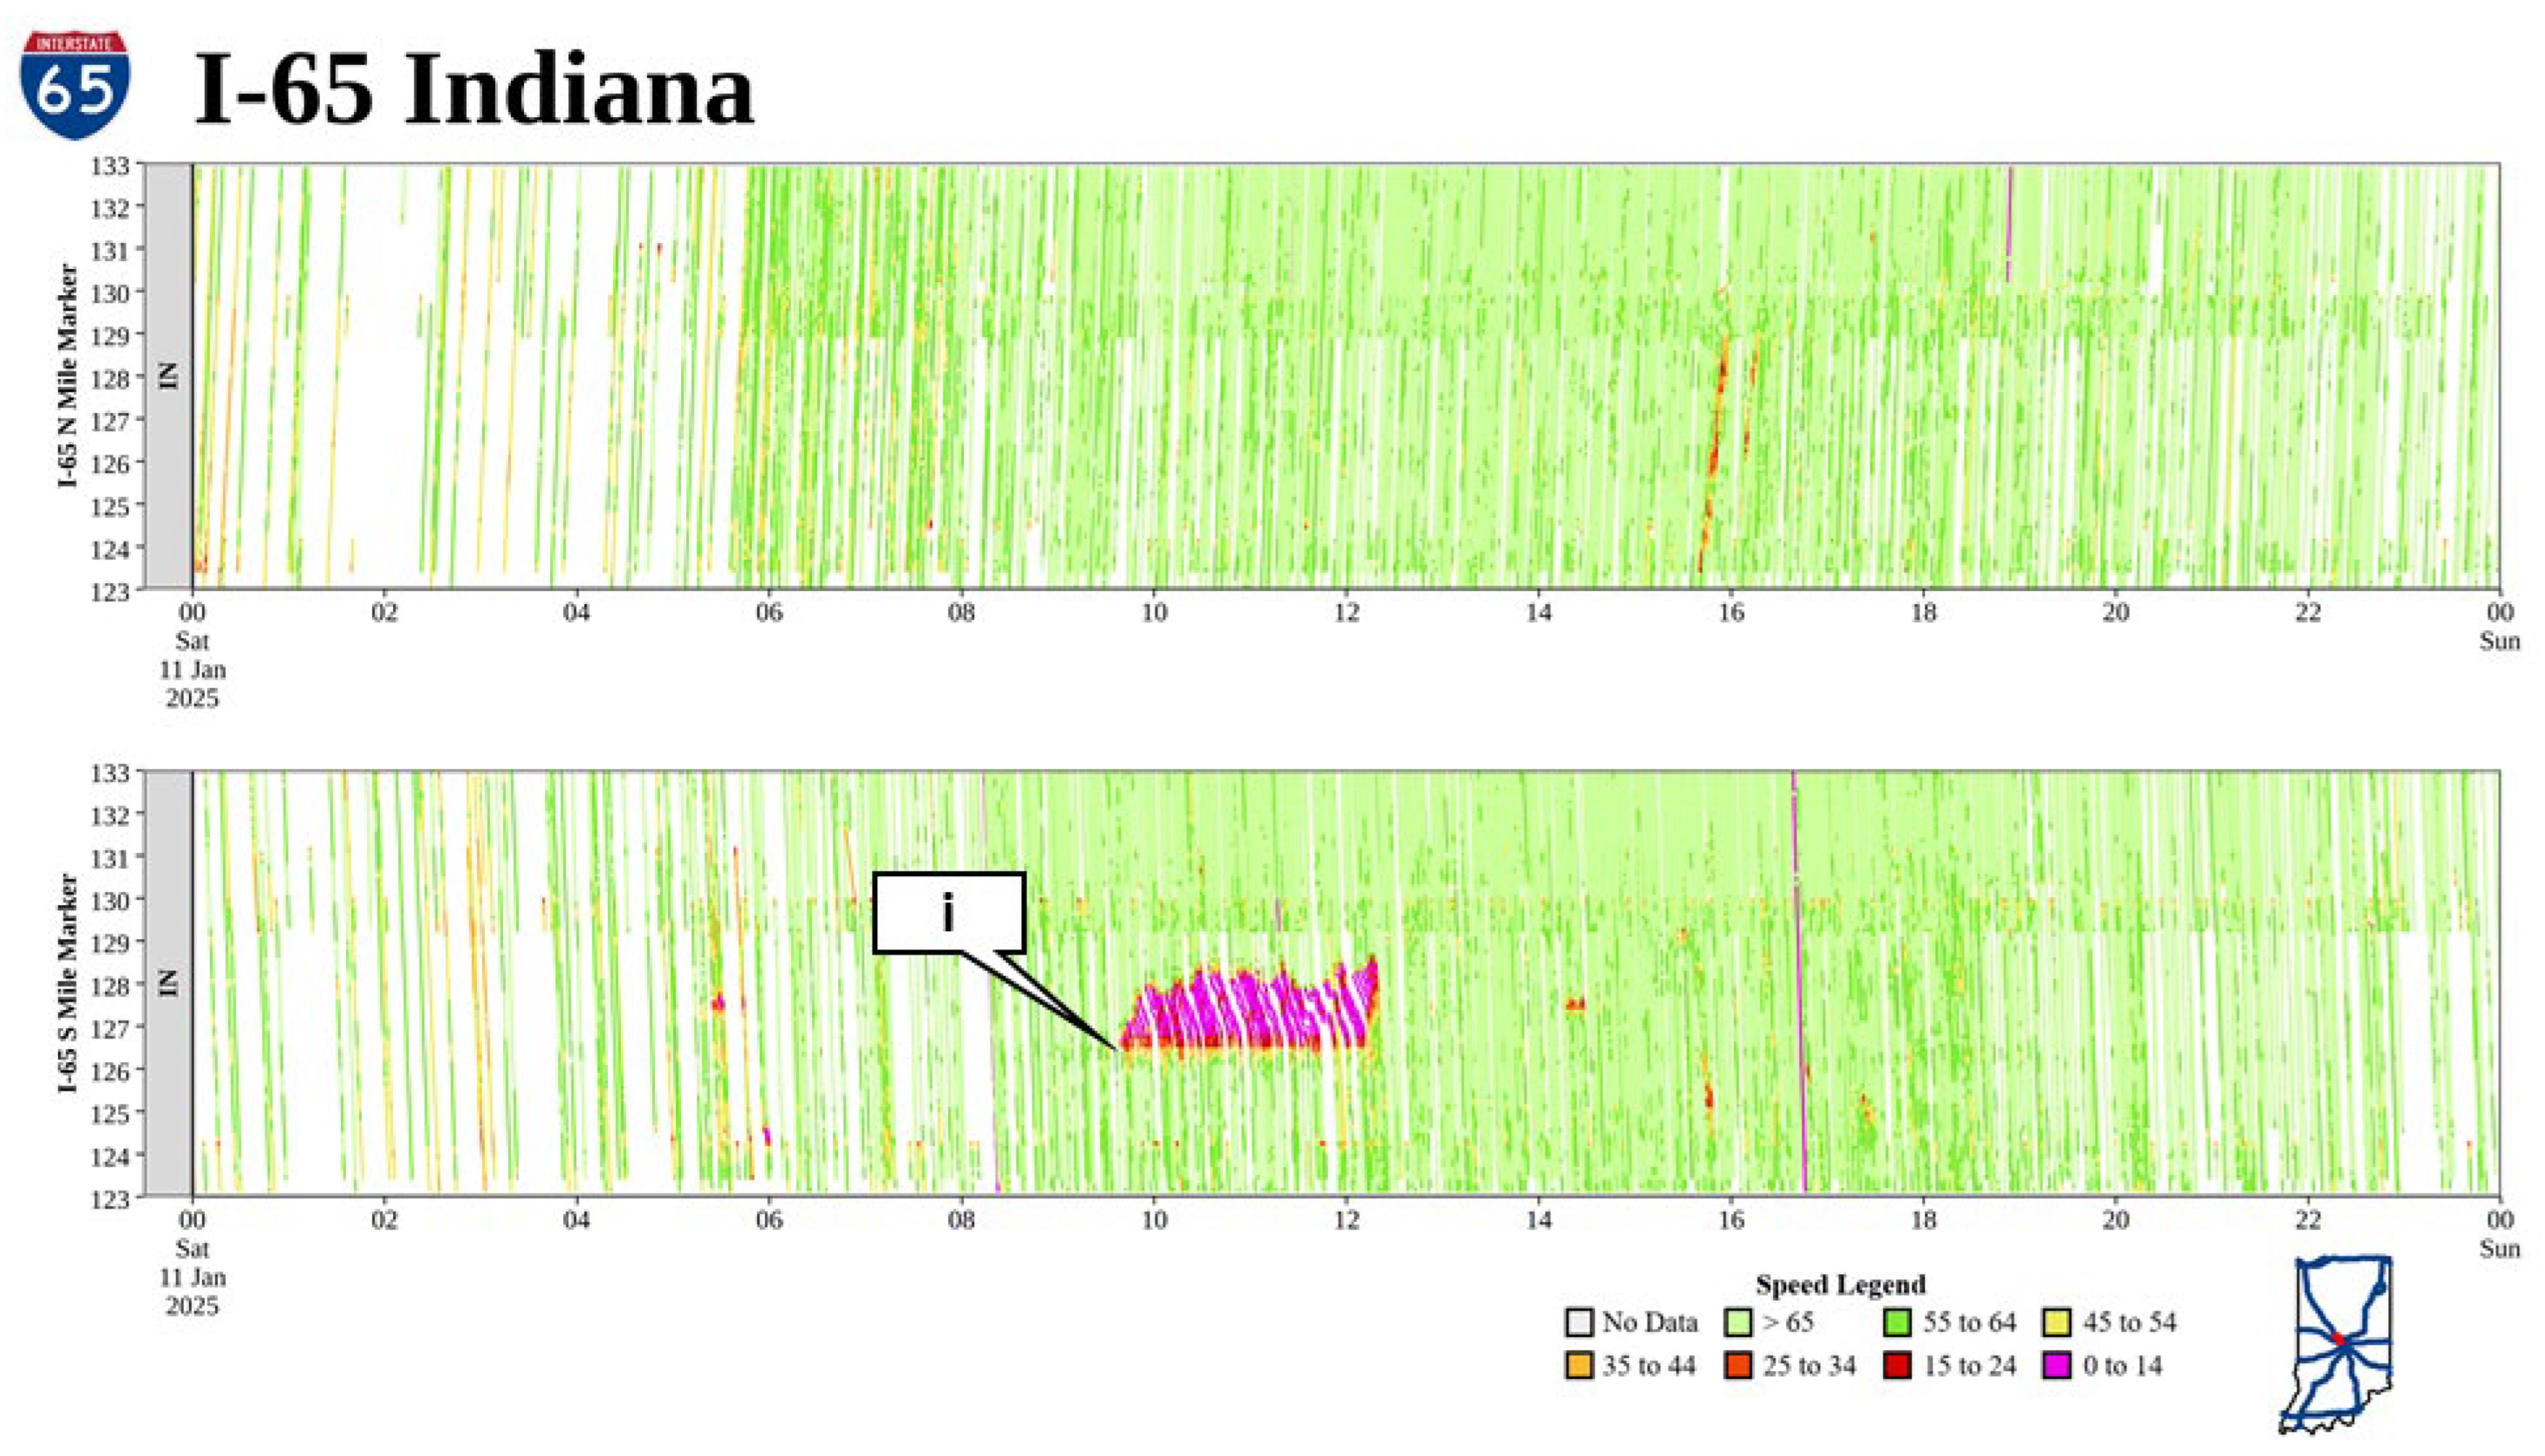
This incident took place on the morning of 11 January 2025 at 9:08 a.m. along southbound I-65 at mile marker 126.6 in Marion County. A single vehicle was traveling southbound in the left lane when a semi-truck began to merge into their lane. To avoid the semi, the driver moved slightly left, where they struck a piece of ice and spun out in the median, hitting the cable barrier shown by callout i in the traffic speed heatmap of the incident in Figure 5.
Figure 6a shows an ITS camera image of when the incident occurred (T0). Figure 6b shows when the incident was verified by the TMC operator (T2 and T2,eye) while also showing the vehicle entangled with the median cable barrier. Figure 6c shows that first responders were on scene (T4) 28 min later at 9:40 a.m. However, due to the vehicle being entangled in the median cable barrier, Indiana Department of Transportation (INDOT) maintenance was required to be called in to release the tension in the cable and allow the recovery process (T4,ANRR), as shown in Figure 6d, taking close to 2 h. At 12:12 p.m. all the travel lanes were reopened (T5) and all the responders had cleared the scene (T6), as shown in Figure 6e. Finally, Figure 6f is when the traffic flow returned to normal (T7).
While the response time was relatively quick for a winter weather-related crash, the opportunity to improve the incident clearance time is when the maintenance crew was called in to relieve the cable tension. As shown in Table 3, 112 min elapsed from when the first response vehicle arrived on scene to when the INDOT maintenance vehicle arrived and the recovery began. Although this seems quite long, this was during a winter weather event, and it is likely the INDOT staff with training were also deployed on plow trucks to assist with the median cable barrier.

6.3. Case Study 3: Passenger Vehicle Fire

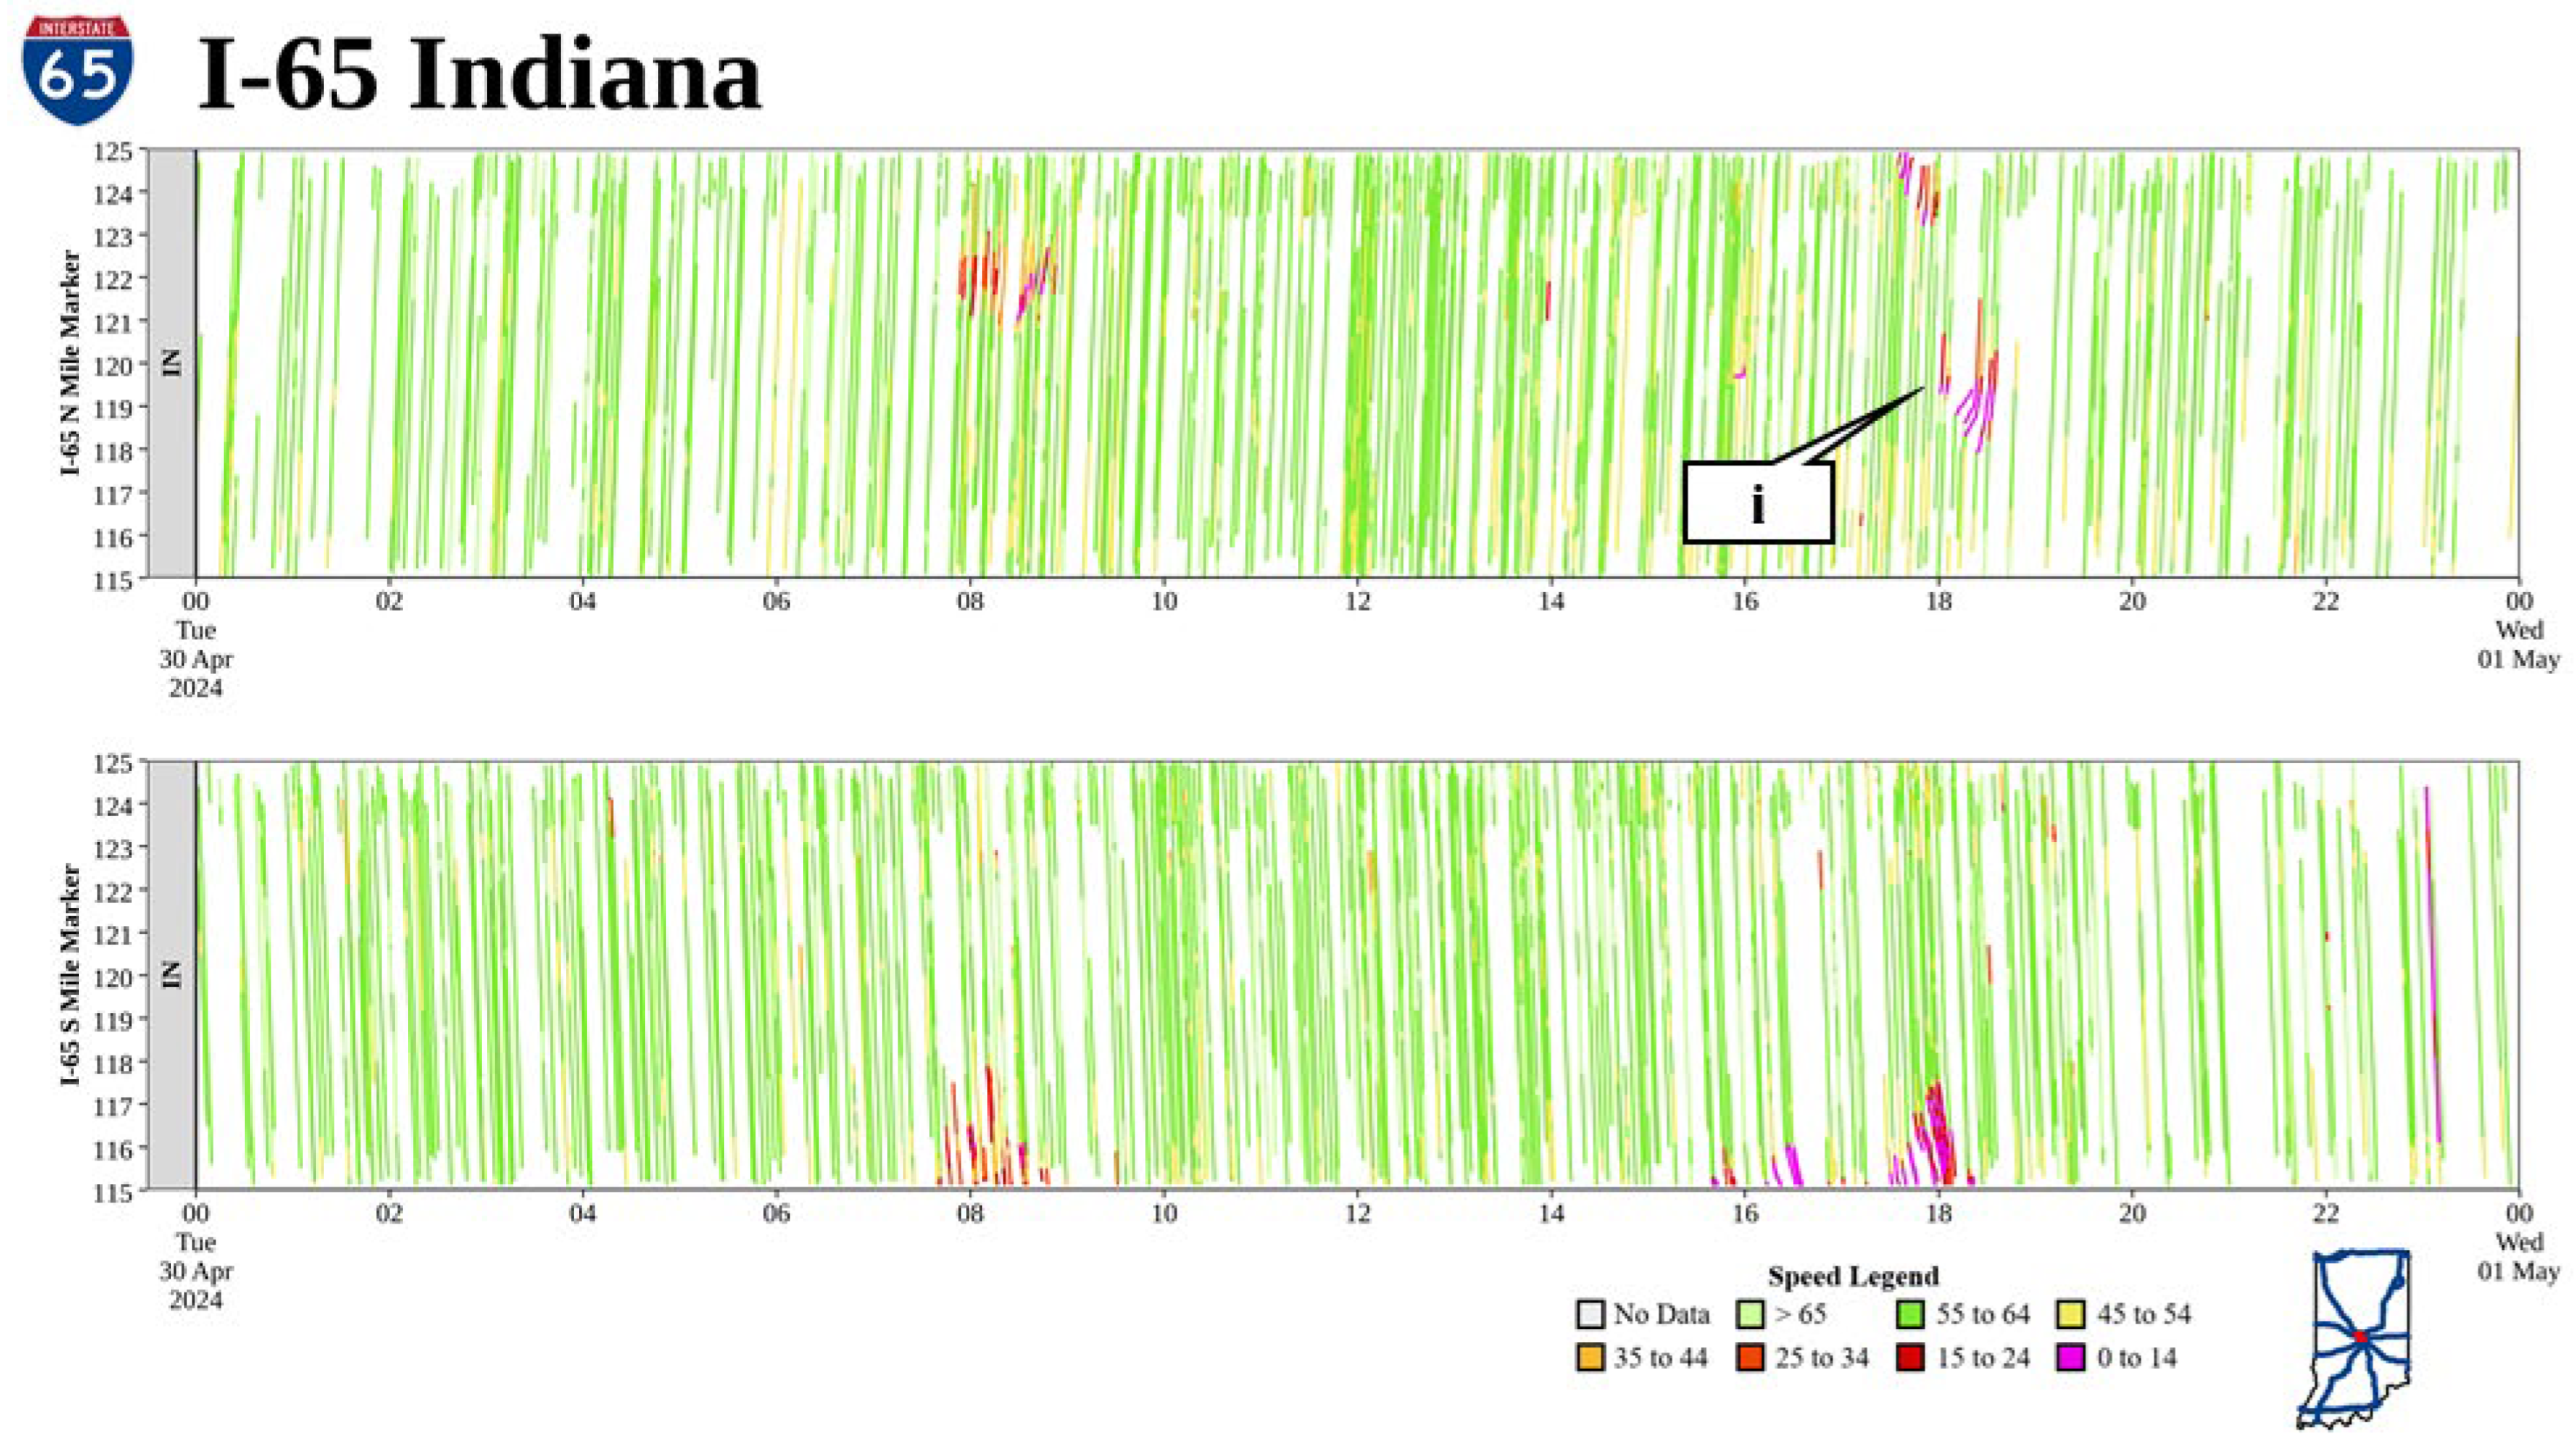
This incident took place on the evening of 30 April 2024 at 6:00 p.m. along northbound I-65 at mile marker 119.4 in Marion County. A single passenger vehicle caught fire on the shoulder before becoming fully engulfed at 6:00 p.m. (T0), as shown in Figure 7 by callout i and in the ITS camera image shown in Figure 8a.
TMC operators moved the camera to the incident at 06:04 p.m. (T2, T2,eye) (Figure 8b) and firefighters were on scene at approximately 6:08 p.m. (T4), as shown in Figure 8c, and had the fire completely extinguished by 06:14 p.m. Additionally, a Hoosier Helper arrived at 6:10 p.m. to assist with the closure of several lanes. All lanes were opened by 6:26 p.m. (T5) (Figure 8e) and an Indiana State Police (ISP) trooper stayed on scene to wait for the wrecker to arrive to recover the vehicle. The arrival of the wrecker occurred at 06:42 p.m. (T4,ANRR) (Figure 8d), 42 min after the start of the fire. The scene was cleared by the ISP trooper and the wrecker (T6) by 07:04 p.m., as shown in Figure 8f.
This case study is unique in that all the lanes (T5) were cleared before all the necessary recovery resources were on scene (T4,ANRR). Due to the fire taking place on the shoulder and not in any of the travel lanes, the vehicle did not have to be moved once the fire was extinguished by the fire department. While there were impacts on traffic, this was mainly when the fire department took several lanes upon arrival. While the entire incident was cleared in just over an hour, there is still opportunity to improve, specifically in the recovery portion. Dispatching the wrecker can be performed almost immediately due to the nature of the fire rendering the vehicle undrivable. As shown in Table 3, there were 34 min from when the first response vehicle arrived on scene to when the wrecker arrived and the recovery began.

6.4. Case Study 4: Semi Fire

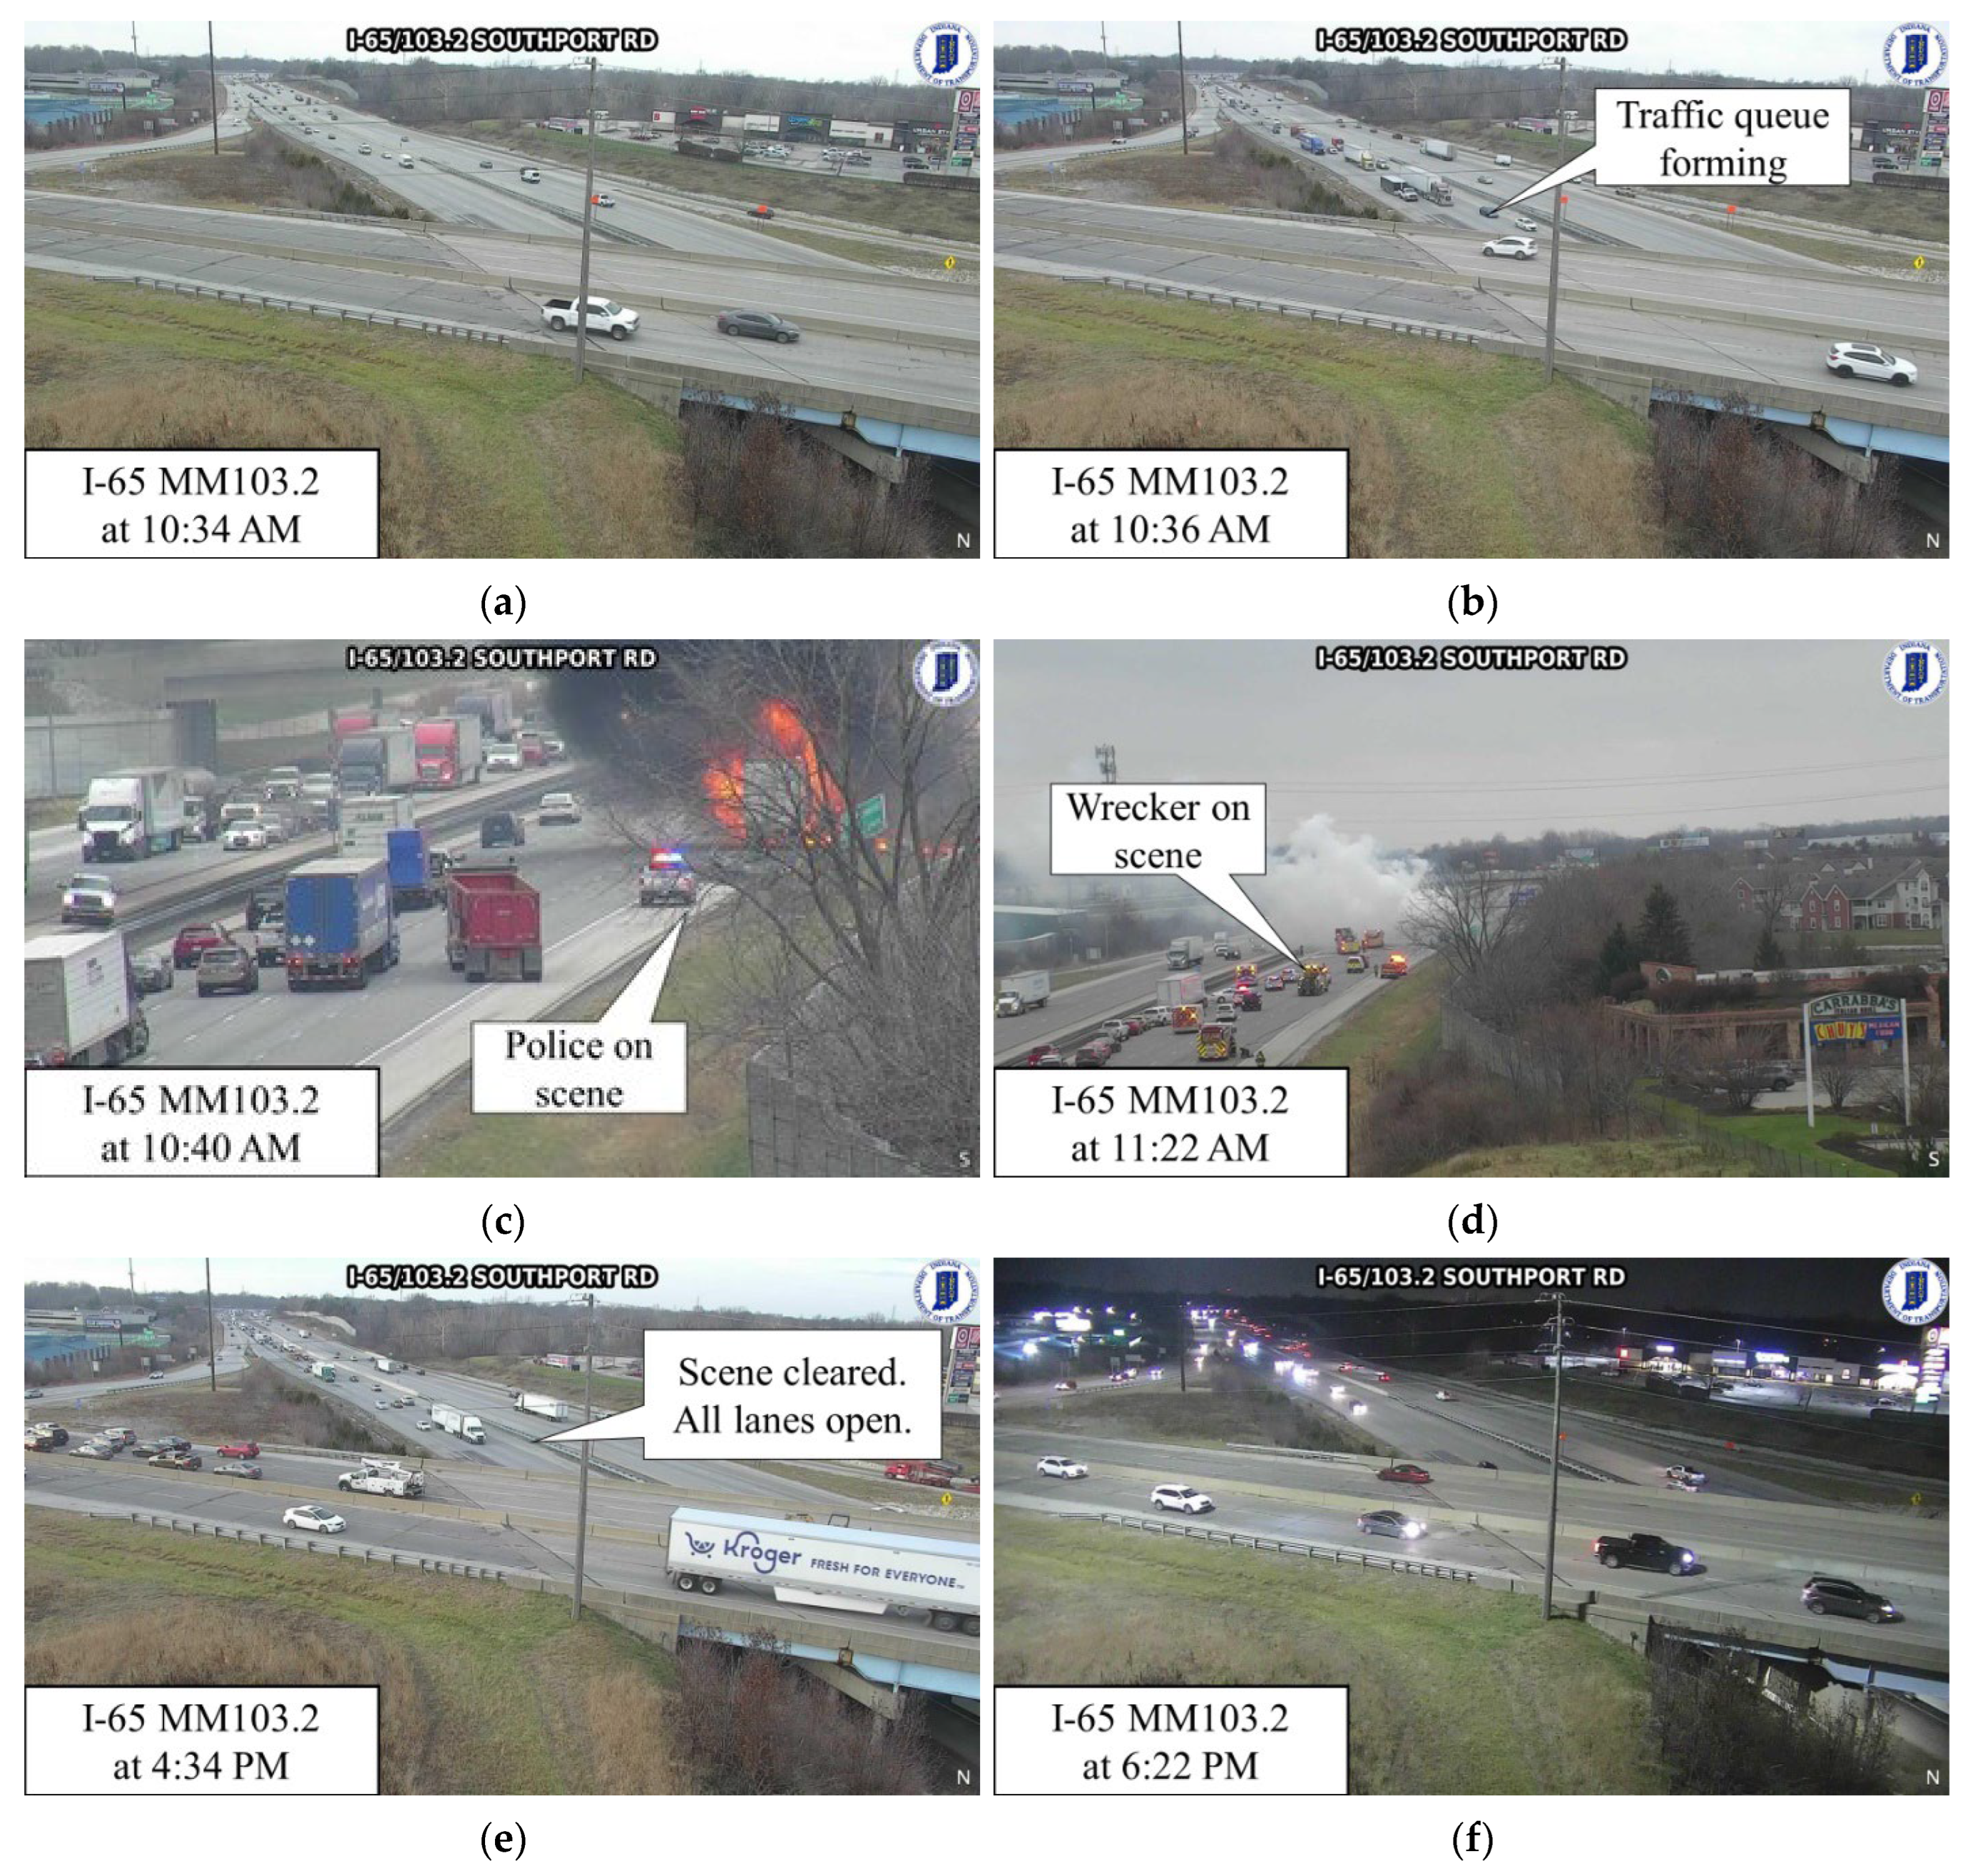
This incident took place in the morning of 19 December 2024 along southbound I-65 at mile marker 102.9 in Marion County. A single semi crashed and then caught fire on the shoulder before becoming fully engulfed at 10:35 a.m. (T0), as shown in Figure 9 by callout i and in the ITS camera image shown in Figure 10a.
The crash report from the incident states that the incident was reported at 10:37 a.m. (T1), which is also when traffic queuing can then be seen on the ITS camera (Figure 10b). At 10:40 a.m., the TMC operators moved the camera to the incident (T2, T2,eye) (Figure 10c) and ISP can be seen responding as well (T4). The next 40 to 50 min involved several fire apparatuses responding to extinguish the fire, as the load that the semi was carrying was all wooden pallets, which gave more fuel to the fire. While the fire was still being extinguished, the recovery vehicles started to arrive on scene (T4,ANRR) to allow the recovery process to begin immediately once the fire department cleared the scene (Figure 10d). Due to the damage to the vehicle and the load, the scene was not cleared until 04:34 p.m. and all the lanes were opened (T5, T6) (Figure 10e). Figure 10f shows when the flow returned to normal (T7), almost 8 h from when the incident started.
While the incident clearance time of this incident was approximately 6 h, this was mainly due to the complexity of the recovery and clean-up due to the severity of the fire. The recovery resource mobilization time was 34 min (Table 3), which allowed the recovery and clean-up process to start immediately after the fire department cleared the scene, limiting the delay of opening the roadway further.

6.5. Case Studies of TIM Event Sequences and Summary Intervals

Table 2 contains the event sequences for all four case studies, starting with the overturned semi (Case Study 1), then the passenger vehicle slide-off (Case Study 2), the passenger vehicle fire (Case Study 3), and finally the semi fire (Case Study 4). Except for T3, all the event times were able to be captured using the crash reports from the incidents (mainly T0, T1, or T2), the ITS camera images (T0, T2, T2,eye,T4, T5, or T6), and connected vehicle data (T0 or T7). While T3 can be an important metric for agencies to measure coordination between dispatch and responding units, it is not used for any of the TIM summary intervals identified by the FHWA or the intervals proposed in this paper, and it is not shown in Table 2.
Table 3 contains the summary intervals for the four case studies. Detection time (T1–T0), verification time (T2–T1), response time (T4–T2), roadway clearance time (RCT) (T5–T1), incident clearance time (ICT) (T6–T1), and time to return to normal flow (T7–T0) all follow the FHWA incident management timeline. TMC verification time (T2eye–T0) and recovery resource mobilization time (T4,ANRR–T4) are both recommended intervals to track, with recovery resource mobilization time being the focus of this paper.

7. Results and Discussion

To illustrate the effectiveness of T4,ANRR, a comprehensive analysis of after-actions from the after-action repository [29] was conducted using 86 after-actions from 2024, as well as 42 after-actions from the first quarter of 2025. Three of the performance measures, or intervals, were used to illustrate the areas where opportunities for improvement may exist with
  • Response time;
  • Recovery resource mobilization time;
  • Incident clearance time.
The four categories of car crash, semi crash, car fire, and semi crash were used to compare the three interval times and are illustrated as a box-and-whisker plot (Figure 11).
For all four categories, car crash, semi crash, car fire, and semi fire, the median response times were all under 5 min. The reason for the semi crash and semi fire having lower response times is that T2 and T4 are usually captured at the same time due to the severity and size of the incidents. Recovery resource mobilization time medians were 32 min, 42 min, 45 min, and 66 min, respectively. The median incident clearance times (ICTs) were 70 min, 140 min, 96 min, and 248 min, respectively. As shown in the box plots, longer recovery resource mobilization times correlate with longer clearance durations for incidents. The numerous outliers highlight significant variation and point to potential opportunities for improving resource deployment by requesting recovery resources earlier in the incident rather than towards the end.
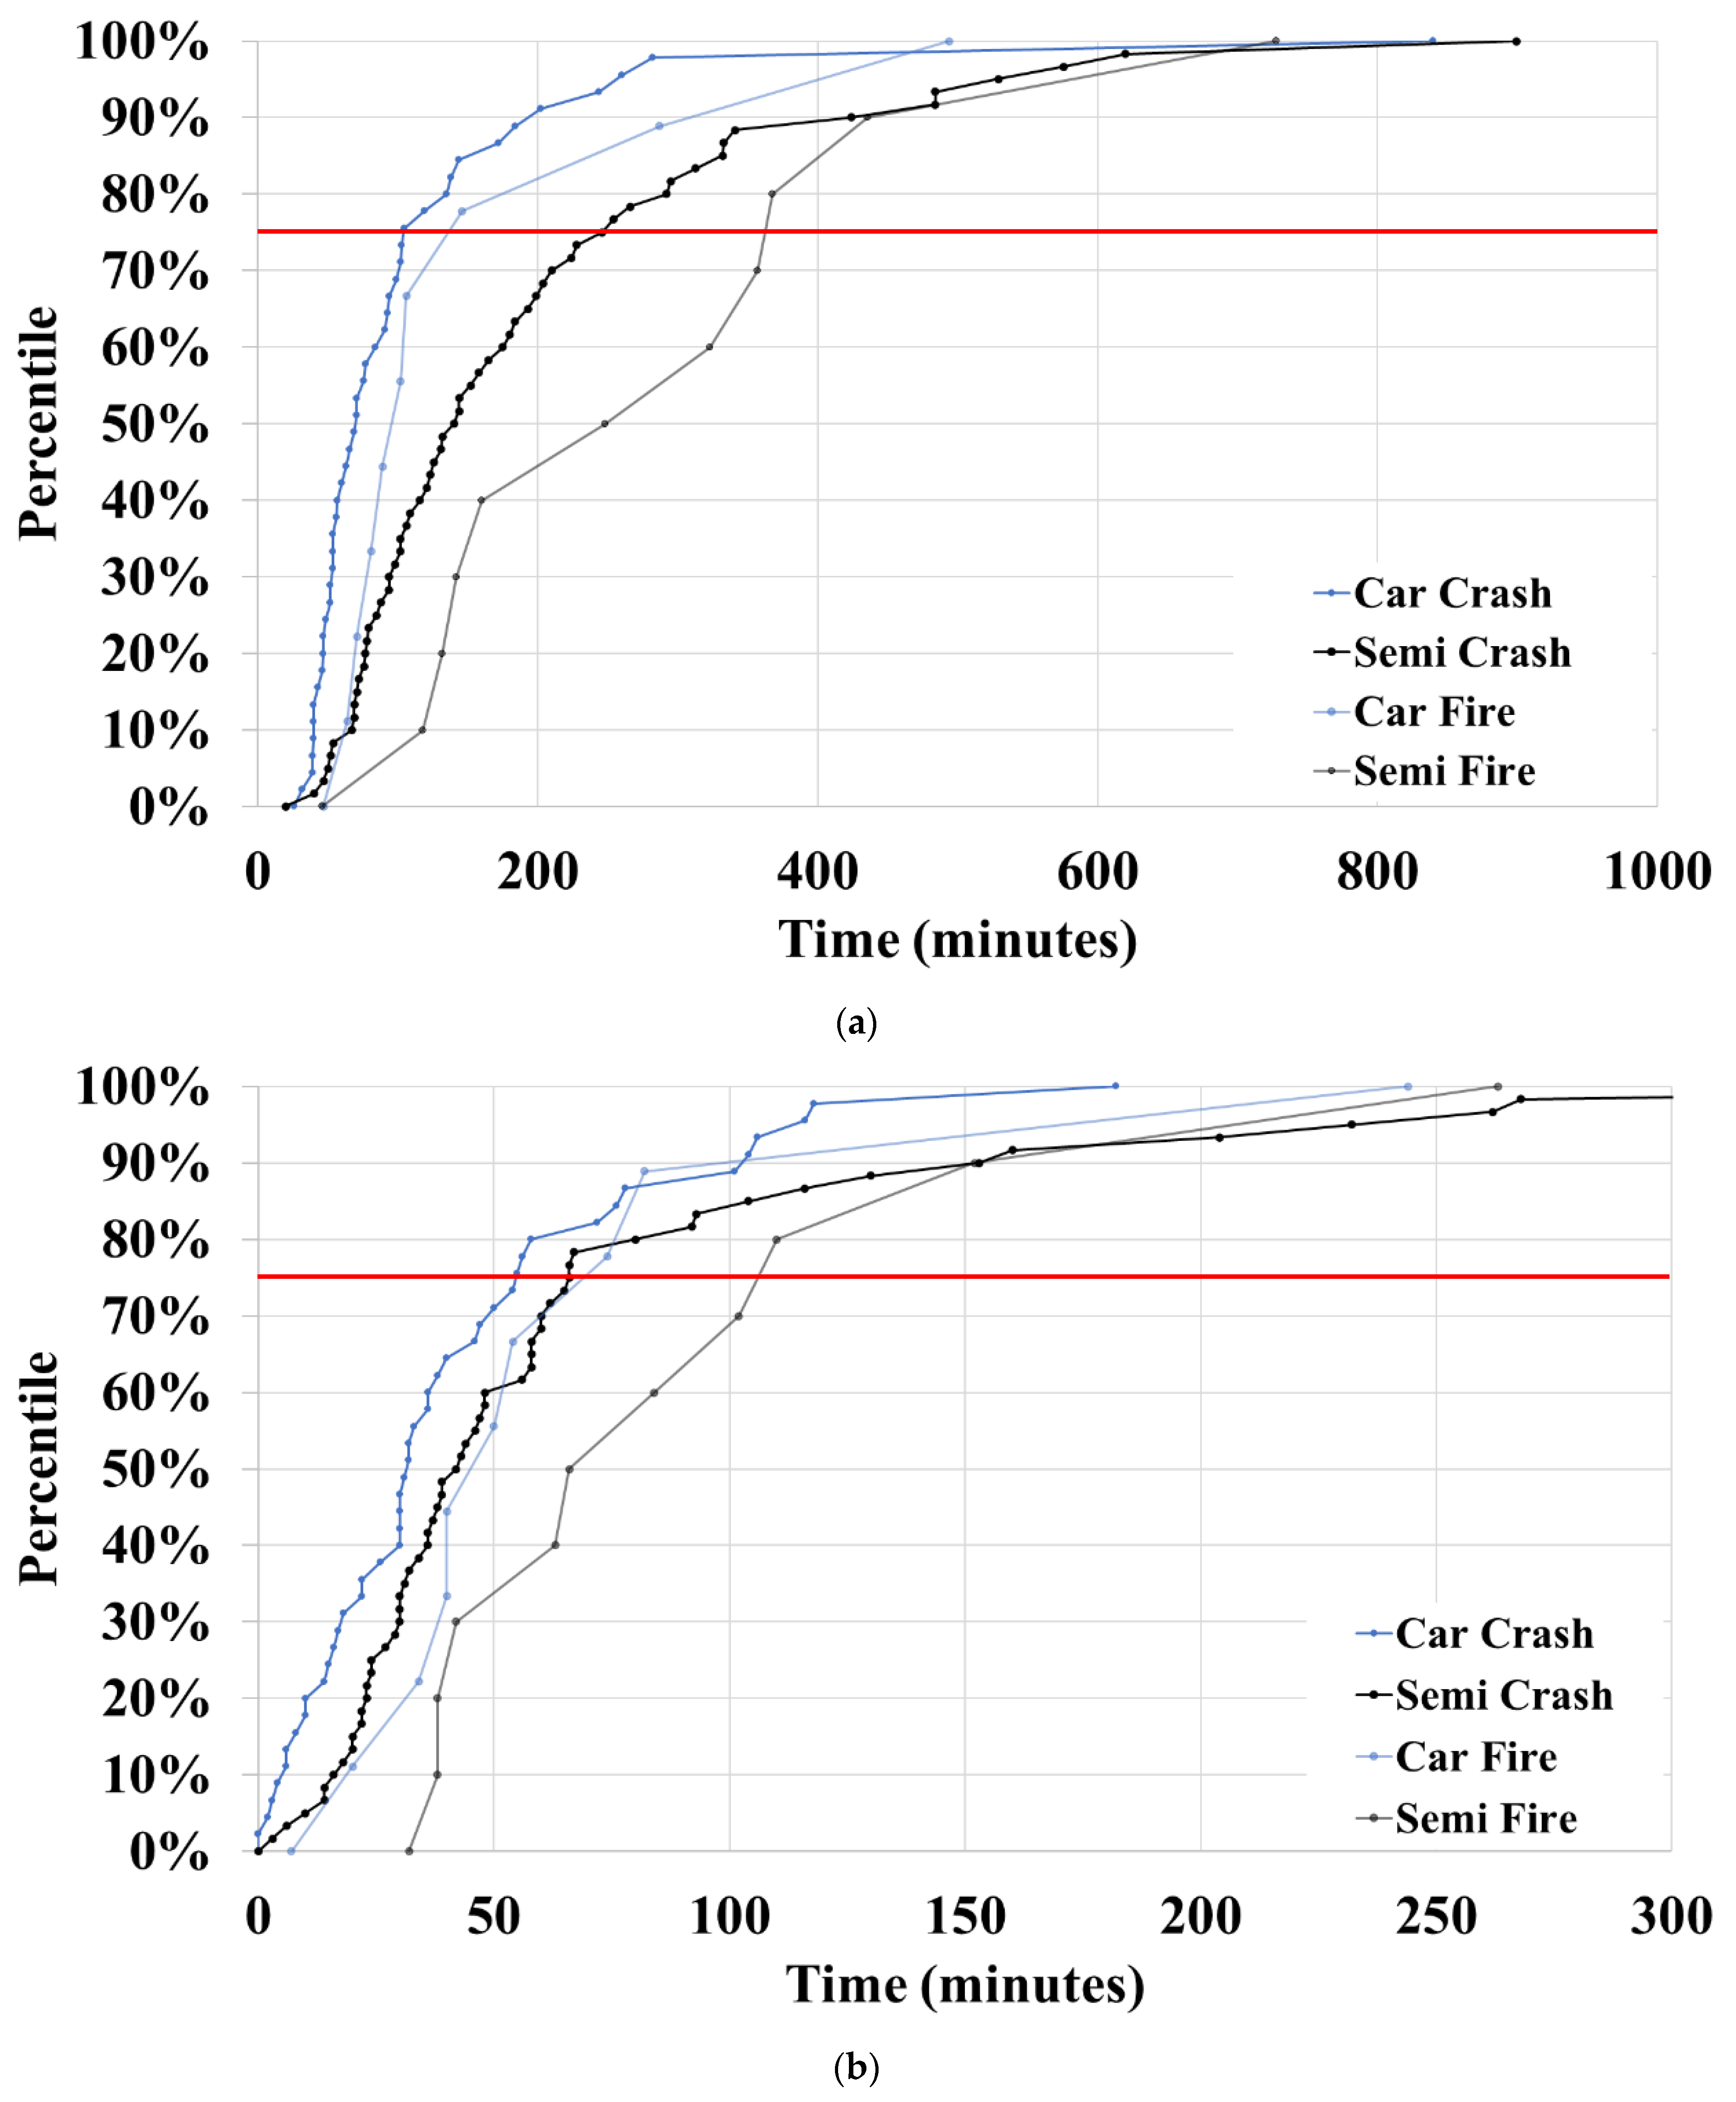
Figure 12 illustrates the cumulative frequency graphs for ICT and RRMT across the four incident types and the horizontal red lines represent the 75th percentile. In Figure 12a, car crashes and car fires have the shortest incident clearance times, with 75% of events clearing within 150 min. In contrast, semi fires show longer clearance times, with many events extending beyond 400 min. Similarly, in Figure 12b, recovery resource mobilization time is significantly longer for semi fires, with 75% of mobilizations taking over 110 min.
Overall, the longest 25% of incidents across all the categories have an RRMT of over 50 min, with semi-fires being the longest, perhaps due to some uncertainty early in the incident on what recovery resources might be required. This highlights a critical opportunity to reduce total incident duration by improving the timing and coordination of recovery resource deployment.

8. Conclusions

Traffic incident management is something that all transportation agencies focus on to reduce overall congestion from incidents and lower the number of secondary crashes resulting from the initial incidents. While detection time, verification time, and response time have been a focus of many TIM programs, it is also important to look beyond the initial response and ensure that all the necessary recovery resources are deployed in a timely manner. The introduction of All Necessary Recovery Resources on Scene (T4,ANRR) gives an event element to the FHWA TIM timeline to track when the recovery portion of the incident is able to begin by documenting when the final recovery resource arrives to the scene. This event element can allow agencies to measure how long it may take for a given incident to have the recovery resources arrive and therefore determine if there is an area for improvement by having recovery resources called in earlier in the incident. The plot in Figure 12b shows that the RRMT across all four incident types exceeded 50 min for the longest 25% of incidents and highlights the frequency of which there may be significant opportunity to reduce the duration of an incident by over an hour in some of these cases.
This highlights the importance of agencies developing systematic monitoring of T4,ANRR and systematically monitoring RRMT to share with stakeholders during both day-to-day TIM program management as well as first responder training. These techniques can also be used to develop benchmarks or incentive programs that reward response time by recovery partners.

Limitations and Future Work

A limitation of this paper is that while there are 128 after-actions utilized in this paper, it only includes a small sample size of all the incidents that happen on interstates in Indiana within a given period. While more after-actions are still being produced, it would be virtually impossible to complete an after-action for every incident that occurs.
Going forward, working with key stakeholders like fire departments, police, EMSs, and tow companies is crucial to not only understanding why specific decisions and delays might occur for any given incident but to also train and educate current responders on why quicker clearances are important and how to implement them when they respond to incidents. Coordination and collaboration are key pillars with TIM practices and making sure all responders understand why something is being performed and where improvements can be made is critical to reducing exposure for first responders on the roadway.

Author Contributions

The authors confirm the contributions to the paper as follows: study conception and design: M.W.O., R.S.S., H.L. and D.M.B.; data collection: M.W.O., J.M., R.S.S. and J.D.; analysis and interpretation of results: M.W.O., J.M. and D.M.B.; draft manuscript preparation: M.W.O. and D.M.B. All authors have read and agreed to the published version of the manuscript.

Funding

The authors disclose the receipt of the following financial support for the research, authorship, and/or publication of this article: This research was supported in part by the Joint Transportation Research Program and in part by Purdue University and Indiana Department of Transportation under agreement A249-18-ON180087 and agreement STIND 75458.

Institutional Review Board Statement

Not applicable.

Informed Consent Statement

Not applicable.

Data Availability Statement

The datasets presented in this article are not readily available because of commercial restrictions.

Acknowledgments

Anonymized connected truck data used in this study was provisioned from Omnitracs, LLC (Westlake, TX, USA). Anonymized connected vehicle data used in this study was provided by StreetLight Data, Inc (San Francisco, CA, USA). This work was prepared as part of the Joint Transportation Research Program SPR-4851. Figure 1, Figure 2, Figure 3, Figure 4, Figure 5, Figure 6, Figure 7, Figure 8 and Figure 9 were adapted from that report. This study is based upon work supported by the Joint Transportation Research Program administered by the Indiana Department of Transportation and Purdue University. The contents of this paper reflect the views of the authors, who are responsible for the facts and the accuracy of the data presented herein and do not necessarily reflect the official views or policies of the sponsoring organizations. These contents do not constitute a standard, specification, or regulation. The authors affirm that no AI or LLMs were used in any capacity in the drafting of the contents of this manuscript.

Conflicts of Interest

The authors declared no potential conflicts of interest with respect to the research, authorship, and/or publication of this article.

Abbreviations

The following abbreviations are used in this manuscript:
ANRRAll Necessary Recovery Resources
ARIESAutomated Reporting Information Exchange System
CVConnected Vehicles
DTDetection Time
EMSEmergency Medical Services
FHWAFederal Highway Administration
ICTIncident Clearance Time
ISPIndiana State Police
ITSIntelligent Transportation Systems
MMMile Marker
NHTSANational Highway Traffic Safety Administration
OLOuter Loop
RCTRoadway Clearance Time
RRMTRecovery Resource Mobilization Time
RTResponse Time
TIMTraffic Incident Management
TMCTraffic Management Center
VTVerification Time

References

  1. USDOT. The Roadway Safety Problem. Available online: https://www.transportation.gov/NRSS/SafetyProblem (accessed on 24 March 2025).
  2. National Center for Statistics and Analysis. Traffic Safety Facts 2022: A Compilation of Motor Vehicle Traffic Crash Data; Publication DOT HS 813 656; National Highway Traffic Safety Administration: Washington, DC, USA, 2024.
  3. Wright, B.; Zou, Y.; Wang, Y. Impact of Traffic Incidents on Reliability of Freeway Travel Times. Transp. Res. Rec. J. Transp. Res. Board 2015, 2484, 90–98. [Google Scholar] [CrossRef]
  4. Zhang, H.; Khattak, A. What Is the Role of Multiple Secondary Incidents in Traffic Operations? J. Transp. Eng. 2010, 136, 986–997. [Google Scholar] [CrossRef]
  5. Khattak, A.; Wang, X.; Zhang, H. Are Incident Durations and Secondary Incidents Interdependent? Transp. Res. Rec. J. Transp. Res. Board 2009, 2099, 39–49. [Google Scholar] [CrossRef]
  6. Kwon, J.; Mauch, M.; Varaiya, P. Components of Congestion: Delay from Incidents, Special Events, Lane Closures, Weather, Potential Ramp Metering Gain, and Excess Demand. Transp. Res. Rec. J. Transp. Res. Board 2006, 1959, 84–91. [Google Scholar] [CrossRef]
  7. Mekker, M.M.; Remias, S.M.; McNamara, M.L.; Bullock, D.M. Characterizing Interstate Crash Rates Based on Traffic Congestion Using Probe Vehicle Data; Purdue University: West Lafayette, IN, USA, 2020. [Google Scholar]
  8. ResponderSafety.com (or Emergency Responder Safety Institute). 2024 Struck-By-Vehicle Fatality Incidents Reports. ResponderSafety.com. Available online: https://www.respondersafety.com/resources/struck-by-incidents/ (accessed on 22 July 2025).
  9. Yu, L.; Bill, A.R.; Chitturi, M.V.; Noyce, D.A. On-Duty Struck-By Crashes: Characteristics and Contributing Factors. Transp. Res. Rec. J. Transp. Res. Board 2013, 2386, 112–120. [Google Scholar] [CrossRef]
  10. Ye, Q.; Fang, Y.; Zheng, N. Performance Evaluation of Struck-by-Accident Alert Systems for Road Work Zone Safety. Autom. Constr. 2024, 168, 105837. [Google Scholar] [CrossRef]
  11. Khan, M.; Gbiengu, P.; Ibrahium, A.; Nnaji, C. Investigating Patterns and Causes of Struck-by Accidents in Roadway Construction Projects. Int. J. Occup. Saf. Ergon. 2025, 1–22. [Google Scholar] [CrossRef]
  12. Corbin, J.; Vasconez, K.C.; Helman, D. Unifying Incident Response. Public Roads 2007, 71, 23–30. [Google Scholar]
  13. Nam, D.; Mannering, F. An Exploratory Hazard-Based Analysis of Highway Incident Duration. Transp. Res. Part A Policy Pract. 2000, 34, 85–102. [Google Scholar] [CrossRef]
  14. Islam, N.; Adanu, E.K.; Hainen, A.M.; Burdette, S.; Smith, R.; Jones, S. Evaluating the Impact of Freeway Service Patrol on Incident Clearance Times: A Spatial Transferability Test. J. Adv. Transp. 2022, 2022, 5272747. [Google Scholar] [CrossRef]
  15. Ma, Y.; Chowdhury, M.; Fries, R.; Ozbay, K. Harnessing the Power of Microscopic Simulation to Evaluate Freeway Service Patrols. J. Transp. Eng. 2009, 135, 427–439. [Google Scholar] [CrossRef]
  16. Salum, J.H.; Sando, T.; Alluri, P.; Kitali, A. Impact of Freeway Service Patrols on Incident Clearance Duration: Case Study of Florida’s Road Rangers. J. Transp. Eng. Part A Syst. 2020, 146. [Google Scholar] [CrossRef]
  17. Dougald, L.E.; Demetsky, M.J. Assessing Return on Investment of Freeway Safety Service Patrol Programs. Transp. Res. Rec. J. Transp. Res. Board 2008, 2047, 19–27. [Google Scholar] [CrossRef]
  18. Latoski, S.P.; Pal, R.; Sinha, K.C. Cost-Effectiveness Evaluation of Hoosier Helper Freeway Service Patrol. J. Transp. Eng. 1999, 125, 429–438. [Google Scholar] [CrossRef]
  19. Liu, J.; Fu, X.; Hainen, A.; Yang, C.; Villavicencio, L.; Horrey, W.J. Evaluating the Impacts of Vehicle-Mounted Variable Message Signs on Passing Vehicles: Implications for Protecting Roadside Incident and Service Personnel. J. Intell. Transp. Syst. 2024, 28, 846–866. [Google Scholar] [CrossRef]
  20. Islam, N.; Adanu, E.K.; Hainen, A.M.; Burdette, S.; Smith, R.; Jones, S. A Comparative Analysis of Freeway Crash Incident Clearance Time Using Random Parameter and Latent Class Hazard-Based Duration Model. Accid. Anal. Prev. 2021, 160, 106303. [Google Scholar] [CrossRef]
  21. Alkaabi, A.M.S.; Dissanayake, D.; Bird, R. Analyzing Clearance Time of Urban Traffic Accidents in Abu Dhabi, United Arab Emirates, with Hazard-Based Duration Modeling Method. Transp. Res. Rec. J. Transp. Res. Board 2011, 2229, 46–54. [Google Scholar] [CrossRef]
  22. Ding, C.; Ma, X.; Wang, Y.; Wang, Y. Exploring the Influential Factors in Incident Clearance Time: Disentangling Causation from Self-Selection Bias. Accid. Anal. Prev. 2015, 85, 58–65. [Google Scholar] [CrossRef]
  23. Garib, A.; Radwan, A.E.; Al-Deek, H. Estimating Magnitude and Duration of Incident Delays. J. Transp. Eng. 1997, 123, 459–466. [Google Scholar] [CrossRef]
  24. Ghosh, I.; Savolainen, P.T.; Gates, T.J. Examination of Factors Affecting Freeway Incident Clearance Times: A Comparison of the Generalized F Model and Several Alternative Nested Models. J. Adv. Transp. 2014, 48, 471–485. [Google Scholar] [CrossRef]
  25. Tavassoli Hojati, A.; Ferreira, L.; Washington, S.; Charles, P. Hazard Based Models for Freeway Traffic Incident Duration. Accid. Anal. Prev. 2013, 52, 171–181. [Google Scholar] [CrossRef] [PubMed]
  26. Hou, L.; Lao, Y.; Wang, Y.; Zhang, Z.; Zhang, Y.; Li, Z. Modeling Freeway Incident Response Time: A Mechanism-Based Approach. Transp. Res. Part C Emerg. Technol. 2013, 28, 87–100. [Google Scholar] [CrossRef]
  27. Sakhare, R.S.; Desai, J.; Mathew, J.K.; McGregor, J.; Kachler, M.; Bullock, D.M. Measuring and Visualizing Freeway Traffic Conditions: Using Connected Vehicle Data; Joint Transportation Research Program: West Lafayette, IN, USA, 2024. [Google Scholar]
  28. Mathew, J.K.; Malackowski, H.A.; Gartner, C.M.; Desai, J.; Cox, E.D.; Habib, A.F.; Bullock, D.M. Methodology for Automatically Setting Camera View to Mile Marker for Traffic Incident Management. J. Transp. Technol. 2023, 13, 708–730. [Google Scholar] [CrossRef]
  29. Overall, M.; Mukai, J.; Sakhare, R.S.; Desai, J.; Horton, D.; Bullock, D. Repository of After-Action Reports for Traffic Incident Management (TIM); Joint Transportation Research Program: West Lafayette, IN, USA, 2025. [Google Scholar]
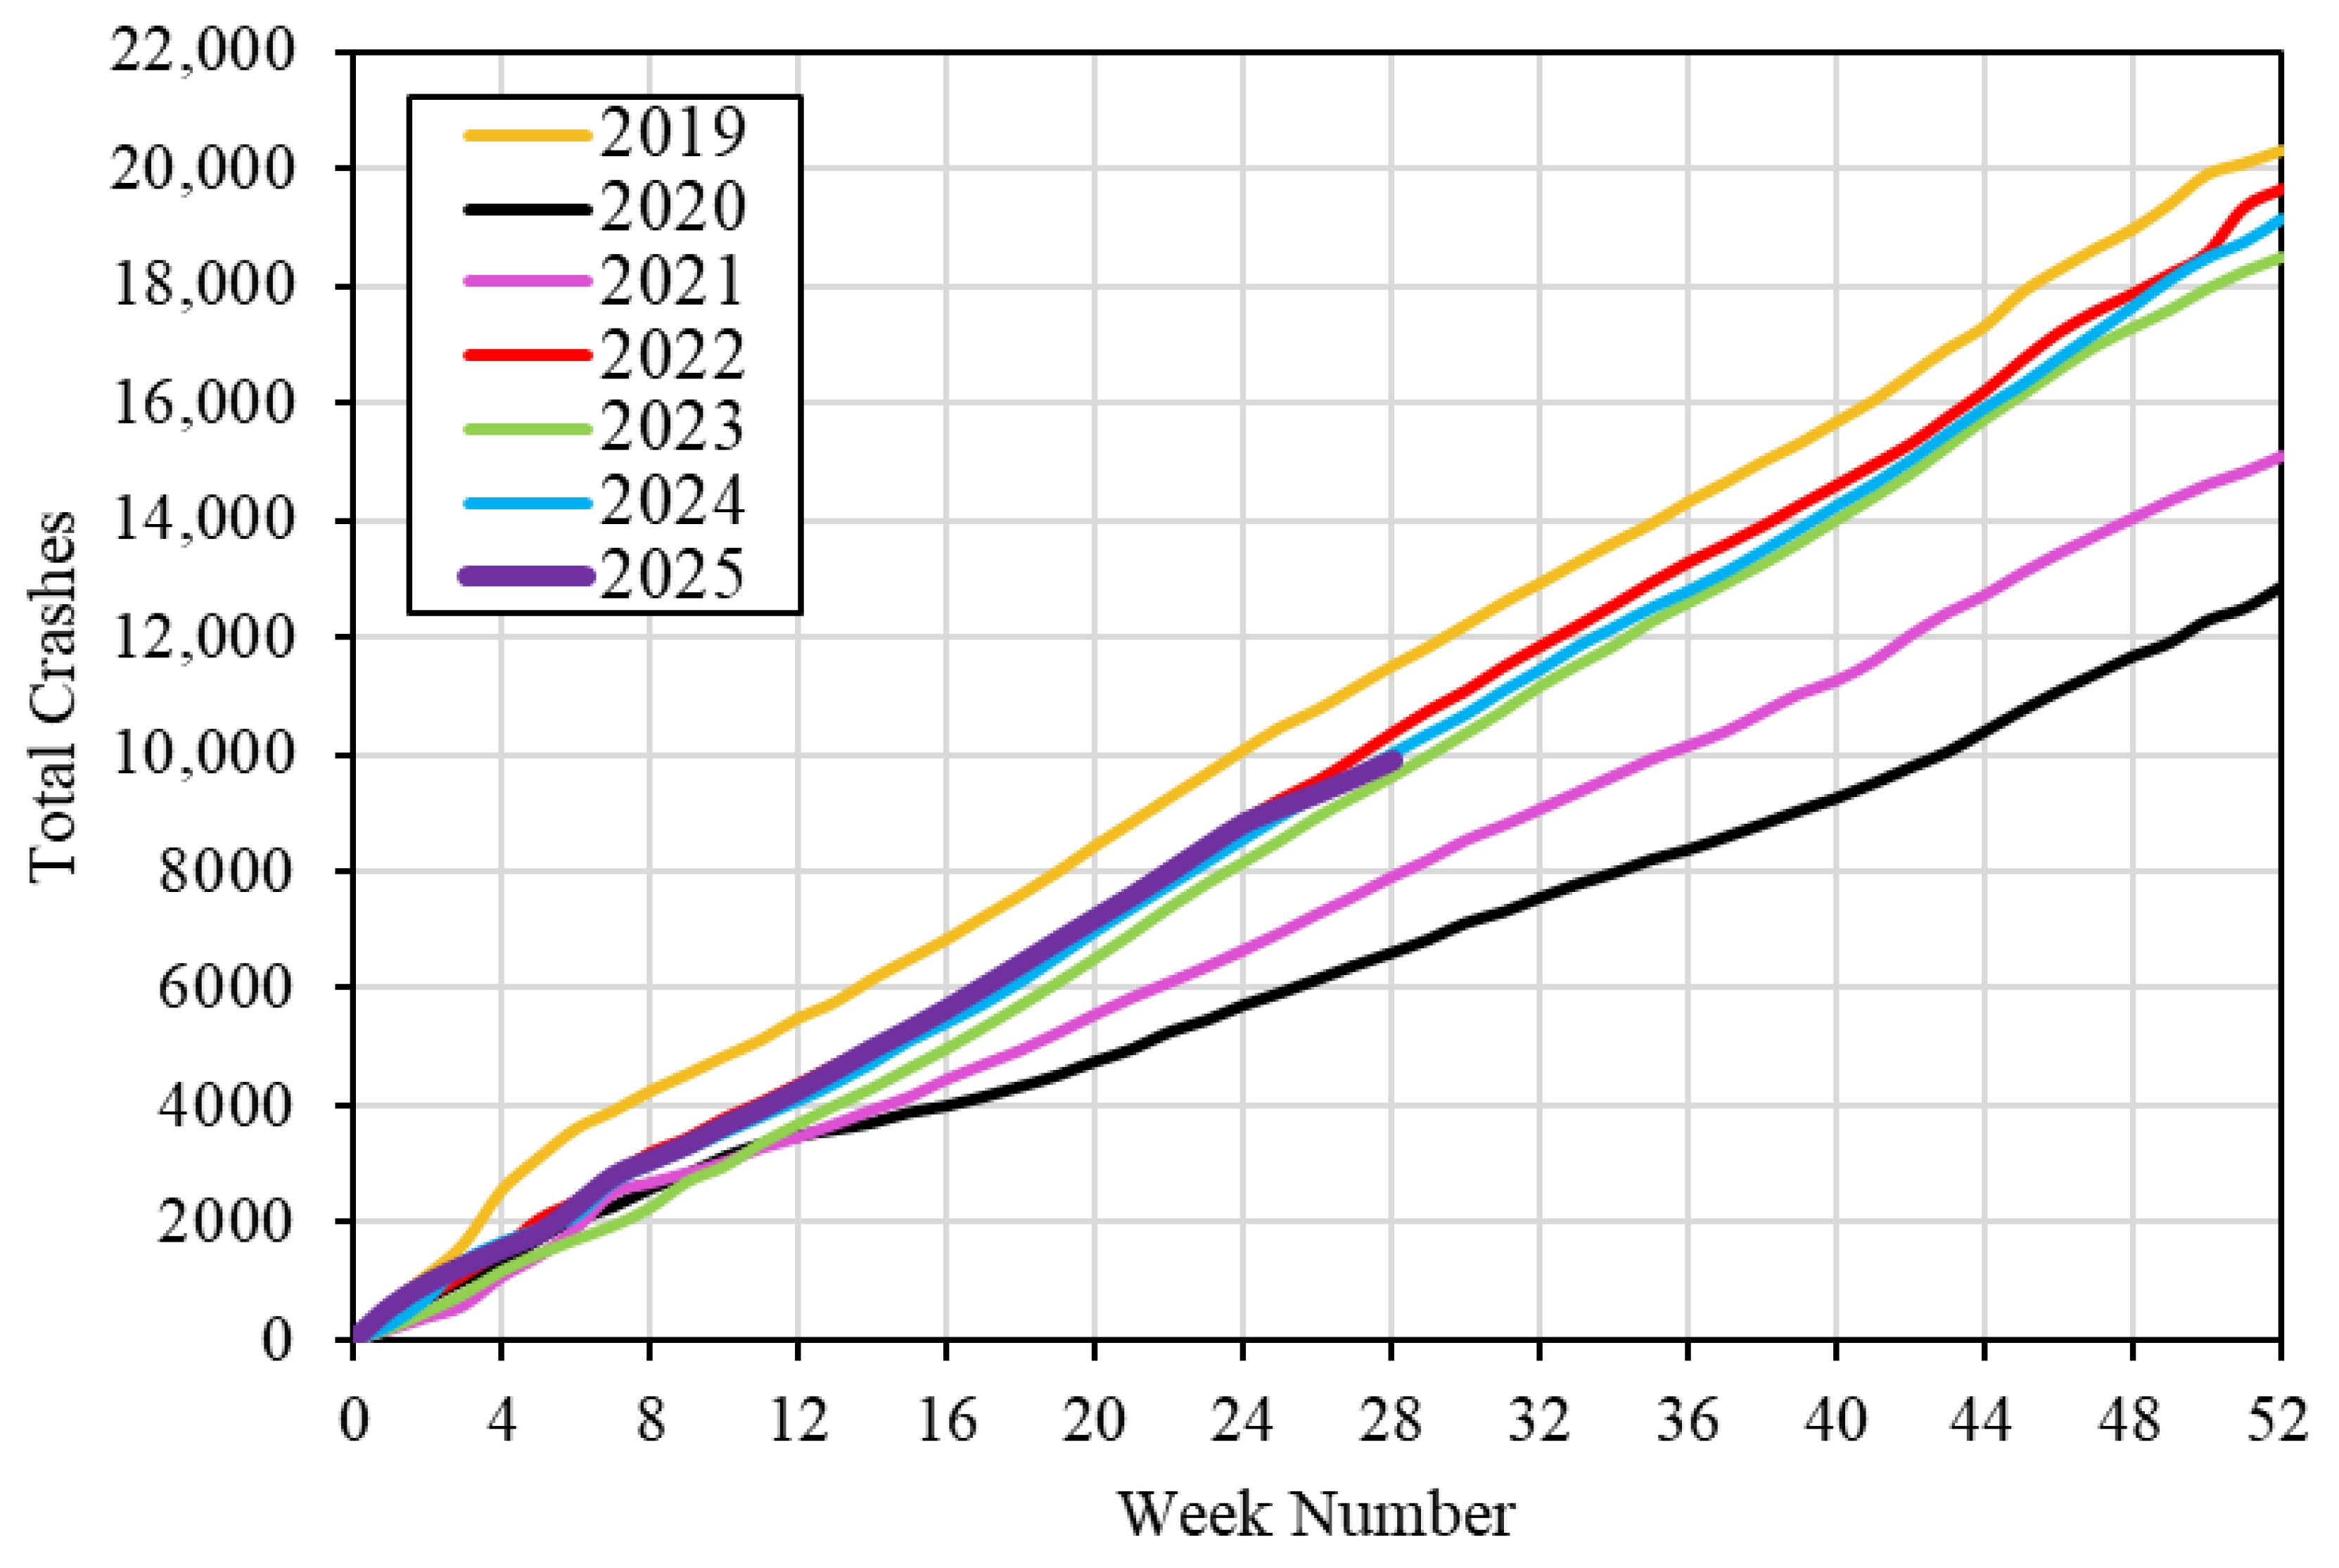
Figure 1. Cumulative weekly crashes on Indiana interstate system by year from 2019 to 2025.
Futuretransp 05 00171 g001
Figure 2. Modified FHWA TIM timeline.
Futuretransp 05 00171 g002
Figure 3. ITS camera image and traffic speed heatmap using CV data for an overturned semi crash along I-465 outer loop (OL) on 13 December 2024. (a) ITS camera image of semi across all lanes; (b) traffic speed heatmap of incident.
Futuretransp 05 00171 g003
Figure 4. ITS camera images during an overturned semi incident along I-465 OL at mile marker 11.7 on 13 December 2024. (a) T0,cv; (b) T0; (c) T1, T2, T2,eye, T4; (d) T4,ANRR; (e) T5, T6; (f) T7.
Futuretransp 05 00171 g004
Figure 5. Traffic speed heatmap for a section of I-65 in Indiana from MM 123 to MM 133 on Saturday, 11 January 2025.
Futuretransp 05 00171 g005
Figure 6. Select ITS camera images during a passenger vehicle slide-off along I-65 SB at mile marker 126.3 on 11 January 2025. (a) T0; (b) T2, T2,eye; (c) T4; (d) T4,ANRR; (e) T5, T6; (f) T7.
Futuretransp 05 00171 g006aFuturetransp 05 00171 g006b
Figure 7. Traffic speed heatmap for a section of I-65 in Indiana from MM 115 to MM 125 on Tuesday, 30 April 2024.
Futuretransp 05 00171 g007
Figure 8. Select ITS camera images during a passenger vehicle fire along I-65 NB at mile marker 119.4 on 30 April 2024. (a) T0, T1; (b) T2, T2,eye; (c) T4; (d) T4,ANRR; (e) T5; (f) T6.
Futuretransp 05 00171 g008aFuturetransp 05 00171 g008b
Figure 9. Traffic speed heatmap for a section of I-65 in Indiana from MM 98 to MM 110 on Thursday, 19 December 2024.
Futuretransp 05 00171 g009
Figure 10. Select ITS camera images during a semi fire along I-65 SB at mile marker 102.9 on 19 December 2024. (a) T0; (b) T1; (c) T2, T2,eye, T4; (d) T4,ANRR; (e) T5, T6; (f) T7.
Futuretransp 05 00171 g010
Figure 11. Box-and-whisker plot of response time (T4−T2), recovery resource mobilization time (T4,ANRR−T4), and incident clearance time (T6−T1) by incident type. Outliers i, ii, iii, and iv identify incidents with significant opportunity to reduce clearance times.
Futuretransp 05 00171 g011
Figure 12. Cumulative frequency distribution graphs for ICT and RRMT for 128 incidents. The red line represents the 75th percentile. (a) Incident clearance time, ICT (T6–T1); (b) recovery resource mobilization time, RRMT (T4A,NRR–T4).
Futuretransp 05 00171 g012
Table 1. Links to after-actions used in this paper.
Ilustration of IncidentDate/
QR Code
Repository
ID [20]
RRMT
(min)
Futuretransp 05 00171 i00113 December 2024
Futuretransp 05 00171 i002
24992
Futuretransp 05 00171 i00311 January 2025
Futuretransp 05 00171 i004
426112
Futuretransp 05 00171 i00530 April 2024
Futuretransp 05 00171 i006
32934
Futuretransp 05 00171 i00719 December 2024
Futuretransp 05 00171 i008
24634
Table 2. TIM event sequences for the case studies.
TIM EventDescriptionEvent Time
Case Study 1Case Study 2Case Study 3Case Study 4
T0Incident Occurs11:54 a.m.9:08 a.m.6:00 p.m.10:35 a.m.
T1Incident Reported11:56 a.m.9:08 a.m.6:00 p.m.10:37 a.m.
T2Incident Verified11:56 a.m.9:12 a.m.6:04 p.m.10:40 a.m.
T2,eyeITS Camera on Event11:56 a.m.9:12 a.m.6:04 p.m.10:40 a.m.
T4Response Arrives on Scene11:56 a.m.9:40 a.m.6:08 p.m.10:40 a.m.
T4,ANRRAll Necessary Recovery Resources1:28 p.m.11:32 a.m.6:42 p.m.11:22 a.m.
T5All Travel Lanes Open3:44 p.m.12:12 p.m.6:26 p.m.4:34 p.m.
T6All Responders Have Left the Scene3:44 p.m.12:12 p.m.7:04 p.m.4:34 p.m.
T7Traffic Conditions Return to Normal4:27 p.m.12:20 p.m.6:46 p.m.6:21 p.m.
Table 3. TIM summary interval for the case studies.
Summary IntervalFormulaTime (min)
Case Study 1Case Study 2Case Study 3Case Study 4
Detection TimeT1–T00000
Verification TimeT2–T12443
TMC Verification TimeT2eye–T02445
Response TimeT4–T202840
Recovery Resource Mobilization Time
(RRMT)
T4,ANRR–T4921123434
Roadway Clearance Time (RCT)T5–T122818426357
Incident Clearance Time (ICT)T6–T122818464357
Time to Return to Normal FlowT7–T027719246466
Disclaimer/Publisher’s Note: The statements, opinions and data contained in all publications are solely those of the individual author(s) and contributor(s) and not of MDPI and/or the editor(s). MDPI and/or the editor(s) disclaim responsibility for any injury to people or property resulting from any ideas, methods, instructions or products referred to in the content.