Abstract
This study explores and evaluates different methodologies for designing the edge-of-traveled-way turning paths at right-angle at-grade intersections, with emphasis on low-speed maneuvers involving large design vehicles. Three geometric approaches are examined as follows: the standard AASHTO configuration, the German RAS-K-1 triple-radius method, and a clothoid-based transition curve design. Simulations using representative design vehicles, conducted under speeds ≤ 15 km/h, are used to assess each method’s performance in terms of spatial efficiency, steering continuity, and lateral clearance. The findings suggest that while the AASHTO asymmetric compound curve offers an effective balance between clearance and compactness, clothoid curves may improve transition smoothness and provide an alternative option for designing the edge-of-traveled-way turning paths at right-angle at-grade intersections.
1. Introduction
The geometric configuration of intersections plays a decisive role in shaping vehicle maneuverability, traffic safety, and land use efficiency. A fundamental component in this design process is the edge of traveled way, which delineates the boundary within which vehicles must complete turning movements. For large and articulated vehicles, in particular, the edge geometry must be carefully designed to prevent curb strikes, lane encroachments, and inadequate clearance.
Current international standards primarily refer to two well-established sources: the AASHTO Green Book [1] and the German RAS-K-1 guidelines [2]. Both provide methodologies and design templates based on different philosophies. The AASHTO Green Book emphasizes compactness and functional efficiency, often through the use of asymmetric three-centered curves. In contrast, the RAS-K-1 promotes geometric regularity through triple-radius layouts, aiming to facilitate predictable driver behavior and smoother turning paths (AASHTO, 2011; FGSV RAS-K-1) [1,2].
Although these guidelines are widely adopted, direct comparisons of their effectiveness—particularly regarding their spatial demands and adaptability to various vehicle types—are rarely addressed in a unified framework. Furthermore, methods involving clothoid transitions, though common in highway alignment design due to their curvature continuity, are seldom applied in intersection corner layouts despite their potential advantages at low speeds.
This study seeks to bridge that gap by systematically comparing three curve design methodologies: the AASHTO configuration, the German RAS-K-1 triple-radius method, and a clothoid-based transition curve design. The evaluation is conducted through simulations involving standard design vehicles under constrained, low-speed turning conditions (≤15 km/h). Particular attention is paid to spatial requirements, vehicle clearance, and curvature smoothness. Through this comparative analysis, the study aims to identify optimal design strategies for different vehicle classes (according to AASHTO design vehicle types) for designing the edge-of-traveled-way turning paths at right-angle at-grade intersections for low-speed turning conditions. Furthermore, this study offers an alternative to the AASHTO Green Book and RAS-K-1 design methodologies of right-angle at-grade intersections, proposing a clothoid-based transition curve design.
2. Literature Review
Many studies have attempted to develop an accurate method to computationally represent the movement of design vehicles, specifically focusing on the trajectory of the front and rear wheels, the overhang, the off-tracking, and ultimately determining the envelope of the swept path of each vehicle [3,4,5]. Some of these methods have even been implemented in well-known cad and road design software to more accurately depict the path of design vehicles [6,7,8]. Dragčević et al. [9] gave an overview of the methods for setting the vehicle movement trajectory. Berman et al. [10] presented a model to predict the low-speed performance of an articulated vehicle, given only the vehicle geometry. De Saxe & Berman [11] simulated heavy vehicle maneuverability, using a software tool that is based on simple kinematics using the tractrix method and hence only the vehicle dimensional data were necessary in order to perform the simulation. Sasa [12] focused on the range and combination of geometric factors leading to successful long combination vehicles’ right-turn movements, such as curb radii and lane width. Stančerić et al. [13] aimed at defining a new design procedure for channelized at-grade four-leg intersections, starting with finding an intersection scheme in which all the intersection elements could be designed, for different intersection angles, without the necessity for additional swept path analysis.
Among the available AASHTO solutions [1], the asymmetric three-centered curve is frequently favored in constrained environments. Its geometry allows for tighter turns while preserving clearance, making it particularly suitable for locations with limited available pavement or adjacent infrastructure constraints.
In contrast, the German RAS-K-1 guidelines [2] advocate for a triple-radius approach. This method prioritizes geometric regularity and consistent driver behavior by maintaining balanced curvature before and after the point of inflection. While this configuration enhances steering predictability and visual continuity, it often requires more pavement surface area, which is a limitation in compact or dense urban settings.
An alternative design approach involves the use of clothoid transitions, or Euler spirals [14], which are characterized by a gradual and continuous change in curvature. Clothoids are widely used in highway alignment design due to their benefits for driver comfort and vehicle dynamics, particularly at higher speeds. However, their potential applications in low-speed, tight-turn intersection scenarios remain underexplored. The continuity of curvature offered by clothoids could improve vehicle clearance and reduce abrupt steering changes, especially for long vehicles with significant off-tracking.
The use of clothoid transition curves is important for better road design [15]. Kaliabetsos [16] evaluated clothoid, three types of cubic parabola, and a newly introduced curve named “Symmetrically Projected Transition Curve” (SPTC) as transition curves between a straight line and a circular arc. Basak [17] investigated the effectiveness of the three most popular curves, in the design of road routes: clothoid, a parabola of the third degree, and Bernoulli lemniscate. Casal et al. [18] presented a general formulation for the optimization of horizontal road alignment, composed of tangential segments and circular curves suitably connected with transition curves (clothoids). The optimization of transition curves on roads is important in order to ensure a smooth transition from straight to circular parts [19].
Despite the established use of AASHTO and RAS-K-1 standards, direct comparative research that evaluates these methods—alongside clothoid-based designs—under a consistent set of conditions has not emerged. The systematic assessment of their relative spatial efficiency, suitability for various vehicle types, and steering performance motivates the present study, which aims to provide an empirical comparison of the three methods using standardized simulations for turning maneuvers at at-grade intersections.
3. Methodology
In the present study, the analysis focused on right-angle turns at at-grade intersections. Three curve configurations were evaluated as follows: (i) an AASHTO three-centered compound symmetric and asymmetric curve, (ii) an RAS-K-1 triple-radius curve, and (iii) a clothoid-based design. Standard design vehicles representing a range of dimensions and off-tracking characteristics were simulated, including P, SU-9, SU-12, WB-12, WB-19, WB-20, WB-28D, WB-30T, and WB-33D from the AASHTO Green Book [1].
For each method, the edge of traveled way was generated using the nominal turning paths for the guidance axis and checked against the vehicle envelopes. Simulations were performed for low-speed maneuvers (≤15 km/h). Evaluation metrics included the following: paved area required by the corner design; minimum lateral clearance between the vehicle envelope and the edge; trajectory smoothness as reflected by curvature change metrics; and suitability for long articulated vehicles.
Further analysis will be made of the minimum design values of the boundary line in at-grade intersections (with legs intersecting at right angles) based on the wheel and body traces of each design vehicle. In addition, an attempt will be made to improve the above values through a different approach, by using the clothoid curve in the geometric design of the road boundary line while all the above will be compared with the methodology of the German regulations (3 RAS radii). The above investigation will be carried out using the road design software Anadelta Tessera version 3.8.0 [7].
3.1. Minimum Values for Passenger Car (P) Design Vehicle
The AASHTO Green Book (THE GREEN BOOK, A Policy on Geometric Design of Highways and Streets, 2011) provides tables with indicative values of specific design vehicles, as well as detailed drawings where these values apply [1]. An example of this is shown in Figure 1.
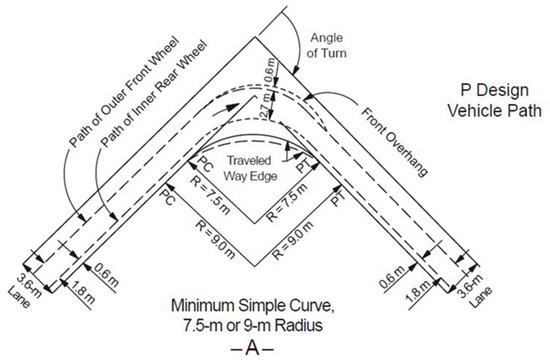
Figure 1.
Path of P design vehicle [1].
This figure was drawn in Anadelta Tessera software in order to validate the methodology used to represent the paths of the vehicle that would trigger the identification of potential improvements in the process. Figure 2 illustrates the trajectory of a design vehicle of type P on a symmetric three-centered compound curve drawn in Anadelta Tessera. In Figures 2–11 and 13–24, green color lines illustrate the swept path width for the design vehicles and red color lines illustrate the edge-of-traveled way.
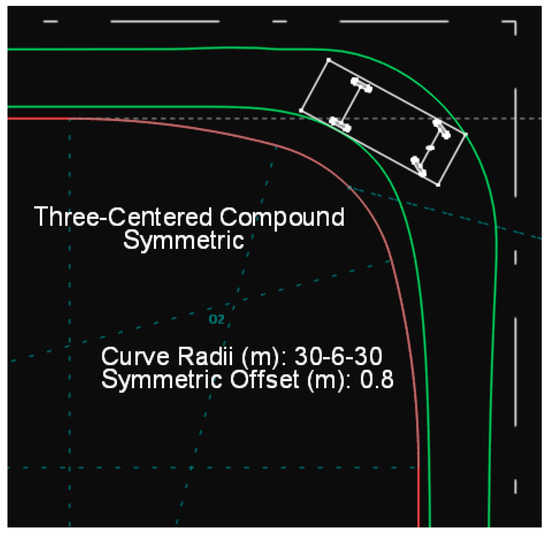
Figure 2.
Path of a type P vehicle on a symmetric three-centered compound curve by Anadelta Tessera.
Based on the analysis presented in the AASHTO Green Book, as well as the analysis conducted using Anadelta Tessera, it is concluded that in the case of the three-center compound curve, a slightly larger pavement area is required compared to the case of a simple circular arc. Nevertheless, the compound curve solution is preferred, as the edge of the traveled way more closely encloses the path of the design vehicle.
In a subsequent phase, a methodology for designing the edge of the traveled way using a clothoid curve is developed. Specifically, a clothoid curve is used at the entry of the turn, followed by a simple circular arc, and finally another clothoid curve at the exit. This method is commonly applied in roadway curves to facilitate smoother vehicle transitions into and out of circular arcs. The same principle was adopted in this methodology, with the difference that it is now applied to the edge lines of at-grade intersections rather than to road centerline curves. Figure 3 illustrates the trajectory of a design vehicle of type P on such a curve.
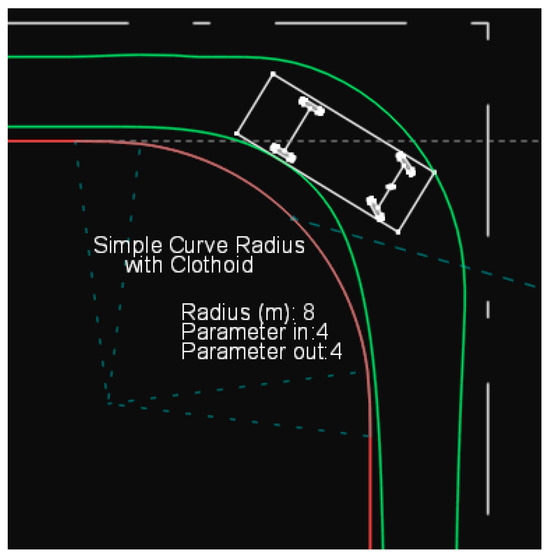
Figure 3.
Path of a type P vehicle on a simple circular arc with clothoid entry and exit curves.
In addition, the methodology of the German guidelines (RAS-K-1) was also applied, namely the use of the three (3) RAS radii. However, the radius of the main arc (R2) was selected through trial-and-error testing, in order for the edge of the traveled way to enclose the vehicle’s trajectory as closely as possible (Figure 4), rather than by adopting the recommended values provided in the German guidelines.
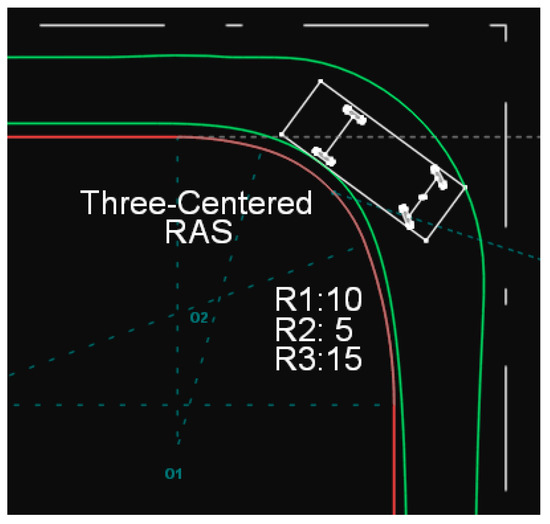
Figure 4.
Path of a type P vehicle on a three-radius RAS curve.
Based on the above analysis, it is concluded that the three-radius RAS configuration provides the best enclosure of the design vehicle’s path, while also requiring the minimum possible pavement surface area.
3.2. Minimum Values for Single-Unit Truck (SU-9) Design Vehicle
For the SU-9 type truck, the vehicle trajectory was modified in order for the simple circular arc solution (with a 15 m radius) to be acceptable (Figure 5). Specifically, it was necessary to slightly adjust the vehicle’s steering axis (as illustrated with purple arrows in Figure 5, Figure 6 and Figure 7) to satisfy the requirement that under no circumstances should the lateral distance between the design vehicle’s path and the edge of the traveled way be less than 20 cm (according to the AASHTO Green Book).
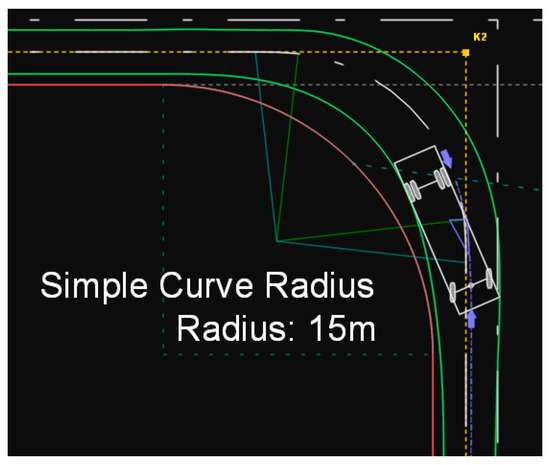
Figure 5.
Path of the SU-9 type truck on a simple circular arc.
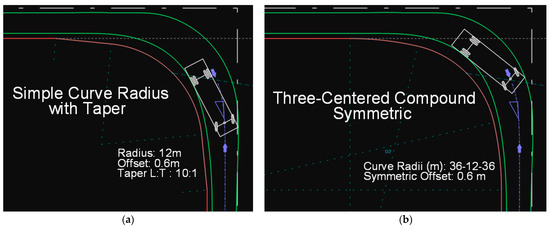
Figure 6.
(a) Path of the SU-9 type truck on a simple circular arc with taper. (b) Path of the SU-9 type truck on a symmetric three-centered compound curve.
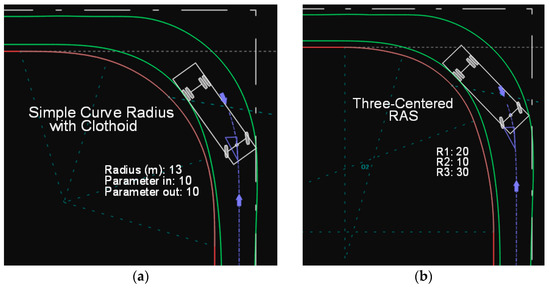
Figure 7.
(a) Path of the SU-9 type truck on a simple circular arc with clothoid transitions on both ends. (b) Path of the SU-9 type truck on a three-radius RAS curve.
In the cases of the simple circular arc with taper, as well as the symmetric three-center compound curve (Figure 6), the modified trajectory was maintained to enable a more accurate comparison between the different configurations. This approach was adopted because, in order to make a valid comparison, the design vehicle must follow exactly the same trajectory in each case.
Among the above solutions, the most functional and preferable is the three-center compound curve, as in this case, the edge of the traveled way aligns more accurately with the path of the design vehicle’s inner rear wheel, while also requiring the minimum possible pavement area.
Furthermore, the use of a clothoid curve does not appear to offer any substantial advantage over the AASHTO three-radius solution (i.e., the three-center compound curve). Although it results in a slightly smaller pavement area, the compound curve more closely follows the vehicle’s path. However, the most optimal solution among all appears to be the RAS three-radius configuration, as it achieves the smallest pavement area while the edge of the traveled way fits exceptionally well with the path of the design vehicle. Both this solution and the clothoid case are illustrated in Figure 7.
3.3. Minimum Values for Single-Unit Truck (SU-12) Design Vehicle
This section presents the minimum design values for the edge of the traveled way for 90° turns, based on the trajectories of the SU-12 type vehicles. Urban transit buses, according to the American guidelines, are covered by the above minimum design values; therefore, no separate analysis is provided for them.
For this type of design vehicle, the American guidelines provide four options regarding the geometry of the edge of the traveled way. Each option is accompanied by corresponding minimum design values. Figure 8 and Figure 9 illustrate these solutions.
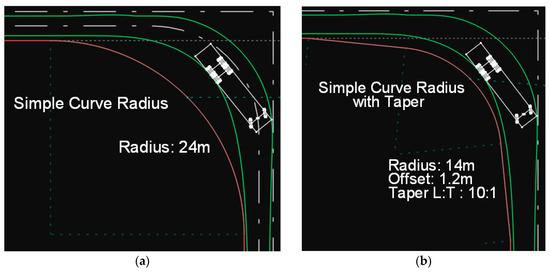
Figure 8.
(a) Path of the SU-12 type truck on a simple circular arc. (b) Path of the SU-12 type truck on a simple circular arc with taper.
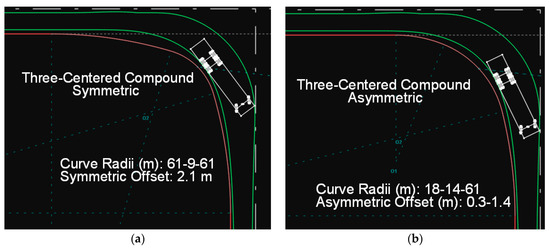
Figure 9.
(a) Path of the SU-12 type truck on a symmetric three-centered compound curve. (b) Path of the SU-12 type truck on an asymmetric three-centered compound curve.
The minimum design values for the edge of the traveled way are determined based on the sharpest turn that the design vehicles can perform. A key role in this determination is played by the dimensions of the vehicles as well as their mechanical limitations (e.g., the maximum steering angle of each design vehicle). In the case of the SU-12 truck, the maximum steering angle is 31.8°, and the corresponding minimum turning radius that the front axle can achieve (CTR—Centerline Turning Radius at the front axle) is 14.46 m. In the simulation conducted using Anadelta Tessera software, the steering axis curve for the SU-12 vehicle has a radius of 13 m and includes entry and exit clothoids, both with a parameter value of 7. Using this symmetric curve for the vehicle’s steering path results in a maximum steering angle of 31.64°, which is very close to the 31.8° limit for this design vehicle.
Among the previously described solutions, the best-performing one is the asymmetric three-center compound curve, as it closely matches the vehicle’s path. The solutions involving a simple circular arc with clothoid transitions on both ends, as well as the three-radius RAS curves with the recommended design values (Figure 10), do not appear to offer any advantage over the asymmetric compound curve described in the AASHTO Green Book.
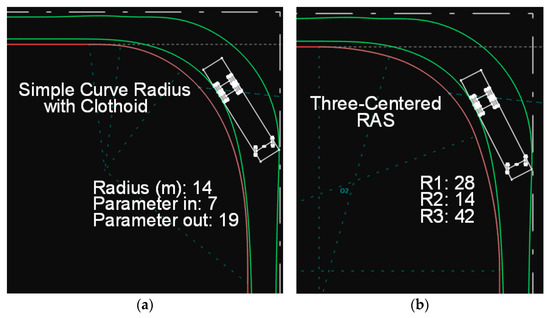
Figure 10.
(a) Path of the SU-12 type truck on a simple circular arc with clothoid transitions on both ends. (b) Path of the SU-12 type truck on a three-radius RAS curve.
3.4. Minimum Values for Semitrailer Combination Trucks
3.4.1. Intermediate Semitrailer (WB-12) Design Vehicle
In the case of WB-12 design vehicles, as well as for all vehicle types within the semitrailer truck category, it is not practical to use simple circular arcs as edge lines. Therefore, the analysis begins with the case of the simple circular arc with taper (Figure 11).
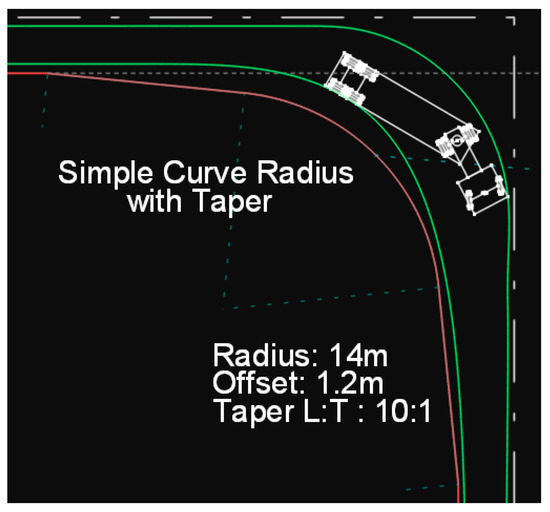
Figure 11.
Path of the WB-12 vehicle on a simple circular arc with taper.
In the case of the symmetric three-center compound curve, a problem is identified, as the values recommended in the tables of the American guidelines are not applicable. The reason is that the distance between the vehicle’s trajectory and the edge of the traveled way is less than 20 cm, which is considered unacceptable. Evidence supporting this claim is provided in the following figures (Figure 12 and Figure 13), which show that the path of the design vehicle nearly intersects the edge line of the pavement. Notably, the first figure (Figure 12) is sourced from the AASHTO Green Book, while the second (Figure 13) comes from a simulation performed in Tessera. The only difference between them is that the offset in the Green Book figure is 2.0 m, whereas in the Tessera simulation, it is 1.5 m.
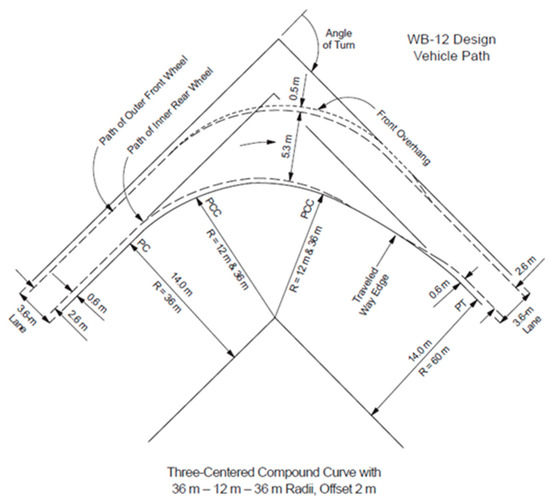
Figure 12.
Path of the WB-12 vehicle on a symmetric AASHTO curve (from the Green Book) [1].
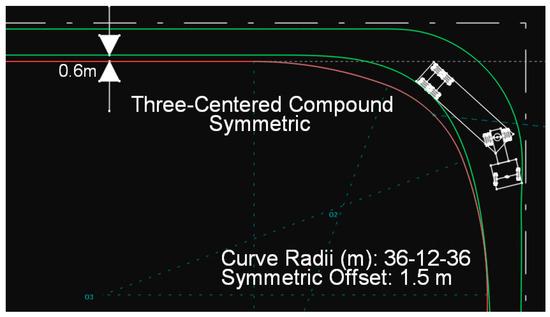
Figure 13.
Path of the WB-12 vehicle on a symmetric AASHTO curve (from simulation in Anadelta Tessera software).
With regard to the case of the asymmetric AASHTO curve, the values recommended in the Green Book table appear to be quite satisfactory (Figure 14).
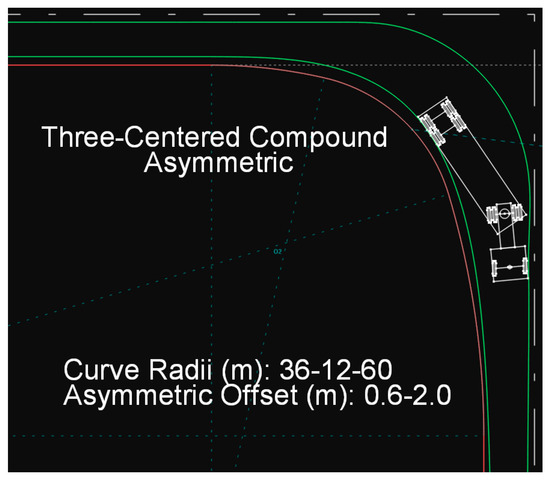
Figure 14.
Path of the WB-12 vehicle on an asymmetric AASHTO curve.
The solutions involving a simple circular arc with clothoid transitions on both ends and the three-radius RAS curve (Figure 15) are not superior to the asymmetric AASHTO curve.
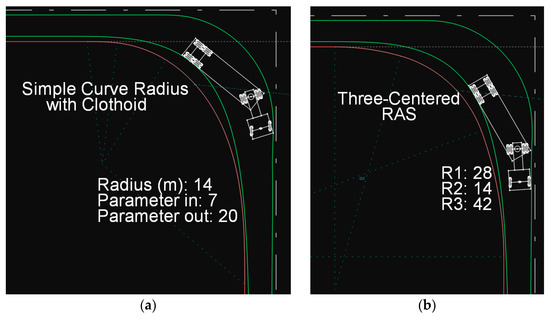
Figure 15.
Path of the WB-12 vehicle (a) on a simple circular arc with clothoid transitions, (b) on a three-radius RAS curve.
3.4.2. Interstate Semitrailer (WB-19) Design Vehicle
For the WB-19 design vehicle, the values used in the Green Book figures were selected rather than those recommended in the tables. This decision was made because the table values proved to be unsuitable, as their application resulted in less than 20 cm lateral distance between the vehicle’s trajectory and the edge of the traveled way. The final selected values, along with the trajectory of the design vehicle for both the symmetric and asymmetric AASHTO curves, are shown in Figure 16.
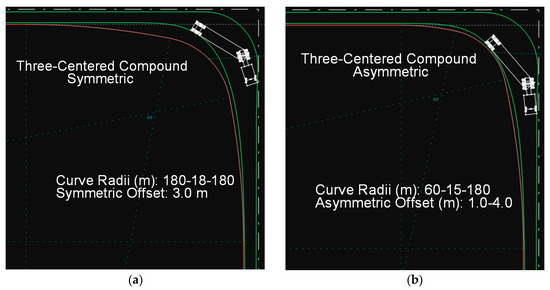
Figure 16.
Path of the WB-19 vehicle on a symmetric (a) and an asymmetric (b) AASHTO curve.
The solutions involving a simple circular arc with clothoid transitions and the three-radius RAS curve (Figure 17) do not appear to be as effective, as both cases result in excessive pavement surface area.
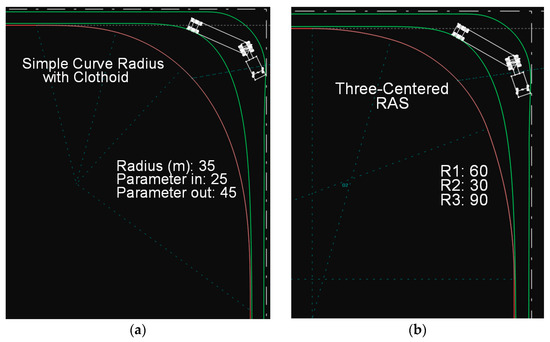
Figure 17.
Path of the WB-19 vehicle: (a) on a simple circular arc with clothoid transitions, (b) on a three-radius RAS curve.
3.4.3. Interstate Semitrailer (WB-20) Design Vehicle
The recommended guideline values for the minimum design of the edge of the traveled way are found to be satisfactory. In the case of the asymmetric AASHTO curve, the edge closely follows the path of the WB-20 vehicle, but in the case of the symmetric AASHTO curve, more pavement surface area is necessary (Figure 18).
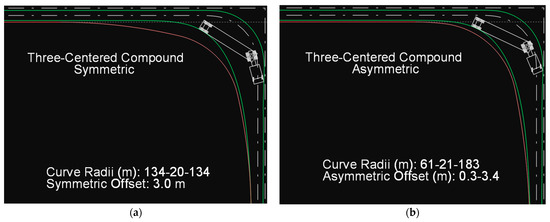
Figure 18.
Path of the WB-20 vehicle on a symmetric (a) and an asymmetric (b) AASHTO curve.
The solutions involving a simple circular arc with clothoid transitions and the three-radius RAS curve do not appear to be as effective, as both cases result in excessive pavement surface area (Figure 19).
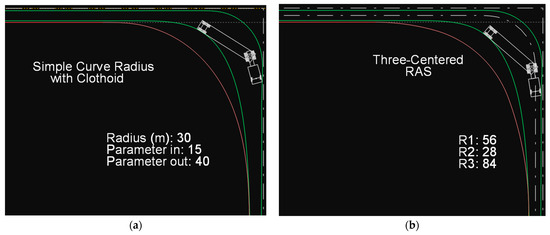
Figure 19.
Path of the WB-20 vehicle: (a) on a simple circular arc with clothoid transitions, (b) on a three-radius RAS curve.
3.5. Minimum Values for Rocky Mountain Double-Trailer Combination (WB-28D) Design Vehicle
The recommended guideline values for the minimum design of the edge of the traveled way are found to be quite satisfactory in the case of the symmetric and asymmetric AASHTO curves, as the edge closely follows the path of the WB-28D vehicle, especially in the case of the asymmetric curve (Figure 20).
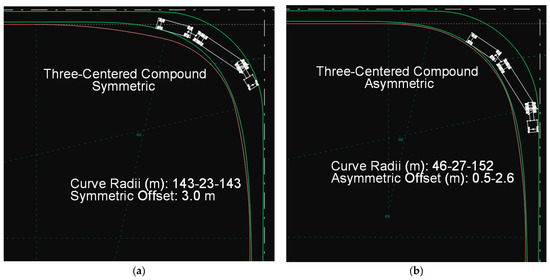
Figure 20.
Path of the WB-28D vehicle on a symmetric (a) and an asymmetric (b) AASHTO curve.
As with the previously examined long design vehicles, the simple circular arc with clothoid transitions and the three-radius RAS curve do not offer any comparative advantage over the AASHTO curves. In fact, in the case of the clothoid, a notable issue arises from the need for a large parameter value at the exit clothoid, which results in a disproportionately long exit transition compared to the circular arc and the entry clothoid.
Certainly, the above methods (clothoids and RAS) could be utilized at the design level; however, for the purposes of this study—namely, the determination of the minimum design value for the edge of the traveled way—they are considered inefficient and less effective compared to the solutions already provided in the American guidelines. Figure 21 illustrates these two cases with their respective recommended values.
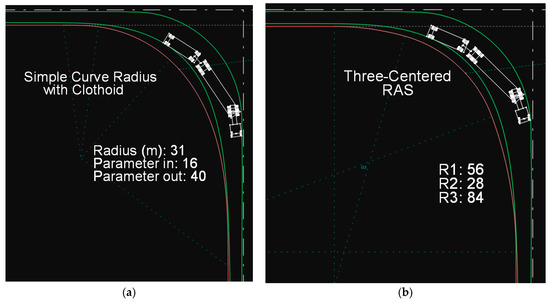
Figure 21.
Path of the WB-28D vehicle: (a) on a simple circular arc with clothoid transitions on both ends, (b) on a three-radius RAS curve.
3.6. Minimum Values for Triple-Trailer Combination (WB-30T) Design Vehicle
The recommended guideline values for the minimum design of the edge of the traveled way are found to be quite satisfactory in the case of the symmetric and asymmetric AASHTO curves, as the edge closely follows the path of the WB-30T vehicle, especially in the case of the asymmetric curve (Figure 22).
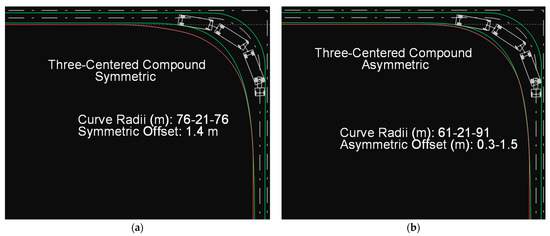
Figure 22.
Path of the WB-30T vehicle on a symmetric (a) and an asymmetric (b) AASHTO curve.
Similar to the previously examined long design vehicles, the simple circular arc with clothoid transitions and the three-radius RAS curve do not offer any comparative advantage over the AASHTO curves. In fact, in the case of the clothoid, an issue arises from the need for a larger parameter value at the exit clothoid compared to the entry clothoid, which results in a disproportionately long exit transition compared to the circular arc and the entry clothoid.
Certainly, the above methods (clothoids and RAS) could be utilized at the design level; however, for the purposes of this study—namely, the determination of the minimum design value for the edge of the traveled way—they are considered again inefficient and less effective (although less than in previous cases) compared to the solutions already provided in the American guidelines. Figure 23 illustrates these two cases with their respective recommended values.
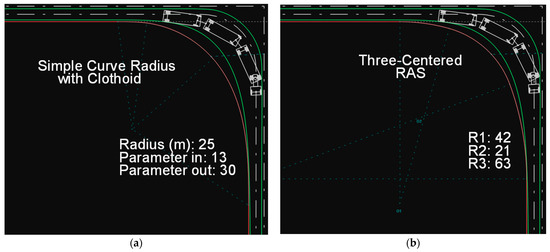
Figure 23.
Path of the WB-30T vehicle: (a) on a simple circular arc with clothoid transitions on both ends, (b) on a three-radius RAS curve.
3.7. Minimum Values for Turnpike Double Combination (WB-33D) Design Vehicle
Similar results are observed for the WB-33D design vehicle as well, which is, in fact, the longest vehicle included in the AASHTO Green Book (33.28 m). In the following figure (Figure 24), it is clearly shown that the optimal solution for the minimum design value is the asymmetric three-center compound curve, based on the American standards and the corresponding recommended guideline values.
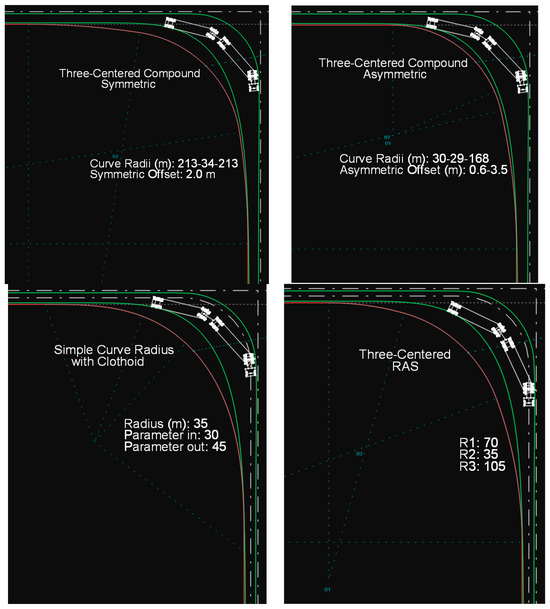
Figure 24.
Path of the WB-33D vehicle on various curves.
3.8. Summary Tables of Design Values
Table 1 and Table 2 present in detail all the values used above for each method of edge-of-traveled-way design.

Table 1.
Summary table of minimum design values for the edge of the traveled way (from AASHTO).

Table 2.
Summary table of minimum design values for the edge of the traveled way (from the present study).
Additionally, Table 3 presents the values used for the geometry of the steering axis curve of each design vehicle. The methodology used to construct the steering axis consists of a simple circular arc with clothoid transitions at both ends. It should be emphasized once again that the steering axis curve for each vehicle was designed in such a way that the vehicle’s steering angle closely approaches the maximum steering angle of the respective design vehicle.

Table 3.
Design values of the curve of each design vehicle’s steering axis (from the present study).
4. Results and Discussion
Following the comparison of the methods applied in this research for determining the minimum design values of the edge of the traveled way at right-angle turning movements in at-grade intersections, the results are as follows:
- For the design vehicles defined by the American guidelines—namely the P (passenger car) and SU-9 (single-unit truck) types—it was found that the three-radius RAS curve is the method that best fits the inner envelope of the vehicle paths. This curve configuration not only minimizes the required pavement area but also maintains the desired safety clearance between the edge of the traveled way and the inner envelope of the path (60 cm).
- For the remaining design vehicles analyzed in this paper, it was concluded that the asymmetric AASHTO curve, using the recommended values from the AASHTO Green Book, is the most effective solution based on the corresponding vehicle trajectories. This is because it results in the minimum pavement surface area among the evaluated methods, while maintaining the required clearance between the vehicle’s inner envelope and the edge of the traveled way within the limits specified by the American guidelines (20–60 cm).
- In all cases, the trajectories of the design vehicles used in the simulations were derived based on the sharpest turn each vehicle could perform at speeds equal to or less than 15 km/h. This is achieved when the radius of the vehicle’s steering path closely approaches its minimum turning radius. As a result, the vehicle trajectories and their corresponding envelopes represent the minimum possible design envelopes for each vehicle type.
5. Recommendations for Practice and Future Research
- Incorporate clothoid options for intersection corner design in national guidance.
- Enhance CAD/road design tooling for clothoid generation and automated envelope checks.
- Extend analyses to non-right-angle turns, multilane turns, and field validation using observed trajectories.
6. Limitations
The study focused on right-angle turns at low speeds and relied on simulated trajectories rather than field-measured paths. It did not account for dynamic vehicle behavior or driver variability. Implementation of clothoids may be constrained where design software or standards lack explicit support.
Author Contributions
Conceptualization, G.K.; methodology, G.K. and P.L.; software, G.K., P.L. and G.P.; validation, G.K., P.L., A.G. and N.E.; formal analysis, G.P. and A.G.; investigation, G.P., P.L. and A.G.; resources, G.K. and G.P.; data curation, P.L.; writing—original draft preparation, A.G.; writing—review and editing, P.L.; visualization, G.P.; supervision, G.K., P.L. and N.E. All authors have read and agreed to the published version of the manuscript.
Funding
This research received no external funding.
Institutional Review Board Statement
Not applicable.
Informed Consent Statement
Not applicable.
Data Availability Statement
Data supporting reported results can be found, by following the link: https://ir.lib.uth.gr/xmlui/bitstream/handle/11615/81552/26906.pdf?sequence=4&isAllowed=y (accessed on 1 November 2025).
Acknowledgments
During the preparation of this manuscript/study, the author(s) used ChatGPT-5 for translation purposes and for correcting grammar and syntax errors. The authors have reviewed and edited the output and take full responsibility for the content of this publication.
Conflicts of Interest
The authors declare no conflicts of interest.
Abbreviations
The following abbreviations are used in this manuscript:
| P | Passenger car |
| SU | Single unit |
| WB | WheelBase |
References
- AASTHO. The Green Book, a Policy on Geometric Design of Highways and Streets, 6th ed.; American Association of State Highway and Transportation Officials: Washington, DC, USA, 2011. [Google Scholar]
- FGSV. Richtlinien für die Anlage von Straßen (RAS) Teil: Knotenpunkte (RAS-K) Abschnitt 1: Plangleiche Knotenpunkte RAS-K-1. 1988. Available online: https://www.scribd.com/document/871741520/RAS-K-Richtlinie-Fur-Die-Anlage-Von-Stra%C3%9Fen-Teil-Knotenpunkte (accessed on 1 November 2025).
- Erkert, T.W.; Sessions, J.; Layton, R.D. A Method for Determining Offtracking of Multiple Unit Vehicle Combinations. J. For. Eng. 1989, 1, 9–16. [Google Scholar] [CrossRef]
- Chen, Y.; Chua, E.S.; Thalmann, D.; Cai, Y.; Gong, Y.; Lim, T.S.; Wong, P. Long Vehicle Turning, In Simulations, Serious Games and Their Applications. Gaming Media and Social Effects; Cai, Y., Goei, S., Eds.; Springer: Singapore, 2014; pp. 85–103. [Google Scholar] [CrossRef]
- Leisch, J.P.; Carrasco, M. Design Vehicles: From Turning Templates to Smart Systems. In Proceedings of the 2014 Transportation Association of Canada Conference, Montreal, QC, Canada, 28 September–1 October 2014; Available online: http://conf.tac-atc.ca/english/annualconference/tac2014/s-30/leisch.pdf (accessed on 1 November 2025).
- Savoy Computing Services Limited. User Manual for AutoTrack: Advanced Vehicle Swept Path Analysis; Savoy Computing Services Limited: Norwich, UK, 2008. [Google Scholar]
- Anadelta Software. Anadelta Tessera, Manual. Available online: https://www.anadelta.com/en/ (accessed on 1 November 2025).
- Transoft Solutions. AutoTURN User’s Guide, Version 5.1; Transoft Solutions: Vancouver, BC, Canada, 2006.
- Dragčević, V.; Korlaet, Ž.; Stančerić, I. Methods for Setting Road Vehicle Movement Trajectories. Balt. J. Road Bridge Eng. 2008, 3, 57–64. [Google Scholar] [CrossRef]
- Berman, R.; Benade, R.; Rosman, B. Autonomous prediction of performance-based standards for heavy vehicles. In Proceedings of the 2015 Pattern Recognition Association of South Africa and Robotics and Mechatronics International Conference (PRASA-RobMech), Port Elizabeth, South Africa, 26–27 November 2015; pp. 184–188. [Google Scholar] [CrossRef]
- De Saxe, C.C.; Berman, R. GeoTrack: An efficient simulation tool for the analysis of heavy vehicle manoeuvrability. In Proceedings of the 37th Annual Southern African Transport Conference (SATC 2018), Pretoria, South Africa, 9–12 July 2018; Available online: https://repository.up.ac.za/items/b06b5748-effa-410a-b81b-197ae040a23c (accessed on 1 November 2025).
- Saha, U. A Swept Path Analysis of Intersection Designs for Long Combination Vehicles. Master’s Thesis, Graduate Program in Civil Engineering. York University, Toronto, ON, Canada, 2021. Available online: https://yorkspace.library.yorku.ca/items/8a4bd4a9-5e75-463e-b998-d111ae479c4b (accessed on 1 November 2025).
- Stančerić, I.; Korlaet, Ž.; Dragčević, V. New design procedure for four-leg channelized intersections. GRAĐEVINAR 2017, 69, 257–266. [Google Scholar] [CrossRef]
- Levien, R. The Euler Spiral: A Mathematical History. EECS Department, University of California, Berkeley, Technical Report No. UCB/EECS-2008-111. 2 September 2008. Available online: https://www2.eecs.berkeley.edu/Pubs/TechRpts/2008/EECS-2008-111.html (accessed on 1 November 2025).
- Marzbani, H.; Jazar, R.N.; Fard, M. Better Road Design Using Clothoids. In Sustainable Automotive Technologies 2014. Lecture Notes in Mobility; Denbratt, I., Subic, A., Wellnitz, J., Eds.; Springer: Cham, Switzerland, 2015; pp. 25–40. [Google Scholar] [CrossRef]
- Kaliabetsos, G. Algorithm Development and Optimization for Road/Railway Alignment Design. Ph.D. Thesis, University of Thessaly, Department of Civil Engineering, Volos, Greece, 2018. Available online: https://www.didaktorika.gr/eadd/handle/10442/43652?locale=en (accessed on 1 November 2025).
- Basak, A. The Study of Geometry of the Selected Transition Curves in the Design of Circular Roads. Adv. Sci. Technol. Res. J. 2022, 16, 270–278. [Google Scholar] [CrossRef]
- Casal, G.; Santamarina, D.; Vázquez-Méndez, M.E. Optimization of horizontal alignment geometry in road design and reconstruction. Transp. Res. Part C Emerg. Technol. 2017, 74, 261–274. [Google Scholar] [CrossRef]
- Imanov, A.; Khalilov, I.; Aliyev, A. Construction and optimization of transition curves on roads with software program. EUREKA Phys. Eng. 2025, 4, 67–76. [Google Scholar] [CrossRef]
Disclaimer/Publisher’s Note: The statements, opinions and data contained in all publications are solely those of the individual author(s) and contributor(s) and not of MDPI and/or the editor(s). MDPI and/or the editor(s) disclaim responsibility for any injury to people or property resulting from any ideas, methods, instructions or products referred to in the content. |
© 2025 by the authors. Licensee MDPI, Basel, Switzerland. This article is an open access article distributed under the terms and conditions of the Creative Commons Attribution (CC BY) license (https://creativecommons.org/licenses/by/4.0/).