
Evaluating Signal Systems Using Automated Traffic Signal Performance Measures


Abstract
:1. Introduction
2. Literature Review
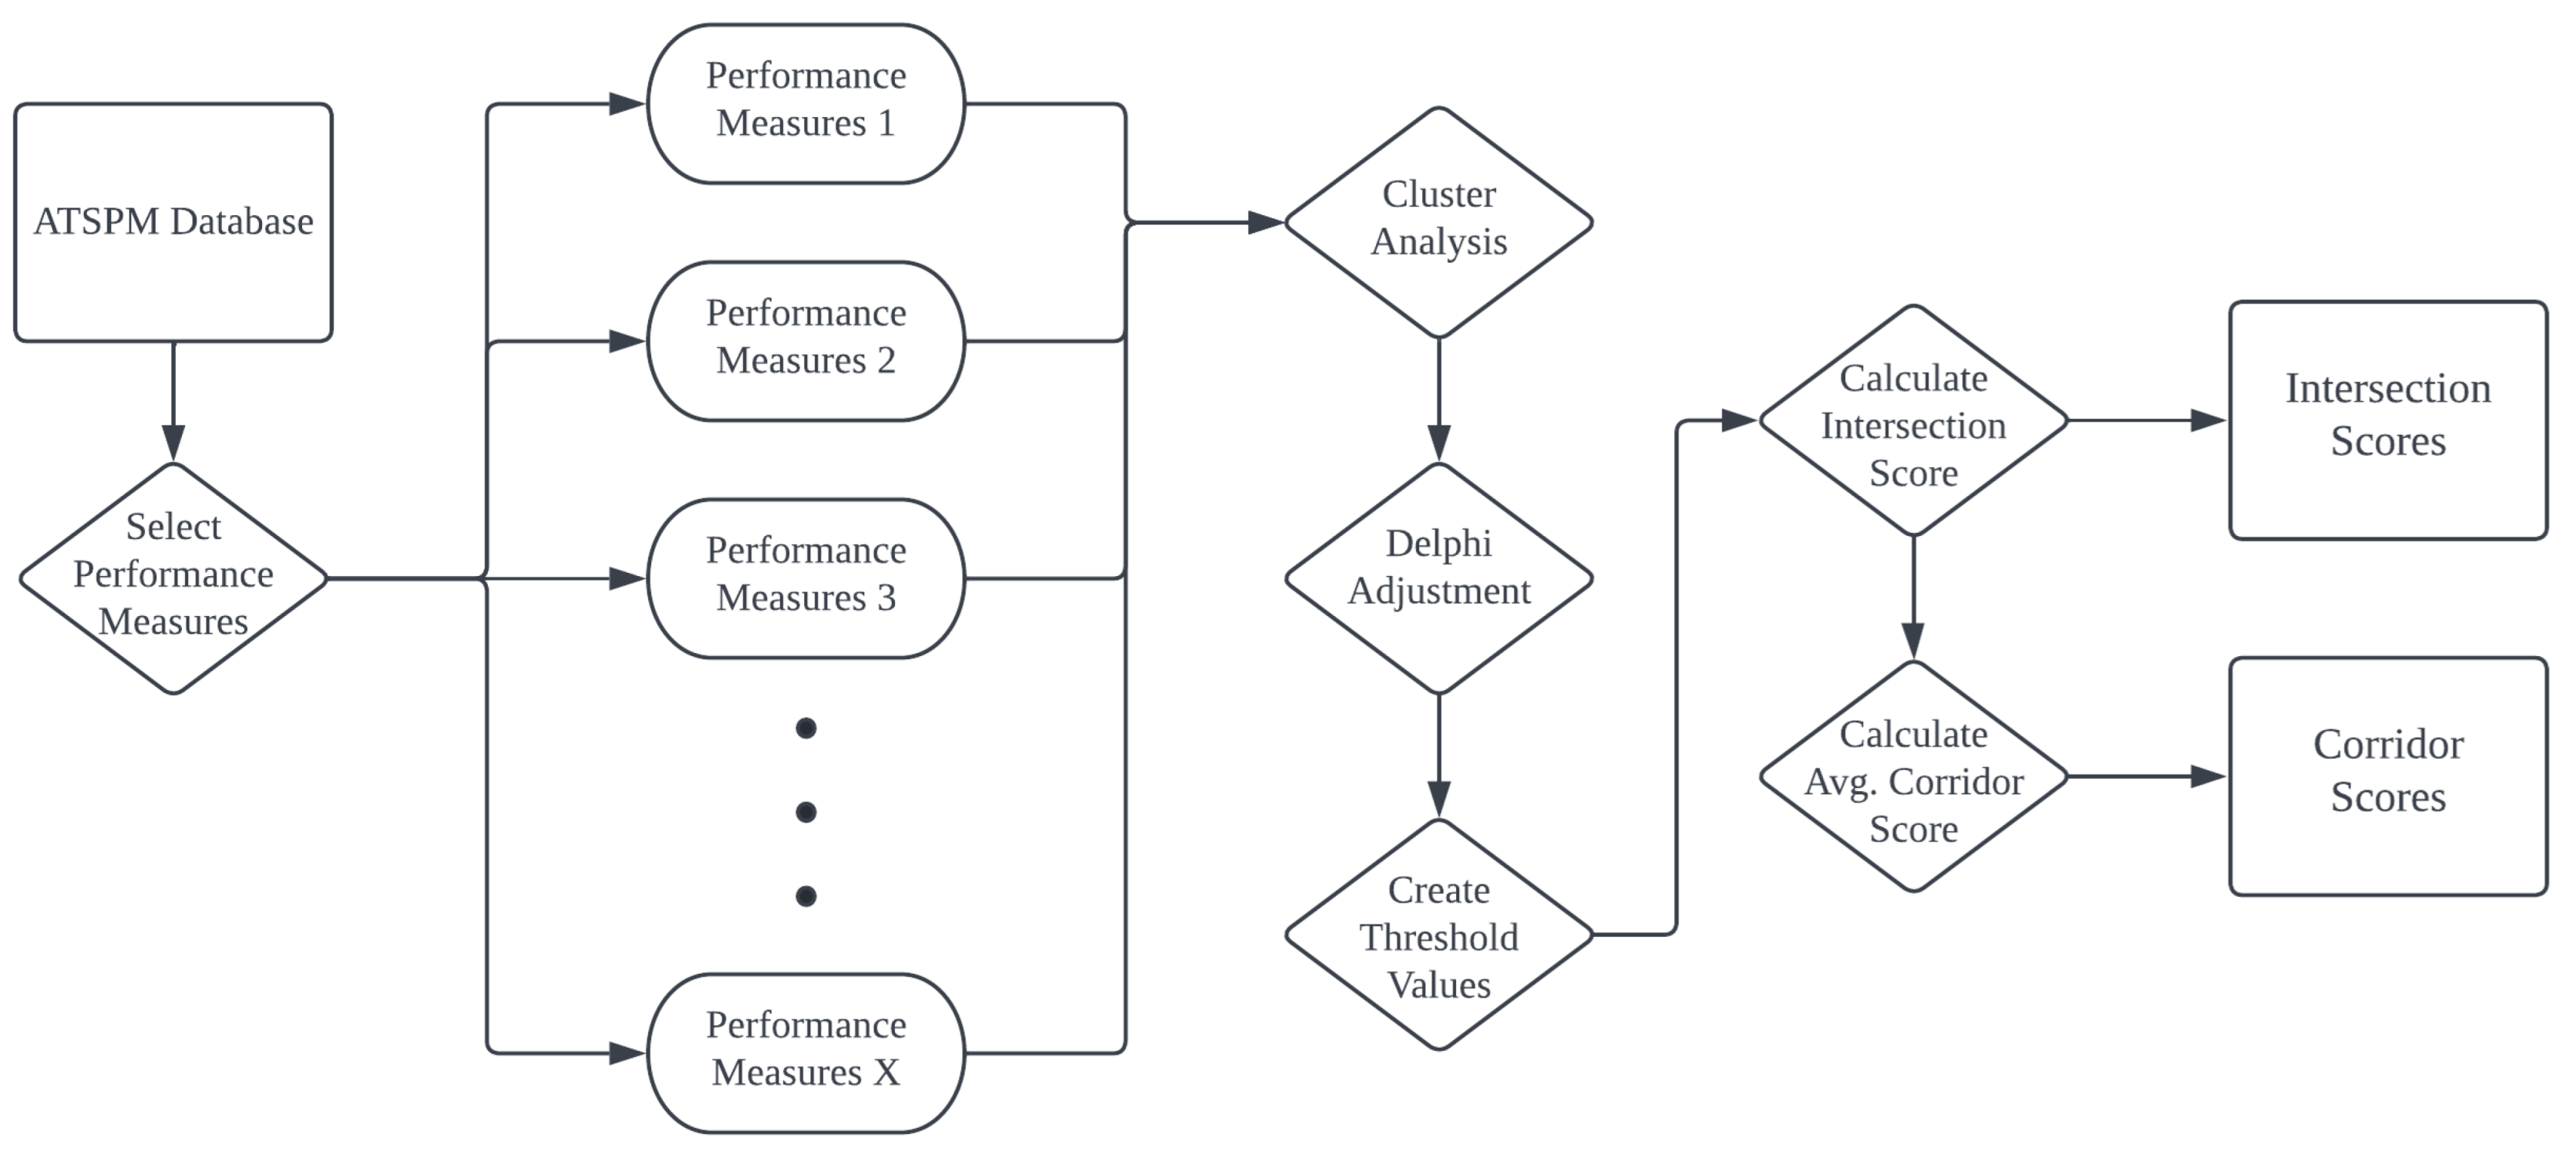
3. Methodology
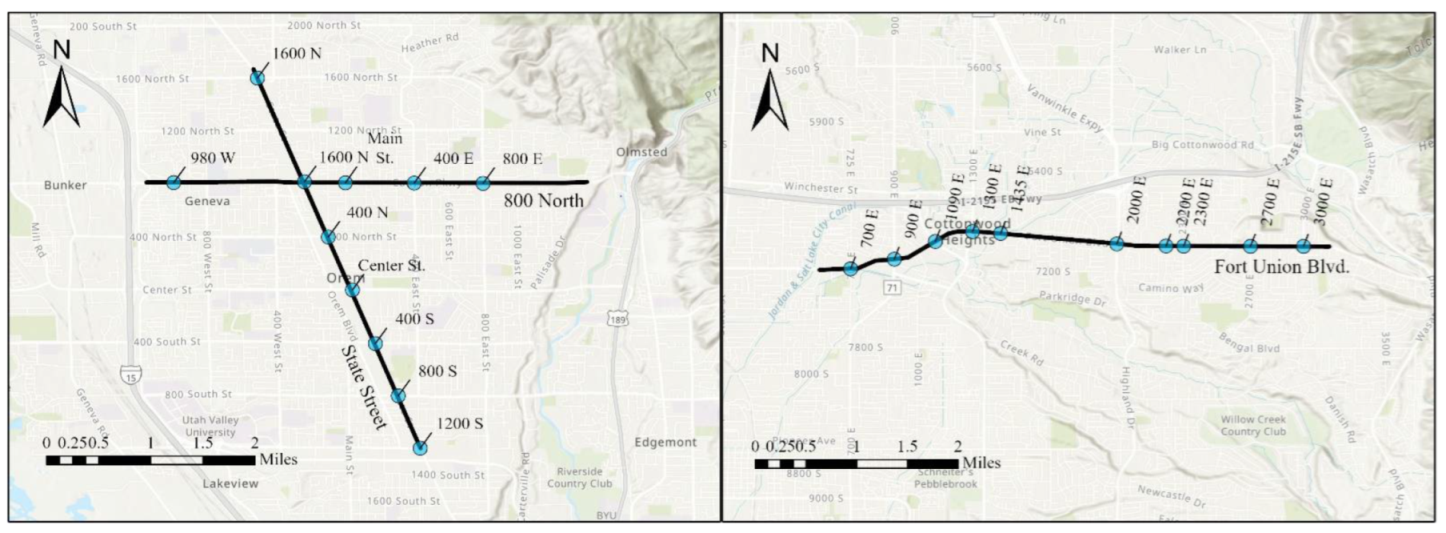
3.1. Study Data
3.2. UDOT ATSPM
- = platoon ratio;
- = percentage of vehicles arriving during the effective green;
- = effective green time;
- = cycle length.
- = percent of vehicle arrivals on green in a 15 min bin;
- = number of vehicle arrivals on green in a 15 min bin;
- = number of vehicle arrivals on yellow in a 15 min bin;
- = total number of vehicle arrivals in a 15 min bin.
- = number of vehicles that failed to pass the intersection in each cycle;
- = number of vehicles that failed to pass the intersection in a 15 min bin;
- = number of signal cycles in a 15 min bin.
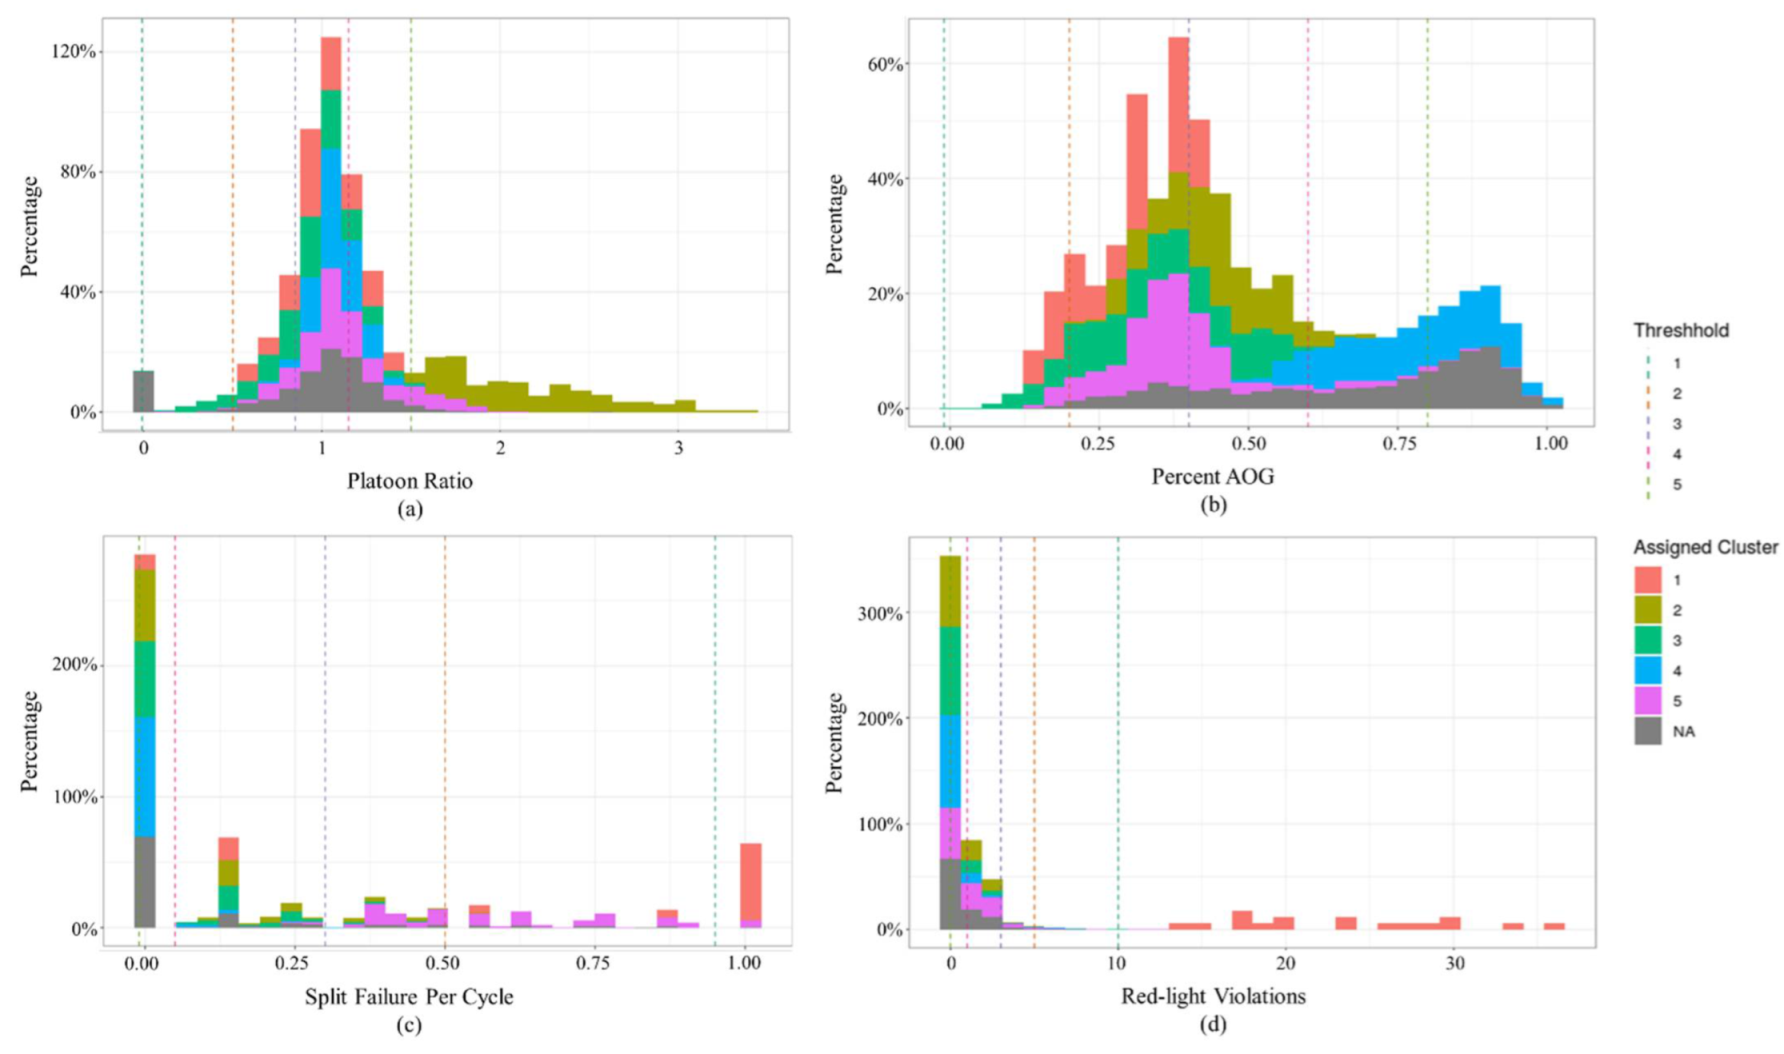
3.3. Threshold Development
- Select random points in -dimensional space as initial “mean points”;
- Calculate the “distance” between each data point and each mean point;
- Calculate a new mean point as the average of the points closest to each existing mean;
- Calculate the mean squared error for points associated with each new mean;
- Iterate steps 2 through 4 until the change in mean squared error between iterations drops below a specified tolerance level.
3.4. Combining Threshold Scores to Intersections and Corridors
- Defining performance measures and value-relevant attributes;
- Evaluating each performance measure separately on each attribute;
- Assigning relative weights to the performance measures;
- Aggregating the weights of the attribute and single-attribute evaluations of the performance measures to obtain an overall evaluation of the performance measures;
- Perform sensitivity analyses and make recommendations.
- = adjusted weight for split failures;
- = weight for platoon ratio;
- = weight for arrivals on green;
- = weight for split failures;
- = weight for red-light violations.
- = combined score for intersection in period ;
- = threshold score for each individual measure included in the ATSPMs for intersection in period .
4. Application
4.1. Threshold Values
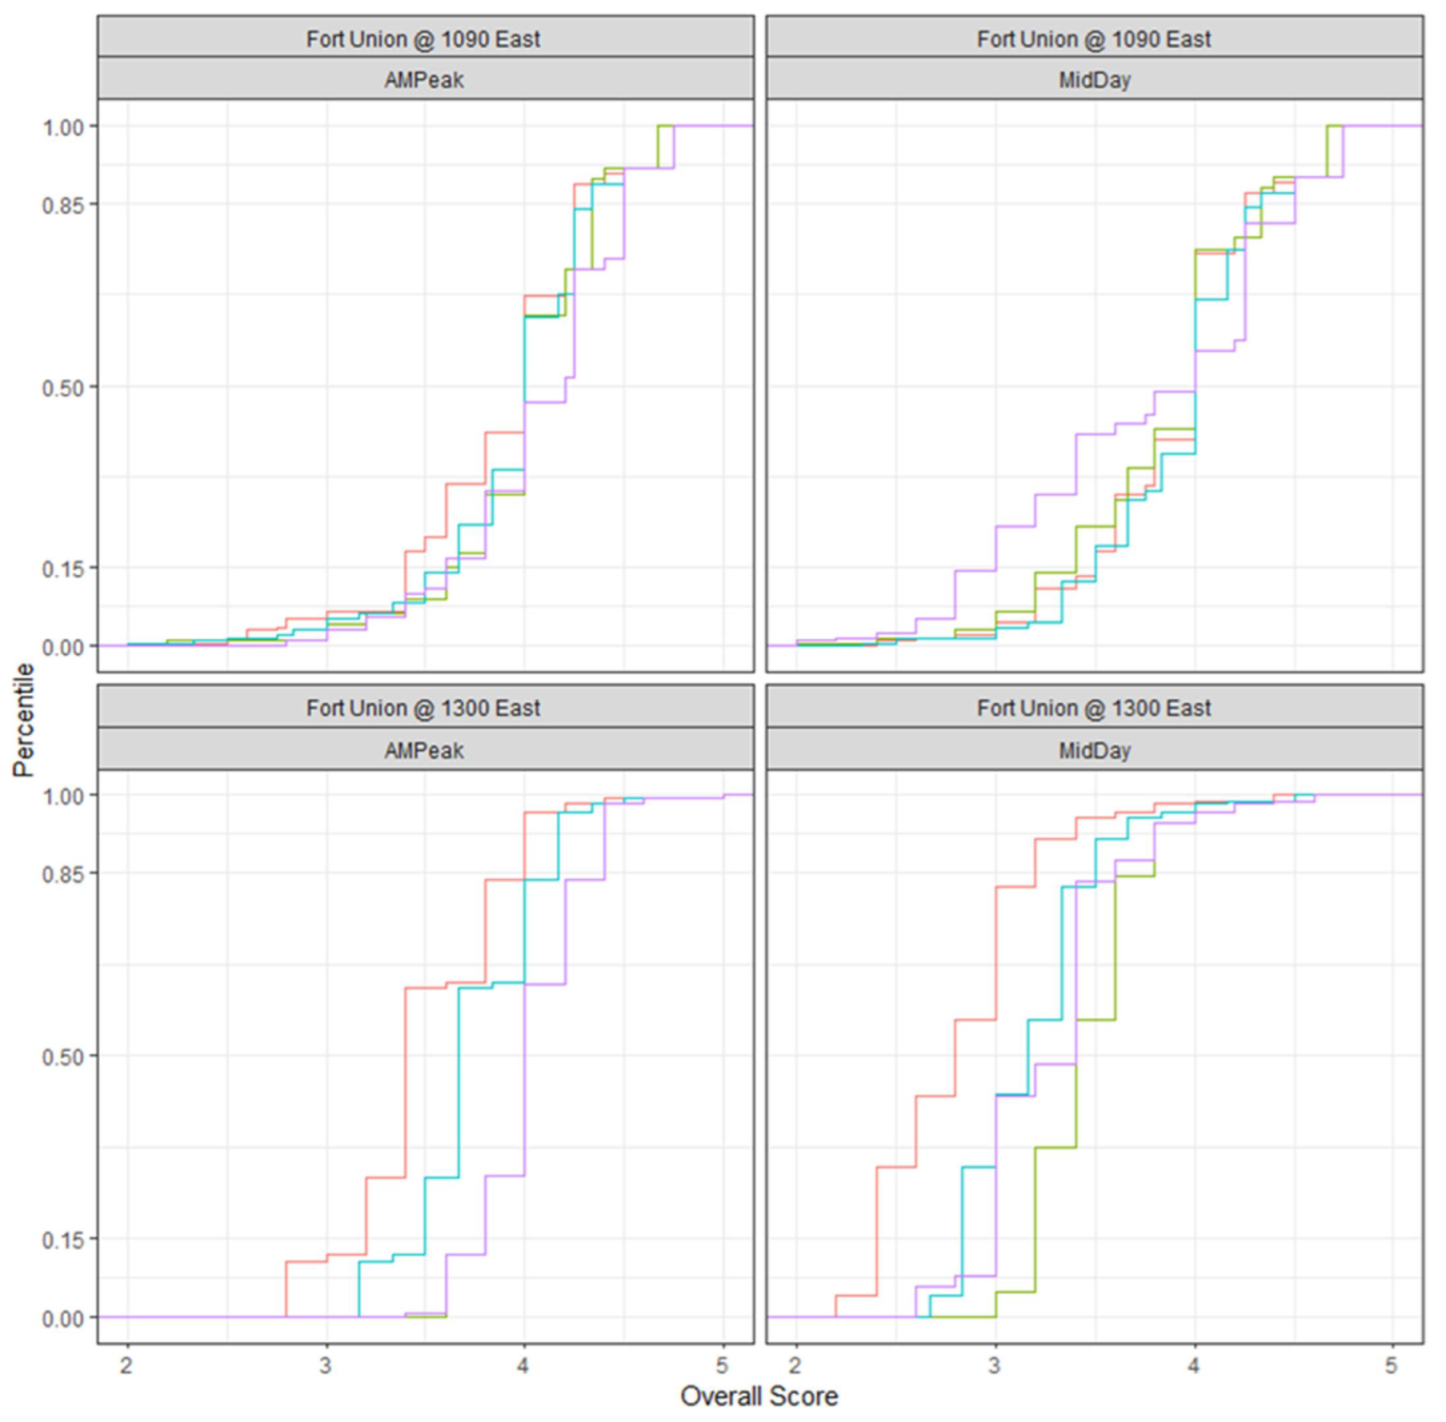
4.2. Application to Intersections
4.3. Aggregation to Corridors
5. Discussion
6. Conclusions
Author Contributions
Funding
Institutional Review Board Statement
Informed Consent Statement
Acknowledgments
Conflicts of Interest
References
- Bullock, D.M.; Clayton, R.; Mackey, J.; Misgen, S.; Stevens, A.L. Helping Traffic Engineers Manage Data to Make Better Decisions: Automated Traffic Signal Performance Measures. ITE J. 2014, 84, 33–39. [Google Scholar]
- Utah Department of Transportation (UDOT). ATSPM Frequently Asked Questions. Available online: https://udottraffic.utah.gov/ATSPM/FAQs/Display (accessed on 1 July 2022).
- Lattimer, C.R.; America, A.N. Automated Traffic Signals Performance Measures; Publication FWHA-HOP-20-002; U.S. Department of Transportation; Federal Highway Administration: Washington, DC, USA, 2020. [Google Scholar]
- Smaglik, E.J.; Sharma, A.; Bullock, D.M.; Sturdevant, J.R.; Duncan, G. Event-Based Data Collection for Generating Actuated Controller Performance Measures. Transp. Res. Rec. J. Transp. Res. Board 2007, 2035, 97–106. [Google Scholar] [CrossRef] [Green Version]
- Day, C.M.; Bullock, D.M.; Li, H.; Remias, S.M.; Hainen, A.M.; Freije, R.S.; Stevens, A.L.; Sturdevant, J.R.; Brennan, T.M. Performance Measures for Traffic Signal Systems: An Outcome-Oriented Approach; Purdue University: West Lafayette, IN, USA, 2014. [Google Scholar] [CrossRef] [Green Version]
- Wu, X.; Liu, H.X. Using High-Resolution Event-Based Data for Traffic Modeling and Control: An Overview. Transp. Res. Part C Emerg. Technol. 2014, 24, 28–43. [Google Scholar] [CrossRef]
- Day, C.M.; Haseman, R.; Premachandra, H.; Brennan, T.M., Jr.; Wasson, J.S.; Sturdevant, J.R.; Bullock, D.M. Evaluation of Arterial Signal Coordination: Methodologies for Visualizing High-Resolution Event Data and Measuring Travel Time. Transp. Res. Rec. 2010, 2192, 37–49. [Google Scholar] [CrossRef]
- Blase, J.H. Computer Aids to Large-Scale Traffic Signal Maintenance. Traffic Eng. Control 1979, 20, 341–347. [Google Scholar]
- Parapar, S.M. Computerized Reporting for Traffic Signal Maintenance. Traffic Eng. 1973, 43, 47–51. [Google Scholar]
- Day, C.M.; Helt, R.; Sines, D.; Emtenan, A.M.T. Leveraging Sensor-Based Vehicle Position and Speed Information in Traffic Signal Control with Existing Infrastructure. In Proceedings of the IEEE Intelligent Transportation Systems Conference (ITSC), Auckland, New Zealand, 27–30 October 2019; pp. 4049–4054. [Google Scholar]
- Marcianò, F.A.; Musolino, G.; Vitetta, A. Signal Setting Design on a Road Network: Application of a System of Models in Evacuation Conditions. WIT Trans. Inf. Commun. Technol. 2010, 43, 443–454. [Google Scholar]
- Day, C.M.; Bullock, D.M. Arterial Performance Measures Volume 1: Performance Based Management of Arterial Traffic Signal Systems. Final Report, NCHRP 3-79A; Transportation Research Board: Washington, DC, USA, 2011. [Google Scholar]
- Haseman, R.; Day, C.M.; Bullock, D.M.; Using Performance Measures to Improve Signal System Performance. Indiana Local Technical Assistance Program (LTAP) Technical Reports. Paper 11. Available online: https://docs.lib.purdue.edu/inltaptechs/11 (accessed on 28 May 2020).
- Day, C.M.; Brennan, T.M.; Ernst, J.M.; Sturdevant, J.R.; Bullock, D.M. Procurement Procedures and Specifications for Performance Measure Capable Traffic Infrastructure Data Collection Systems; Publication FHWA/IN/JTRP-2011/18, Joint Transportation Research Program; Indiana Department of Transportation and Purdue University: West Lafayette, IN, USA, 2012. [Google Scholar]
- Sturdevant, J.R.; Overman, T.; Raamot, E.; Deer, R.; Miller, D.; Bullock, D.M.; Day, C.M.; Brennan, T.M.; Li, H.; Hainen, A.; et al. Indiana Traffic Signal Hi Resolution Data Logger Enumerations; Indiana Department of Transportation and Purdue University: West Lafayette, IN, USA, 2012. [Google Scholar]
- Federal Highway Administration (FHWA). Automated Traffic Signal Performance Measures (ATSPM). Available online: https://ops.fhwa.dot.gov/publications/fhwahop20002/index.htm (accessed on 1 July 2022).
- Georgia Department of Transportation (GDOT). SigOps Metrics. Available online: http://sigopsmetrics.com/main/ (accessed on 1 July 2022).
- Day, C.M.; O’Brien, P.; Stevanovic, A.; Hale, D.; Matout, N. A Methodology and Case Study: Evaluating the Benefits and Costs of Implementing Automated Traffic Signal Performance; Publication FHWA-HOP-20-003; FHWA and U.S. Department of Transportation; Federal Highway Administration: Washington, DC, USA, 2020. [Google Scholar]
- Davis, A. Focused Operations: Measuring Arterial Performance Using Automated Traffic Signal Performance Measures. I-95 Corridor Coalition. Available online: https://i95coalition.org/wp-content/uploads/2017/05/I-95CC-Signal_PM-Coalition_Slides-ver11-Compiled.pdf?x70560 (accessed on 8 February 2022).
- Lavrenz, S.; Sturdevant, J.; Bullock, D.M. Strategic Methods for Modernizing Traffic Signal Maintenance Management and Quantifying the Impact of Maintenance Activities. J. Infrastruct. Syst. 2017, 23, 05017004. [Google Scholar] [CrossRef]
- Highway Capacity Manual (HCM). Transportation Research Board; National Research Council: Washington, DC, USA, 2010; p. 1207. [Google Scholar]
- Day, C.M.; Li, H.; Sturdevant, J.R.; Bullock, D.M. Data-driven Ranking of Coordinated Traffic Signal Systems for Maintenance and Retiming. Transp. Res. Rec. 2018, 2672, 167–178. [Google Scholar] [CrossRef]
- Smaglik, E.J.; Bullock, D.M.; Sharma, A. Pilot Study on Real-time Calculation of Arrival Type for Assessment of Arterial Performance. J. Transp. Eng. 2007, 133, 415–422. [Google Scholar] [CrossRef] [Green Version]
- Gettman, D.; Folk, E.; Curtis, E.; Ormand, K.K.D.; Mayer, M.; Flanigan, E. Measures of Effectiveness and Validation Guidance for Adaptive Signal Control Technologies; Publication FHWA-HOP-13-03; U.S. Department of Transportation; Federal Highway Administration: Washington, DC, USA, 2013. [Google Scholar]
- Wong, M.A.; Hartigan, J.A. Algorithm AS 136: A K-means Clustering Algorithm. Journal of the Royal Statistical Society. Ser. C Appl. Stat. 1979, 28, 100–108. [Google Scholar]
- Chang, W.; Cheng, J.; Allaire, J.; Xie, Y.; McPherson, J. Shiny: Web Application Framework for R. R Package Version 1.4. 0. 2019. Available online: https://CRAN.R-project.org/package=shiny (accessed on 23 June 2022).
- R Core Team. R: A Language and Environment for Statistical Computing. R Foundation for Statistical Computing. Vienna, Austria. Available online: https://www.R-project.org (accessed on 27 February 2022).
- Gupta, U.G.; Clarke, R.E. Theory and Applications of the Delphi Technique: A Bibliography (1975–1994). Technol. Forecast. Soc. Change 1996, 53, 185–211. [Google Scholar] [CrossRef]
- Cavalli-Sforza, V.; Ortolano, L. Delphi Forecasts of Land Use: Transportation Interactions. J. Transp. Eng. 1984, 110, 324–339. [Google Scholar] [CrossRef]
- Schultz, G.G.; Jensen, A.P. Evaluation and Installation Guidelines for Advance Warning Signal Systems. IET Intell. Transp. Syst. 2009, 3, 247–256. [Google Scholar] [CrossRef] [Green Version]
- Schultz, G.G.; Macfarlane, G.S.; Wang, B.; McCuen, S. Evaluating the Quality of Signal Operations Using Signal Performance Measures; Report No. UT-20.08; UDOT Research & Innovation Division: Salt Lake City, UT, USA, 2020. [Google Scholar]
- Jansen, S.J. The Multi-Attribute Utility Method. In The Measurement and Analysis of Housing Preference and Choice; Springer: Berlin/Heidelberg, Germany, 2011; pp. 101–125. [Google Scholar]
- Belgiu, M.; Drăguţ, L. Random Forest in Remote Sensing: A Review of Applications and Future Directions. ISPRS J. Photogramm. Remote Sens. 2016, 114, 24–31. [Google Scholar] [CrossRef]
- Sasirekha, K.; Baby, P. Agglomerative Hierarchical Clustering Algorithm-a. Int. J. Sci. Res. Publ. 2013, 83, 83. [Google Scholar]
- Musolino, G.; Rindone, C.; Vitetta, A. Evaluation in Transport Planning: A Comparison between Data Envelopment Analysis and Multi-Criteria Decision Making Methods. In Proceedings of the 31st Annual European Simulation and Modelling Conference, Lisbon, Portugal, 25–27 October 2017. [Google Scholar]

| Metric/Tool | Definition | Performance Measure(s) |
|---|---|---|
| Purdue Phase Termination (PPT) | Evaluating performance measures by plotting the controller’s phases and the reason the phase terminated | Force off, gap out, max out, and pedestrian activity |
| Split Monitor | Analysis generates separate plots for each phase of the controller indicating how much split time is being used for each phase | Programmed split, gap out, max out, force off, and pedestrian activity |
| Pedestrian Delay | Depicts the delay, in minutes, associated with each pedestrian actuation | Pedestrian actuations and delay time |
| Preemption Details | Identifies preemption events that might occur at a signal | Preempt request |
| Purdue Split Failure (PSF) | Calculates the percent of time that the stop bar detectors are occupied during the green phase and during the first 5 s of red | Split failure, green/red occupancy ratio, and percent failure |
| Yellow and Red Actuations | Plots vehicle arrivals during the yellow and red intervals of an intersection’s phasing, where the speed of the vehicle is interpreted to be too fast to stop before entering the intersection | Red time, red clearance, yellow change, and detector activation |
| Turning Movement Counts | Generates traffic volume for each lane on an approach | Total volume by direction |
| Approach Volume | Uses advanced detection (generally 300 feet to 500 feet upstream of the stop bar) to count vehicles for the approach | Approach volume and D-factor |
| Approach Delay | Plot approach delay experienced by vehicles approaching and entering the intersection | Approach delay and approach delay per vehicle |
| Arrivals on Red | Plots both the volume and percentage of vehicles arriving on red for those phases where data are available | Arrivals on red and percent arrivals on red |
| Purdue Coordination Diagram (PCD) | Plots vehicle arrivals against the current movement (i.e., green, yellow, and red) and traffic flow in vehicles per hour using the percentage of vehicles that arrive on green and the platoon ratio | Volume per hour; change to green, yellow, and red; arrivals on green; green time; platoon ratio |
| Approach Speed | This metric tracks the speed of vehicles approaching a signalized intersection for those phases where data are available | Average MPH, 85th percentile, 15th percentile, and posted speed |
| Threshold for Level Score | Platoon Ratio | Percent Arrivals on Green | Percent Split Failure | Red-Light Violations |
|---|---|---|---|---|
| 5 (Exceptional) | >1.50 | >0.80 | ≤0.05 | 0 |
| 4 (Favorable) | 1.15 ≤ 1.50 | 0.60 ≤ 0.80 | 0.05 ≤ 0.30 | 1.0–2.0 |
| 3 (Average) | 0.85 ≤ 1.15 | 0.40 ≤ 0.60 | 0.30 ≤ 0.50 | 3.0–4.0 |
| 2 (Unfavorable) | 0.50 ≤ 0.85 | 0.20 ≤ 0.40 | 0.50 ≤ 0.95 | 5.0–9.0 |
| 1 (Poor) | ≤0.50 | ≤0.20 | >0.95 | ≥10 |
Publisher’s Note: MDPI stays neutral with regard to jurisdictional claims in published maps and institutional affiliations. |
© 2022 by the authors. Licensee MDPI, Basel, Switzerland. This article is an open access article distributed under the terms and conditions of the Creative Commons Attribution (CC BY) license (https://creativecommons.org/licenses/by/4.0/).
Share and Cite
Wang, B.; Schultz, G.G.; Macfarlane, G.S.; McCuen, S. Evaluating Signal Systems Using Automated Traffic Signal Performance Measures. Future Transp. 2022, 2, 659-674. https://doi.org/10.3390/futuretransp2030036
Wang B, Schultz GG, Macfarlane GS, McCuen S. Evaluating Signal Systems Using Automated Traffic Signal Performance Measures. Future Transportation. 2022; 2(3):659-674. https://doi.org/10.3390/futuretransp2030036
Chicago/Turabian StyleWang, Bangyu, Grant G. Schultz, Gregory S. Macfarlane, and Sabrina McCuen. 2022. "Evaluating Signal Systems Using Automated Traffic Signal Performance Measures" Future Transportation 2, no. 3: 659-674. https://doi.org/10.3390/futuretransp2030036
APA StyleWang, B., Schultz, G. G., Macfarlane, G. S., & McCuen, S. (2022). Evaluating Signal Systems Using Automated Traffic Signal Performance Measures. Future Transportation, 2(3), 659-674. https://doi.org/10.3390/futuretransp2030036