
Investigating the Impact of Connected and Automated Vehicles on Signalized and Unsignalized Intersections Safety in Mixed Traffic


Abstract
:1. Introduction
- (1)
- To what extent can CAVs affect road safety if we use the same car following models?
- (2)
- To what extent can CAVs affect road safety if we use different car following models for CAVs and HDVs?
2. Literature Review
2.1. Previous Studies on the Effect of CAVs on Safety
2.2. Car Following Models and Networks Used in Previous Studies
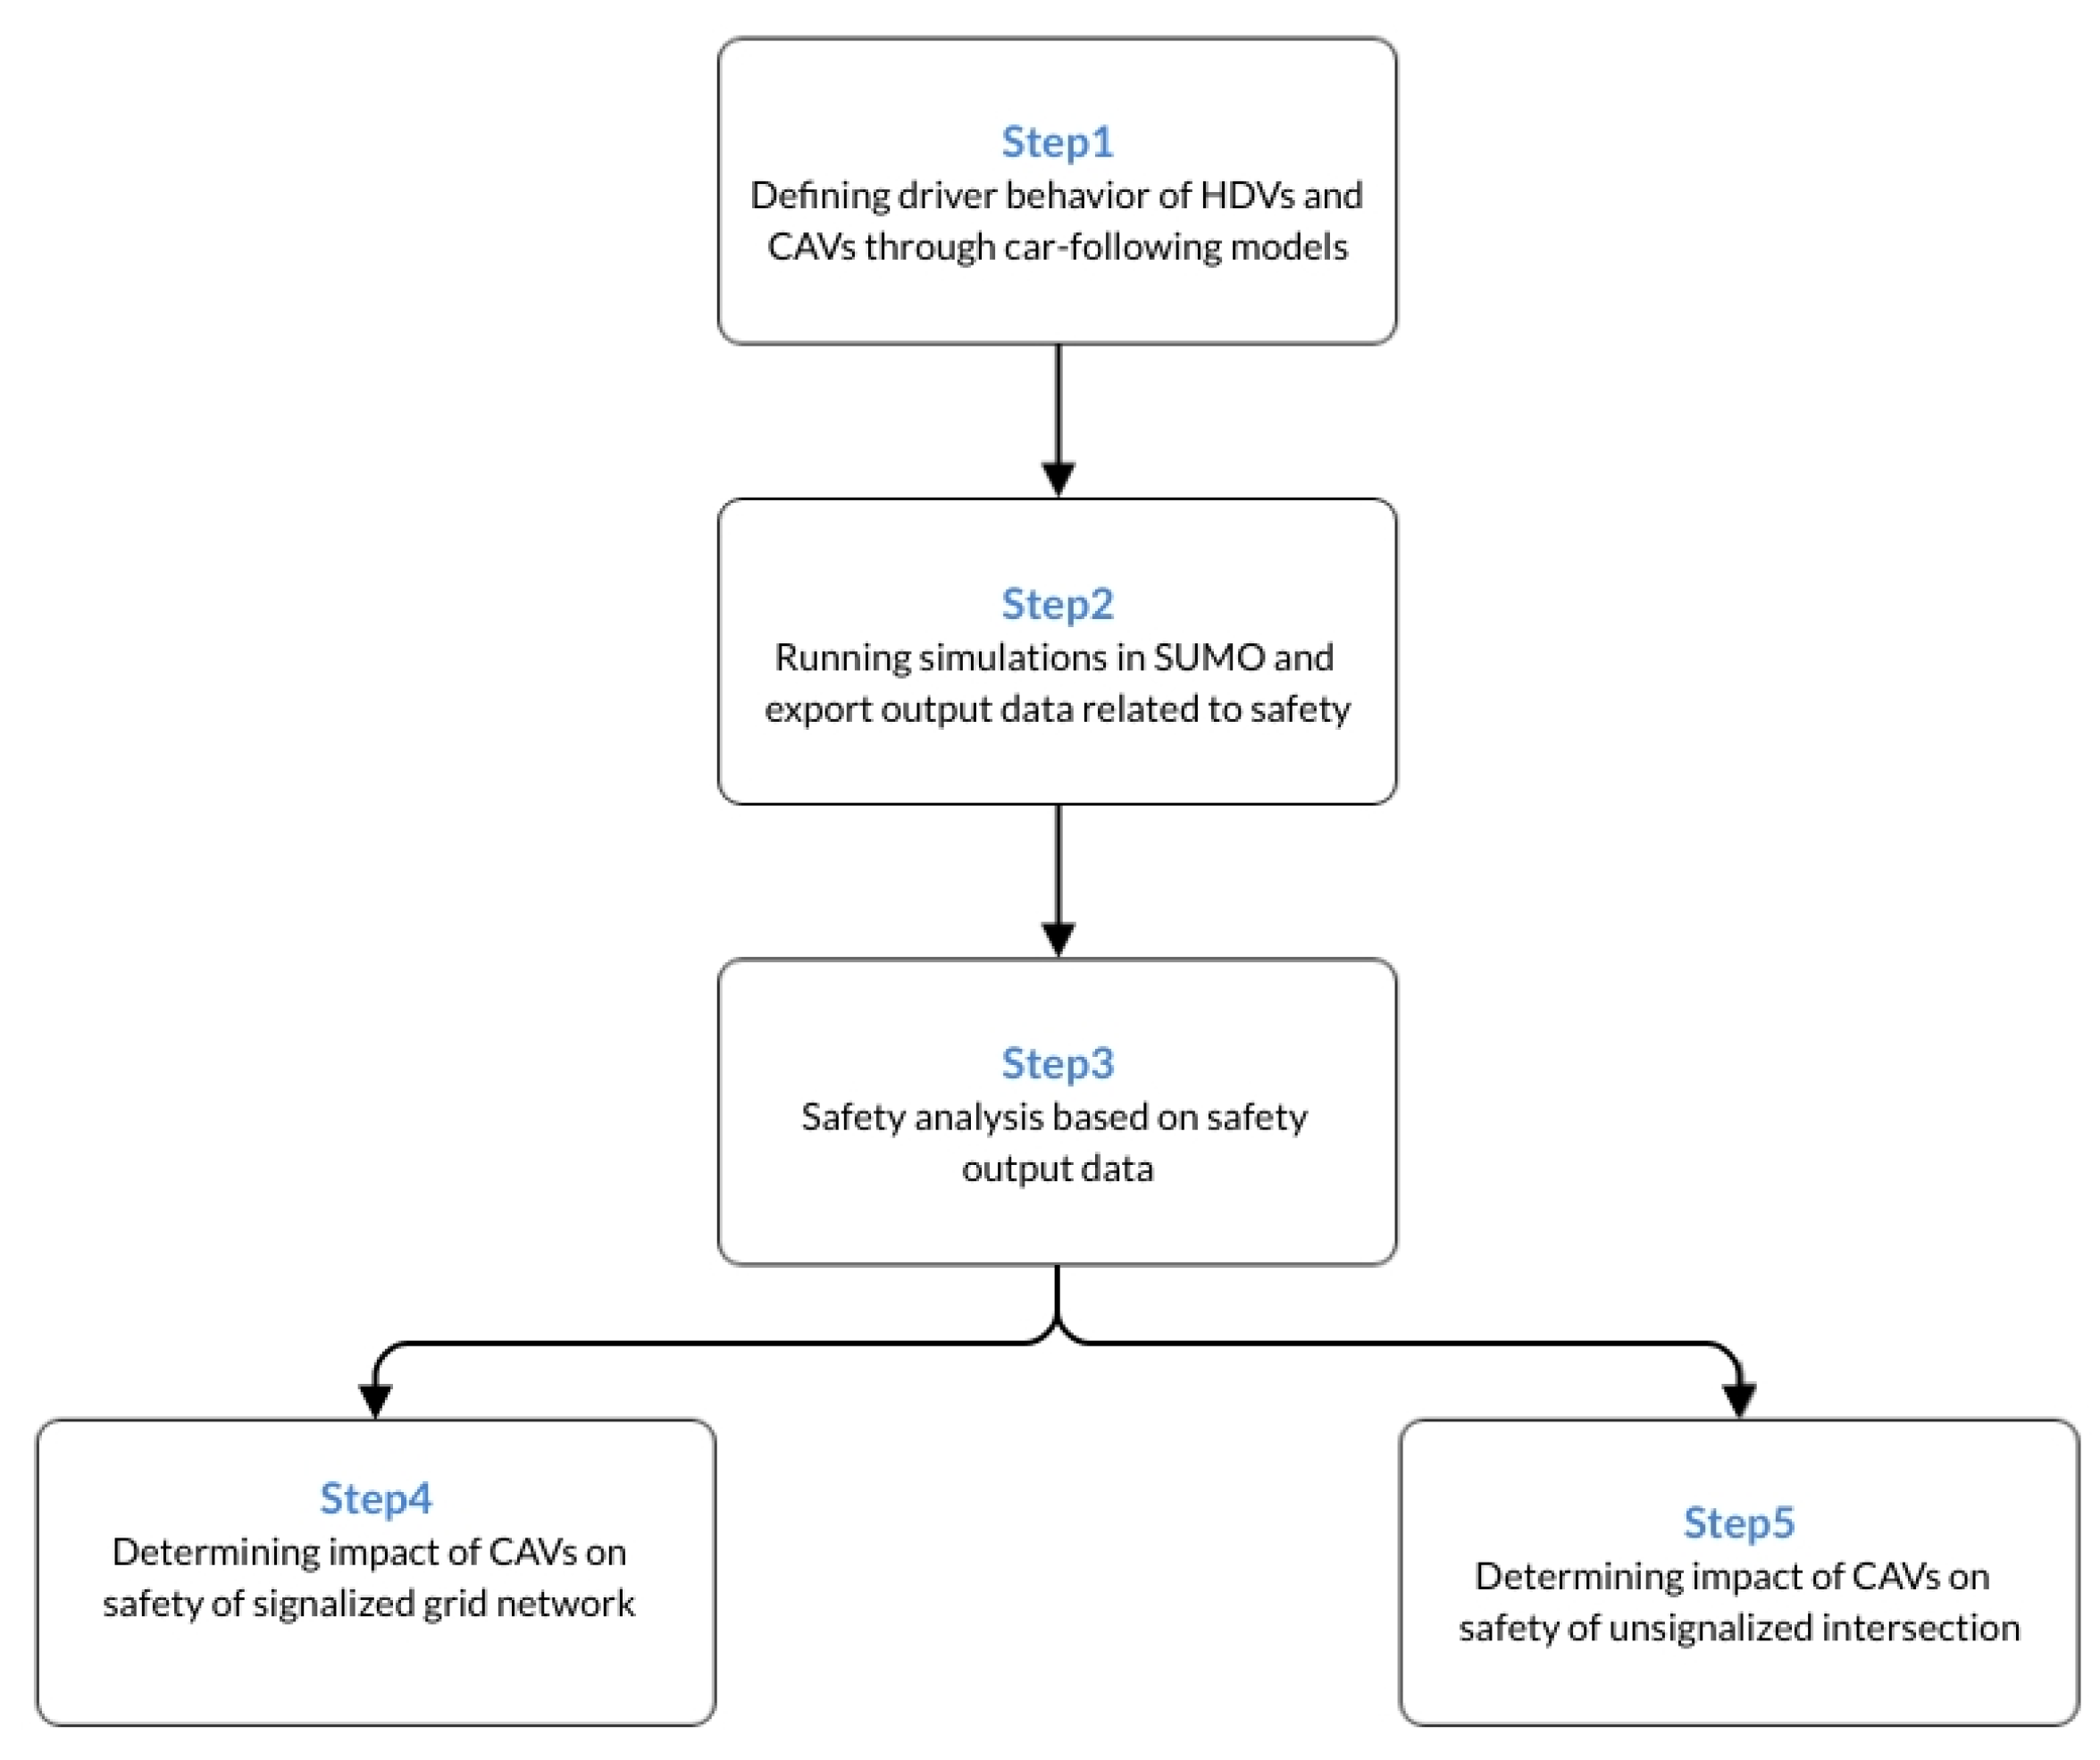
3. Methodology
3.1. Car-Following Models
3.1.1. Krauss Car-Following Model
3.1.2. IDM Car-Following Model
3.1.3. CACC Car-Following Model
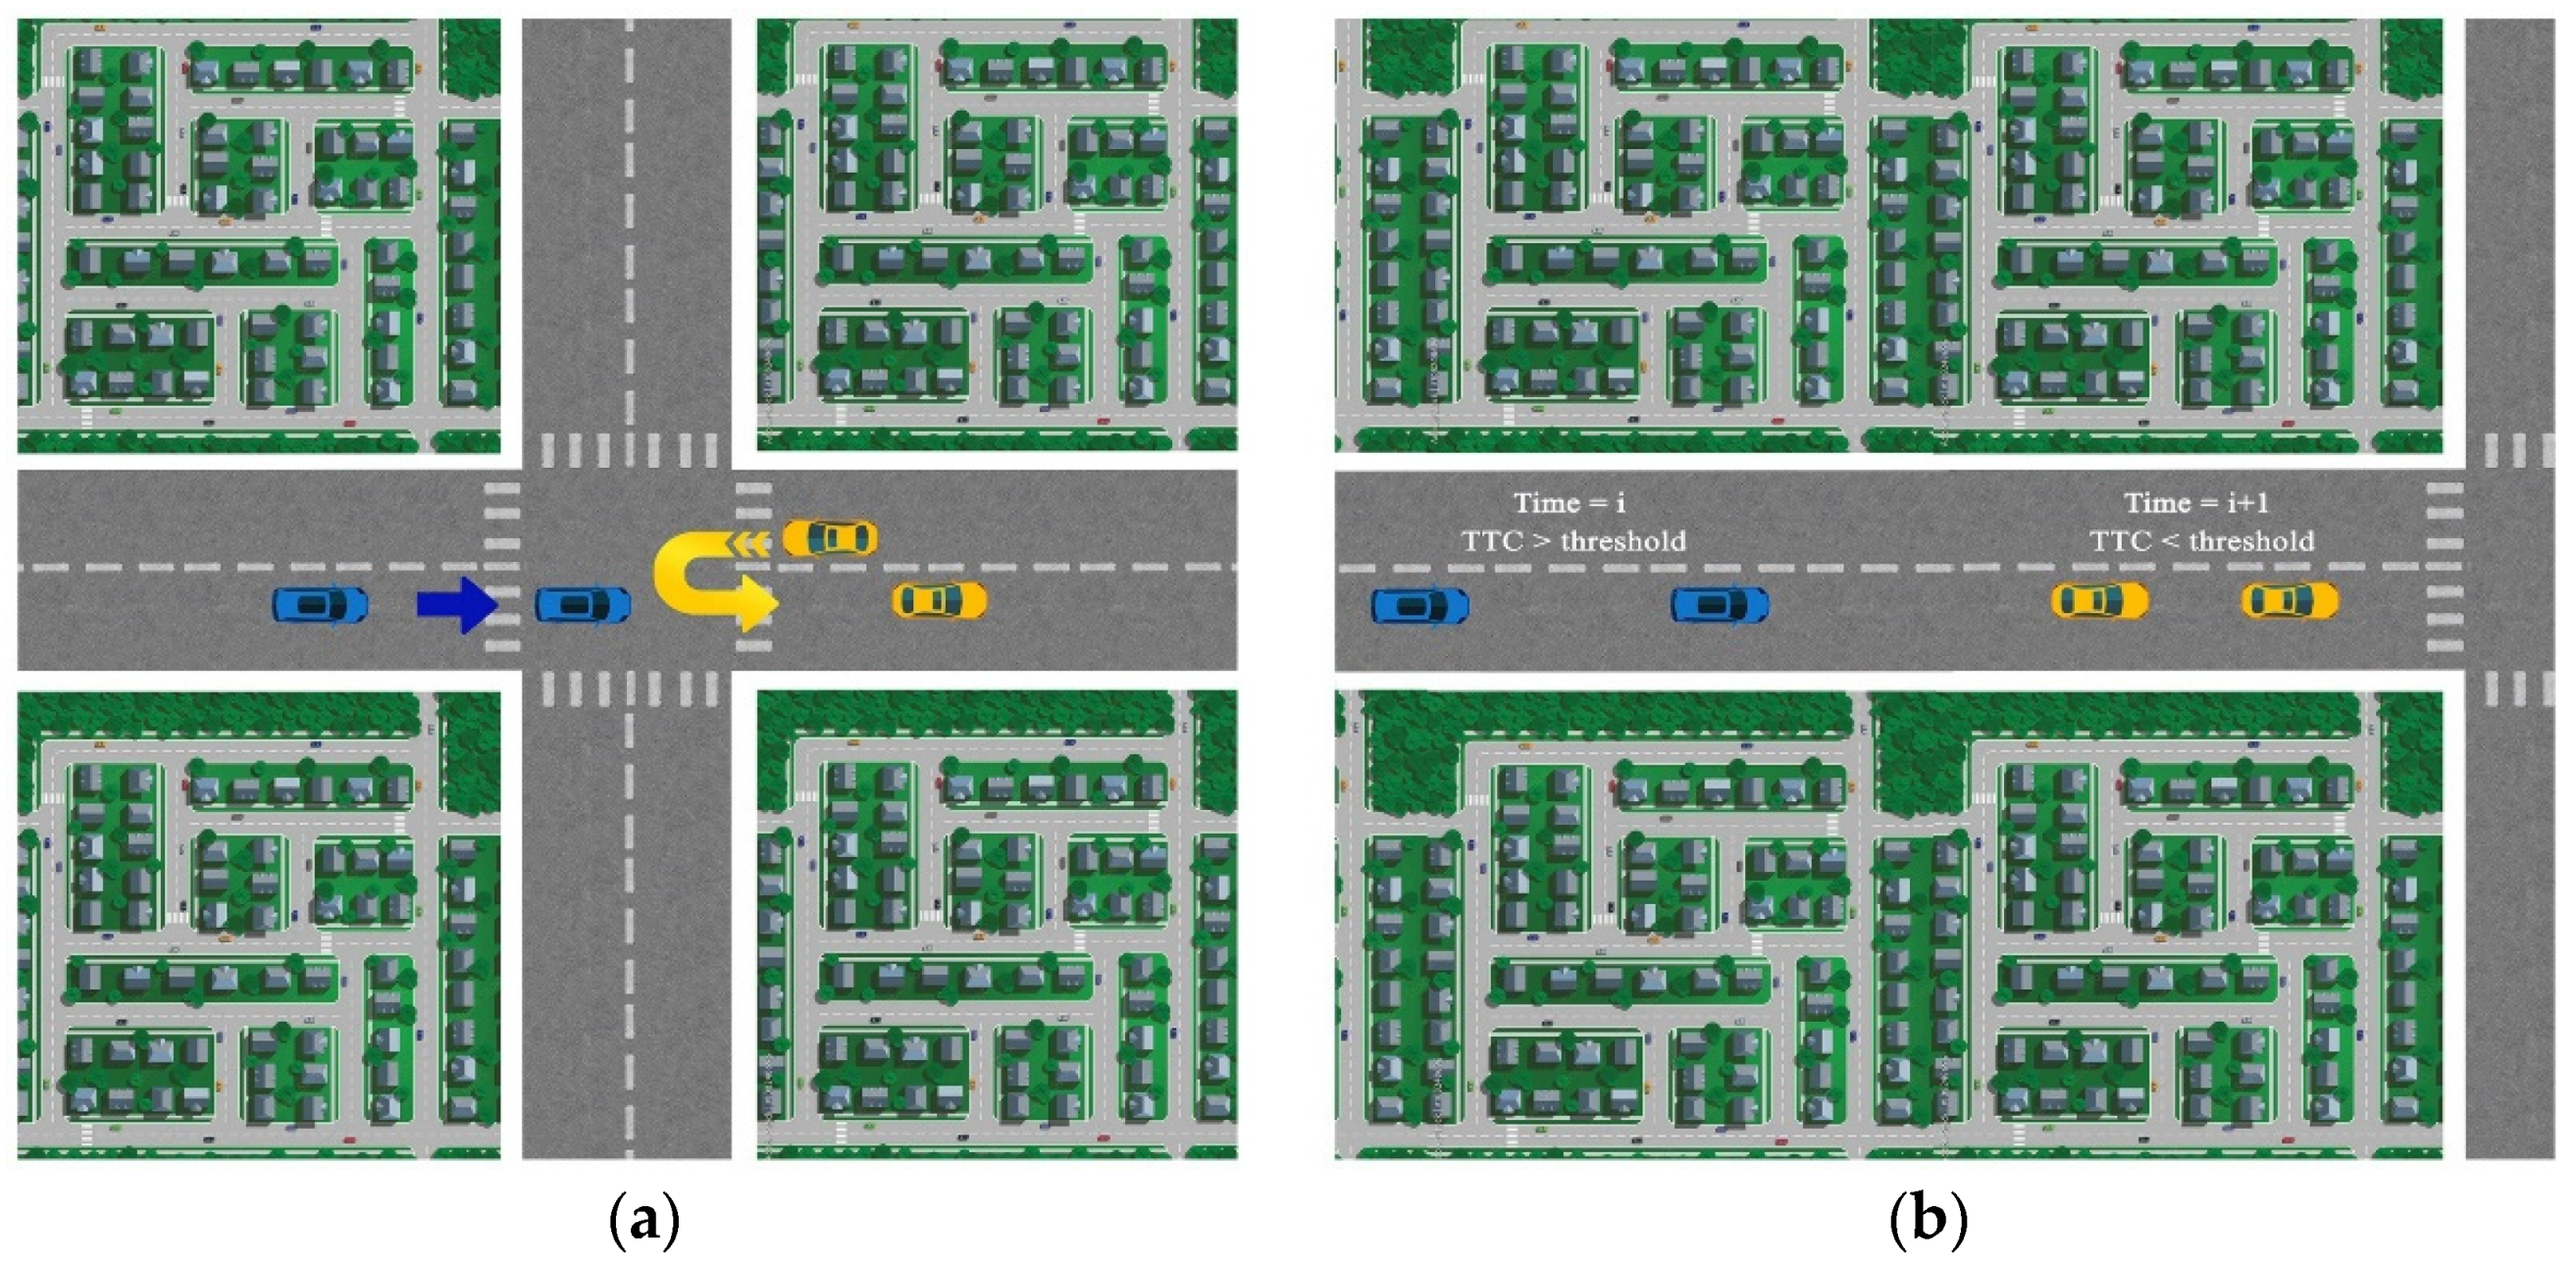
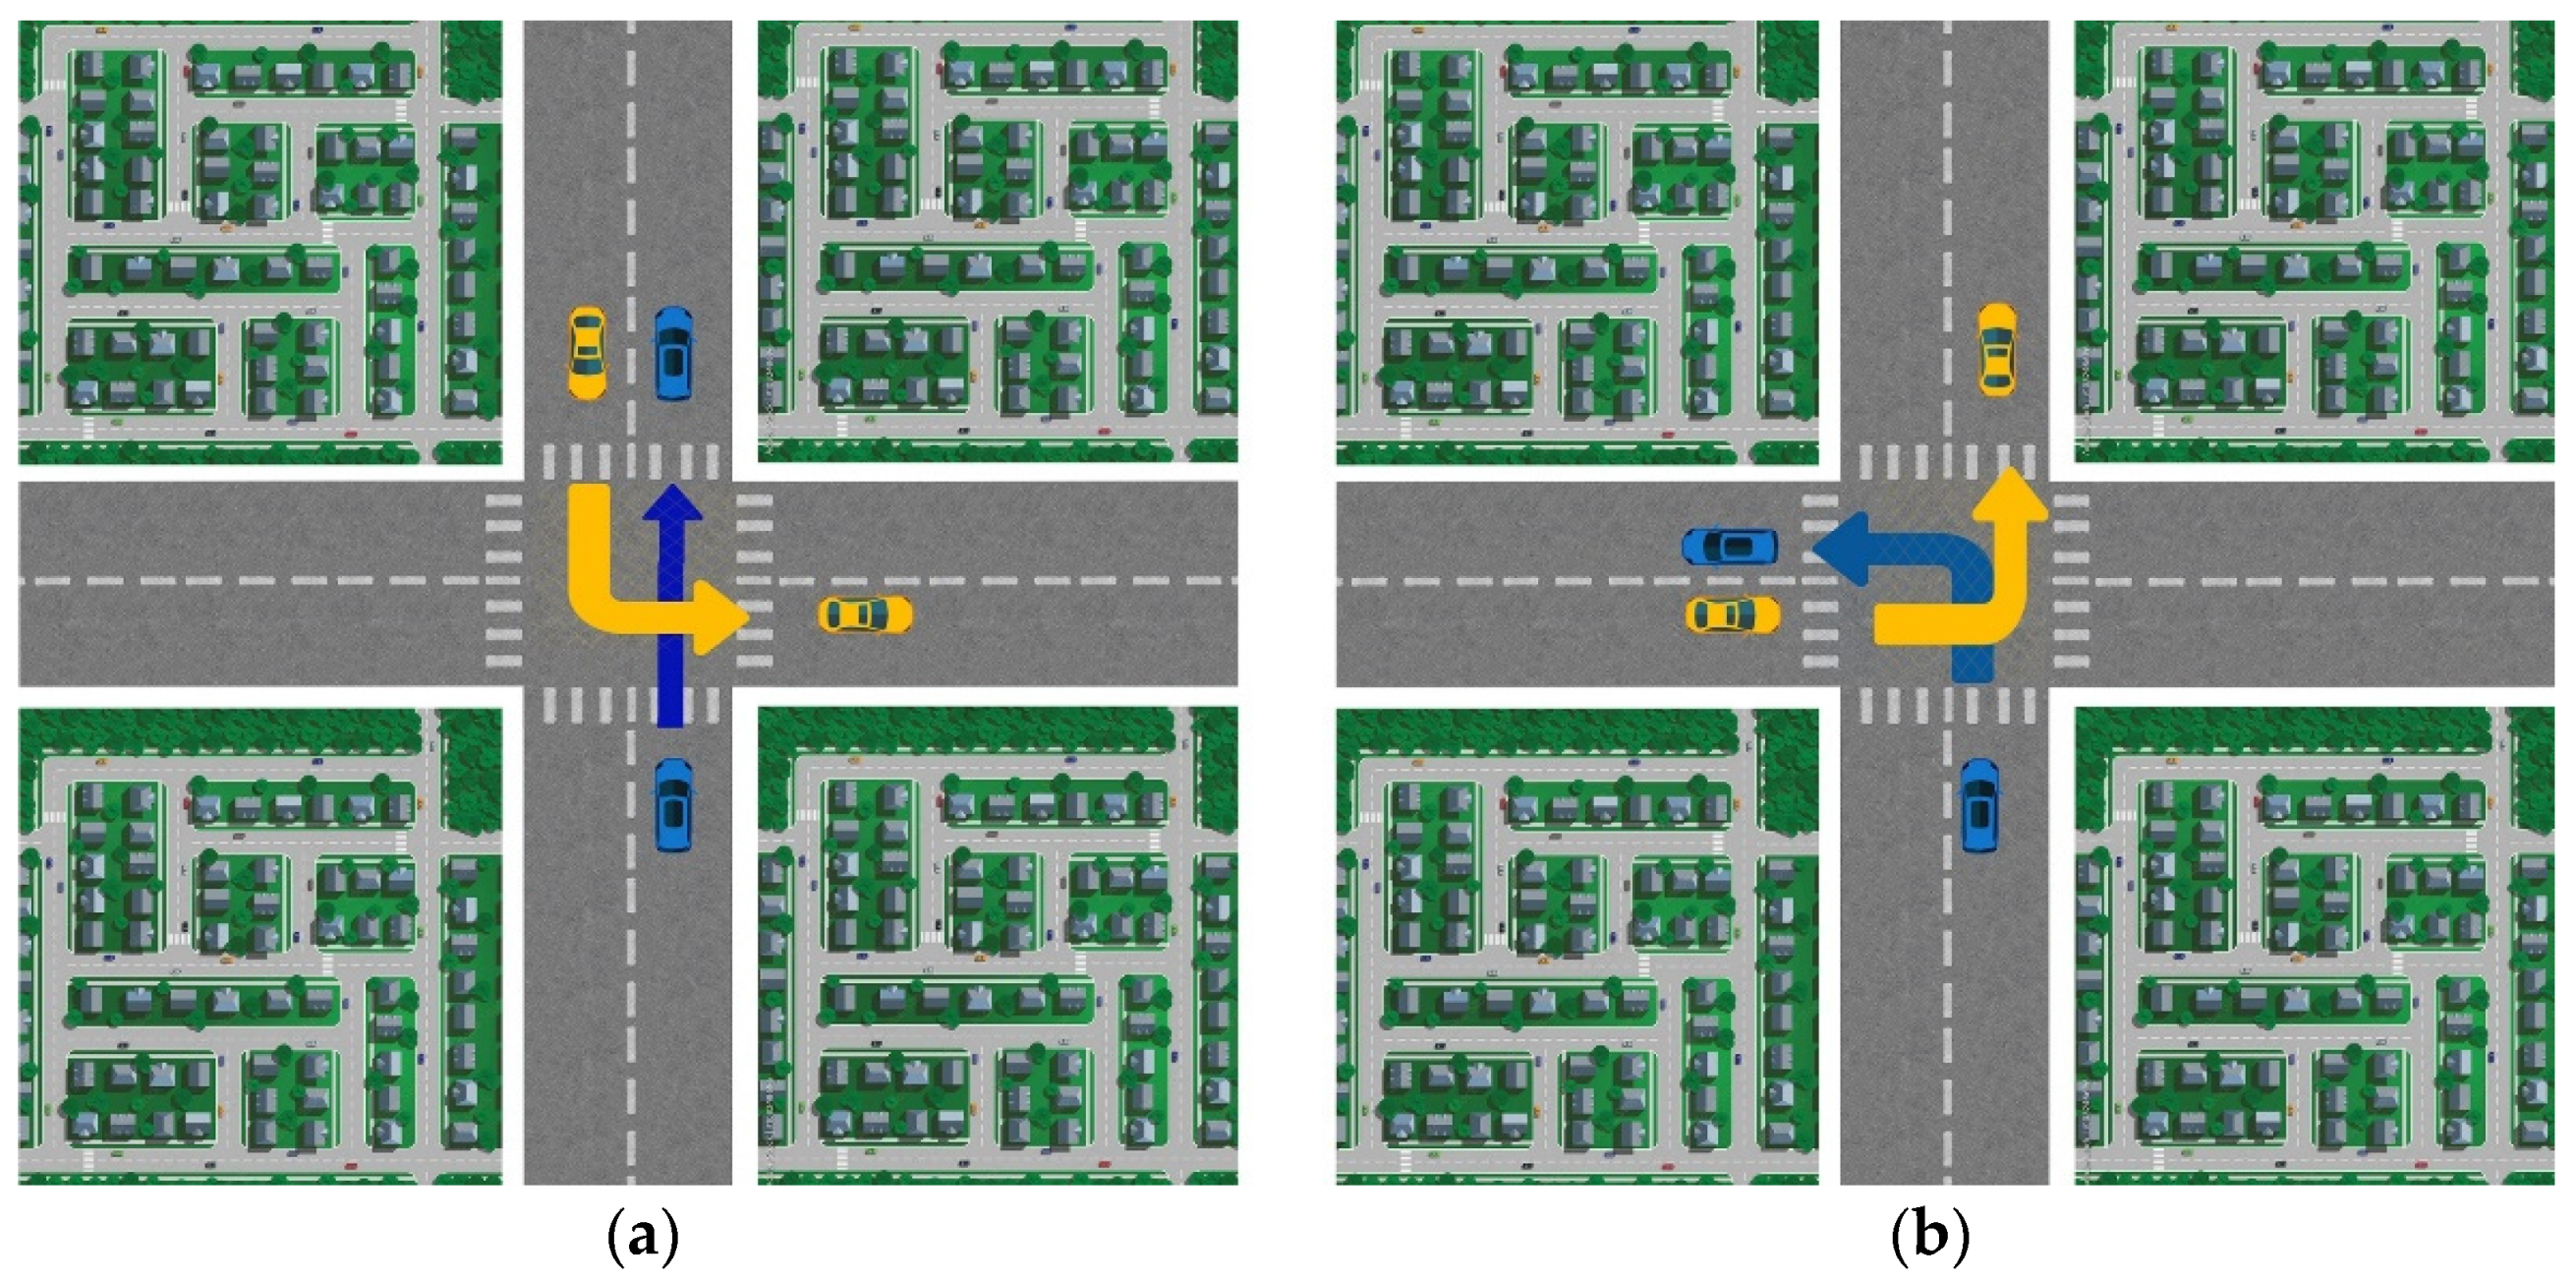
3.2. Safety Analysis
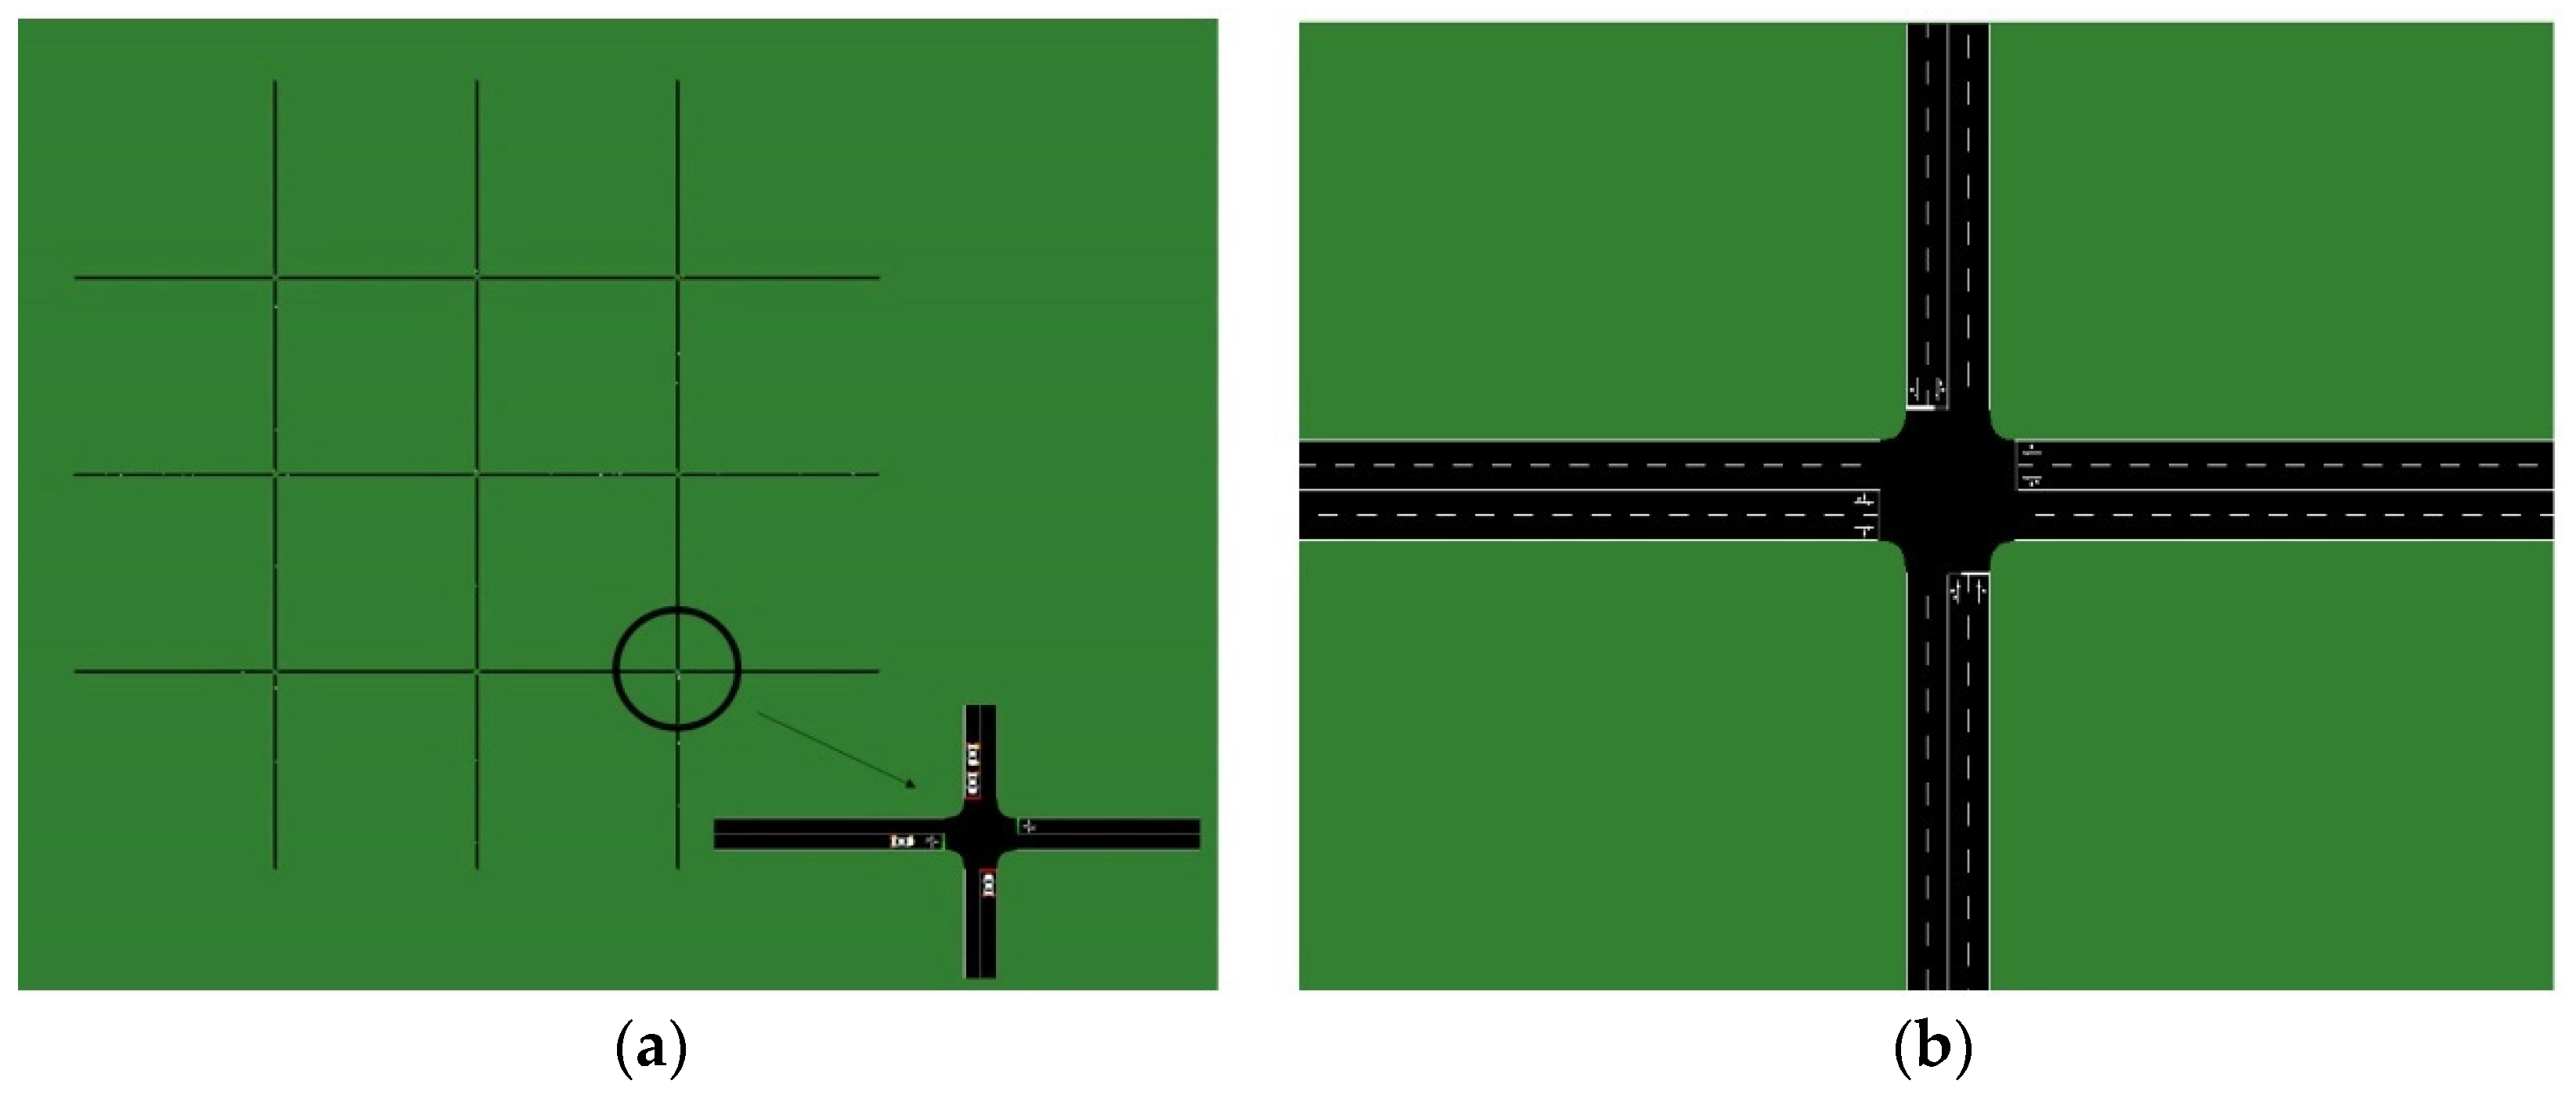
3.3. Case Studies and Demands
4. Results
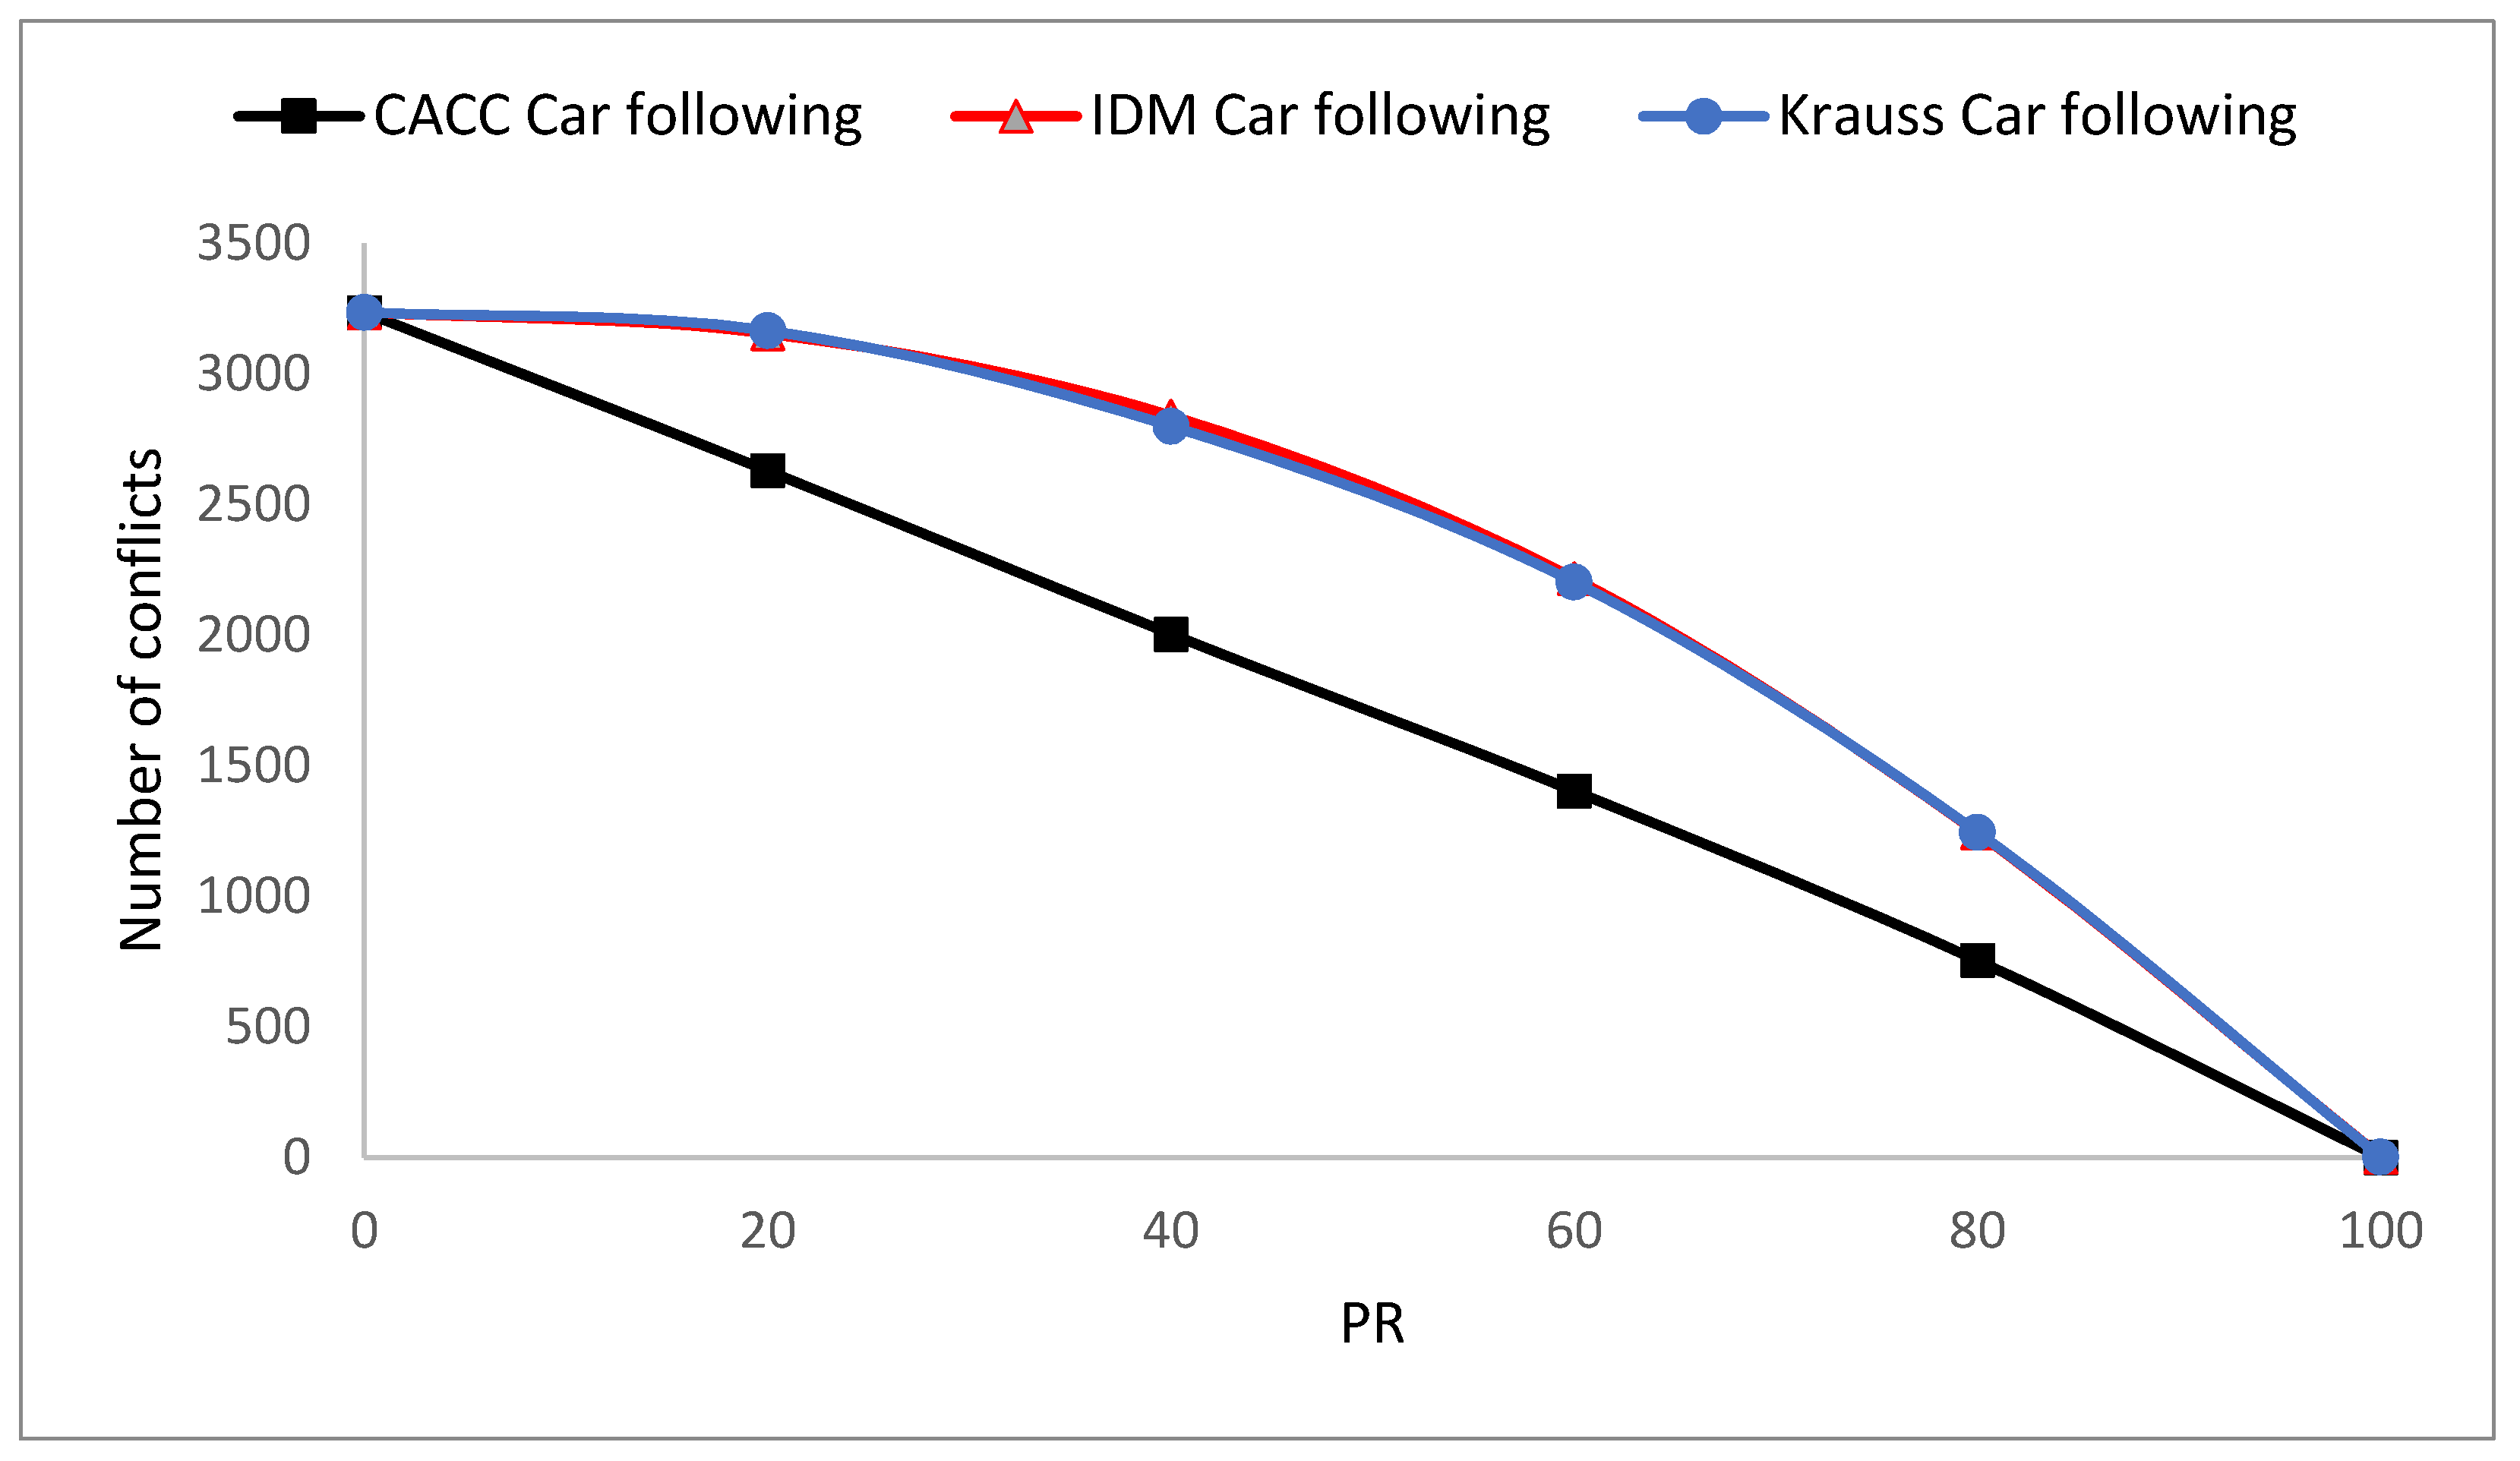
4.1. Grid Network Results
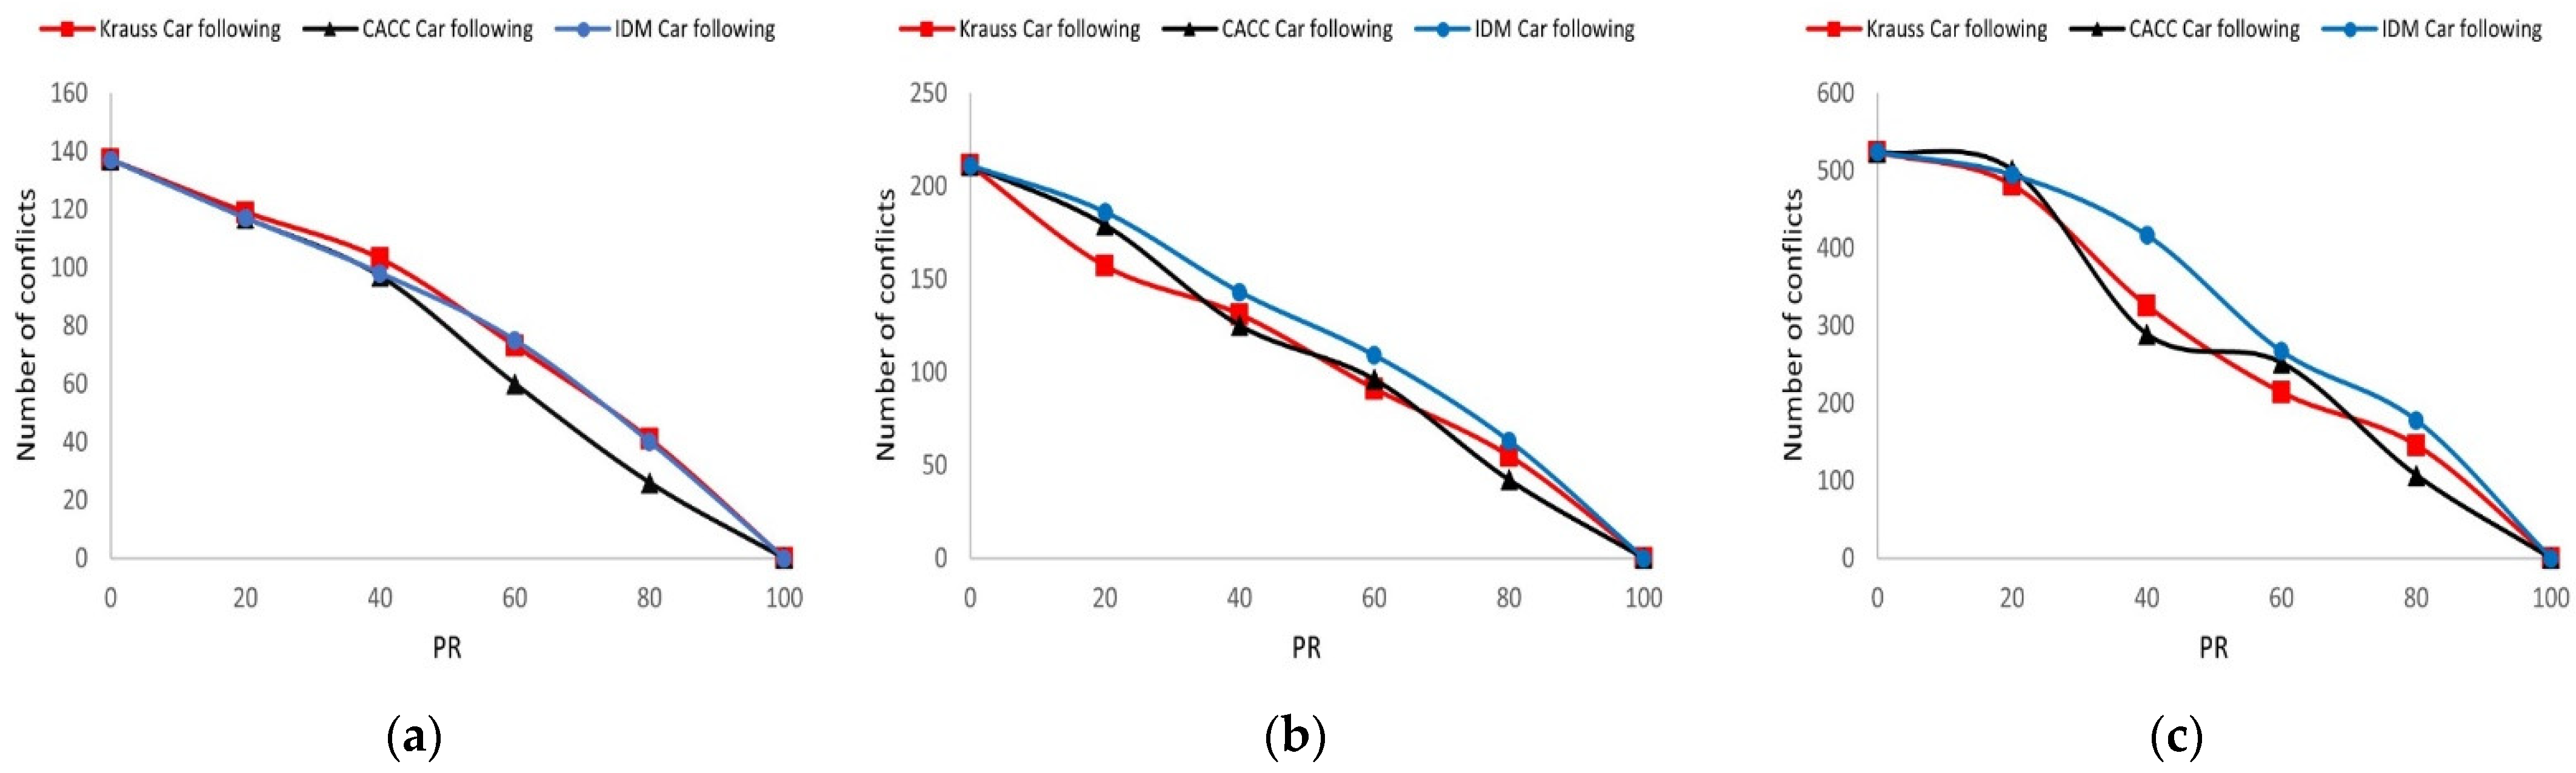
4.2. Unsignalized Intersection Results
5. Discussion
6. Conclusions
Author Contributions
Funding
Institutional Review Board Statement
Informed Consent Statement
Data Availability Statement
Conflicts of Interest
Appendix A

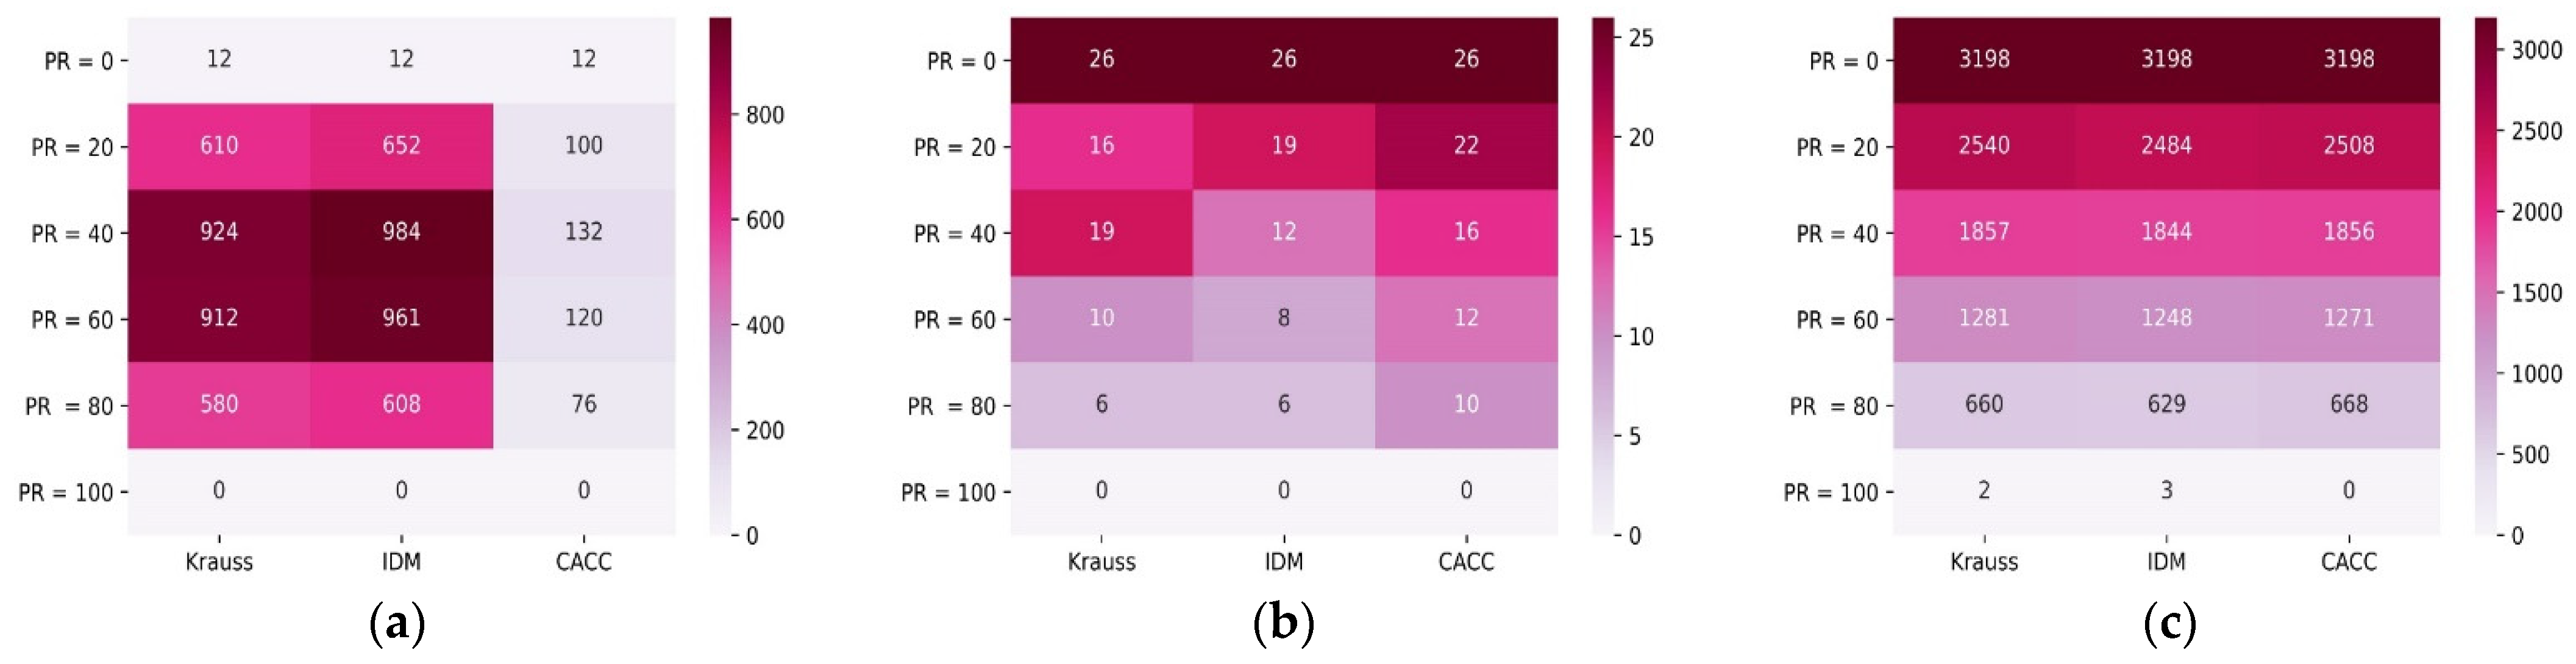
| CFM | PR (%) | Number of Total Conflicts | Number of Conflicts Based on the Type of Conflict | ||
|---|---|---|---|---|---|
| Lead/Follow | Merging | Crossing | |||
| Krauss | 0 | 3236 | 12 | 26 | 3198 |
| 20 | 3166 | 610 | 16 | 2540 | |
| 40 | 2800 | 924 | 19 | 1857 | |
| 60 | 2203 | 912 | 10 | 1281 | |
| 80 | 1246 | 580 | 6 | 660 | |
| 100 | 2 | 0 | 0 | 2 | |
| IDM | 0 | 3236 | 12 | 26 | 3198 |
| 20 | 3155 | 652 | 19 | 2484 | |
| 40 | 2840 | 984 | 12 | 1844 | |
| 60 | 2217 | 961 | 8 | 1248 | |
| 80 | 1243 | 608 | 6 | 629 | |
| 100 | 3 | 0 | 0 | 3 | |
| CACC | 0 | 3236 | 12 | 26 | 3198 |
| 20 | 2630 | 100 | 22 | 2508 | |
| 40 | 2004 | 132 | 16 | 1856 | |
| 60 | 1403 | 120 | 12 | 1271 | |
| 80 | 754 | 76 | 10 | 668 | |
| 100 | 0 | 0 | 0 | 0 | |
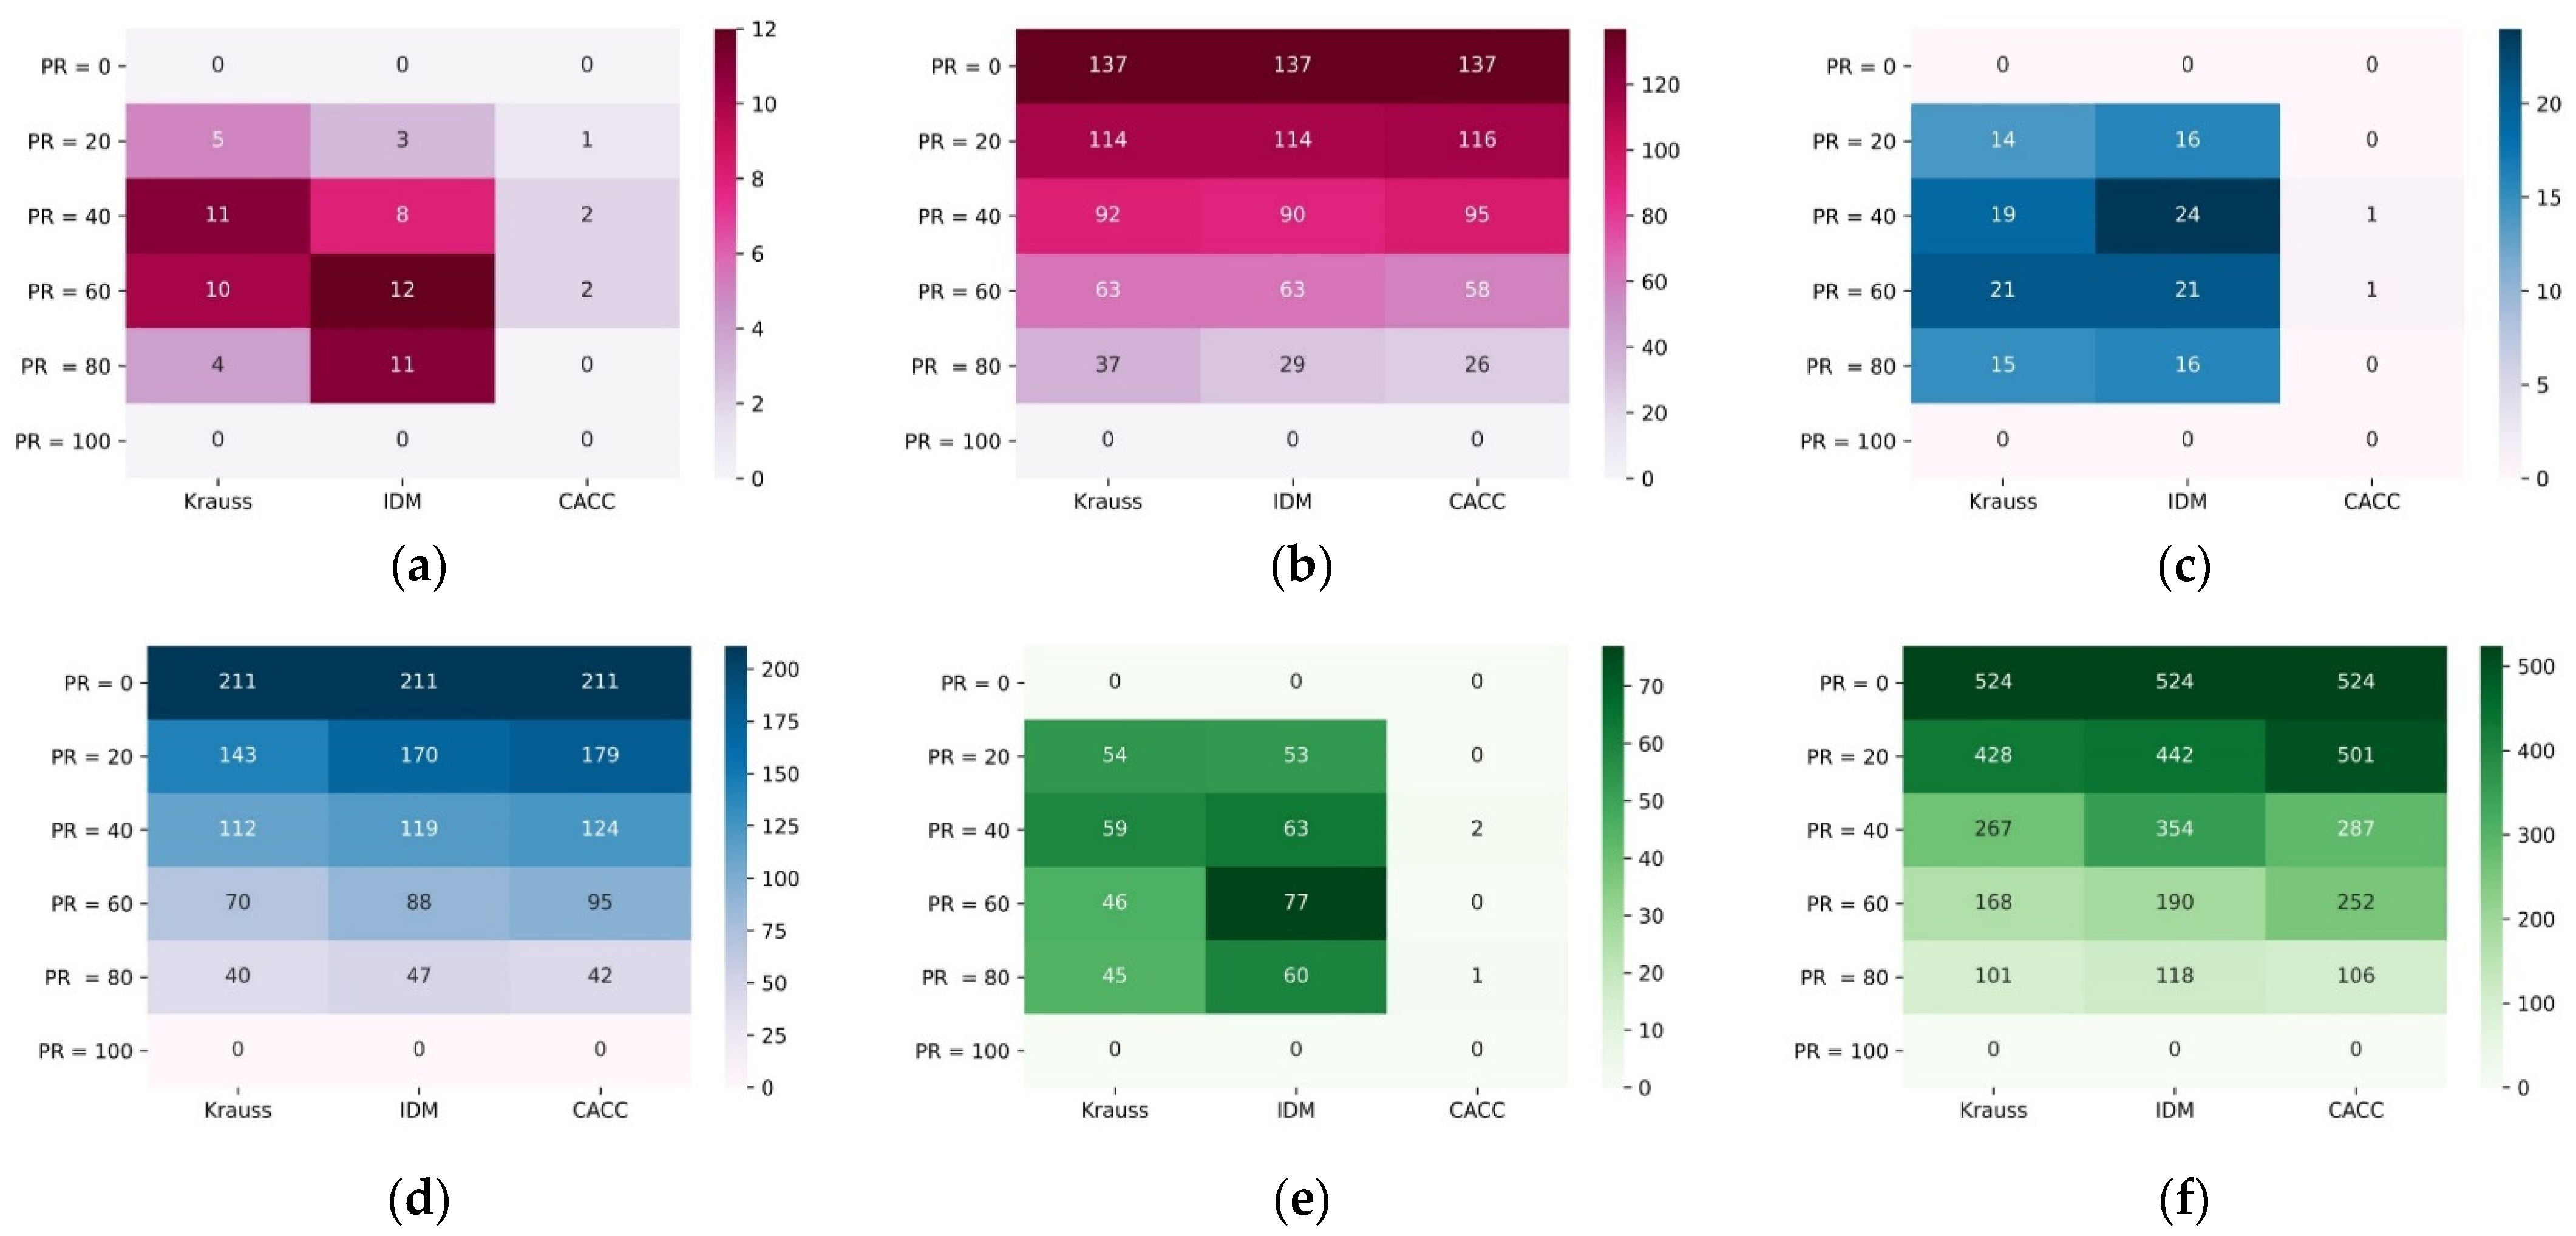
| CFM | PR (%) | Demand = 1200 veh/h | Demand = 1500 veh/h | Demand = 1800 veh/h | |||
|---|---|---|---|---|---|---|---|
| Number of Conflicts Based on the Type of Conflict | Number of Conflicts Based on the Type of Conflict | Number of Conflicts Based on the Type of Conflict | |||||
| Lead/Follow | Crossing | Lead/Follow | Crossing | Lead/Follow | Crossing | ||
| Krauss | 0 | 0 | 137 | 0 | 211 | 0 | 524 |
| 20 | 5 | 114 | 14 | 143 | 54 | 428 | |
| 40 | 11 | 92 | 19 | 112 | 59 | 267 | |
| 60 | 10 | 63 | 21 | 70 | 46 | 168 | |
| 80 | 4 | 37 | 15 | 40 | 45 | 101 | |
| 100 | 0 | 0 | 0 | 0 | 0 | 0 | |
| IDM | 0 | 0 | 137 | 0 | 211 | 0 | 524 |
| 20 | 3 | 114 | 16 | 170 | 53 | 442 | |
| 40 | 8 | 90 | 24 | 119 | 63 | 354 | |
| 60 | 12 | 63 | 21 | 88 | 77 | 190 | |
| 80 | 11 | 29 | 16 | 47 | 60 | 118 | |
| 100 | 0 | 0 | 0 | 0 | 0 | 0 | |
| CACC | 0 | 0 | 137 | 0 | 211 | 0 | 524 |
| 20 | 1 | 116 | 0 | 179 | 0 | 501 | |
| 40 | 2 | 95 | 1 | 124 | 2 | 287 | |
| 60 | 2 | 58 | 1 | 95 | 0 | 252 | |
| 80 | 0 | 26 | 0 | 42 | 1 | 106 | |
| 100 | 0 | 0 | 0 | 0 | 0 | 0 | |
References
- WHO. Road Traffic Injuries. Available online: https://www.who.int/news-room/fact-sheets/detail/road-traffic-injuries (accessed on 16 September 2021).
- Xiao, D.; Jin, X.; Xu, X.; Ma, C.; Yuan, Q. Exploring traffic safety climate with driving condition and driving behaviour: A random parameter structural equation model approach. Transp. Saf. Environ. 2021, 3, tdab015. [Google Scholar] [CrossRef]
- Haghi, A.; Ketabi, D.; Ghanbari, M.; Rajabi, H. Assessment of human errors in driving accidents; analysis of the causes based on aberrant behaviors. Life Sci. J. 2014, 11, 414–420. [Google Scholar]
- Standards, S.A.E. J3016_201806 Taxonomy and Definitions for Terms Related to Driving Automation Systems for On-Road Motor Vehicles; SAE International: Warrendale, PA, USA, 2018. [Google Scholar]
- Atkins Ltd. Research on the Impacts of Connected and Autonomous Vehicles (CAVs) on Traffic Flow; Atkins: Epsom, UK, 2016. [Google Scholar]
- Ding, F.; Jiang, J.; Zhou, Y.; Yi, R.; Tan, H. Unravelling the Impacts of Parameters on Surrogate Safety Measures for a Mixed Platoon. Sustainability 2020, 12, 9955. [Google Scholar] [CrossRef]
- Virdi, N.; Grzybowska, H.; Waller, S.T.; Dixit, V. A safety assessment of mixed fleets with connected and autonomous vehicles using the surrogate safety assessment module. Accid. Anal. Prev. 2019, 131, 95–111. [Google Scholar] [CrossRef]
- Zhang, H.; Hou, N.; Zhang, J.; Li, X.; Huang, Y. Evaluating the safety impact of connected and autonomous vehicles with lane management on freeway crash hotspots using the surrogate safety assessment model. J. Adv. Transp. 2021, 2021, 5565343. [Google Scholar] [CrossRef]
- Massar, M.; Reza, I.; Rahman, S.M.; Abdullah, S.M.H.; Jamal, A.; Al-Ismail, F.S. Impacts of Autonomous Vehicles on Greenhouse Gas Emissions—Positive or Negative? Int. J. Environ. Res. Public Health 2021, 18, 5567. [Google Scholar] [CrossRef] [PubMed]
- Liu, F.; Zhao, F.; Liu, Z.; Hao, H. Can autonomous vehicle reduce greenhouse gas emissions? A country-level evaluation. Energy Policy 2019, 132, 462–473. [Google Scholar] [CrossRef]
- Liu, P.; Fan, W. Exploring the impact of connected and autonomous vehicles on freeway capacity using a revised Intelligent Driver Model. Transp. Plan. Technol. 2020, 43, 279–292. [Google Scholar] [CrossRef]
- Shelton, J.; Samant, S.; Wagner, J.; Goodin, G.; Seymour, E.; Lomas, T. Modeling the Traffic Impacts from Automated and Connected Vehicles in a Complex, Congested Urban Setting; Texas A&M Transportation Institute: College Station, TX, USA, 2016. [Google Scholar]
- Talebpour, A.; Mahmassani, H.S. Influence of connected and autonomous vehicles on traffic flow stability and throughput. Transp. Res. Part C Emerg. Technol. 2016, 71, 143–163. [Google Scholar] [CrossRef]
- Liu, P.; Fan, W.D. Exploring the impact of connected and autonomous vehicles on mobility and environment at signalized intersections through vehicle-to-infrastructure (V2I) and infrastructure-to-vehicle (I2V) communications. Transp. Plan. Technol. 2021, 44, 129–138. [Google Scholar] [CrossRef]
- Niels, T.; Erciyas, M.; Bogenberger, K. Impact of Connected and Autonomous Vehicles on the Capacity of Signalized Intersections–Microsimulation of an Intersec-tion in Munich. Transp. Res. Arena Vienna Austria 2018. [Google Scholar] [CrossRef]
- Deluka Tibljaš, A.; Giuffrè, T.; Surdonja, S.; Trubia, S. Introduction of Autonomous Vehicles: Roundabouts design and safety performance evaluation. Sustainability 2018, 10, 1060. [Google Scholar] [CrossRef] [Green Version]
- Morando, M.M.; Tian, Q.; Truong, L.T.; Vu, H.L. Studying the safety impact of autonomous vehicles using simulation-based surrogate safety measures. J. Adv. Transp. 2018, 2018, 6135183. [Google Scholar] [CrossRef]
- Wiedemann, R. Simulation des Strassenverkehrsflusses; Institute for Traffic Engineering, University of Karlsruhe: Karlsruhe, Germany, 1974. [Google Scholar]
- Papadoulis, A.; Quddus, M.; Imprialou, M. Evaluating the safety impact of connected and autonomous vehicles on motorways. Accid. Anal. Prev. 2019, 124, 12–22. [Google Scholar] [CrossRef] [Green Version]
- Arvin, R.; Khattak, A.J.; Kamrani, M.; Rio-Torres, J. Safety evaluation of connected and automated vehicles in mixed traffic with conventional vehicles at intersections. J. Intell. Transp. Syst. 2020, 25, 170–187. [Google Scholar] [CrossRef]
- Milanés, V.; Shladover, S.E. Modeling cooperative and autonomous adaptive cruise control dynamic responses using experimental data. Transp. Res. Part C Emerg. Technol. 2014, 48, 285–300. [Google Scholar] [CrossRef] [Green Version]
- Milanés, V.; Shladover, S.E. Handling cut-in vehicles in strings of cooperative ACC Vehicles. J. Intell. Transp. Syst. 2015, 20, 1–14. [Google Scholar]
- Xiao, L.; Wang, M.; Van Arem, B. Realistic car-following models for microscopic simulation of adaptive and cooperative adaptive cruise control vehicles. Transp. Res. Rec. 2017, 2623, 1–9. [Google Scholar] [CrossRef] [Green Version]
- Liu, H. Using Cooperative Adaptive Cruise Control (CACC) to Form High-Performance Vehicle Streams: Microscopic Traffic Modeling; University of California: Berkeley, CA, USA, 2018. [Google Scholar]
- Treiber, M.; Hennecke, A.; Helbing, D. Congested traffic states in empirical observations and microscopic simulations. Phys. Rev. E 2000, 62, 1805. [Google Scholar] [CrossRef] [Green Version]
- Pu, L.; Joshi, R.; Energy, S. Surrogate Safety Assessment Model (SSAM)—Software User Manual; Turner-Fairbank Highway Research Center: McLean, VA, USA, 2008.
- Mousavi, S.M.; Osman, O.A.; Lord, D.; Dixon, K.K.; Dadashova, B. Investigating the safety and operational benefits of mixed traffic environments with different automated vehicle market penetration rates in the proximity of a driveway on an urban arterial. Accid. Anal. Prev. 2021, 152, 105982. [Google Scholar] [CrossRef]
- Khashayarfard, M.; Nassiri, H. Studying the simultaneous effect of autonomous vehicles and distracted driving on safety at unsignalized intersections. J. Adv. Transp. 2021, 2021, 6677010. [Google Scholar] [CrossRef]
- Shahdah, U.; Saccomanno, F.; Persaud, B. Application of traffic microsimulation for evaluating safety performance of urban signalized intersections. Transp. Res. Part C Emerg. Technol. 2015, 60, 96–104. [Google Scholar] [CrossRef]
- Behrisch, M.; Bieker, L.; Erdmann, J.; Krajzewicz, D. SUMO–simulation of urban mobility: An overview. In Proceedings of the Proceedings of SIMUL 2011, the Third International Conference on Advances in System Simulation, Barcelona, Spain, 23–28 October 2011. [Google Scholar]
- Ahmed, H.U.; Huang, Y.; Lu, P. A Review of Car-Following Models and Modeling Tools for Human and Autonomous-Ready Driving Behaviors in Micro-Simulation. Smart Cities 2021, 4, 314–335. [Google Scholar] [CrossRef]
- Krauß, S. Microscopic Modeling of Traffic Flow: Investigation of Collision Free Vehicle Dynamics; U.S. Department of Energy Office of Scientific and Technical Information: Oak Ridge, TN, USA, 1998.
- Song, J.; Wu, Y.; Xu, Z.; Lin, X. Research on car-following model based on SUMO. In Proceedings of the the 7th IEEE/International Conference on Advanced Infocomm Technology, Fuzhou, China, 14–16 November 2014; pp. 47–55. [Google Scholar]
- Bieker-Walz, L.; Behrisch, M.; Junghans, M.; Gimm, K. Evaluation of Car-Following-Models at Controlled Intersections. In Proceedings of the European Simulation and Modelling Conference, Lissabon, Portugal, 25–27 October 2017. [Google Scholar]
- Lücken, L.; Mintsis, E.; Kallirroi, N.P.; Alms, R.; Flötteröd, Y.-P.; Koutras, D. From Automated to Manual-Modeling Control Transitions with SUMO. EPiC Ser. Comput. 2019, 62, 124–144. [Google Scholar]
- Mintsis, E.; Koutras, D.; Porfyri, K.; Mitsakis, E.; Lücken, L.; Erdmann, J.; Flötteröd, Y.-P.; Alms, R.; Rondinone, M.; Maerivoet, S. TransAID Deliverable 3.1—Modelling, Simulation and Assessment of Vehicle Automations and Automated Vehicles’ Driver Behaviour in Mixed Traffic-Iteration 2; Hellenic Institute of Transport (H.I.T.): Athens, Greece, 2019. [Google Scholar]
- Lu, Q.; Tettamanti, T.; Hörcher, D.; Varga, I. The impact of autonomous vehicles on urban traffic network capacity: An experimental analysis by microscopic traffic simulation. Transp. Lett. 2020, 12, 540–549. [Google Scholar] [CrossRef] [Green Version]
- Hayward, J.C. Near Miss Determination through Use of a Scale of Danger; Pennsylvania Transportation and Traffic Safety Center: York, PA, USA, 1972.
- Minderhoud, M.M.; Bovy, P.H. Extended time-to-collision measures for road traffic safety assessment. Accid. Anal. Prev. 2001, 33, 89–97. [Google Scholar] [CrossRef]
- SUMO. SSM Device. Available online: https://sumo.dlr.de/docs/Simulation/Output/SSM_Device.html (accessed on 1 July 2021).
- Saccomanno, F.F.; Cunto, F.; Guido, G.; Vitale, A. Comparing safety at signalized intersections and roundabouts using simulated rear-end conflicts. Transp. Res. Rec. 2008, 2078, 90–95. [Google Scholar] [CrossRef]


| Authors | Network | Car Following Model | SSM | Impact on Safety |
|---|---|---|---|---|
| Tibas et al. [16] | Roundabouts | CAV: Wiedemann HDV: Wiedemann | TTC, PET, MaxS | Positive |
| Morando et al. [17] | Roundabouts, Intersections | CAV: Wiedemann HDV: Wiedemann | TTC, PET | Positive |
| Virdi et al. [7] | Intersections, Roundabouts, Highways | CAV: VCCP HDV: Wiedemann | TTC, PET | Positive |
| Papadoulis et al. [19] | Motorways | CAV: BDMCA HDV: Wiedemann | TTC, PET | Positive |
| Arvin et al. [20] | Intersections | CAV: ACC, CACC HDV: Wiedemann | TTC | Positive |
| Zhang et al. [8] | Freeway | CAV: IDM HDV: Wiedemann | TTC | When Lane changing is allowed: negative Managed lane: positive |
| Vehicle Type (Car-Following Model) | Minimum Headway (s) | Minimum Gap (m) | Acceleration (m/s2) | Deceleration (m/s2) |
|---|---|---|---|---|
| HDV (Krauss) | 0.9 | 1.5 | 3.5 | 4.5 |
| CAV (Krauss) | 0.5 | 0.5 | 3.9 | 4.5 |
| CAV (IDM) | 0.5 | 0.5 | 3.9 | 4.5 |
| CAV (CACC) | 0.5 | 0.5 | 3.9 | 4.5 |
Publisher’s Note: MDPI stays neutral with regard to jurisdictional claims in published maps and institutional affiliations. |
© 2022 by the authors. Licensee MDPI, Basel, Switzerland. This article is an open access article distributed under the terms and conditions of the Creative Commons Attribution (CC BY) license (https://creativecommons.org/licenses/by/4.0/).
Share and Cite
Karbasi, A.; O’Hern, S. Investigating the Impact of Connected and Automated Vehicles on Signalized and Unsignalized Intersections Safety in Mixed Traffic. Future Transp. 2022, 2, 24-40. https://doi.org/10.3390/futuretransp2010002
Karbasi A, O’Hern S. Investigating the Impact of Connected and Automated Vehicles on Signalized and Unsignalized Intersections Safety in Mixed Traffic. Future Transportation. 2022; 2(1):24-40. https://doi.org/10.3390/futuretransp2010002
Chicago/Turabian StyleKarbasi, Amirhosein, and Steve O’Hern. 2022. "Investigating the Impact of Connected and Automated Vehicles on Signalized and Unsignalized Intersections Safety in Mixed Traffic" Future Transportation 2, no. 1: 24-40. https://doi.org/10.3390/futuretransp2010002
APA StyleKarbasi, A., & O’Hern, S. (2022). Investigating the Impact of Connected and Automated Vehicles on Signalized and Unsignalized Intersections Safety in Mixed Traffic. Future Transportation, 2(1), 24-40. https://doi.org/10.3390/futuretransp2010002