Article

Carbon Emission and Cost Analysis of Using Hybrid Fibre White Topping Overlays—A Road Rehabilitation Feasibility Study

by
Lujain Kuruvachalil
1,
Malindu Sandanayake
2,*,
Ramya Kumanayake
3 and
Radhakrishna
1
1
Department of Civil Engineering, RV College of Engineering, Visvesvaraya Technological University, Bengaluru 560059, India
2
Institute of Sustainable Industries and Liveable Cities, College of Engineering and Science, Victoria University, P.O. Box 14428, Melbourne, VIC 3011, Australia
3
Department of Civil Engineering, General Sir John Kotelawala Defence University, Ratmalana 10390, Sri Lanka
*
Author to whom correspondence should be addressed.
Future Transp. 2022, 2(1), 263-280; https://doi.org/10.3390/futuretransp2010014
Submission received: 29 December 2021 / Revised: 27 January 2022 / Accepted: 1 March 2022 / Published: 3 March 2022

Abstract

:
White topping is a popular road rehabilitation technique that uses Portland cement concrete overlay on top of any existing bituminous pavement. However, this often results in additional cost and carbon emission escalations which complicates market useability of the product. The current study aims at comparing carbon emission and manufacturing cost of concrete topping mixes with three different fibre types. The study optimises the benefits and promotes the use of effective materials in sustainable road rehabilitation. Samples with polyolefin-twisted (F2) fibres indicated least carbon emission escalation while the sample with polypropylene (F3) exhibited least cost escalation with 0.75% and 7.17% from the control sample respectively. A multi-objective genetic optimisation study was conducted to identify the mix designs with least carbon emission and production cost escalations. Sensitivity analysis illustrated that transport distance is a critical contributing factor for production cost while carbon emission is highly sensitive to emission factors for transport and cement production. These results indicate the importance of considering locally available materials and clean energy for production processes. Future research can be focused on exploring the long-term environmental and economic benefits including the durability characteristics to benchmark the sustainable benefits of using waste fibre materials in the mix.

1. Introduction

Road networks are a key connective infrastructure that facilitate social integration, transportation, trade and economic growth of city or region. Easy accessibility, flexibility in operations and reliability are key factors that enhance the quality of road transport. In India since 1951, the road length has increased by 11 times to 4,690,000 km which gives a road density of about 1.43 km per square km of land [1]. National highway (NH) network is about 71,772 km, i.e., 1.7% of total road network and 40% of the total traffic is transported through the national highway network. In addition, expressways, state highways, major district roads, other districts roads and village roads constitute the extensive road network. As a country which use road infrastructure for 60% of total merchandise and 85% of total passenger traffic, India often oversees the importance of efficient management and maintenance of road network [2]. As a key production-focused country with strong industrialisation background, smooth and efficient movement of merchandise and people is vital towards rapid development of the country.
Often developing countries like India are not able to keep up with the pace of excessive usage and complete replacement of the existing road network. Therefore, over the last few decades major research studies have concentrated extensively on the use of alternate pavement materials with a focus on improving the long-term sustainability. Previously due to rich availability of materials, bituminous overlays had been the most common overlay option for restoring and improving the structural capacity of the existing pavements of Indian roads. However, the overlay often tends to degrade rapidly, hence failing its purpose of long-term sustainability. Using a layer of Portland cement concrete on the existing bituminous pavement, known as “white-topping” is a popular technique for rehabilitating the existing surface [3]. Fibre-reinforced white topping is a relatively new technique that can be effectively used to rehabilitate existing pavements as it provides better flexural toughness, impact resistance and flexural fatigue life endurance as compared to conventional white toppings.
However, commercialisation of these alternative products and concepts are often restricted due to additional initial investment and lack of knowledge on long-term cost savings and environmental benefits. Moreover, excessive usage of these materials can provide adverse environmental effects which can cause both short-term and long-term impacts on environments and societies. Thus, the current study presents a comparative cost and carbon emission analysis of using fibre-reinforced white toppings as a road rehabilitation method. The findings of the study will be useful for interested researchers who are keen on promoting sustainable products in road infrastructure sector.

2. Background and Research Significance

As per NCHRP Synthesis 338, white topping is a layer of cement concrete laid on top of an existing hot mix asphalt pavement as a rehabilitation alternative. It was recommended that bonding condition between the two layers must be assumed during design and construction stages [4]. Several previous studies have emphasised that the overlays help in allowing the existing pavement to stay in place which will further contribute in reducing the time required for rehabilitation [5]. White topping can be conventional, thin and ultra-thin based on the thickness of the overlay. Conventional white topping overlay is usually 200 mm in thickness and is constructed without considering the bond between the overlay and underlying pavement. Thin white topping is an overlay of concrete between 100 mm and 200 mm and in most of the cases are constructed with an intentional bond to the existing pavement. Ultra-thin white topping is an overlay of concrete with a thickness equal to or less than 100 mm that requires a bond to the underlying pavement for higher performance. Design and construction of conventional white topping is quite similar to cement concrete pavements while thin white and ultra-thin white toppings are characterised by thickness, spacing between joints and bonding provided with the underlying layer.
Often studies have highlighted the structural improvements despite the slight increase in cost due to incorporation of fibres in the overlay concrete mix [4]. The ability to resist shattering can be improved significantly using fibres in concrete [6]. A slight reduction of workability will be induced in the concrete matrix due to the incorporation of fibres, but this can be very well compensated by introducing superplasticizers into the mix. Hybrid fibre reinforced concrete is basically a combination of different types of fibres, with varying material properties which remain bonded together inside the concrete matrix while retaining their identities and properties. Optimisation of fibre content is important as it may provide the most practical solution with maximised economic benefits [7]. Several other studies used both experimental and modelling analysis to compare different characteristics of using fibre in road pavements. Jundhare et al. used a three-dimensional finite element analysis for a 150-mm thick bituminous pavement resting on subgrade and a conventional white topping of 320-mm thick overlay. After applying axle loading, nonlinear static analysis was carried out and was found that the maximum stresses due to the wheel loading and temperature differential along with deflections are within the permissible limits [8]. Vandenbossch and Barman concluded that the reflection cracking performance of an in-service pavements was influenced by the thickness of plain cement concrete overlay and hot mix asphalt layer, panel size, climatic conditions, and the accumulated vehicle loads while the rate of development of cracks depends on the load-related stresses in the overlay [9]. Increasing the thickness of both overlay and panel size exhibited the same effectiveness in decreasing reflection cracking.
Several studies attempted to estimate and compare emissions and costs associated with road construction [10,11,12]. These studies either predominantly estimated carbon emissions or compared costs associated with the product manufacturing or the whole process of road construction. A study conducted in Korea highlighted that carbon emissions of road construction stage accounts for 75 to 86% of the total carbon emissions of the project, exceeding carbon emissions in the other stages such as maintenance and demolition [13]. This indicates the importance of considering emission optimisation options at aggregate level during construction stage of a road construction project. Several other studies have attempted to estimate carbon emissions of road construction projects at network, provincial or global level [14,15,16]. The focus of these studies was predominantly to evaluate and compare emission profiles of different types of assets at different regions to facilitate future decision-making and design processes. Several other studies have conducted investigations on potential use of waste materials and fibre-reinforced composites in concrete pavement applications [17,18,19]. However, the focuses of these studies were predominantly on the mechanical, chemical or thermal characteristics of the specimens as compared to the normal concrete pavements. One study evaluated the environmental impact of carbon-fibre-reinforced polymer on reinforced flexural beams. The results indicated significant reduction of global warming, human toxicity, ozone depletion impact categories of carbon fibres in beams. Another similar study conducted the carbon emissions and cost analysis of using glass fibre-reinforced recycled concrete [20]. The results indicated that 0.25% glass fibre content can achieve cost savings in the concrete pavement specimens. A recent study conducted economic and environmental analysis of using hooked steel fibre, glass fibres, and polypropylene fibres in a concrete composite pavement [21]. Results indicated that steel fibre is superior in mechanical performance while all the specimens provided eco-friendly and cost-effective pavements. However, none of the studies have attempted to find the optimal cost effective and eco-friendly solution with plastic fibre composites in road pavement.
Some studies attempted to evaluate cost savings of white toppings in pavements. One study estimated that for low to moderate traffic, white topping overlays can be used as a cost-effective rehabilitation alternative with overlay thickness between 100 mm and 250 mm [22]. The study further illustrated that cost savings per kilometre can be achieved for both ultra-thin white topping and thin white topping. Atakilti and Satish estimated associated costs of 90 flexible pavements and 63 rigid pavements and observed that flexible pavements are more economical for less traffic volumes. Despite extensive research studies on exploring mechanical properties and economic benefits at separate levels, none of the previous studies explored the benefits at an aggregate level [23]. Nevertheless, using a white topping layer incurs additional initial cost and often contractors and engineers seek to minimise the associated costs while maximising the benefits. Besides, using fibre materials made from plastic would generate carbon emission burdens. However, none of the previous studies have conducted an optimisation study to compare carbon emissions and manufacturing cost to optimise the material usage in road rehabilitation projects. This signifies the importance and the contemporary requirement of undertaking the current study.

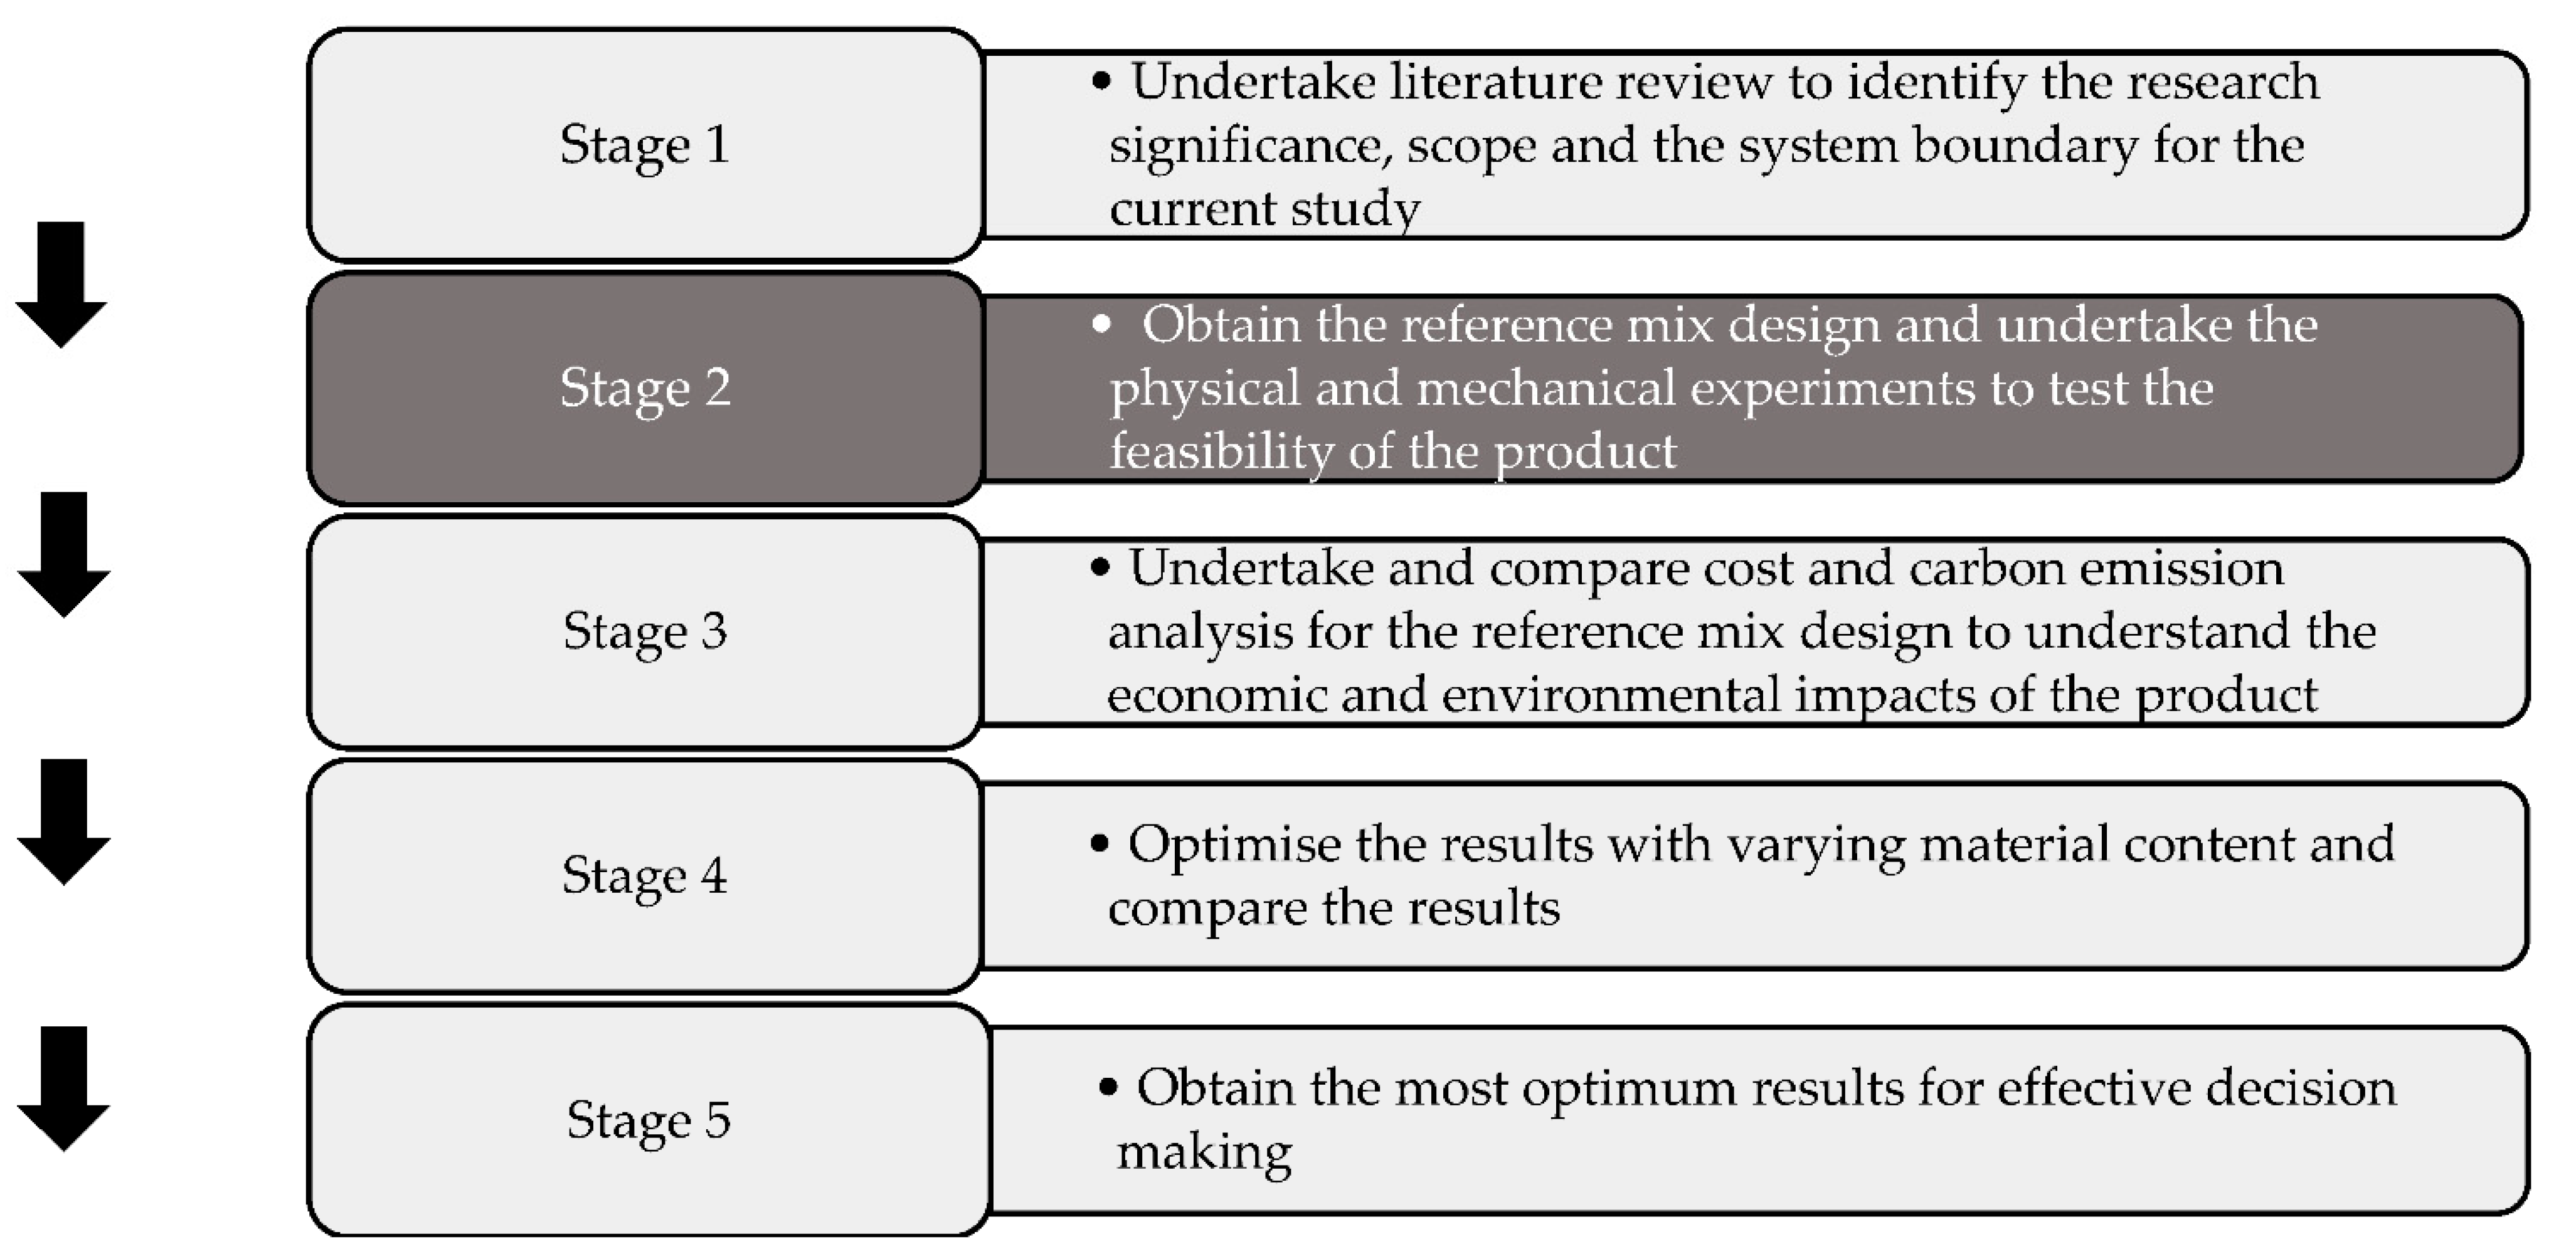
3. Research Methodology

The research methodology for the current study can be divided into five distinct stages as shown in Figure 1. Stage 2 of the methodology was excluded from the system boundary of the study as the content is covered in another publication. Stage 1 of the methodology focuses on undertaking a thorough literature review to finalise the study scope, models for analysis and define the objectives based on the research significance. In stage 3, material production costs and carbon emission of the reference samples were compared for the reference mix design samples. In Stages 4 and 5 the most optimum mix designs are obtained using different material contents and the resulting values are critically discussed to facilitate effective decision-making.

4. Mix Design and Experimental Procedure

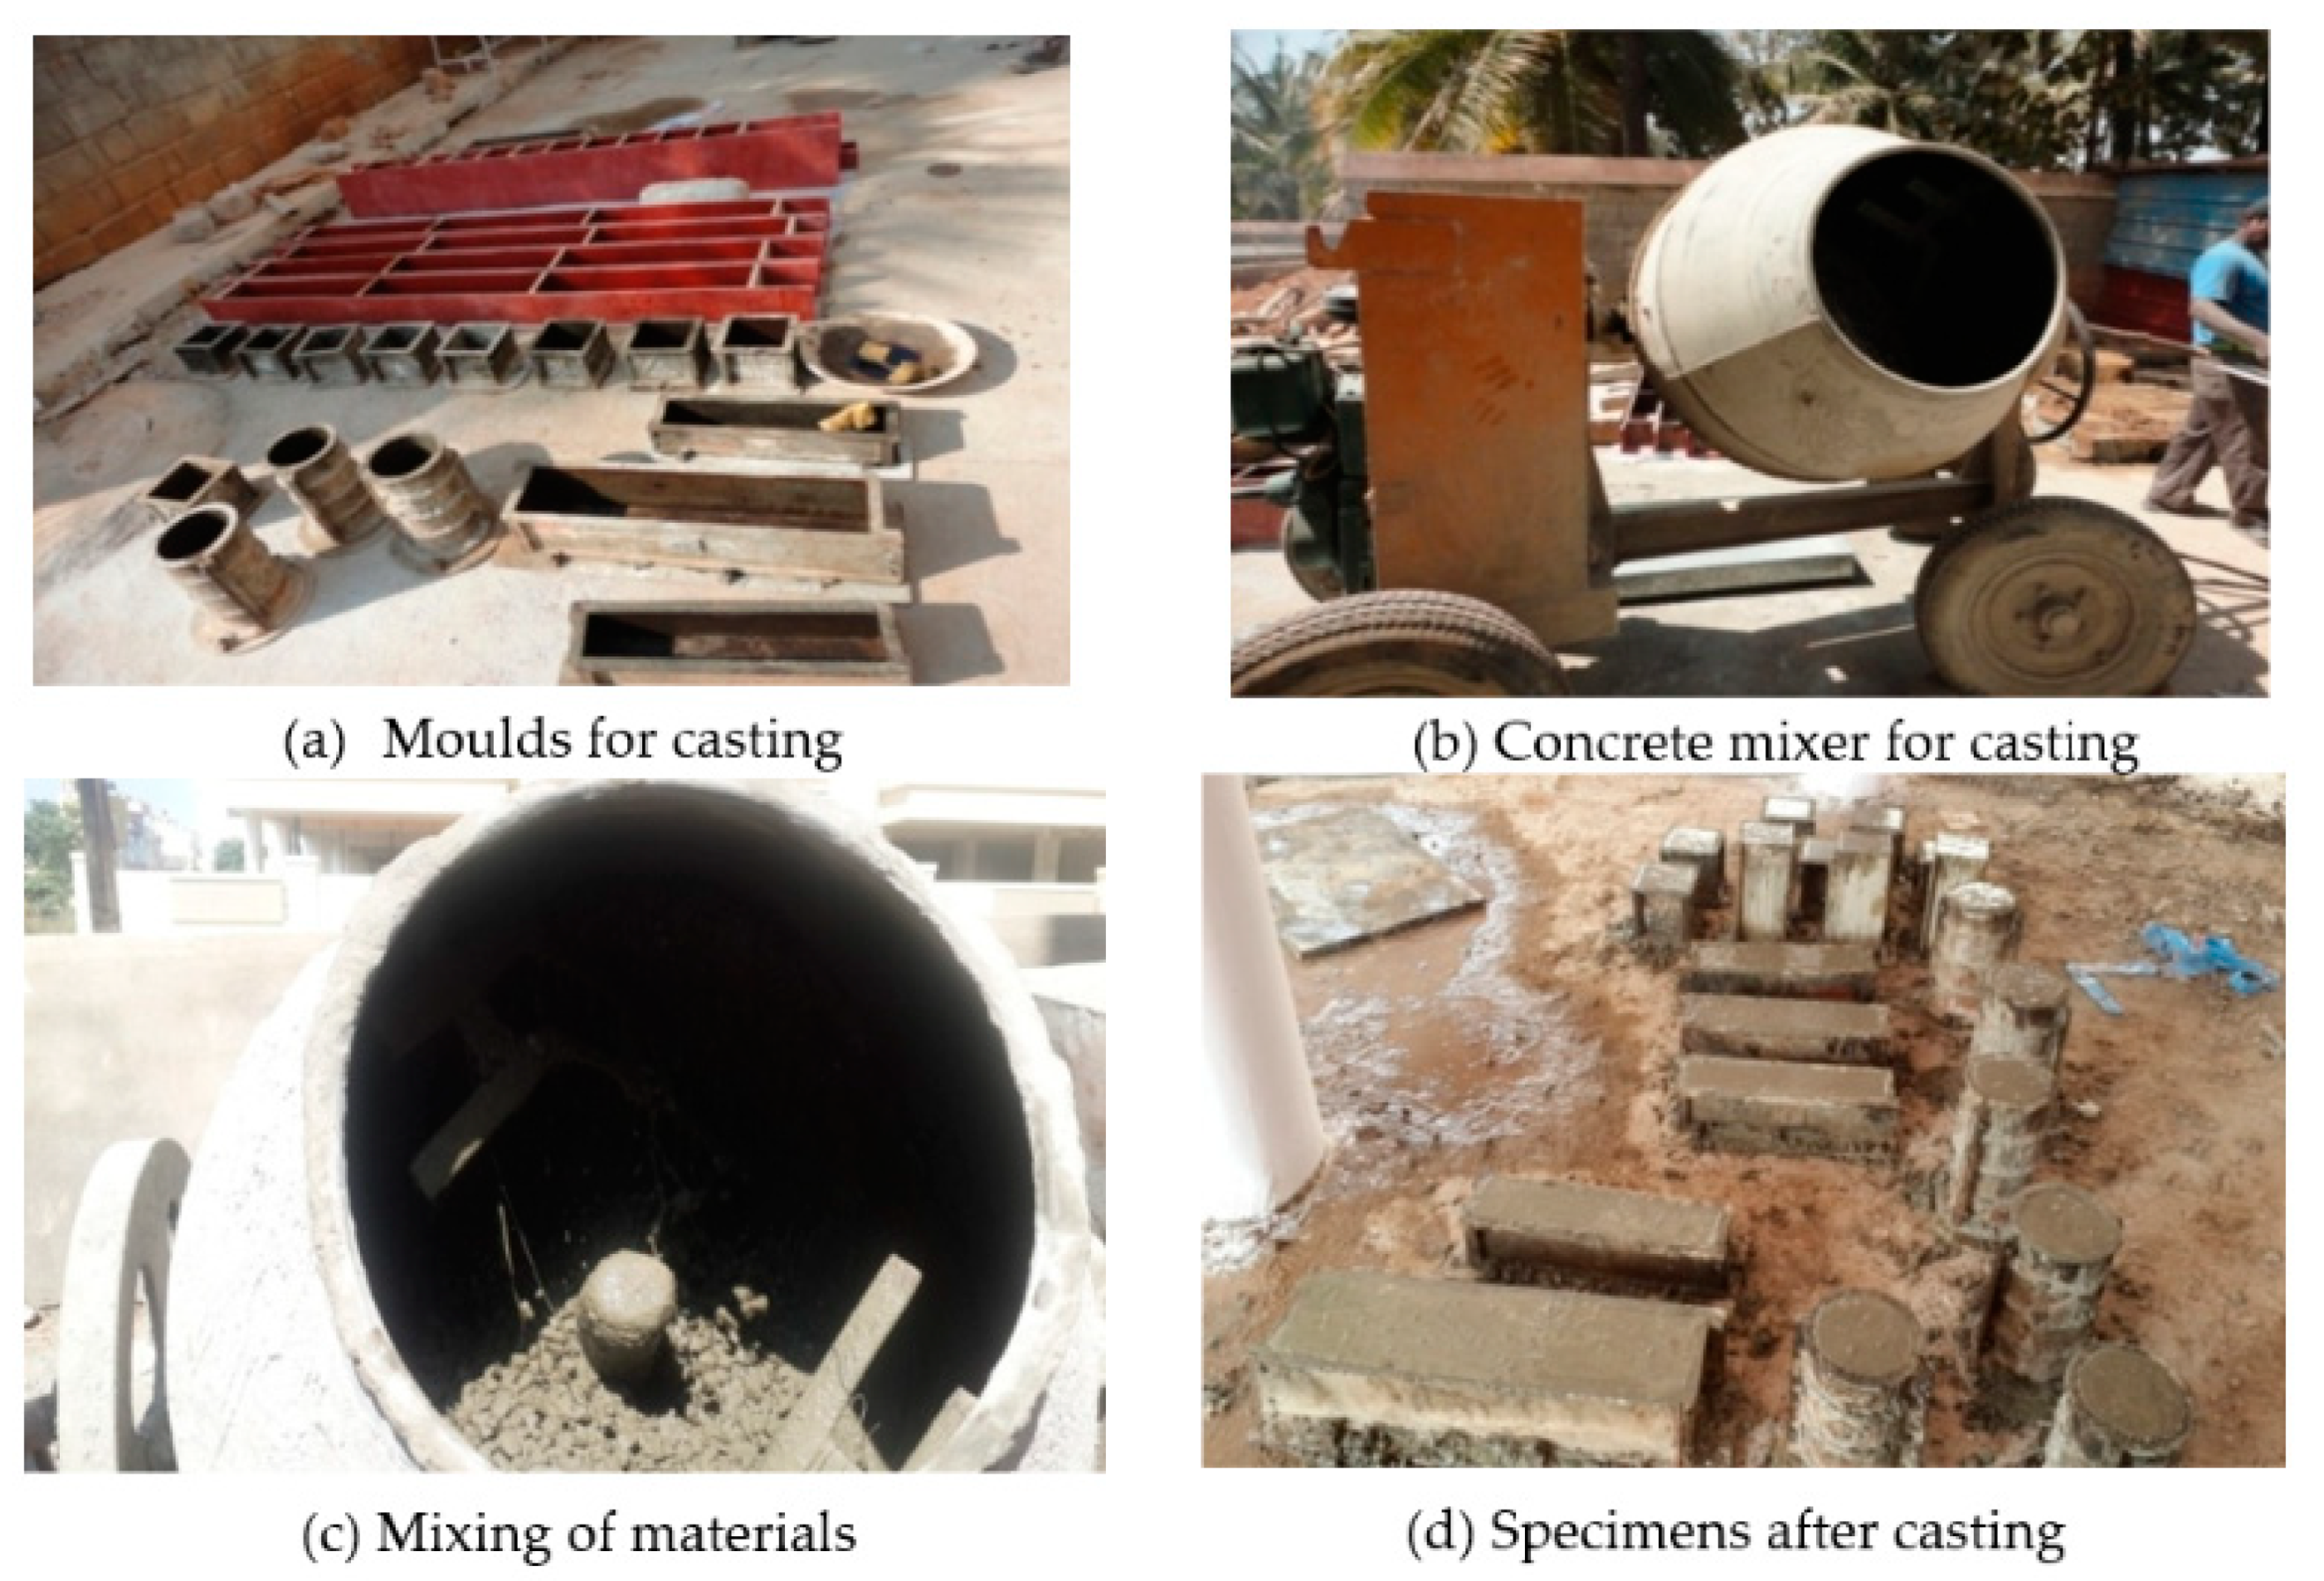
4.1. General Experimental Details

Materials used for the study including coarse aggregates, fine aggregates and cement were characterised for their basic properties. Mix design for M40 (40 MPa) grade of concrete was made using Indian Road Congress Code, IRC: 44–2008 [24]. Fibres of three types namely type 1 (F1), type 2 (F2) and type 3 (F3) were used in the mix. Investigation on previous studies highlighted that a mixture of two or more low modulus fibres in hybrid form had not been explored. Therefore, a hybrid mix design (H1) using a mixture of all three types of fibres of equal portions was also considered. Details and material properties of the three types of fibres are listed in Table 1. Two of them were polyolefin based and one was polypropylene based while all three were low modulus fibres. In addition to the four fibre concrete mixes, a plain concrete mix (without fibre) was used as a control sample.
Superplasticizers were added into the concrete mix to improve the workability which was reduced due to addition of fibre. Addition of superplasticizers further helps to reduce the amount of water required without affecting the strength of concrete mix. The present study used a polycarboxylic ether-based superplasticizer which is a light brown liquid with specific gravity of 1.1 at 25 °C, pH of greater than 6.0 and a chloride ion content of less than 0.2%.
About 45 cement concrete cubes of 150 mm × 150 mm × 150 mm size, 45 cylinders of 150 mm diameter and 300 mm height and 30 beams of 500 mm × 100 mm × 100 mm size were casted for all five specimen types and then cured prior conducting the tests to determine the compressive, tensile and flexural strengths respectively. Total of 45 cube specimens and 45 cylinders were selected to obtain the compressive and tensile strength at 3 days, 7 days and 28 days while 30 beams were used to obtain the flexural strengths at 7 days and 28 days respectively. Figure 2 represents casting details of the concrete specimens. Rebound hammer test was conducted for the cube specimens to get a rough estimate of the compressive strength. Compressive, flexural and split tensile strength were also determined. Quality of concrete was analysed using ultrasonic pulse velocity method and stress–strain relationships and modulus of elasticity of different mixes were determined. The resulting compressive, flexural and split tensile strengths are presented in the current study.
The mix design quantities and mixing procedure were based on the guidelines given in the code; IRC: 15–2002 [25]. The maximum cement content in the mix was determined to be 425 kg/m3. The details of the mix design are shown in Table 2. The fibre content in each of the combinations was determined based on previous studies and guidelines provided in IRC: SP: 46–2013 [26]. Fibre amounts considered in each combination are illustrated in Table 3.

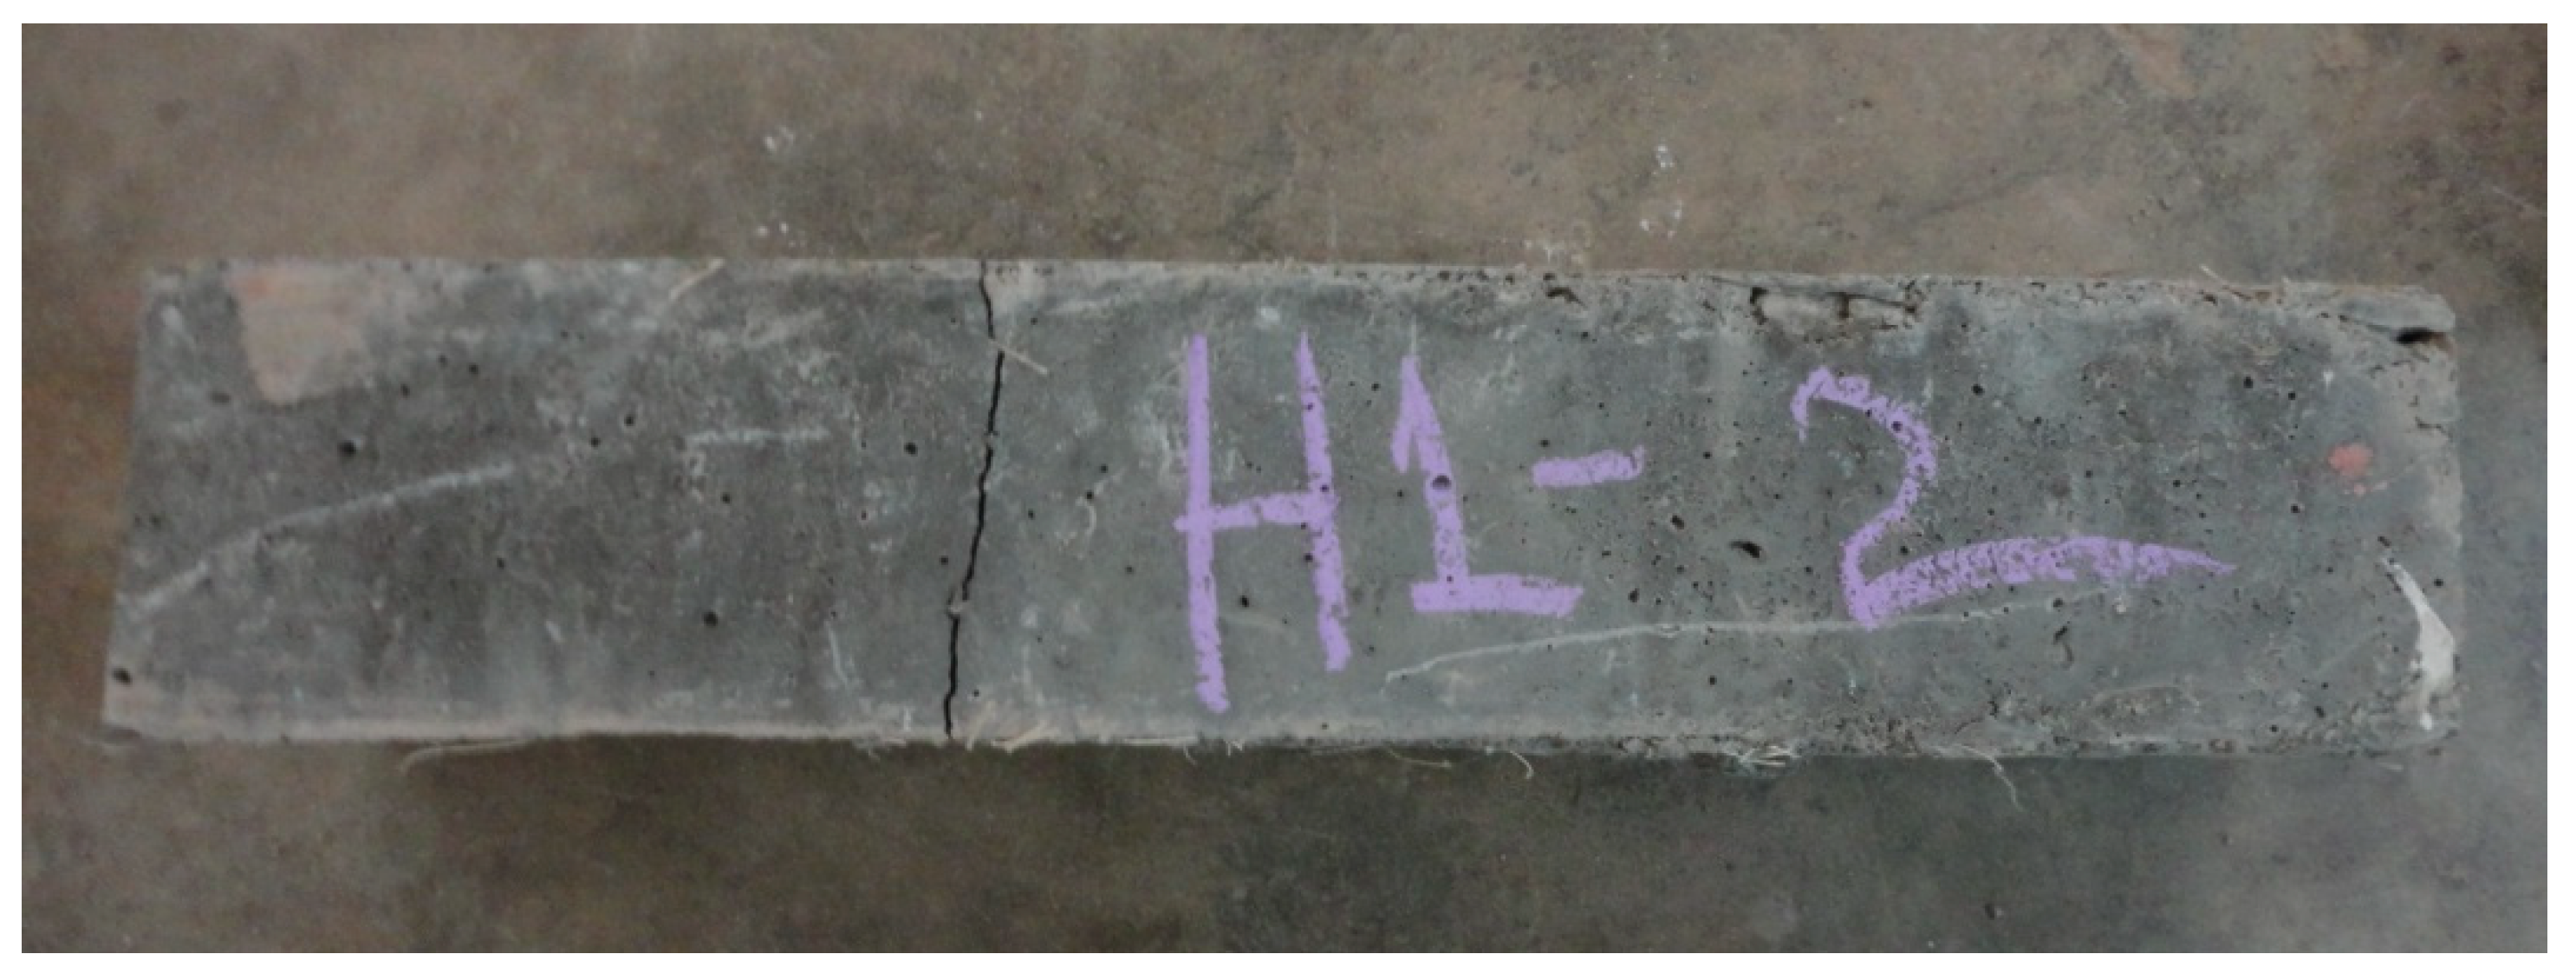
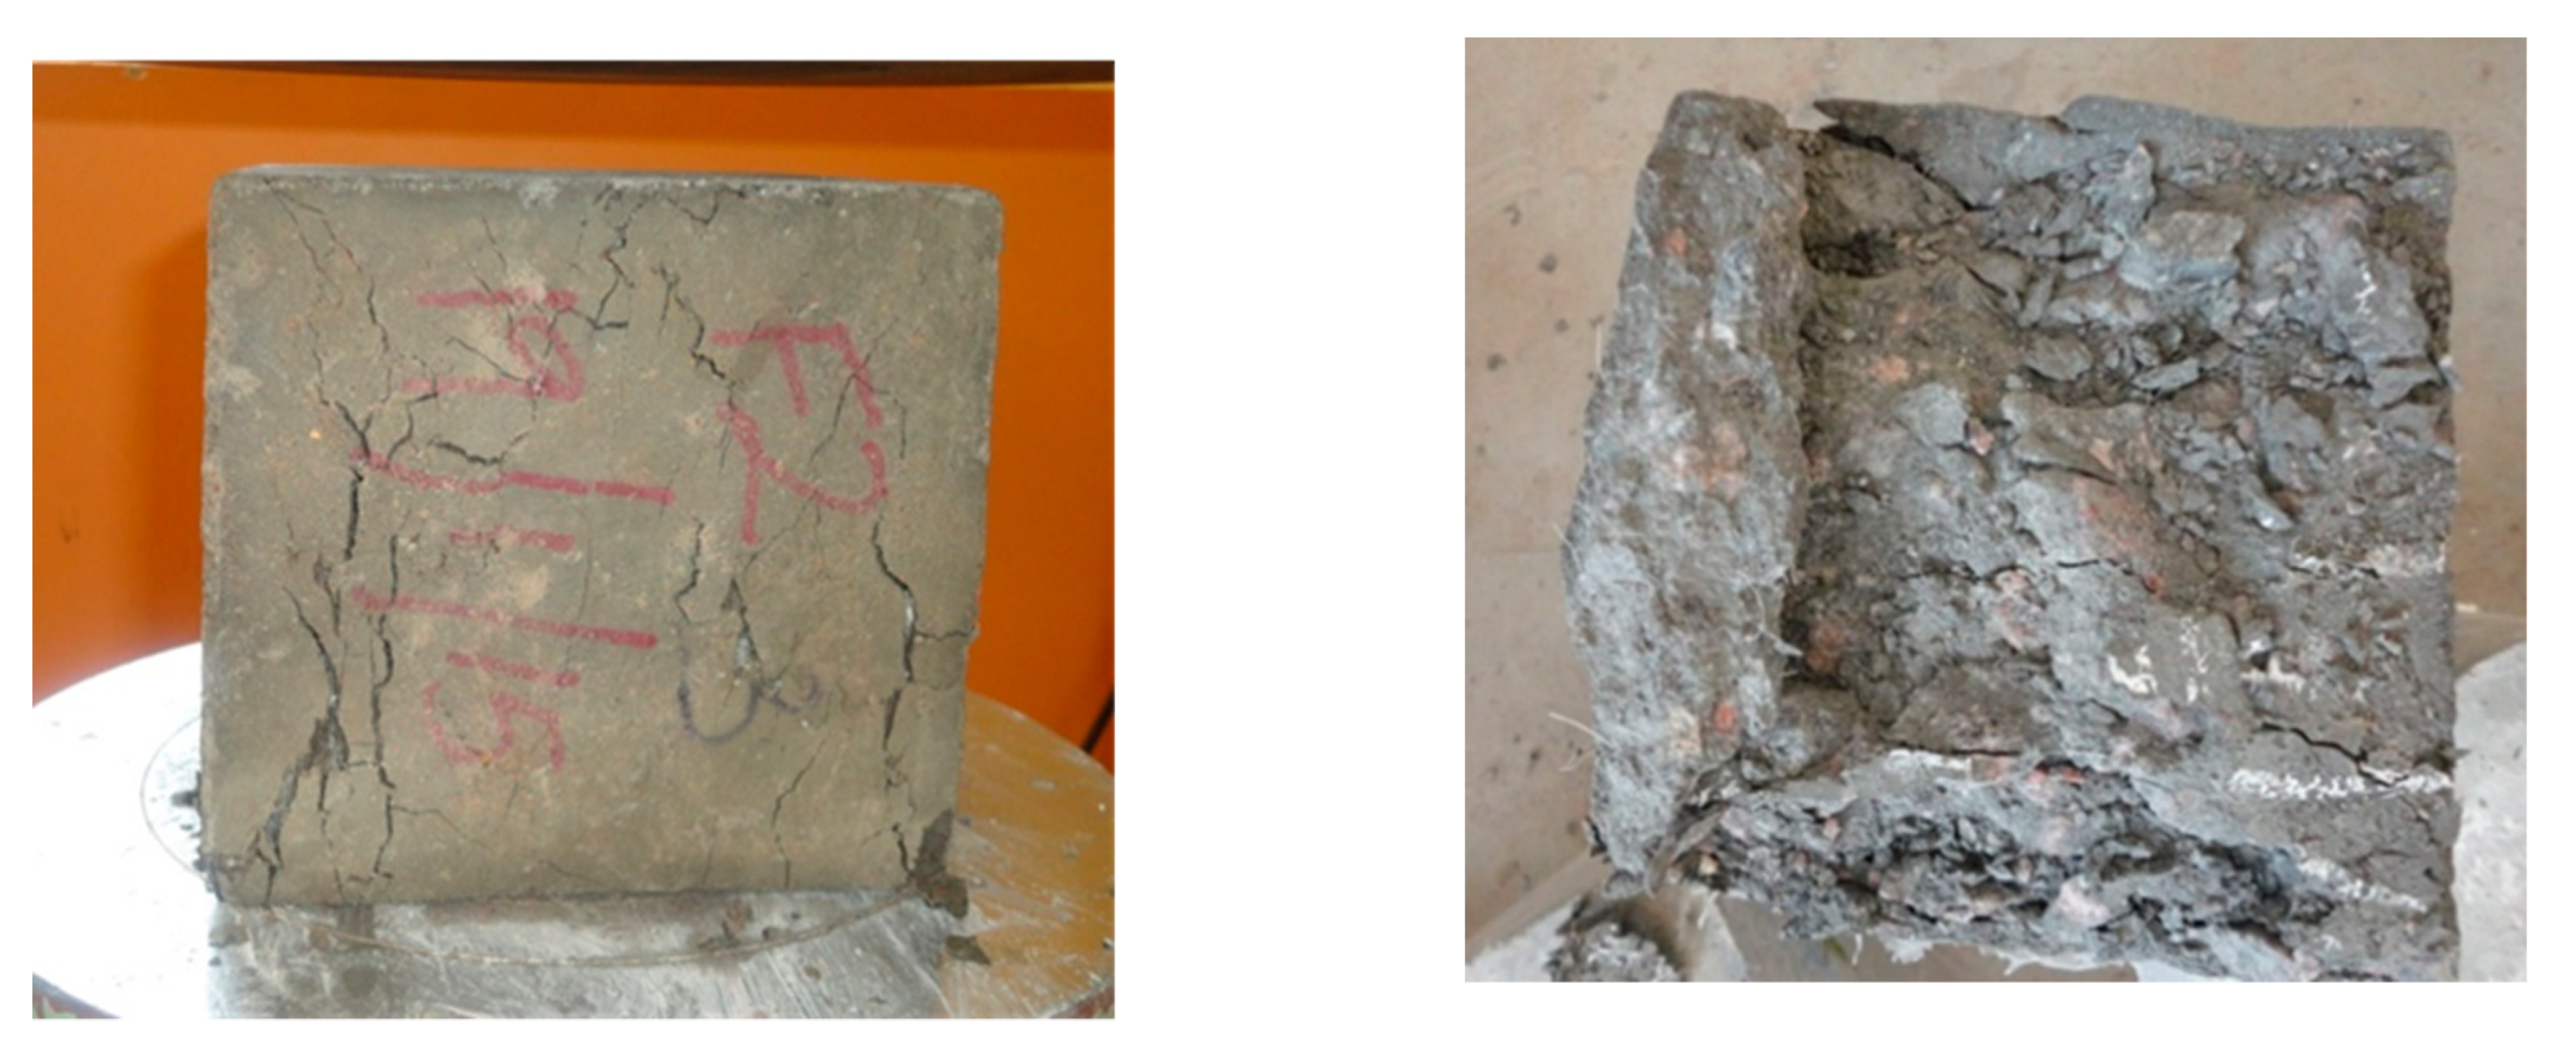
4.2. Compressive Strength Testing Procedure

Compression tests were conducted using universal testing machine (UTM). The cubes were placed over loading platform of UTM and load was applied over the cubes until the specimen failed. Compressive strength was determined by obtaining the ratio between the load at failure (N) and the cross-sectional area of cube as shown in Equation (1). The average compressive strength was calculated by considering at least three samples. The failed samples are illustrated in Figure 3. Compression test was done with the help of compression testing machine.
Compressive   Strength   in   N / mm 2 = Ultimate   Load   at   Failure   in   N Area   of   cross   sec tion   in   mm 2

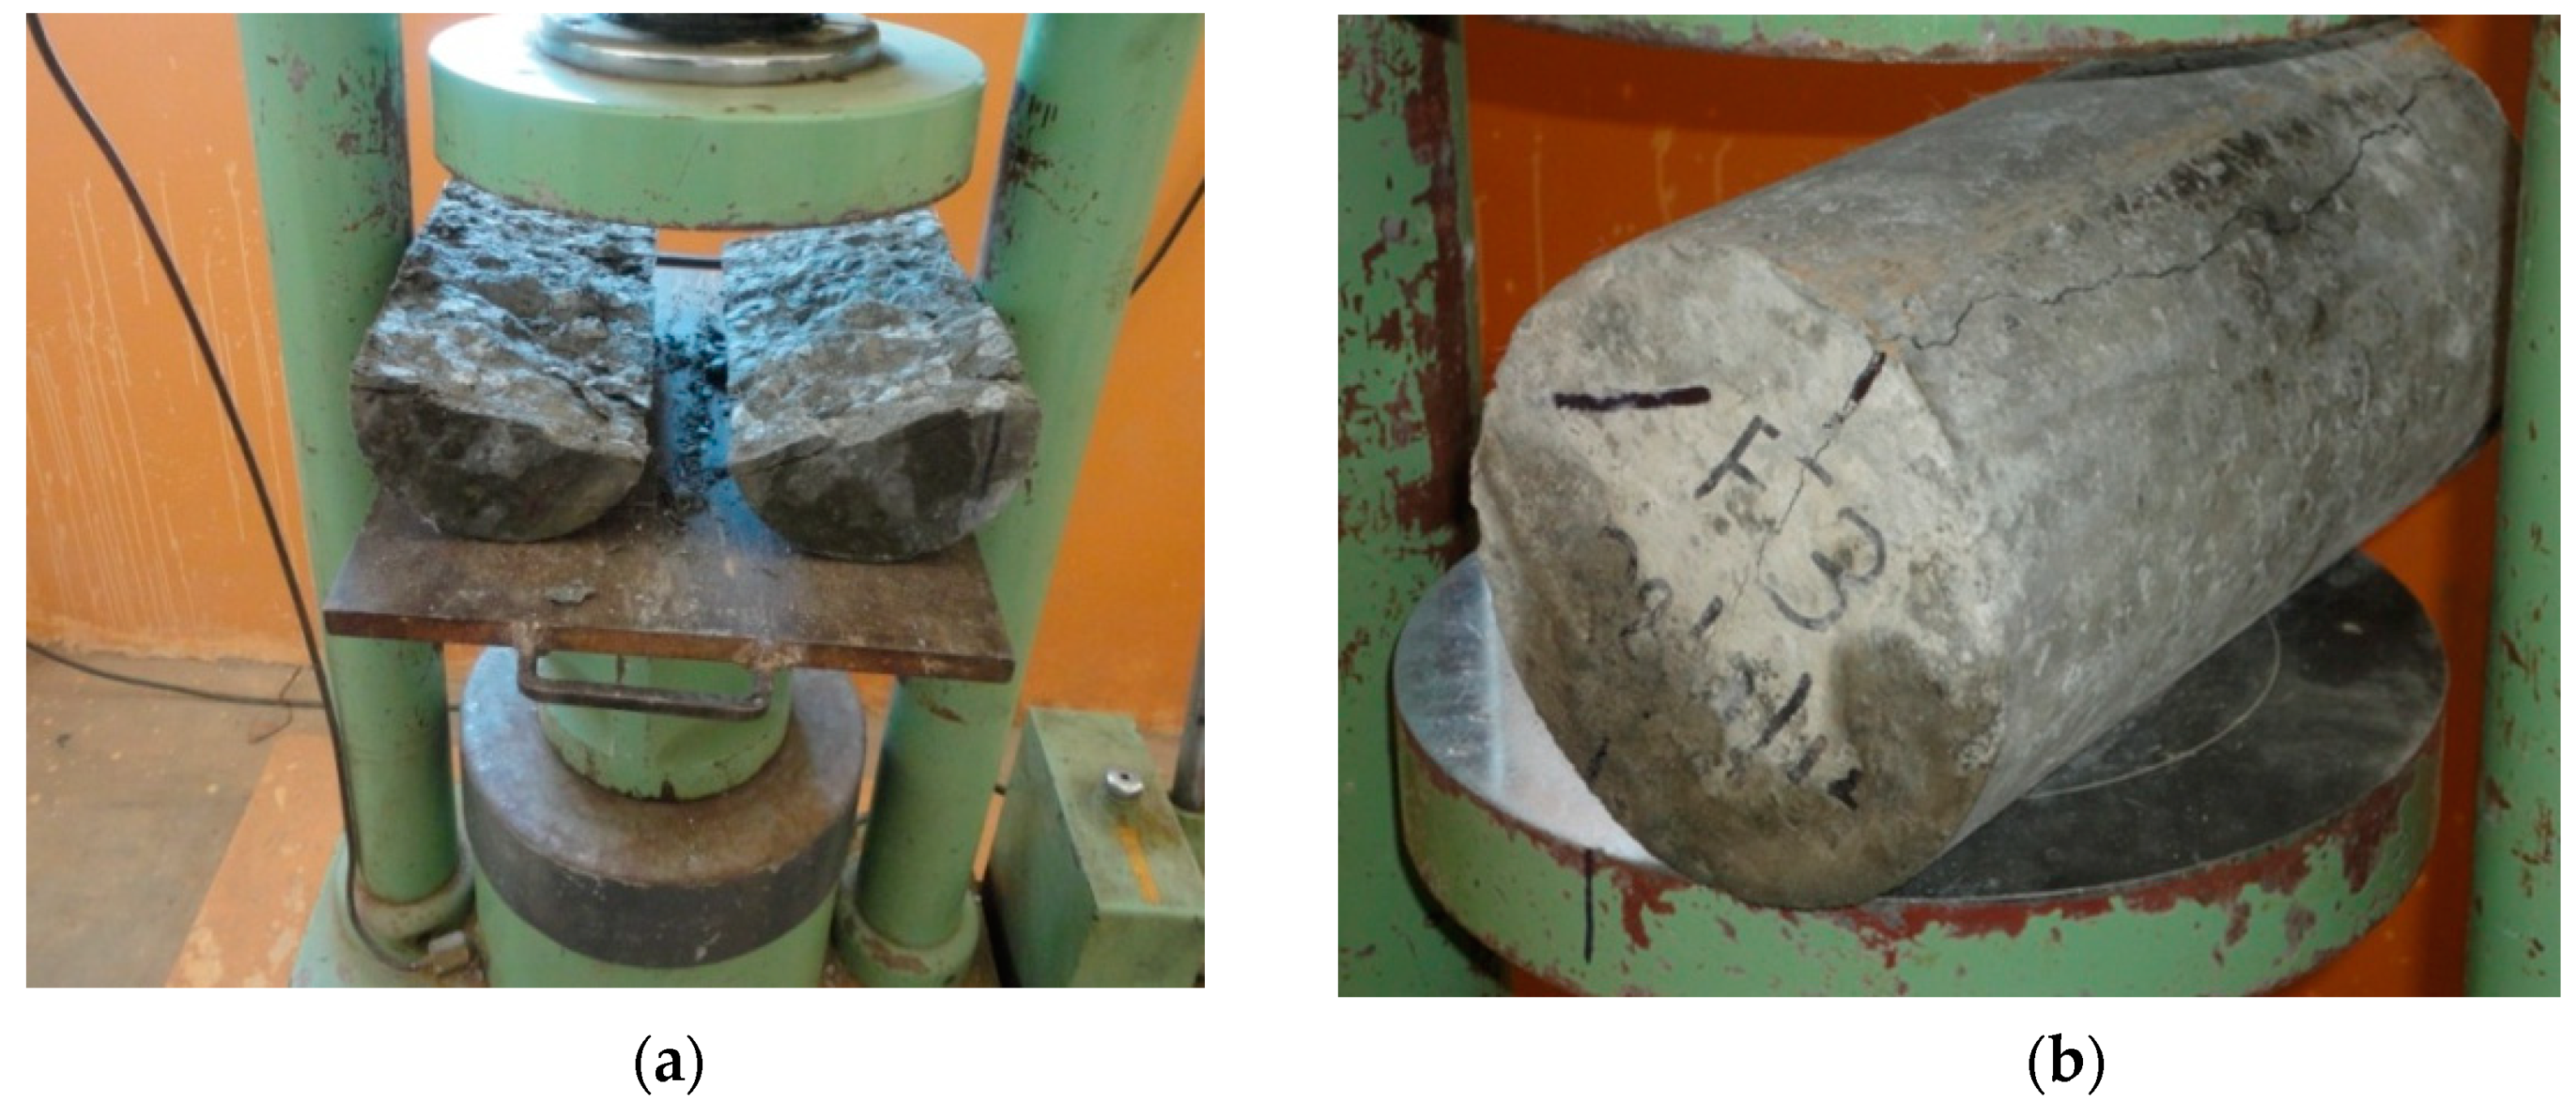
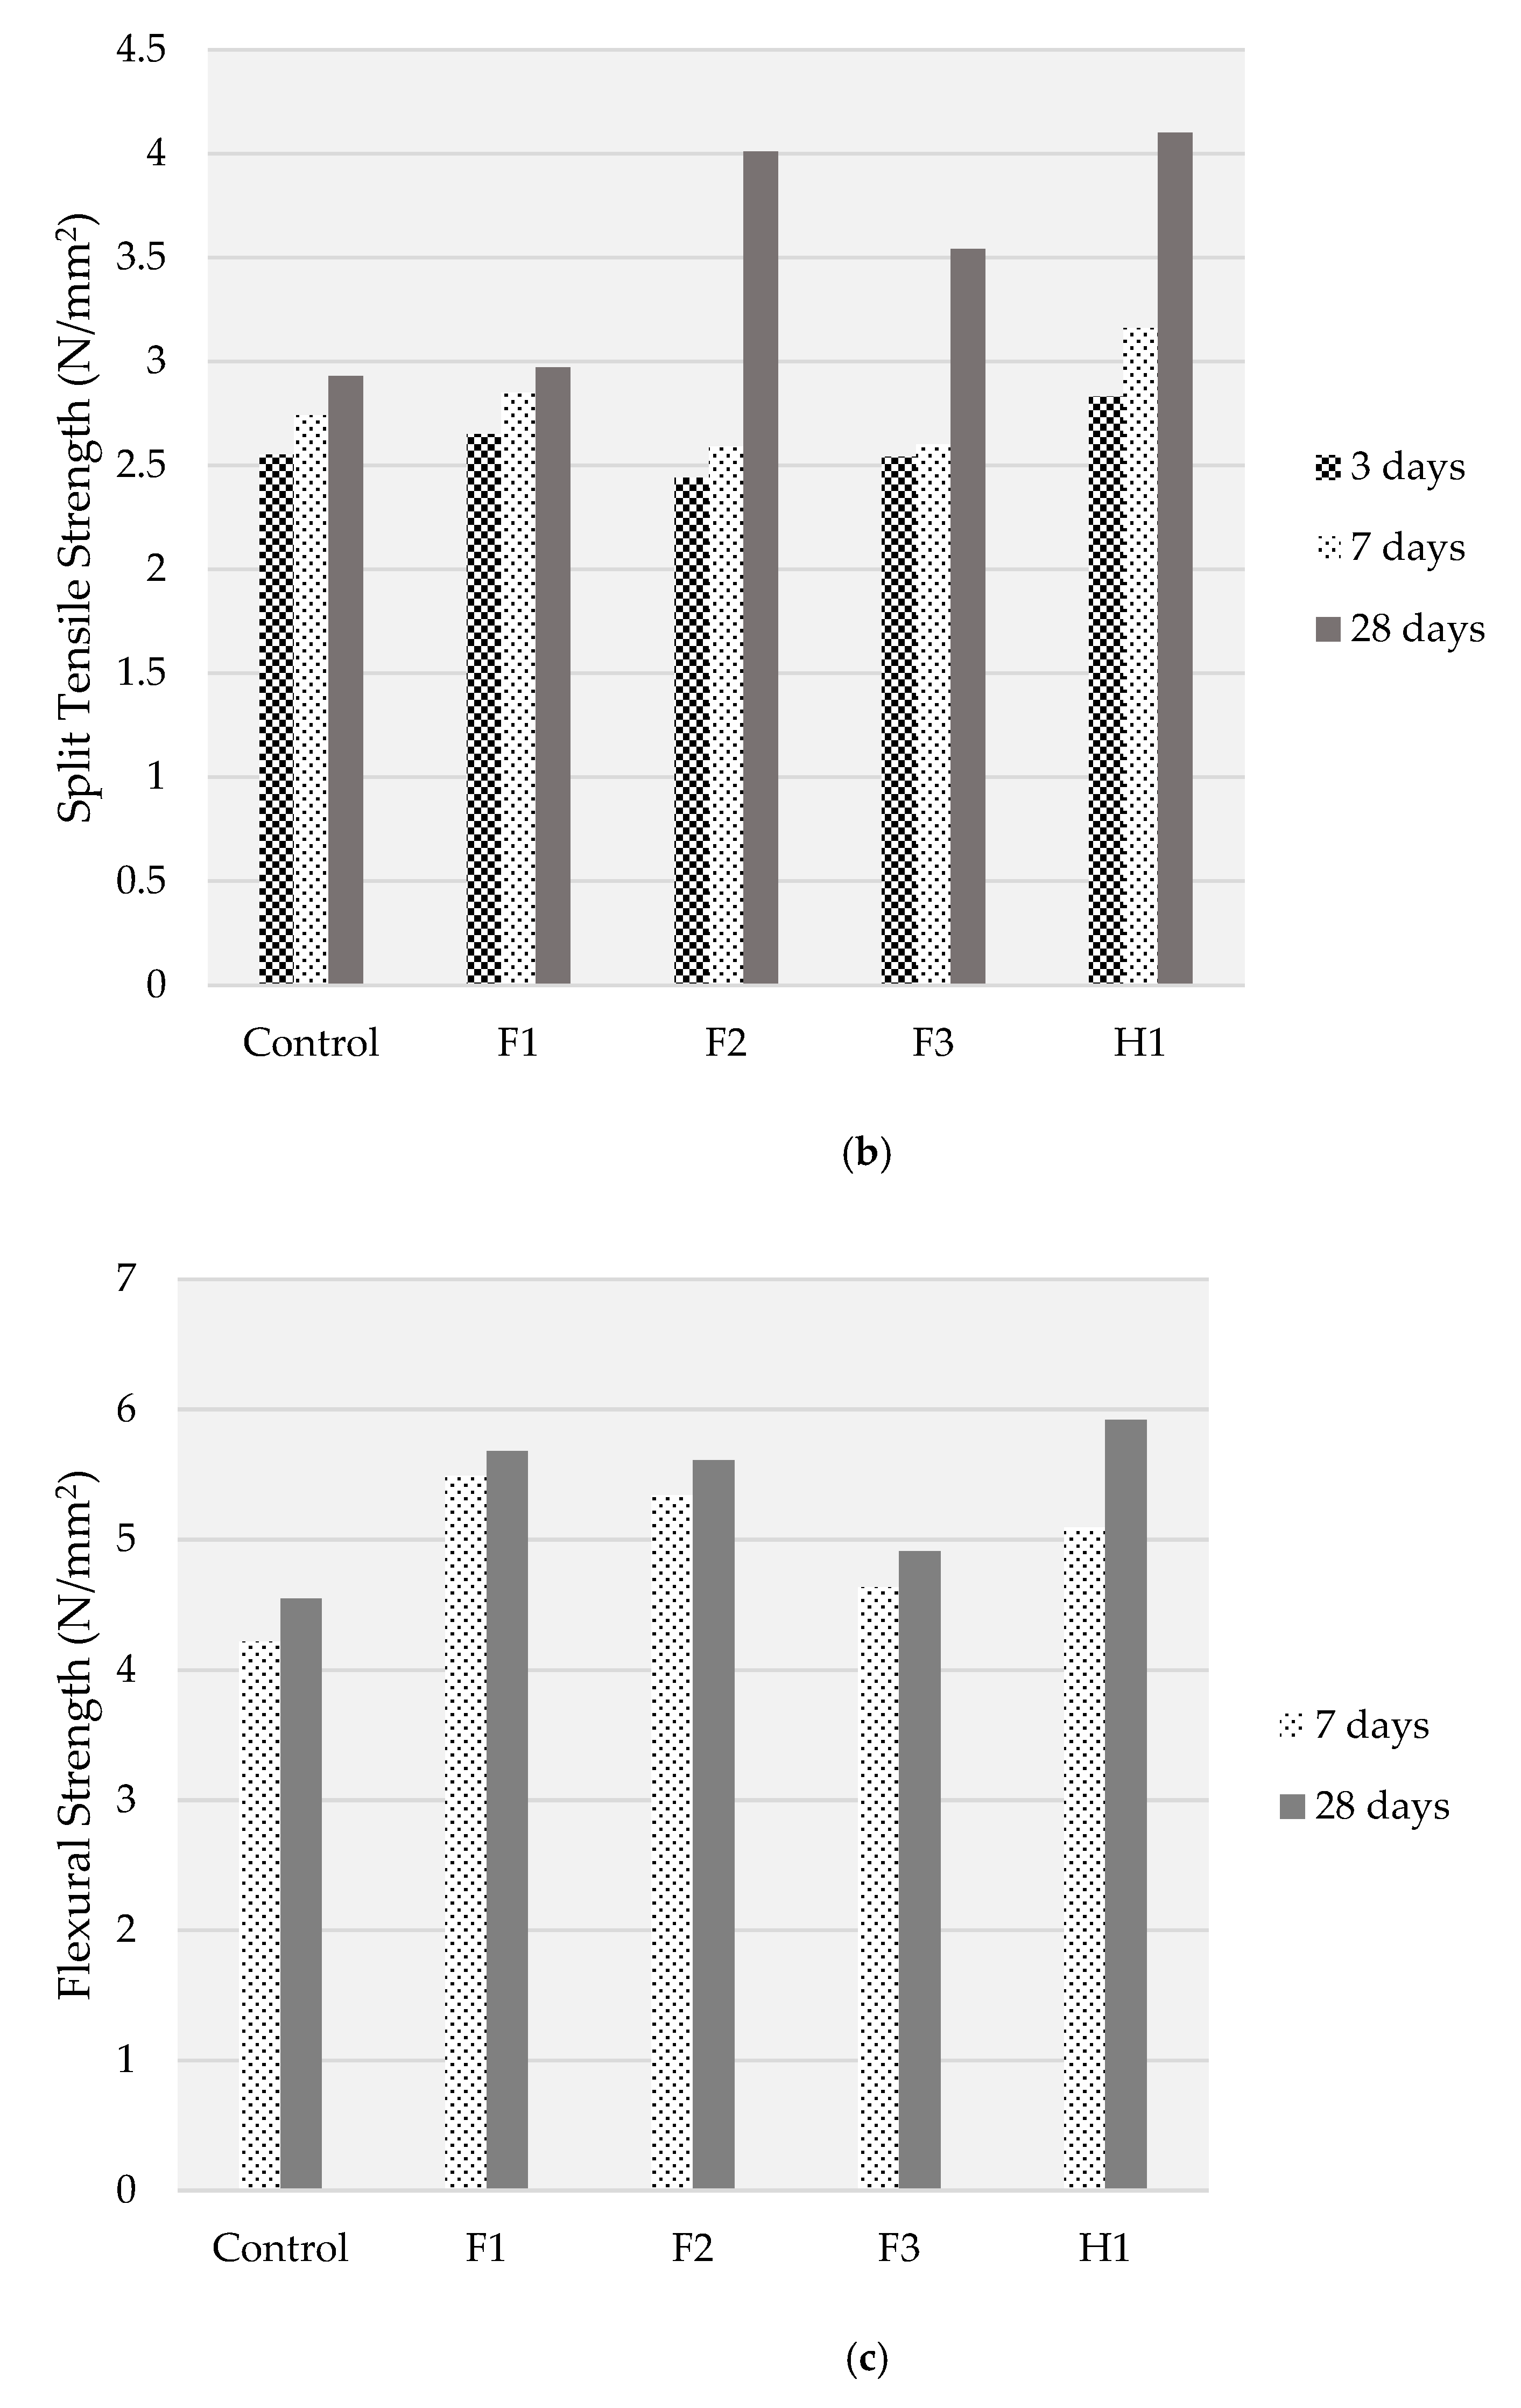
4.3. Split Tensile Strength Testing Procedure

Split tensile test was carried out by placing cylindrical specimens in the horizontal form in between the loading surfaces of compression testing machine. Load was then applied until failure. The test procedure adopted was based on the specifications given in IS: 516–1959 [31]. Due to low tensile strength and brittle nature, the concrete cannot resist direct tension. Therefore, the result from this test is important to investigate the tensile strength of the specimens. Split tensile strength is calculated using the Equation (2).
Split   tensile   strength   in   N / mm 2 = 2 × P π × d   × h
where, P is the ultimate load at failure in N, d is the diameter of the cylindrical specimen in mm and h is the height of the specimen in mm. The specimens reinforced with fibres illustrated better resistance to shattering as compared to plain control sample as shown in Figure 4.

4.4. Flexural Strength Testing Procedure

Two-point loading was applied to the specimen using a hydraulically operated loading machine. A constant rate of loading of 400 kg/min was applied throughout the test until the final load at failure was observed. The test was done as per IS: 516–1959 guidelines [31]. Flexural strength value is an indication of the modulus of rupture of the beam. Better resistance to shattering due to incorporation of fibres in concrete specimens is clearly visible in the beam specimen given in Figure 5.
Flexural strength of the specimen was calculated using the Equation (3).
Flexural   Strength   in   N / mm 2 = Q   × L b   × d 2
where, Q is the ultimate load at failure in N, L is the length of the span on which the specimen is supported in mm, b is the measured width of the specimen in mm and d is the measured depth of the specimen in mm.

5. Assessment Models and Methodology

5.1. Goal, Scope, System Boundary and Functional Unit

The main goal of this study was to identify, compare and analyse carbon emissions and manufacturing costs related to production of concrete white toppings with inclusion of fibres. The production of specimens was setup at laboratory scale to facilitate effective comparison and enable potential environmental and economic improvements. Effective comparison of environmental impacts and manufacturing cost is strongly dependent on proper definition of functional unit of the product and hence the study adopted “one cubic metre of concrete” as the functional unit.
System boundaries for the current study involved a cradle-to-factory boundary including acquisition of raw materials, transportation of raw materials and production of the main product. Since the manufactured product was experimentally compared with varying material content for performance, maintenance, usage and end-of-life life cycle stages are assumed to be similar and hence excluded from the comparative analysis.

5.2. Mathematical Models and Inventory Analysis

The following mathematical models were used in the study to estimate carbon emission and production cost. Embodied emissions from raw materials used in concrete can be determined from Equation (4).
Em = ∑ Qi × Ec,i
where, Em is the embodied CO2 emission of raw material (i) used in the mix design in kgCO2-eq, Qi is the amount of ith material used in kgs and Ec,i is the embodied carbon emission factor for ith material in carbon dioxide equivalents (kgCO2-eq/kg). The study used raw material carbon emission factors published in ICE database for general context [29,30]. Carbon emissions due to transportation of raw materials and fossil-fuel operated equipment can be determined based on the Equation (5).
E t   ( or   E eq ) = Q j × E C j × E F j 1000
where: Et and Eeq are the CO2 emissions from transportation and equipment usage for the fuel type (j) respectively, Qj is the quantity of the fuel type (j) in kL, ECj is the energy content factor for fuel type (j) in GJ/kL and EFj is the CO2 emission factor for the fuel type (j) in kgCO2-eq/GJ. Carbon emission due to electricity consumption and material manufacturing costs were determined from Equations (6) and (7). An average carbon emission factor due to fossil fuel combustion in mobile vehicles and stationary equipment is used as 0.159 kgCO2/t-km and 2.62 kgCO2/L respectively [32,33,34].
Eelec = Ee × P × h
Cp = ∑ UCm × Qm
where Eelec is the carbon emission due to electricity consumption, Ee is the carbon emission factor in kgCO2-eq/kWh, P is the power of the machine in kW and h is the machine operation hours. Cp is the material manufacturing cost, UCm is the unit raw material cost and Qm is the quantity of the mth raw material type. Table 4 highlights the energy sources used for electricity production in India and the average carbon emission factors.
Therefore, the weighted carbon emission factor for electricity was calculated as 0.861 kgCO2/kWh.

5.3. Sensitivity Analysis Using Monte-Carlo Simulation

The objective of the sensitivity analysis was to check the influence of several input variables on the final output i.e., manufacturing cost and carbon emissions. The amount of fibre content in the mix design was optimised in the multi-objective optimisation analysis hence was not considered in the sensitivity analysis. The influence of only cement as a raw material was considered in the sensitivity analysis as it is the most significant raw material in concrete with high embodied carbon emissions and manufacturing costs. Table 5 highlights the considered inputs for the sensitivity analysis. Curve fitting was performed on each input variable data obtained locally and through published literature, and the corresponding probability distribution was obtained. Uniform distributions were assumed for transport distance and raw material as they were discrete values. Monte-Carlo simulation (MCS) with 10,000 iterations were performed with a statistical significance of 0.05 to obtain the output functions. MCS is a powerful sampling method that has the potential to perform parameter uncertainty analysis [37]. Simulations were conducted by generating a random variable using boundary range values specified in Table 5.

5.4. Multi-Objective Function

The study used multi-objective genetic algorithm (MOGA) which is a well-known multi-objective optimisation technique that can generate non-dominated optimal solutions from the reference solution [43]. The technique is a slow convergence population-based approach derived from natural selection in biological applications [44]. Based on the study scope and objectives, cradle-to-produce carbon emissions and manufacturing cost were considered in the optimisation problem and the Equations (8) and (9) were defined as the objective functions.
Objective function 1: Minimise manufacturing cost, MC = ∑ Cr + Cp + (Ct)r
Objective function 2: Minimise carbon emissions, Ec = ∑ y × (MEE + EE + TE)
where, Cr is the unit raw material procurement unit cost for rth material, Cp is the material production cost of the final product “p” and (Ct)r is the transportation cost to the manufacture plant of the rth raw material. MEE, EE and TE are the carbon emissions related to materials embodied emissions, equipment usage and transportation emissions in kg-emissions. “y” is the quantity of concrete in kg.
The main objective of the study was to compare the carbon emissions and economic savings of varying fibre content in the concrete mix design. The fibre content in the concrete mix design and transportation distance are key factors that could influence the total production cost and carbon emissions. Therefore, these two variables were considered in the optimisation assessment and sensitivity analysis.

5.5. Limitations and Assumptions

Any study is subjected to limitations and assumptions based on the scope and objectives of the study. The current study was subjected to following assumptions and limitations.
  • The study results were based on laboratory-scale production of materials, and mass-scale industry production could exhibit different results.
  • The study assumed that fibres used in the mix are extracted from plastic materials and the sorting, conversion process in the optimisation calculation.
  • The study considered a maximum fibre content based on the reference sample results and assumed varying fibre content do not affect physical and mechanical characteristics significantly.
  • In instances emission inventories were not available, emission factors were obtained from previously published literature.
  • Some other phenomena in concrete such as carbonisation and carbon sequestration were not considered in the current study.
  • Waste treatment and transportation of concrete raw material are not considered in the current study scope.
  • Retail prices were used for raw material procurement costs, and these may differ from bulk costs.
  • The study presented only compressive, split tensile and flexural strengths of the samples to demonstrate strength characteristics of the samples.

6. Results and Discussions

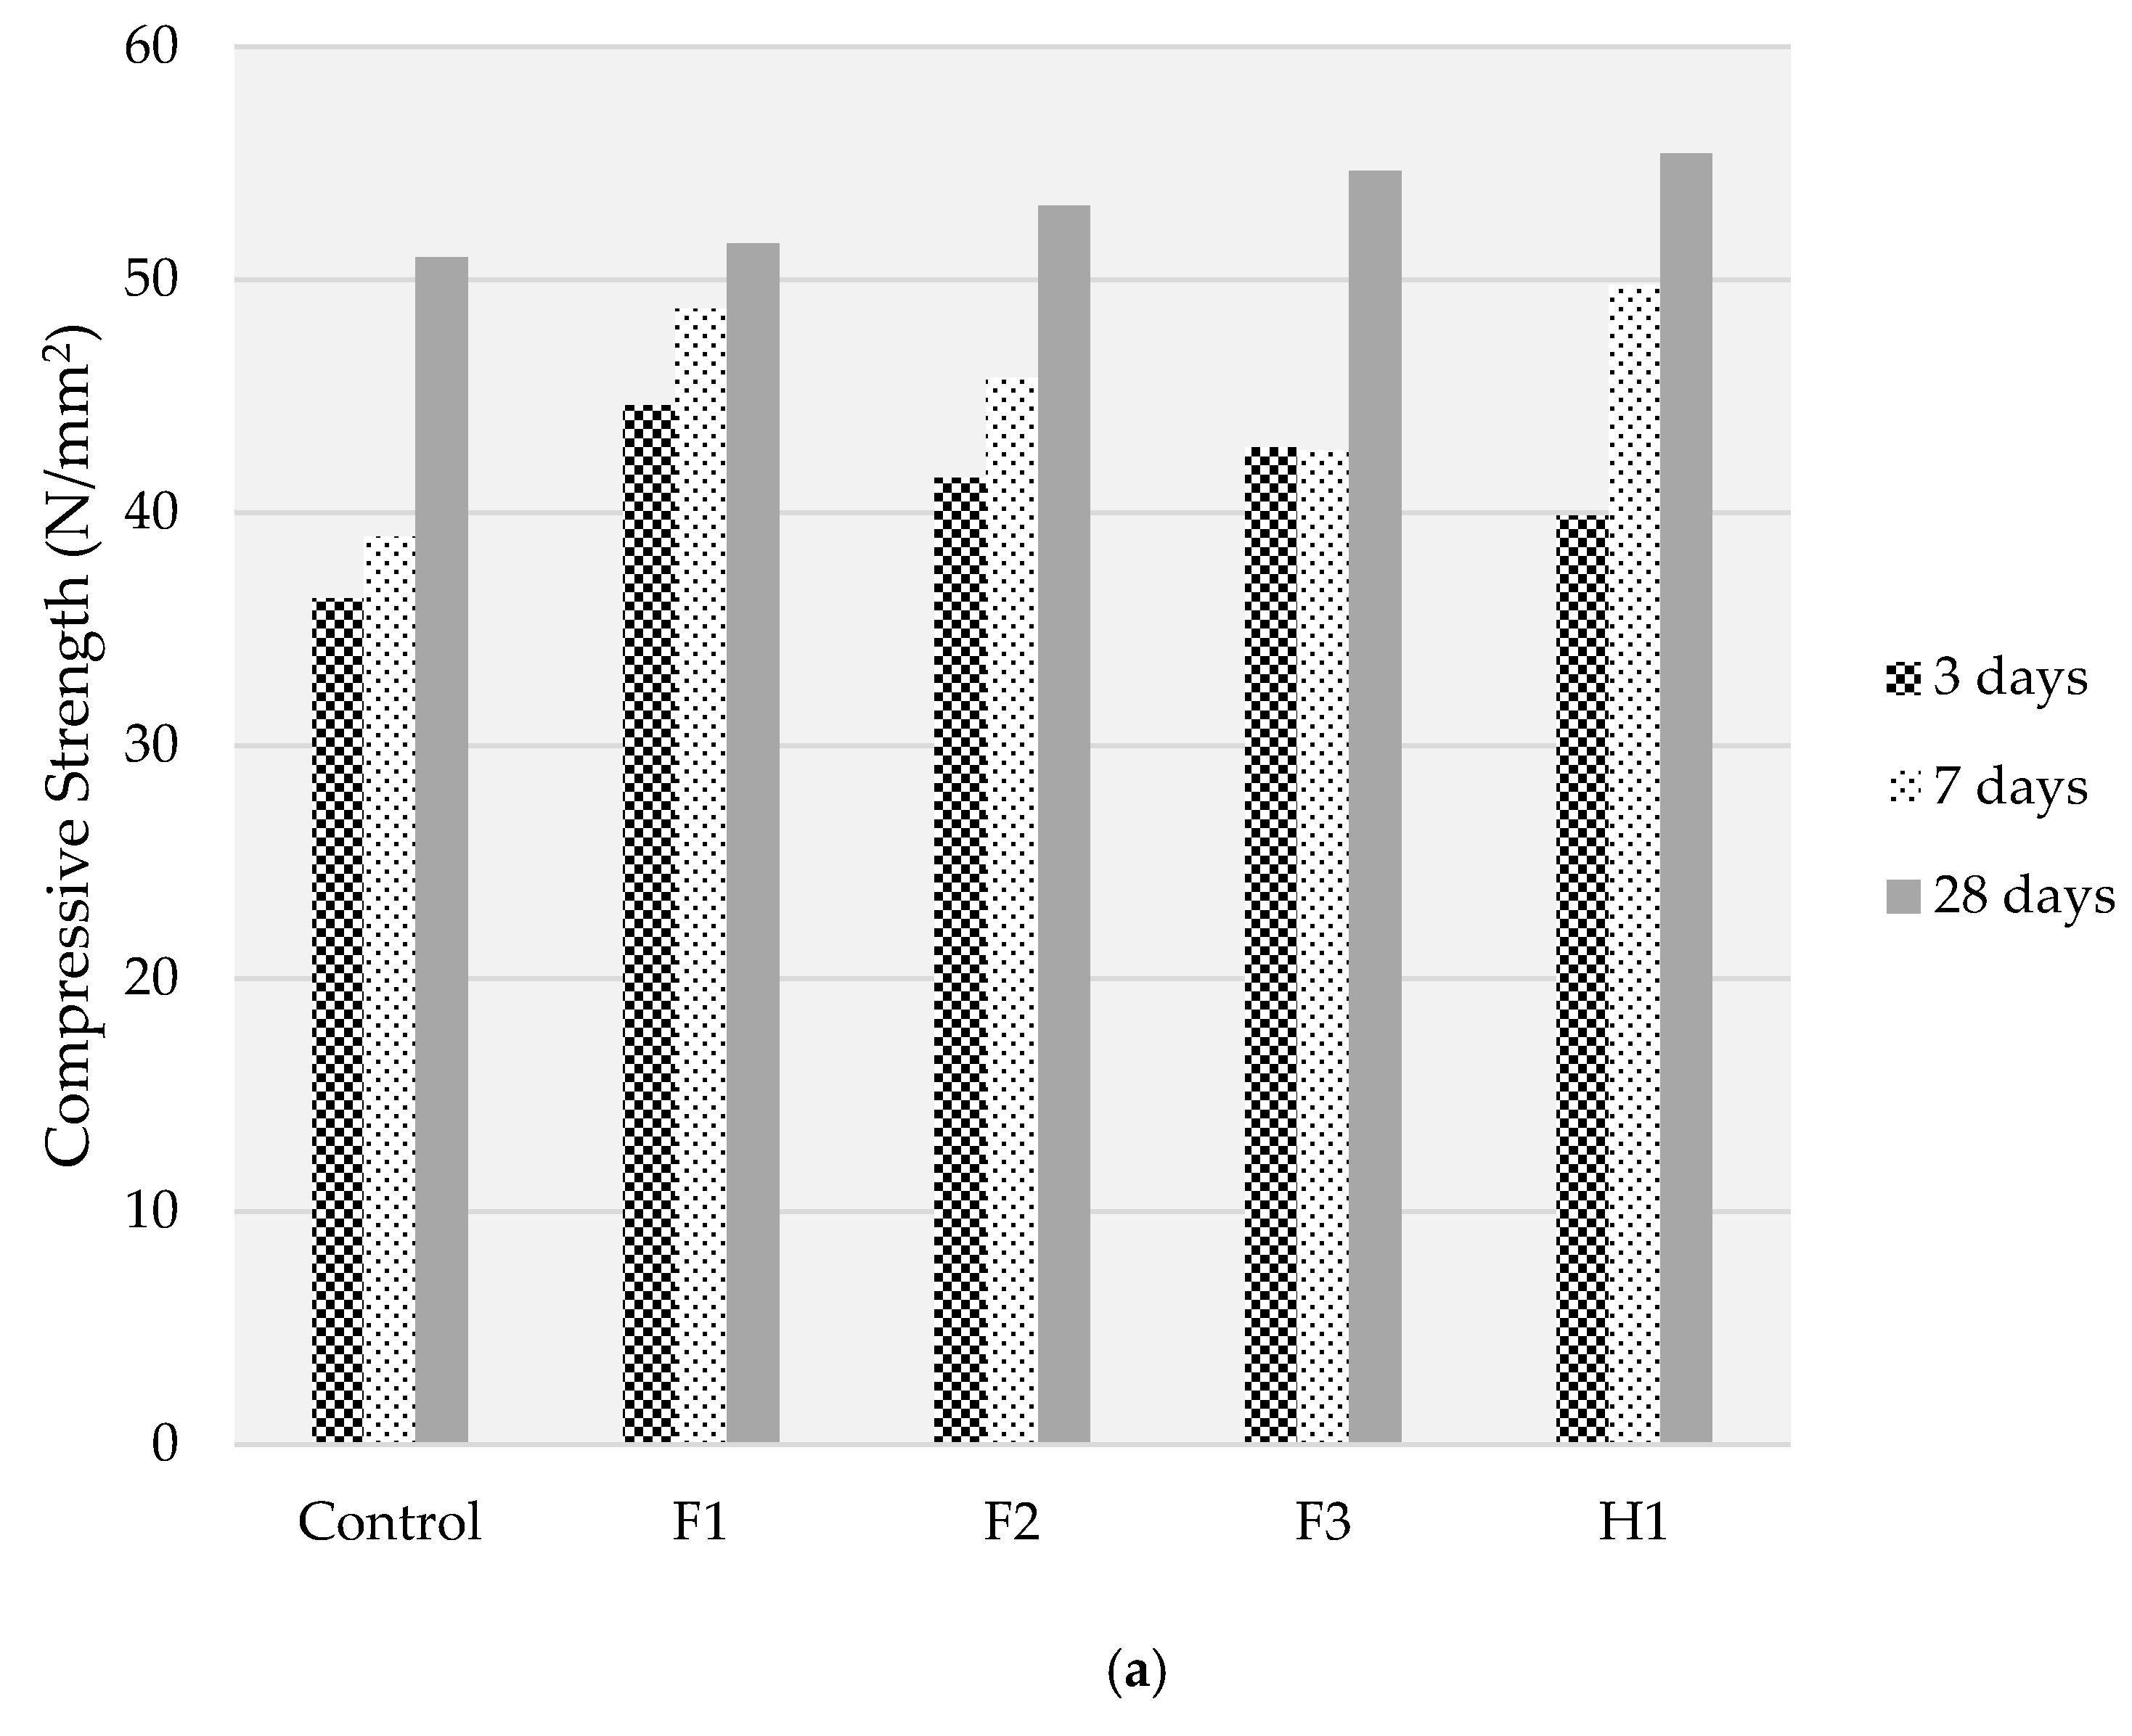
6.1. Experimental Results

The resulting average compressive, split tensile and flexural test results of 15 samples are illustrated in Figure 6.
Based on the results it was observed that all the samples containing fibre materials exhibited superior 3 days, 7 days and 28 days comprehensive strength and split tensile strength as compared to the control sample. In addition, when the results obtained in compressive strength test and rebound hammer tests were compared, it was found that approximately 65% of the strength obtained in compressive strength testing is obtained during rebound hammer test.
Maximum increase of about 40% in split tensile strength was observed in case of hybrid combination of fibres. Better interlocking between the fibres in the concrete matrix can be attributed to this significant increase. The cracked specimens in hybrid combination failed to split apart even after the occurrence of failure. This is due to the presence of fibres which resisted shattering of the specimens. Maximum increase of flexural strength was observed around 30.11% mainly due to the incorporation of fibres in mono and hybrid forms which provided better resistance to cracking due to the interlocking property of fibres. All these preliminary test results indicated that the samples with fibres are comparable with the control sample and can be utilised for cost and carbon emission optimisation study. The experimental results are presented only to facilitate the comparable results for the carbon emission and cost assessment.

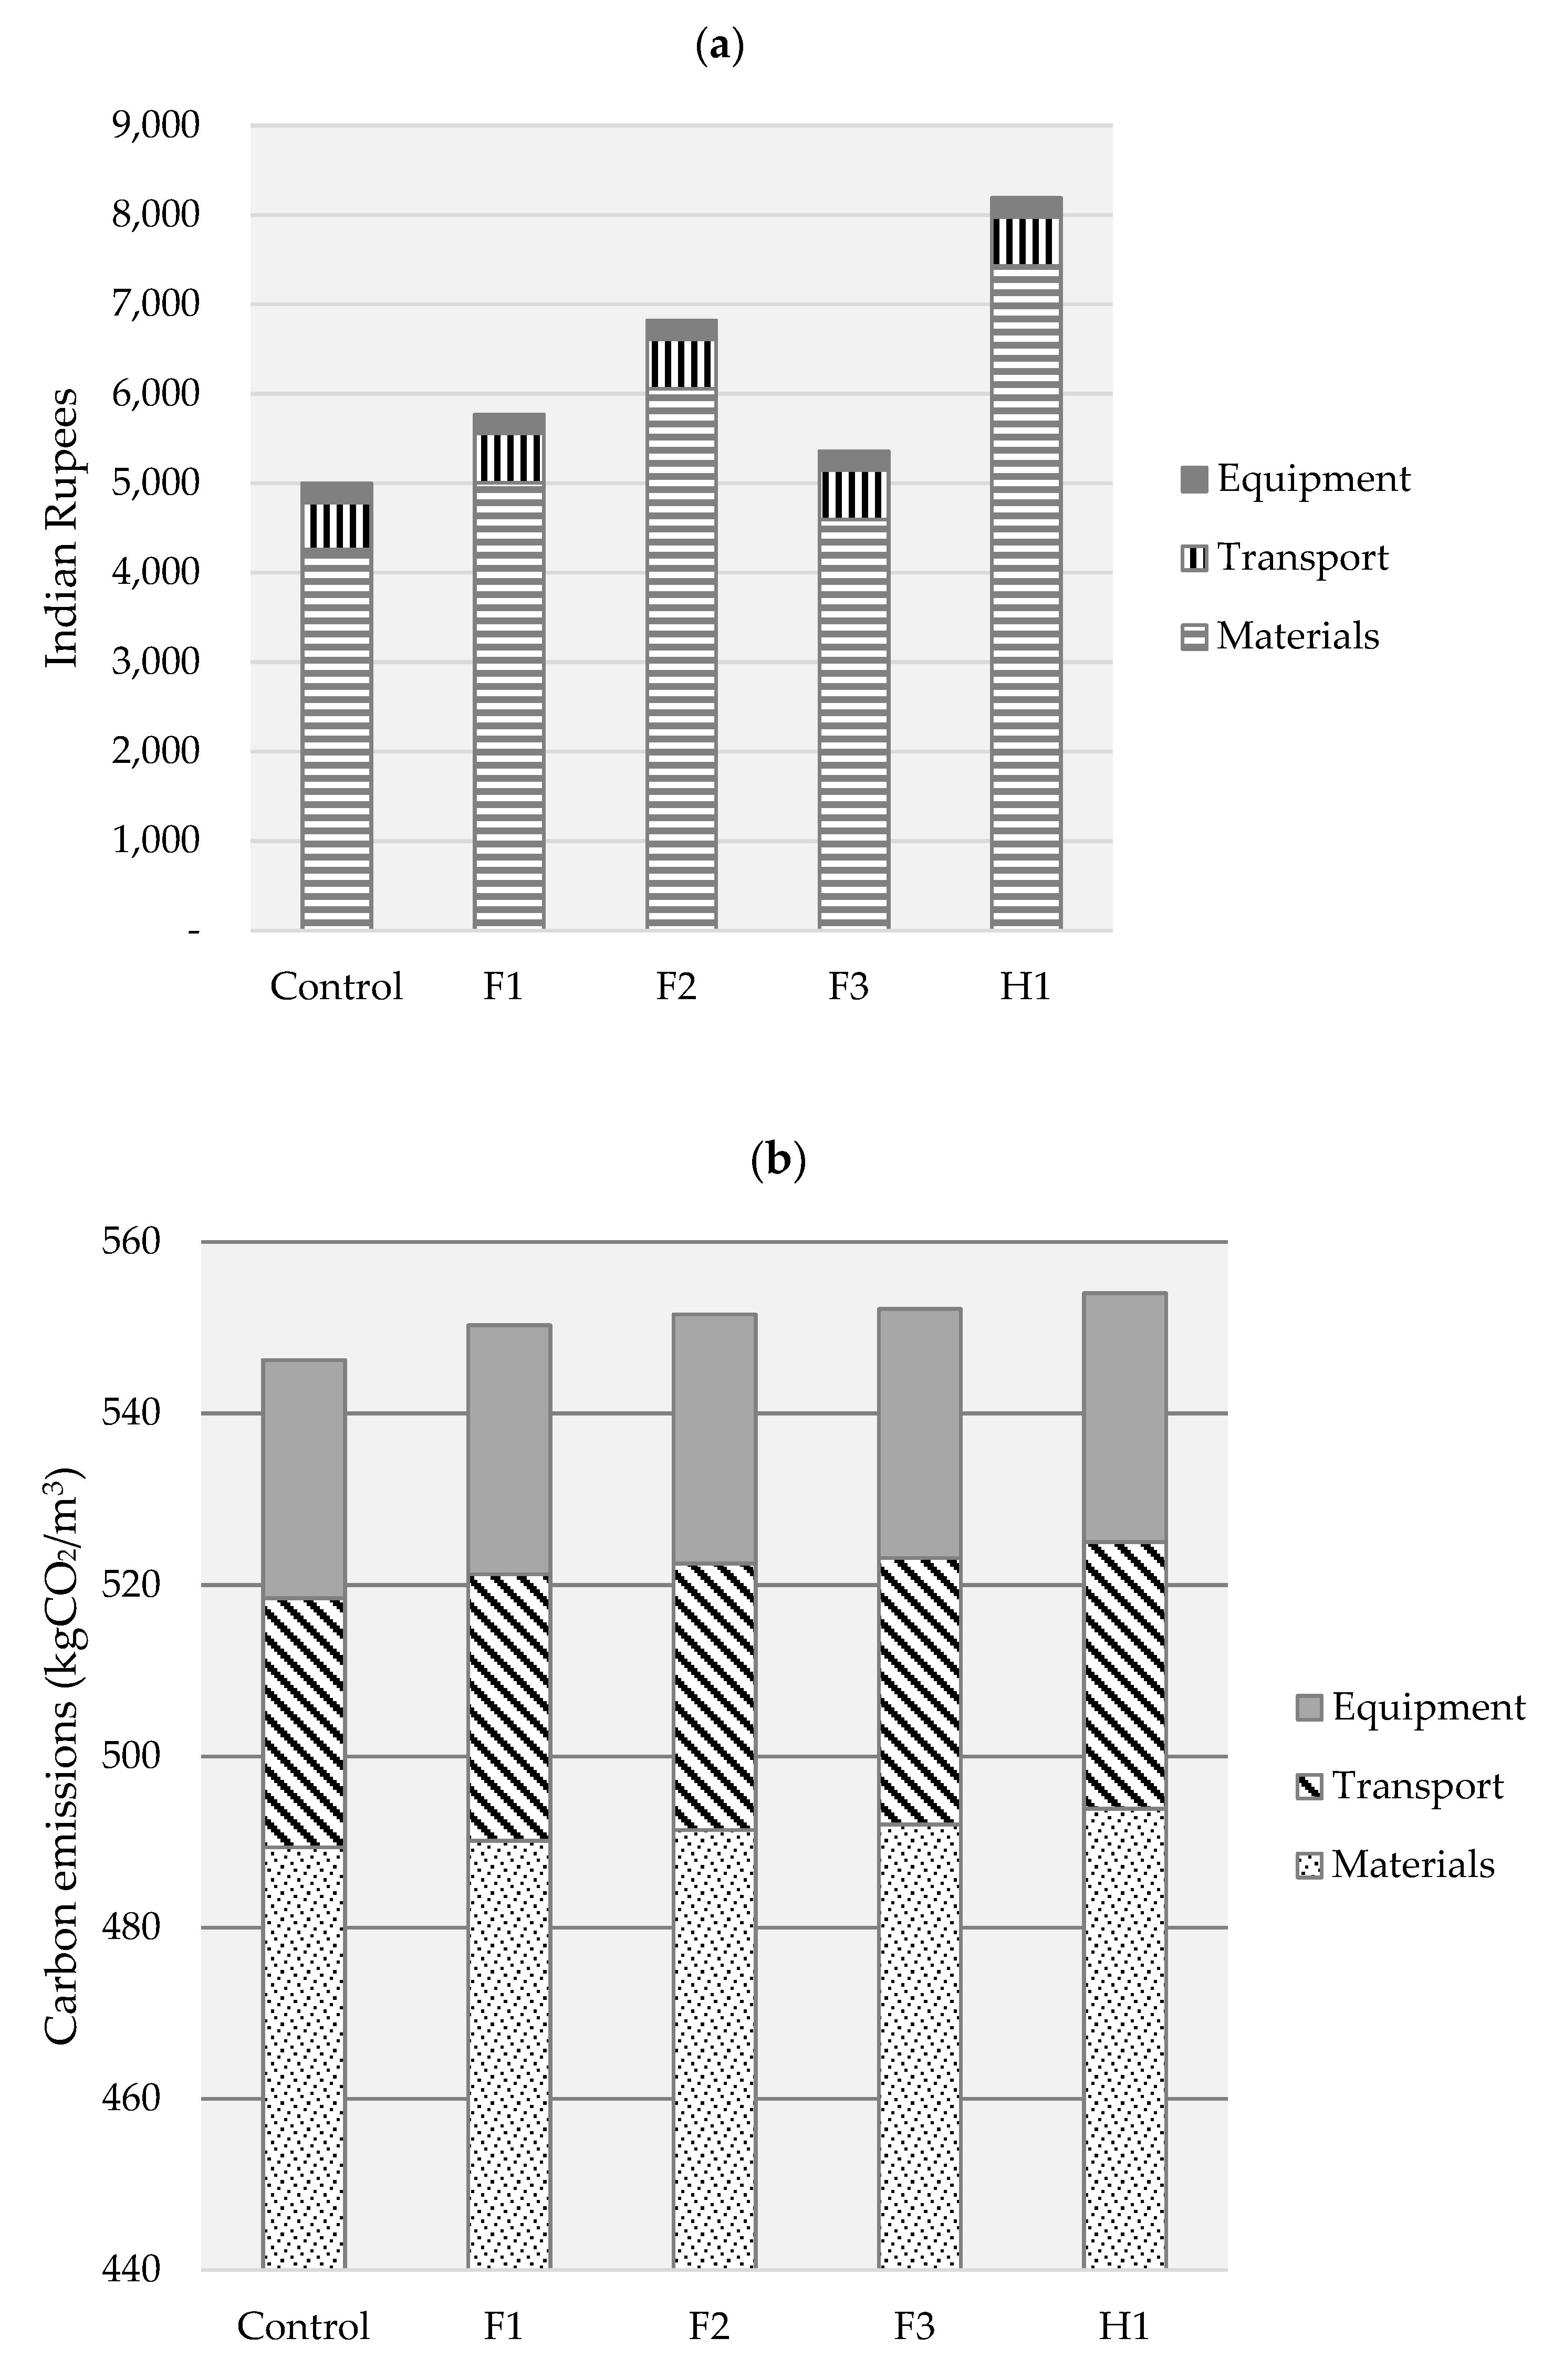
6.2. Carbon Emissions and Manufacturing Cost Results

The resulting manufacturing costs and carbon emissions for the samples are presented in Figure 7. As expected, incorporation of fibres increased both carbon emissions and production costs. However, carbon emission increase was within 2% of the control sample while manufacturing cost increases were between 7% and 90%. Sample F1 exhibited the highest cost and carbon emissions. The hybrid sample, H1 also displayed relatively high costs and carbon emissions mainly due to the presence of F1 fibres in the mix. The results infer that increasing F2 and F3 fibre content in the hybrid mix could provide the minimum cost and carbon emissions escalations leading to a more sustainable output.

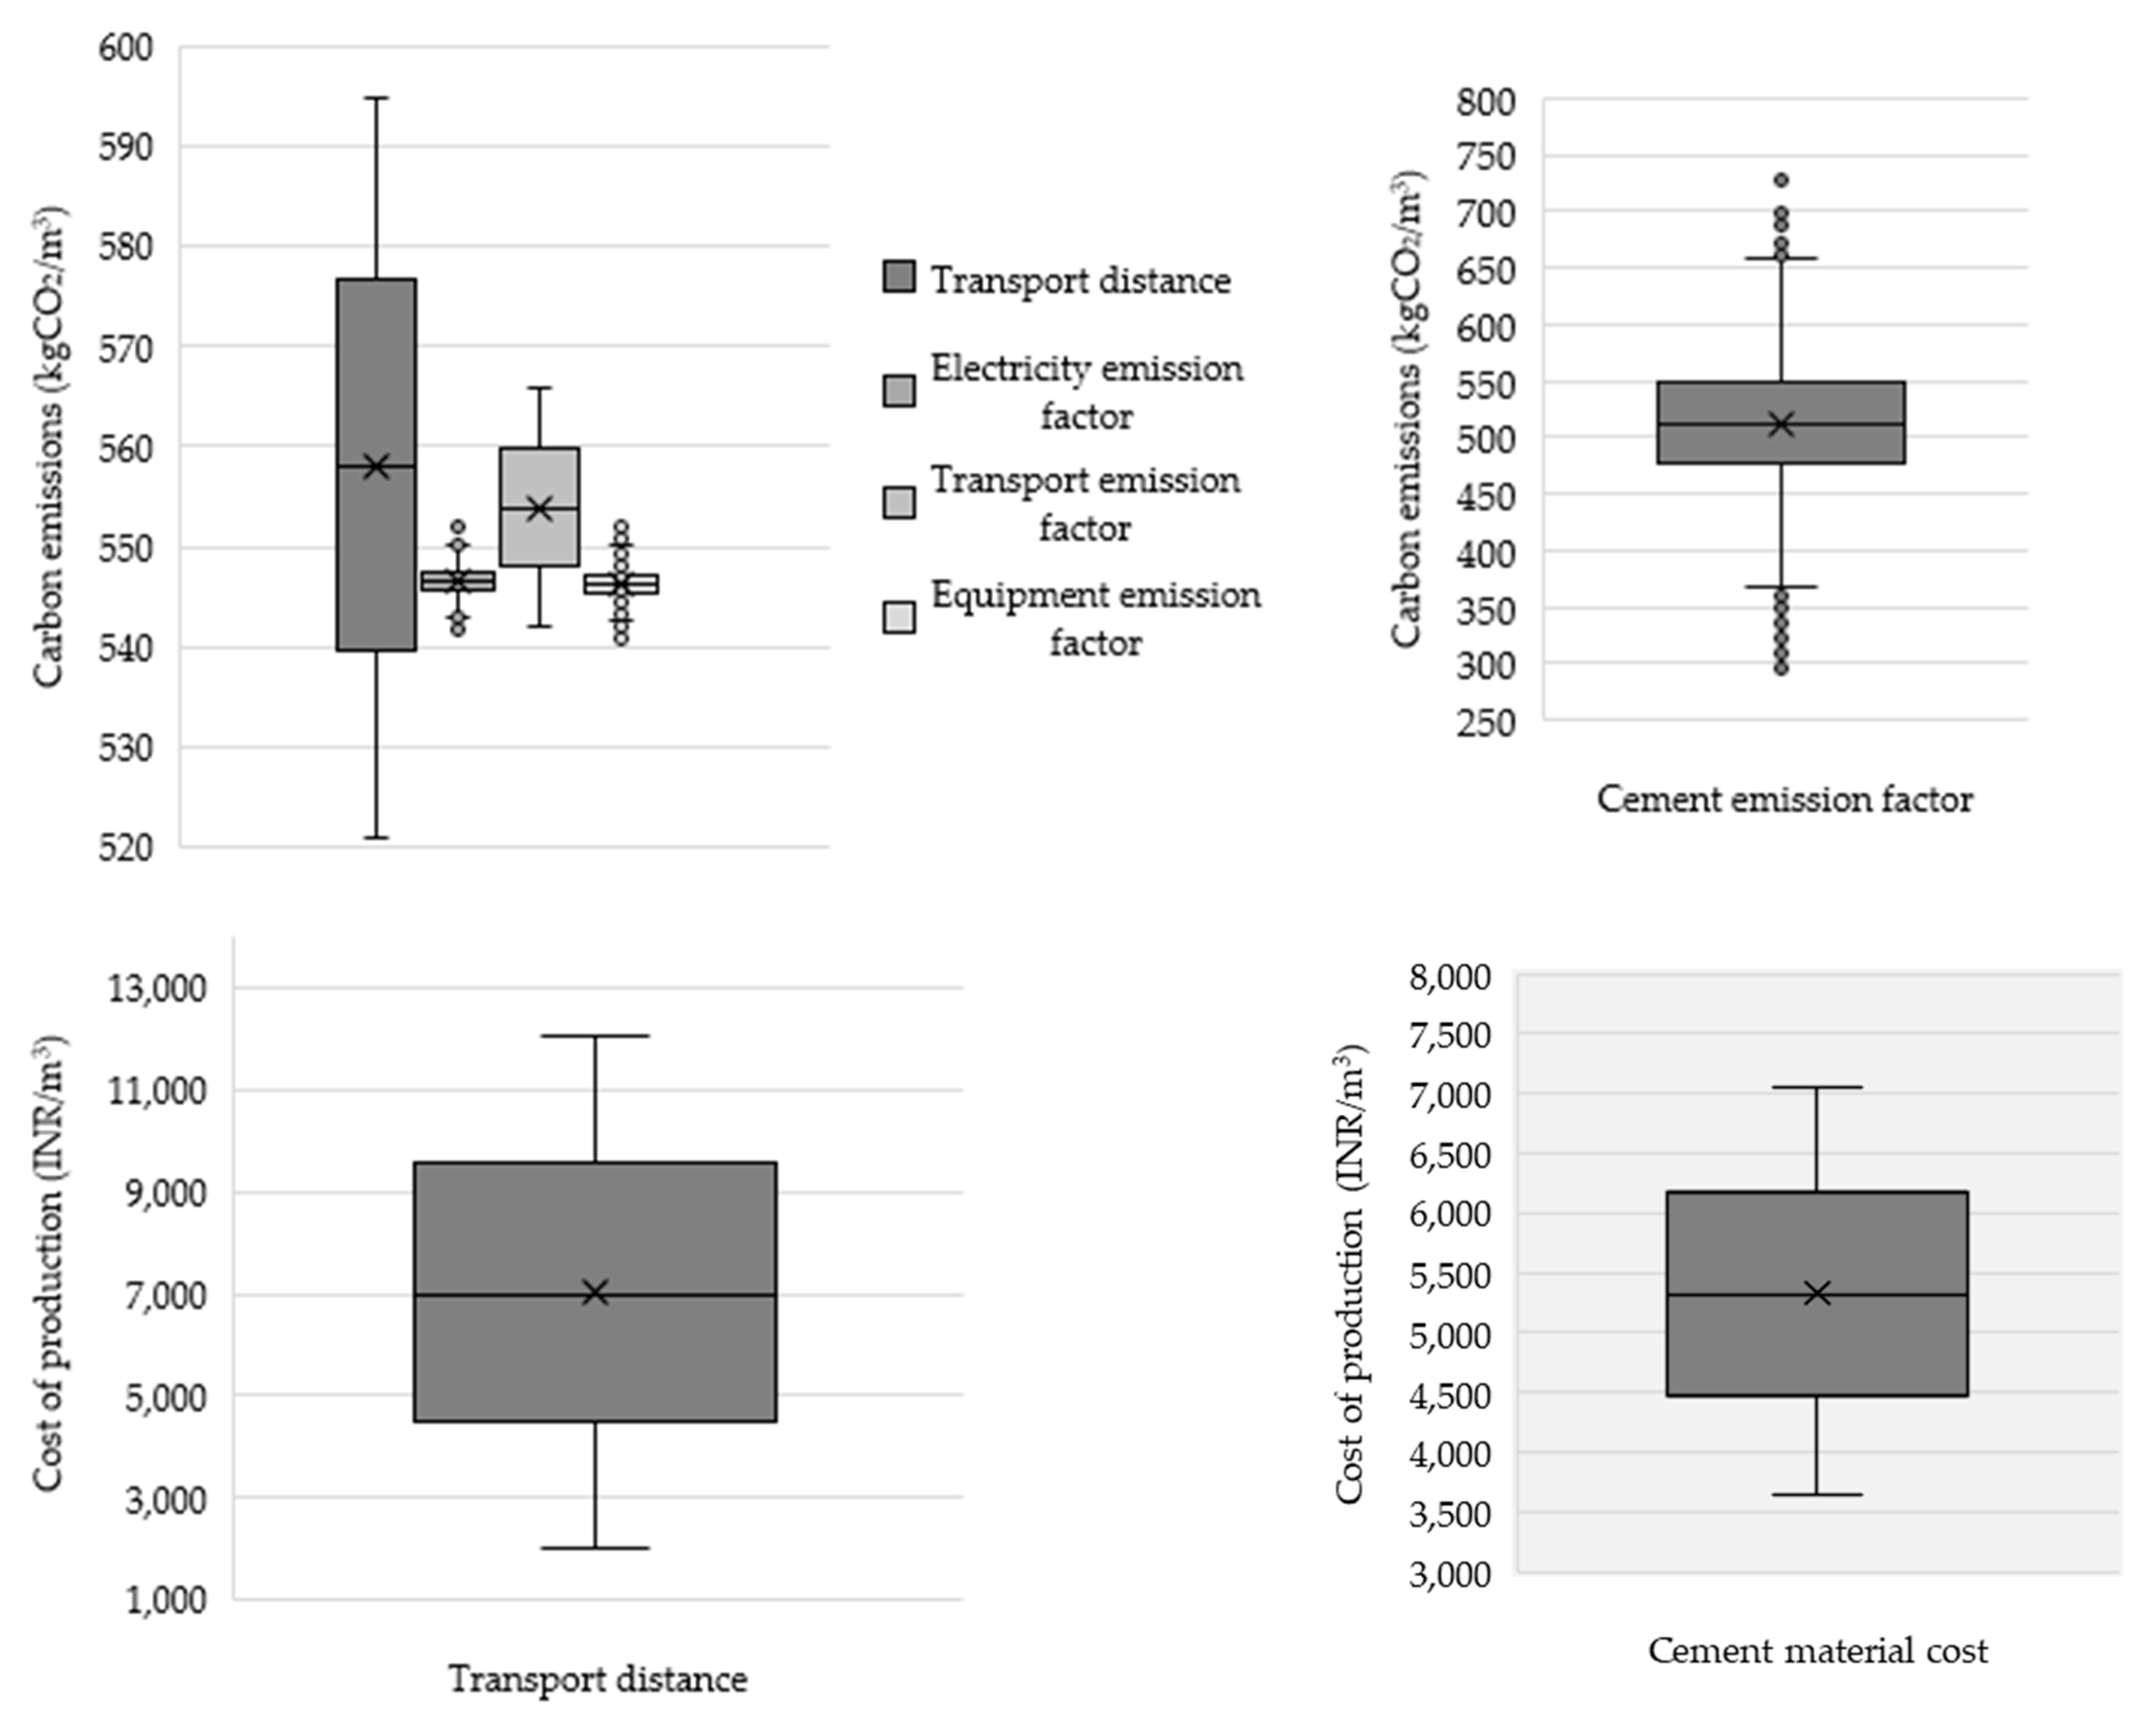
6.3. Sensitivity Results

Sensitivity analysis using Monte-Carlo simulation was conducted to identify the significant inputs that have high sensitivity towards the outputs, i.e., carbon emissions and costs. The resulting carbon emission variation and cost variation distributions with 10,000 iterations are illustrated in Figure 8. The lower and upper limits of each box represent the first quartile (Q1), median (Q2) and the third quartile (Q3) values respectively, with the minimum and maximum values also indicated at the extremes in the box plots. The “dots” in the box plots represent outliers. The results are then compared with the carbon emissions and costs of the control sample to identify the significance of each input on the final output. The cement emission factor has the most significant influence on carbon emissions with the highest sensitivity. This is mainly due to high quantity of cement used in the mix design, variations in the production processes and variations of energy sources. Several outliers at both ends indicated that there could be few instances with both sustainable and unsustainable cement productions. In addition, transport distance, carbon emission factor for transport vehicles were recorded as significant inputs that could influence the total carbon emissions. Results indicated that transport distance has high sensitivity to emission variation, ranging from 521 to 594 kgCO2/m3.
Sensitivity analysis results indicated that transportation distance is more important for manufacturing cost than the raw material cost of cement. This is important in the case of large countries with long travel distances. These results indicated the importance of exploring the possibilities of reducing virgin cement from mixes and use of locally available materials to reduce the transportation impacts. Due to the dynamic nature in the case of road construction and rehabilitation, prioritizing procurement plant to optimise the transport distance is important to minimise the total carbon emissions and costs.

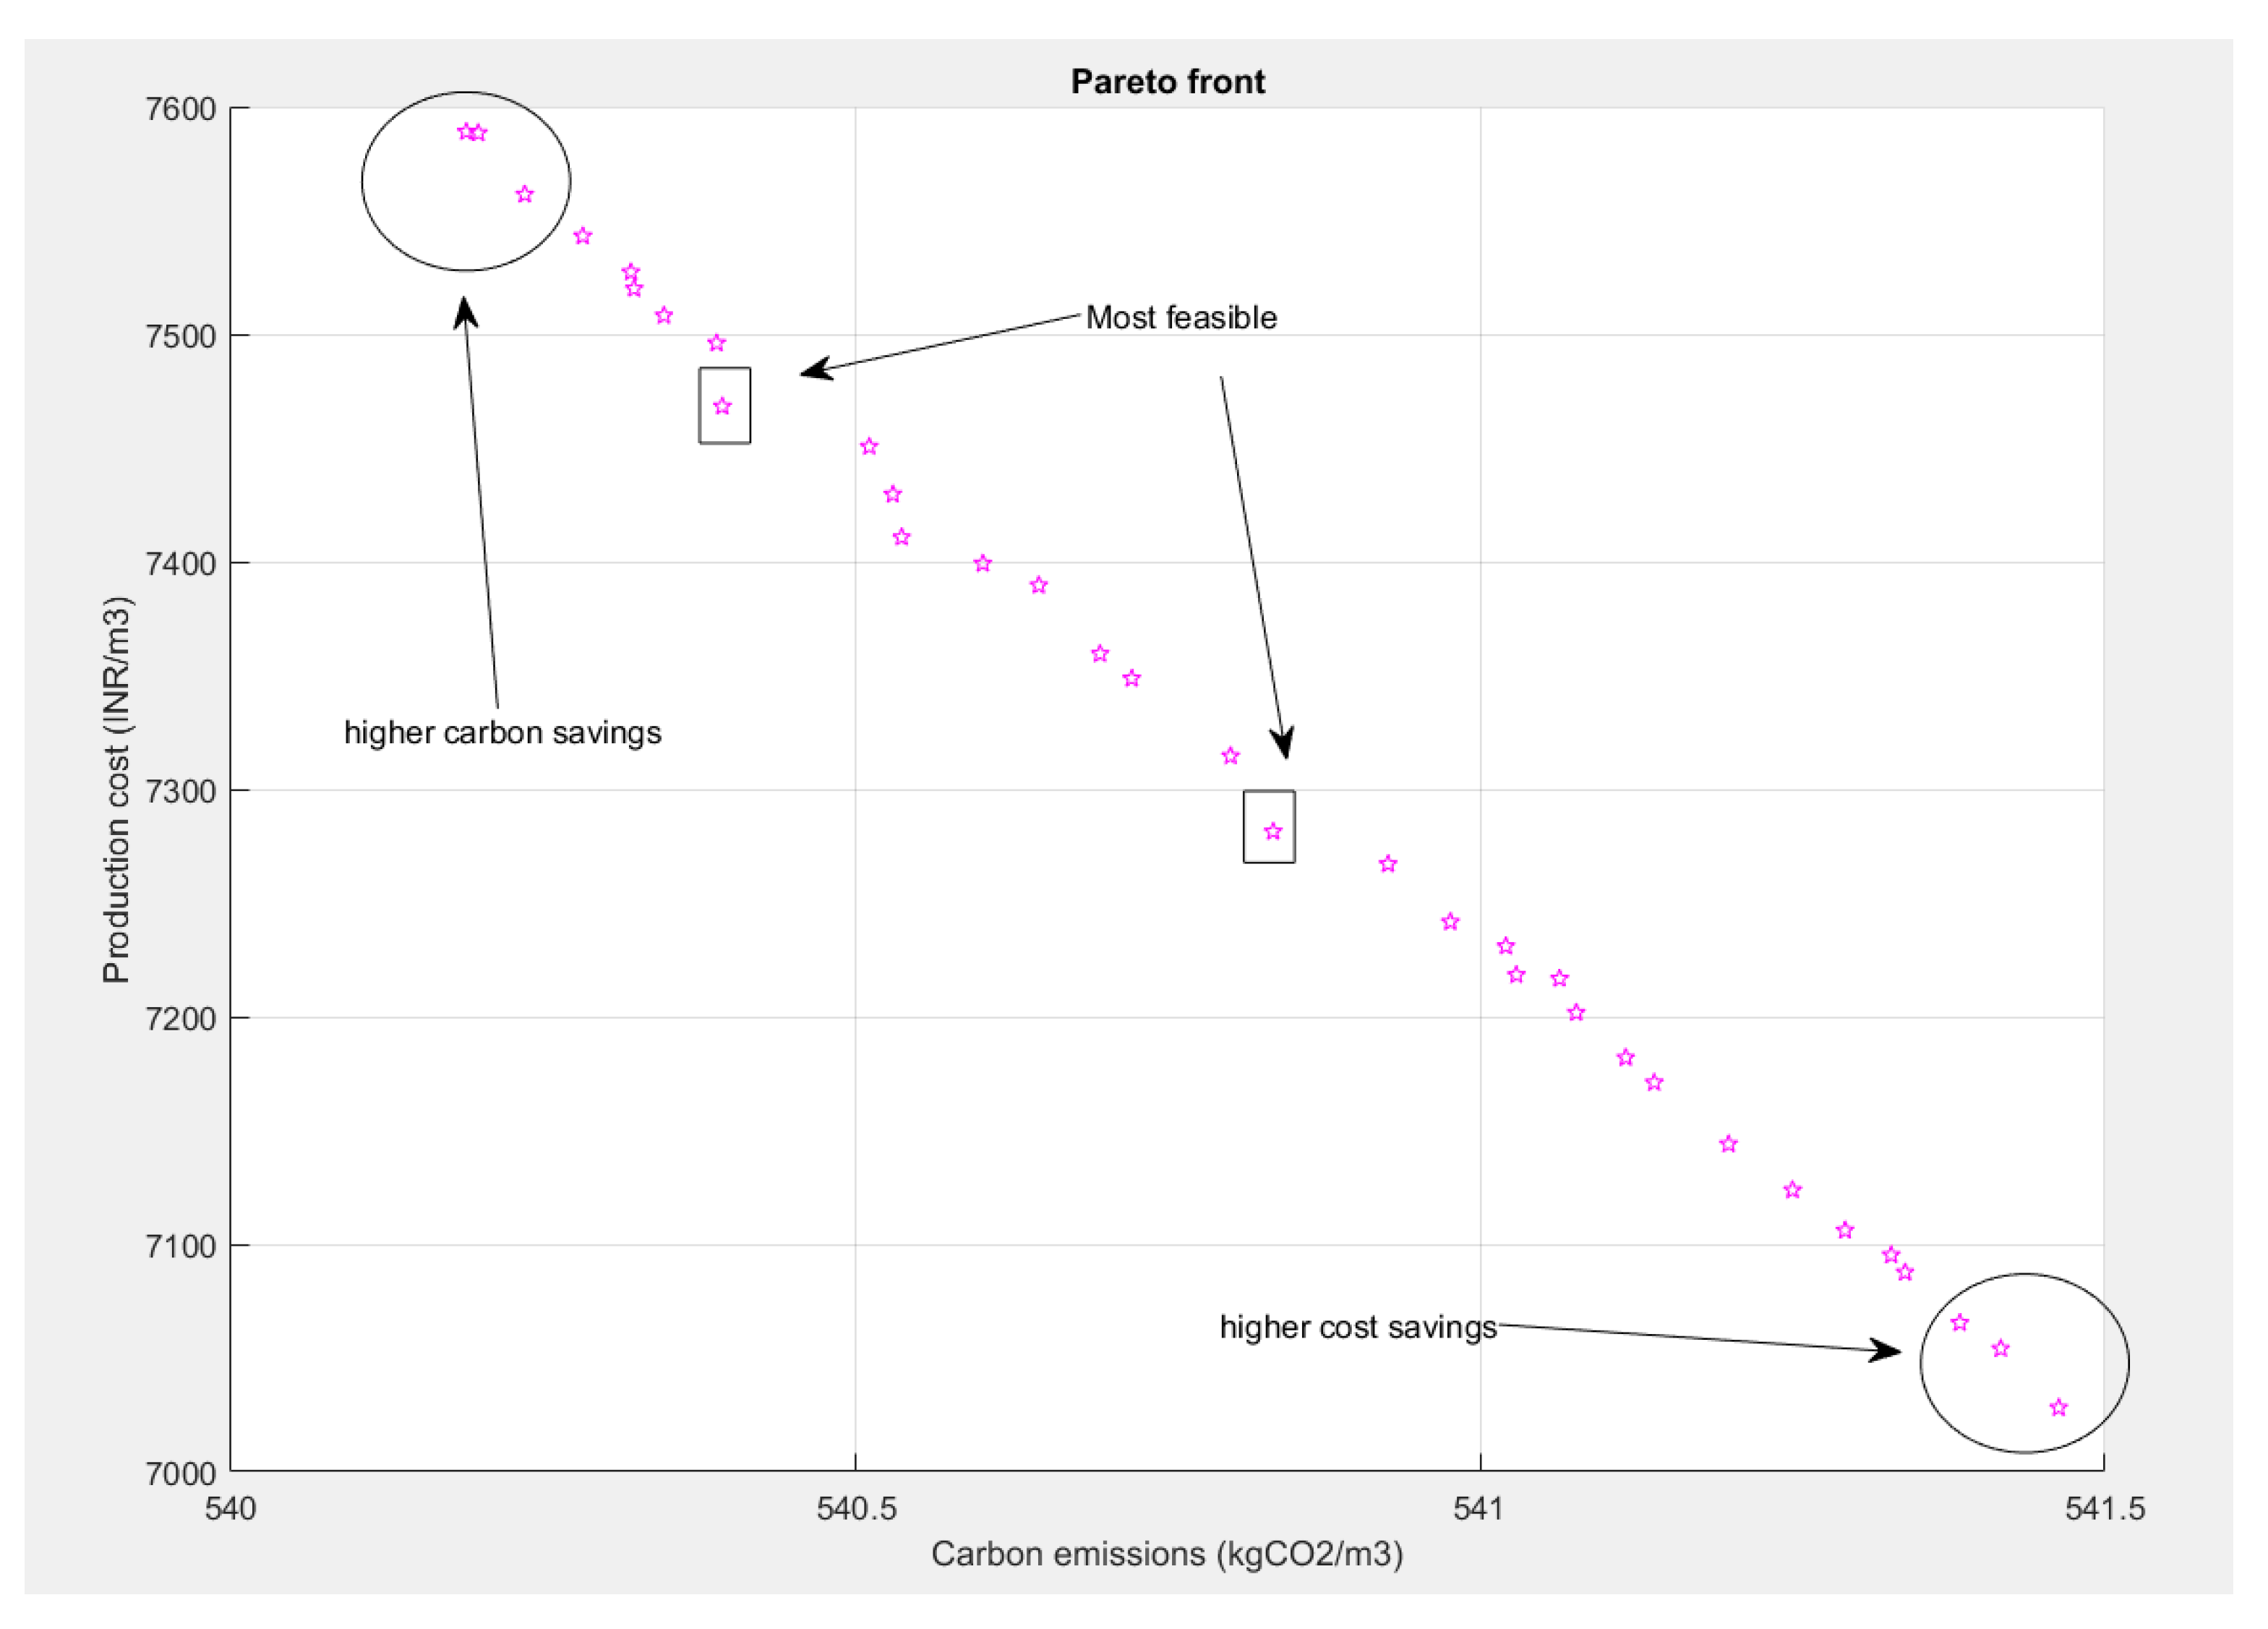
6.4. Multi-Objective Optimisation Results

The results from the sensitivity analysis identified emissions from cement production as the most sensitive input for carbon emissions. Therefore, cement content in the optimisation problem is kept a constant. In addition to the fibre content, transport distance is considered as a variable in the optimisation problem. To satisfy the two objectives in Equations (8) and (9), the following constraints are considered.
  • The minimum and maximum fibre content limits were assumed as the fibre content in F1 sample and H1 hybrid mix respectively (0.9 < F1 + F2 + F3 < 3.0) and F1, F2, F3 > 0;
  • Transportation distance was considered as a discrete value;
  • Transportation cost was considered as a function of the travel distance and the weight of the materials transported;
The total fibre content (F1 + F2 + F3) in the optimisation problem is kept in between the fibre content of F1 sample and Hybrid sample (H1) to maintain the experimental results obtained in the reference mixes. Lower constraint of 0.9 fibre content corresponds to the F3 sample content and highest fibre content of 3.0 corresponds to the H1 sample content. Therefore, with the assumption that each fibre content is non-zero, having a mix of fibre content between these values is likely to have satisfactory physical strength as compared to the reference sample. Multi-objective optimisation using genetic algorithm was performed in MATLAB with 100 generations. The resulting Pareto Front is illustrated in Figure 9 where carbon emissions and production costs are represented for a functional unit of 1 m3 of concrete mix. Pareto Front provides globally optimised solutions through the closet convergence from the output points. The non-dominated optimised solutions obtained from the population often is dependent on the context in which it is evaluated [45]. The process then removes dominated solutions in each generation. Based on the observations in Figure 9 three optimal regions can be identified for further discussion. The two extreme solutions in the Pareto front provide non-dominated solutions for fibre contents that can achieve highest cost savings and carbon emission savings respectively. Solutions at the top of the results (mix designs) convergence can achieve around 0.4% carbon emission savings for every 1 m3 of concrete used. However, the two most feasible options provide both non-dominated optimised mixed designs with high carbon savings and production cost savings. Project stakeholders can select the most feasible fibre content based on the project objectives. Technical capability of the fibre combination content of the optimised mix designs then needs to be validated using experimental results.
The resulting fibre content of the optimal mix designs in the three regions of the Pareto front is presented in Table 6. The fibre content is rounded up to the closet second decimal and therefore, the total might slightly differ. As seen, all the optimum solutions minimise the F1 fibre content due to high material price and the carbon emissions. However, F1 cannot be removed from the optimisation problem because the highest strength characteristics were obtained in the hybrid mix sample (Figure 6). However, future studies can be focused on validating these mix designs through experimental investigations for satisfactory strength results.

7. Conclusions and Future Research

The study used four fibre combinations including F1 (Polyolefin), F2 (Polyolefin-twisted), F3 (Polypropylene) and a hybrid mix (H1) which included a combination of the above three fibre types. The experimental results of the study illustrated that incorporation of fibres significantly increases compressive strength, split tensile strength and flexural strength of the samples. H1 sample recorded the highest performance with 8.73%, 39.93%, 30.11% increase in compressive strength, split tensile strength and flexural strength respectively as compared to the control sample. However, carbon emission and cost analysis indicated that mix samples containing F2 and F3 have the least carbon emissions and production cost escalations with a percentage increase of 0.57% and 7.17% respectively as compared to the control sample. Sensitivity analysis identified transport distance, embodied carbon emission factor for cement and transport emission factor are the most sensitive parameters to carbon emissions. Multi-objective genetic optimisation algorithm was developed to find the most optimum fibre content with least cost and carbon emission escalations. Optimisation analysis presented optimal mix designs in the Pareto front of fibre contents with least carbon emission and production costs escalations. The findings of the study are useful for interested project stakeholders who wish to utilise cost-effective and environmentally friendly road rehabilitation practices. The current study considered the effect of using virgin fibre materials in the white topping application in roads. However, further research can be concentrated on exploring the use of waste fibre materials in the mix to reduce the carbon emissions. Besides, future research can be focused on exploring the long-term environmental and economic benefits including the durability characteristics to benchmark the sustainable benefits of the product. Similar methodology could also be adopted to compare carbon emissions and production costs of various road rehabilitation techniques to benchmark practically feasible options. The current study used production and supply chain data related to laboratory-scale production. Therefore, only small savings of carbons emission and production costs were obtained in the optimisation results. However, if the same is used in a road construction case study, significant carbon emission and cost savings can be achieved. Hence future research is suggested on comparing and optimising carbon emissions and cost savings of using white topping in a road construction case study considering all the supply chain data.

Author Contributions

Conceptualisation, M.S., L.K. and R.; methodology, M.S.; writing—original draft, M.S., L.K. and R.; writing—review and editing, R.K. and R. All authors have read and agreed to the published version of the manuscript.

Funding

No funding was provided for the project.

Institutional Review Board Statement

Not applicable.

Informed Consent Statement

Not applicable.

Data Availability Statement

Not applicable.

Conflicts of Interest

The authors declare no conflict of interest.

References

  1. Ruikar, M. National statistics of road traffic accidents in India. J. Orthop. Traumatol. Rehabil. 2013, 6, 1. [Google Scholar] [CrossRef]
  2. Sharma, A.; Vohra, E. Critical evaluation of road infrastructure in India: A cross-country view. Eng. Constr. Arch. Manag. 2009, 16, 73–91. [Google Scholar] [CrossRef]
  3. Dadhich, G.; Patel, H.; Patel, M.A. Treatment of Distressed Urban Roads using Ultrathin White-Topping: A Case Study Of Daman City (Ut), India. Available online: https://ukiericoncretecongress.com/ucc2013/files/Proceedings/pdf/UCC-2019-415.pdf (accessed on 28 November 2021).
  4. Rasmussen, R.O.; Rozycki, D.K. NCHRP Synthesis 338: Thin and Ultra-thin Whitetopping; National Research Council: Washington, DC, USA, 2004; pp. 3–9.
  5. Tayabji, S.; Gisi, A.; Blomberg, J.; DeGraaf, D. New applications for thin concrete overlays: Three case studies. In National Conference on Preservation, Repair, and Rehabilitation of Concrete Pavements; 2009. Available online: rosap.ntl.bts.gov (accessed on 28 November 2021).
  6. Goel, P.; Kumar, R.; Bhattacharjee, B. Performance of synthetic fibre reinforced concrete in the construction of concrete pavements. Indian Concr. J. 2015, 89, 52–61. [Google Scholar]
  7. Qian, C.; Stroeven, P. Development of hybrid polypropylene-steel fibre-reinforced concrete. Cem. Concr. Res. 2000, 30, 63–69. [Google Scholar] [CrossRef]
  8. Jundhare, D.; Khare, K.; Jain, R. Three dimensional nonlinear finite element modeling of conventional whitetopping of asphalt pavements. Indian Highw. 2014, 42, 6. Available online: trid.trb.org (accessed on 28 November 2021).
  9. Barman, M. Bonded Whitetopping Overlay Design Considerations with Regard to the Prevention of Reflection Cracking, Joint Sealing and the Use of Dowel Bars. Available online: engineering.pitt.edu (accessed on 28 November 2021).
  10. Li, L.; Chen, K. Quantitative assessment of carbon dioxide emissions in construction projects: A case study in Shenzhen. J. Clean. Prod. 2017, 141, 394–408. [Google Scholar] [CrossRef]
  11. Dimoula, V.; Kehagia, F.; Tsakalidis, A. A holistic approach for estimating carbon emissions of road and rail transport systems. Aerosol Air Qual. Res. 2016, 16, 61–68. [Google Scholar] [CrossRef] [Green Version]
  12. Luo, W.; Sandanayake, M.; Zhang, G.; Tan, Y. Construction Cost and Carbon Emission Assessment of a Highway Construction—A Case towards Sustainable Transportation. Sustainability 2021, 13, 7854. [Google Scholar] [CrossRef]
  13. Jang, W.; You, H.-W.; Han, S.H. Quantitative Decision Making Model for Carbon Reduction in Road Construction Projects Using Green Technologies. Sustainability 2015, 7, 11240–11259. [Google Scholar] [CrossRef] [Green Version]
  14. Chen, J.; Zhao, F.; Liu, Z.; Ou, X.; Hao, H. Greenhouse gas emissions from road construction in China: A province-level analysis. J. Clean. Prod. 2017, 168, 1039–1047. [Google Scholar] [CrossRef]
  15. Huang, Y.; Hakim, B.; Zammataro, S. Measuring the carbon footprint of road construction using CHANGER. Int. J. Pavement Eng. 2013, 14, 590–600. [Google Scholar] [CrossRef]
  16. Lin, B.; Liu, C.; Wang, H.; Lin, R. Modeling the railway network design problem: A novel approach to considering carbon emissions reduction. Transp. Res. Part D Transp. Environ. 2017, 56, 95–109. [Google Scholar] [CrossRef]
  17. Chan, R.; Santana, M.A.; Oda, A.M.; Paniguel, R.C.; Vieira, L.B.; Figueiredo, A.D.; Galobardes, I. Analysis of potential use of fibre reinforced recycled aggregate concrete for sustainable pavements. J. Clean. Prod. 2019, 218, 183–191. [Google Scholar] [CrossRef]
  18. Adesina, A.J. Performance of fibre reinforced alkali-activated composites—A review. Materialia 2020, 12, 100782. [Google Scholar] [CrossRef]
  19. Branston, J.; Booya, E.; Gorospe, K.; Adesina, A.; Das, S.; Lawn, D. Microstructure and mechanical properties of basalt fibre reinforced concrete. In Proceedings of the 17th Euroseminar on microscopy applied to building materials, Toronto, ON, Canada, 20–23 May 2019; pp. 121–127. [Google Scholar]
  20. Ali, B.; Qureshi, L.A.; Khan, S.U. Flexural behavior of glass fiber-reinforced recycled aggregate concrete and its impact on the cost and carbon footprint of concrete pavement. Constr. Build. Mater. 2020, 262, 120820. [Google Scholar] [CrossRef]
  21. Ali, B.; Qureshi, L.A.; Kurda, R. Environmental and economic benefits of steel, glass, and polypropylene fiber reinforced cement composite application in jointed plain concrete pavement. Compos. Commun. 2020, 22, 100437. [Google Scholar] [CrossRef]
  22. Sinha, V.; Kumar, S.; Jain, R. Whitetopping-A cost effective Rehabilitation Alternative for Preserving Bituminous Pavements on Long Term Basis. J. Indian Roads Congr. 2007, 68, 3. [Google Scholar]
  23. Bezabih, A.G.; Chandra, S. Comparative study of flexible and rigid pavements for different soil and traffic conditions. J. Indian Roads Congr. 2009, 70, 153–162. [Google Scholar]
  24. Gautam, A.; Batra, R.; Singh, N. A study on use of rice husk ash in concrete. Int. J. Educ. Appl. Res. 2019, 4, 75–81. [Google Scholar] [CrossRef]
  25. IRC. Standard Specifications and Code of Practice for Road Bridges; IRC:78; Indian Road Congress: New Delhi, India, 2014. [Google Scholar]
  26. Reddy, A.V.C.; Nivitha, M.; Palanikumar, M. Influence of axle load on the fatigue life of thin whitetopping with fibre-reinforced concrete. Sādhanā 2021, 46, 163. [Google Scholar] [CrossRef]
  27. Sandanayake, M.; Gunasekara, C.; Law, D.; Zhang, G.; Setunge, S. Greenhouse gas emissions of different fly ash based geopolymer concretes in building construction. J. Clean. Prod. 2018, 204, 399–408. [Google Scholar] [CrossRef]
  28. Reddy, K.; Sharon, H. 143: Indigenous solar desalination technologies for sustainable potable water supply. In Conference Proceedings Volume 2; University of Nottingham: Nottingham, UK, 2018; p. 144. Available online: https://nottingham-repository.worktribe.com/index.php/preview/1608182/SET2018%20Proceedings%20Volume%202.pdf#page=152 (accessed on 28 November 2021).
  29. Hammond, G.P.; Jones, C.I. ICE Database. 2011. Available online: http://www.ecocem.ie/downloads/Inventory_of_Carbon_and_Energy.pdf (accessed on 24 June 2015).
  30. Hammond, G.; Jones, C. Inventory of Carbon & Energy: ICE; Sustainable Energy Research Team, Department of Mechanical Engineering, University of Bath: Bath, UK, 2008; Available online: https://www.appropedia.org/w/images/5/56/ICE_Version_1.6a.pdf (accessed on 28 November 2021).
  31. IS 516 (1959); Methods of Tests for Strength of Concrete. Bureau of Indian Standards: New Delhi, India, 2004. Available online: https://www.bis.gov.in (accessed on 28 November 2021).
  32. Yan, H.; Shen, Q.; Fan, L.C.; Wang, Y.; Zhang, L. Greenhouse gas emissions in building construction: A case study of One Peking in Hong Kong. Build. Environ. 2010, 45, 949–955. [Google Scholar] [CrossRef] [Green Version]
  33. Hong, J.; Shen, G.Q.; Feng, Y.; Lau, W.S.T.; Mao, C. Greenhouse gas emissions during the construction phase of a building: A case study in China. J. Clean. Prod. 2015, 103, 249–259. [Google Scholar] [CrossRef] [Green Version]
  34. Sandanayake, M.; Zhang, G.; Setunge, S. Environmental emissions at foundation construction stage of buildings—Two case studies. Build. Environ. 2016, 95, 189–198. [Google Scholar] [CrossRef]
  35. Tiewsoh, L.S.; Jirásek, J.; Sivek, M. Electricity generation in India: Present state, future outlook and policy implications. Energies 2019, 12, 1361. [Google Scholar] [CrossRef] [Green Version]
  36. Mittal, M.L.; Sharma, C.; Singh, R. Estimates of emissions from coal fired thermal power plants in India. In Proceedings of the 2012 International Emission Inventory Conference, 2012; pp. 13–16. Available online: https://www3.epa.gov/ttn/chief/conference/ei20/session5/mmittal.pdf (accessed on 28 November 2021).
  37. Sandanayake, M.; Law, D.; Sargent, P. A new framework for assessing the environmental impacts of circular economy friendly soil waste-based geopolymer cements. Build. Environ. 2022, 210, 108702. [Google Scholar] [CrossRef]
  38. Shen, L.; Zhao, J.; Wang, L.; Liu, L.; Wang, Y.; Yao, Y.; Geng, Y.; Gao, T.; Cao, Z. Calculation and evaluation on carbon emission factor of cement production in China. Chin. Sci. Bull. 2016, 61, 2926–2938. [Google Scholar] [CrossRef] [Green Version]
  39. Graham, L.A.; Rideout, G.; Rosenblatt, D.; Hendren, J. Greenhouse gas emissions from heavy-duty vehicles. Atmos. Environ. 2008, 42, 4665–4681. [Google Scholar] [CrossRef]
  40. IPCC. IPCC Fourth Assessment Report; IPCC: Geneva, Switzerland, 2007. [Google Scholar]
  41. McLellan, B.C.; Williams, R.P.; Lay, J.; Van Riessen, A.; Corder, G.D. Costs and carbon emissions for geopolymer pastes in comparison to ordinary portland cement. J. Clean. Prod. 2011, 19, 1080–1090. [Google Scholar] [CrossRef] [Green Version]
  42. Turner, L.K.; Collins, F.G. Carbon dioxide equivalent (CO2-e) emissions: A comparison between geopolymer and OPC cement concrete. Constr. Build. Mater. 2013, 43, 125–130. [Google Scholar] [CrossRef]
  43. Sandanayake, M.; Gunasekara, C.; Law, D.; Zhang, G.; Setunge, S.; Wanijuru, D. Sustainable criterion selection framework for green building materials—An optimisation based study of fly-ash Geopolymer concrete. Sustain. Mater. Technol. 2020, 25, e00178. [Google Scholar] [CrossRef]
  44. Wang, W.; Zmeureanu, R.; Rivard, H. Applying multi-objective genetic algorithms in green building design optimization. Build. Environ. 2005, 40, 1512–1525. [Google Scholar] [CrossRef]
  45. Kumar, R.; Rockett, P. Improved sampling of the Pareto-front in multiobjective genetic optimizations by steady-state evolution: A Pareto converging genetic algorithm. Evol. Comput. 2002, 10, 283–314. [Google Scholar] [CrossRef] [PubMed] [Green Version]
Figure 1. Research methodology for the current study.
Futuretransp 02 00014 g001
Figure 2. Details of casting of concrete specimens for testing.
Futuretransp 02 00014 g002
Figure 3. Specimens after compressive strength testing.
Futuretransp 02 00014 g003
Figure 4. Specimens after split-tensile strength testing. (a) Plain concrete specimen at failure. (b) Concrete specimen with fibres (F1) at failure.
Futuretransp 02 00014 g004
Figure 5. Beam specimen after flexural test.
Futuretransp 02 00014 g005
Figure 6. Average experimental results of the different specimen samples. (a) Compressive strength variation of samples in N/mm2. (b) Split tensile strength variation of samples in N/mm2. (c) Flexural strength variation of samples in N/mm2.
Futuretransp 02 00014 g006aFuturetransp 02 00014 g006b
Figure 7. Manufacturing cost and carbon emissions of different mix designs. (a) Cost per m3 of sample (INR). (b) Carbon emissions per m3 of sample (kgCO2).
Futuretransp 02 00014 g007
Figure 8. Sensitivity analysis results.
Futuretransp 02 00014 g008
Figure 9. Pareto spread with non-dominated optimised solutions.
Futuretransp 02 00014 g009
Table 1. Properties of fibres used for the study.
No.Physical PropertiesF1F2F3
1.MaterialPolyolefinPolyolefin-twistedPolypropylene
2.FormStructured fibres in bundlesFibrillatedFibrillated
3.Length, mm501912
4.ColourYellowBeigeWhite
5.Tensile Strength, N/mm2618400250
6.Indicative Photograph Futuretransp 02 00014 i001 Futuretransp 02 00014 i002 Futuretransp 02 00014 i003
7.Carbon emission factor (kgCO2/kg)1.571.692.97
Table 2. Mix design details of 1 m3 of concrete.
WaterCementFine AggregatesCoarse AggregatesSuperplasticizer
Amount (kgs)158.0416.0670.01196.02.45
Emission factor0.00250.930.00480.0835.2 × 10−6
Reference[27,28][27,29][27,30][27,29][27]
Table 3. Dosage of fibres in kg/m3 and retail price.
NoType of MixFibre Dosage, kg/m3Price per kg
1Plain0.00-
2F13.001500
3F21.001500
4F30.90376
5H1 (F1 + F2 + F3)1.50 + 0.50 + 0.45-
Table 4. Electricity mix in India.
Energy SourceCoalHydroNuclearRenewableNatural GasDieselReference
% Contribution70.6412.043.3110.33.70.5[35]
Average carbon emission factor (kgCO2/kWh)1.190.0020.0150.00120.410.84[33,36]
Table 5. Input variables and the variations used for sensitivity analysis.
Input VariableUnitRangeDistributionReferences
Transport distancekm10–200Uniform-
Electricity emission factorkgCO2/kWh0.03–1.13Lognormal[33,38]
Transport emission factorkgCO2/t-km0.12–0.25Uniform[29,38,39]
Cement emission factorkgCO2/kg0.62–1.14Normal[40,41,42]
Diesel emission factorkgCO2/kg2.61–3.20Lognormal[33,38]
Raw material costINR/kg5% to 95% of the initial valueUniform-
Table 6. Fibre contents (in kg) in the optimal mix designs (per m3).
RegionF1F2F3% Carbon Emission Escalation% Cost Escalation
High-cost saving0.700.700.500.3347.07
High-cost saving0.800.700.400.3049.33
High-cost saving0.900.600.500.3550.08
Feasible0.700.650.550.3445.93
Feasible0.900.700.300.2851.59
High carbon savings0.900.700.400.3352.35
High carbon savings0.900.700.500.3953.10
High carbon savings0.700.900.400.3452.35
Publisher’s Note: MDPI stays neutral with regard to jurisdictional claims in published maps and institutional affiliations.

