Article

Emission Impacts of Post-Pandemic Travel Behaviour in Intercity Corridors

Centre for Mechanical Technology and Automation, Department of Mechanical Engineering, University of Aveiro, 3810-193 Aveiro, Portugal
*
Author to whom correspondence should be addressed.
Future Transp. 2022, 2(1), 249-262; https://doi.org/10.3390/futuretransp2010013
Submission received: 22 November 2021 / Revised: 2 February 2022 / Accepted: 1 March 2022 / Published: 3 March 2022

Abstract

:
COVID-19 pandemic impacted the behaviour of travellers. While worldwide, overall emissions decreased during the lockdown, shared mobility options may be perceived as less safe in a post-pandemic reality, leading to increased emissions due to expanded individual transportation. In particular, intercity trips entail numerous environmental impacts, such as emissions. The main objective of this paper is to assess how intercity corridors’ emissions vary when travel behaviour of the population changes following a pandemic. Based on a macroscopic modelling framework, the methodology consisted of three main phases: data collection, traffic modelling and emission modelling. Different scenarios related to the impact of the pandemic were developed, and their impacts were analysed using several key performance indicators related to CO2 NOx emissions and travel time. Findings suggest that reducing the average number of occupants per vehicle reduces emissions, which do not increase linearly with the number of vehicles. Compared with the baseline scenario (occupancy rate of 1.30), the most extreme scenario (occupancy rate of 1.00) may result in an increase in both CO2 and NOx emissions by approximately 30%. These results highlight the importance of making public transport and carpooling not only safe but also safe as perceived by users.

1. Introduction

A significant part of the road traffic externalities occurs in intercity corridors. Intercity corridor traffic accounts for 65% of total kilometres travelled in Portugal (2017) and more than half of CO2 emissions [1]. The COVID-19 pandemic affected the mobility patterns and behaviour of the population. Globally, the lockdown and teleworking usage reduced road transport activity by 50% compared with the end of March 2019 [2]. The post-pandemic world will probably change how people commute and travel as a result of the digitalisation of workplaces during the pandemic, which means less road transport activity [3]. It will also impact public transportation usage since, in some cases, public transportation activity reduced by around 90% during the pandemic [4]. The public authorities have encouraged movement restrictions as one of the most effective ways to suppress the spread of the COVID-19, impacting the usage of shared mobility, such as public transportation [5,6].
In recent months, the research community has focused on the pandemic’s effects on mobility, mainly by studying the impact of lockdown on the environment. In the near future, the usage of shared mobility options may slow down as people will prefer individual vehicles, such as a car or a bicycle, because these are perceived as safer options, especially in terms of physical distancing [3]. It is important that decision makers and policymakers make safety in public transportation a priority so that individual transportation usage does not increase [7]. It is also be expected that car ownership will decrease due to the teleworking phenomenon, which will make the idea of owning a car unnecessary and expensive [3]. During the lockdown, in the city of Santander (Spain), nitrogen dioxide (NO2) emissions and traffic accidents decreased by approximately 60% [4]. Compared to April 2019, a global decrease of approximately 17% in CO2 emissions has been observed, mainly because of changes in transportation and consumption of goods [8]. According to a study in Australia that intended to evaluate the impact of COVID-19 on household travel after restrictions were eased, travel frequency increased by 50%. However, motor vehicle travel is the most rebounding mode, accounting for two-thirds of pre-COVID-19 travel movements [9]. The COVID-19 pandemic will impact public transportation after restrictions are eased, according to a study [10] that shows that more informed passengers perceived less safety when using public transportation. The COVID-19 has changed the mobility patterns of the population. The work from [11] used stated-preferences mobility surveys to calibrate a model capable of predicting the variables impacting travel decisions in post-pandemic work for students and staff at the University of Padova. The results showed that there are differences between the staff and the students. Available travel alternatives, risk-mitigating measures on vehicles, and the availability of bikes are the most impactful variables in promoting a more sustainable way of travelling for systematic trips in a post-pandemic world [11]. In Germany, research to assess the influence of COVID-19 on day-to-day travel behaviour and future implications for travel patterns showed an increase in car use and a decrease in public transportation usage (as well as a negative perception of public transport as an alternative). The study also concluded that people tend to shop less, that young adults are more active, and that only 25% of the population worked in a home-office environment [12]. A study from India concluded that car dependency has increased and that more users are willing to shift to private transportation [13].
While the study of environmental impacts linked to COVID-19 pandemic is often covered at an urban level, it is underrepresented at an intercity level. Micromobility and other personal electric vehicle solutions are being pointed as viable solutions to overcoming this challenge in cities. However, these alternatives are generally not appropriate for longer interurban trips. The topic of emissions has received attention at an intercity level but not in a post-pandemic context. This study evaluates the effects of the pandemic on emissions in an intercity corridor network [14]. Although some studies analysed the changes in emissions during the lockdown both globally and locally [2,4,8], the near future effects of a return to normal life, motivated by a change in mobility patterns and behaviour in intercity trips, have not been truly explored. This paper aims to examine different scenarios triggered by a change in mobility patterns and investigates how emissions may vary as a result. The assessment of how emissions will behave in a post-pandemic world is important because travel habits may change during and after the pandemic. It is possible that shared mobility and public transportation will decline, which will have an impact on how the network behaves. In this context, four different scenarios are compared with the pre-pandemic baseline scenario: (1) a decrease in the use of public transportation; (2) a decrease in the use of generally shared mobility options; (3) a flattening of the peak hour; and (4) an increase in the use of shared mobility options.
This paper intends to explore the context of uncertainty and forecast the environmental impacts of the post-COVID-19 period. Therefore, the main contributions of this work are:
(1)
Defining a set of plausible transformations associated with network demand and transport mode;
(2)
Assessing the impact of those transformations on emissions;
(3)
Providing general recommendations based on the results obtained.
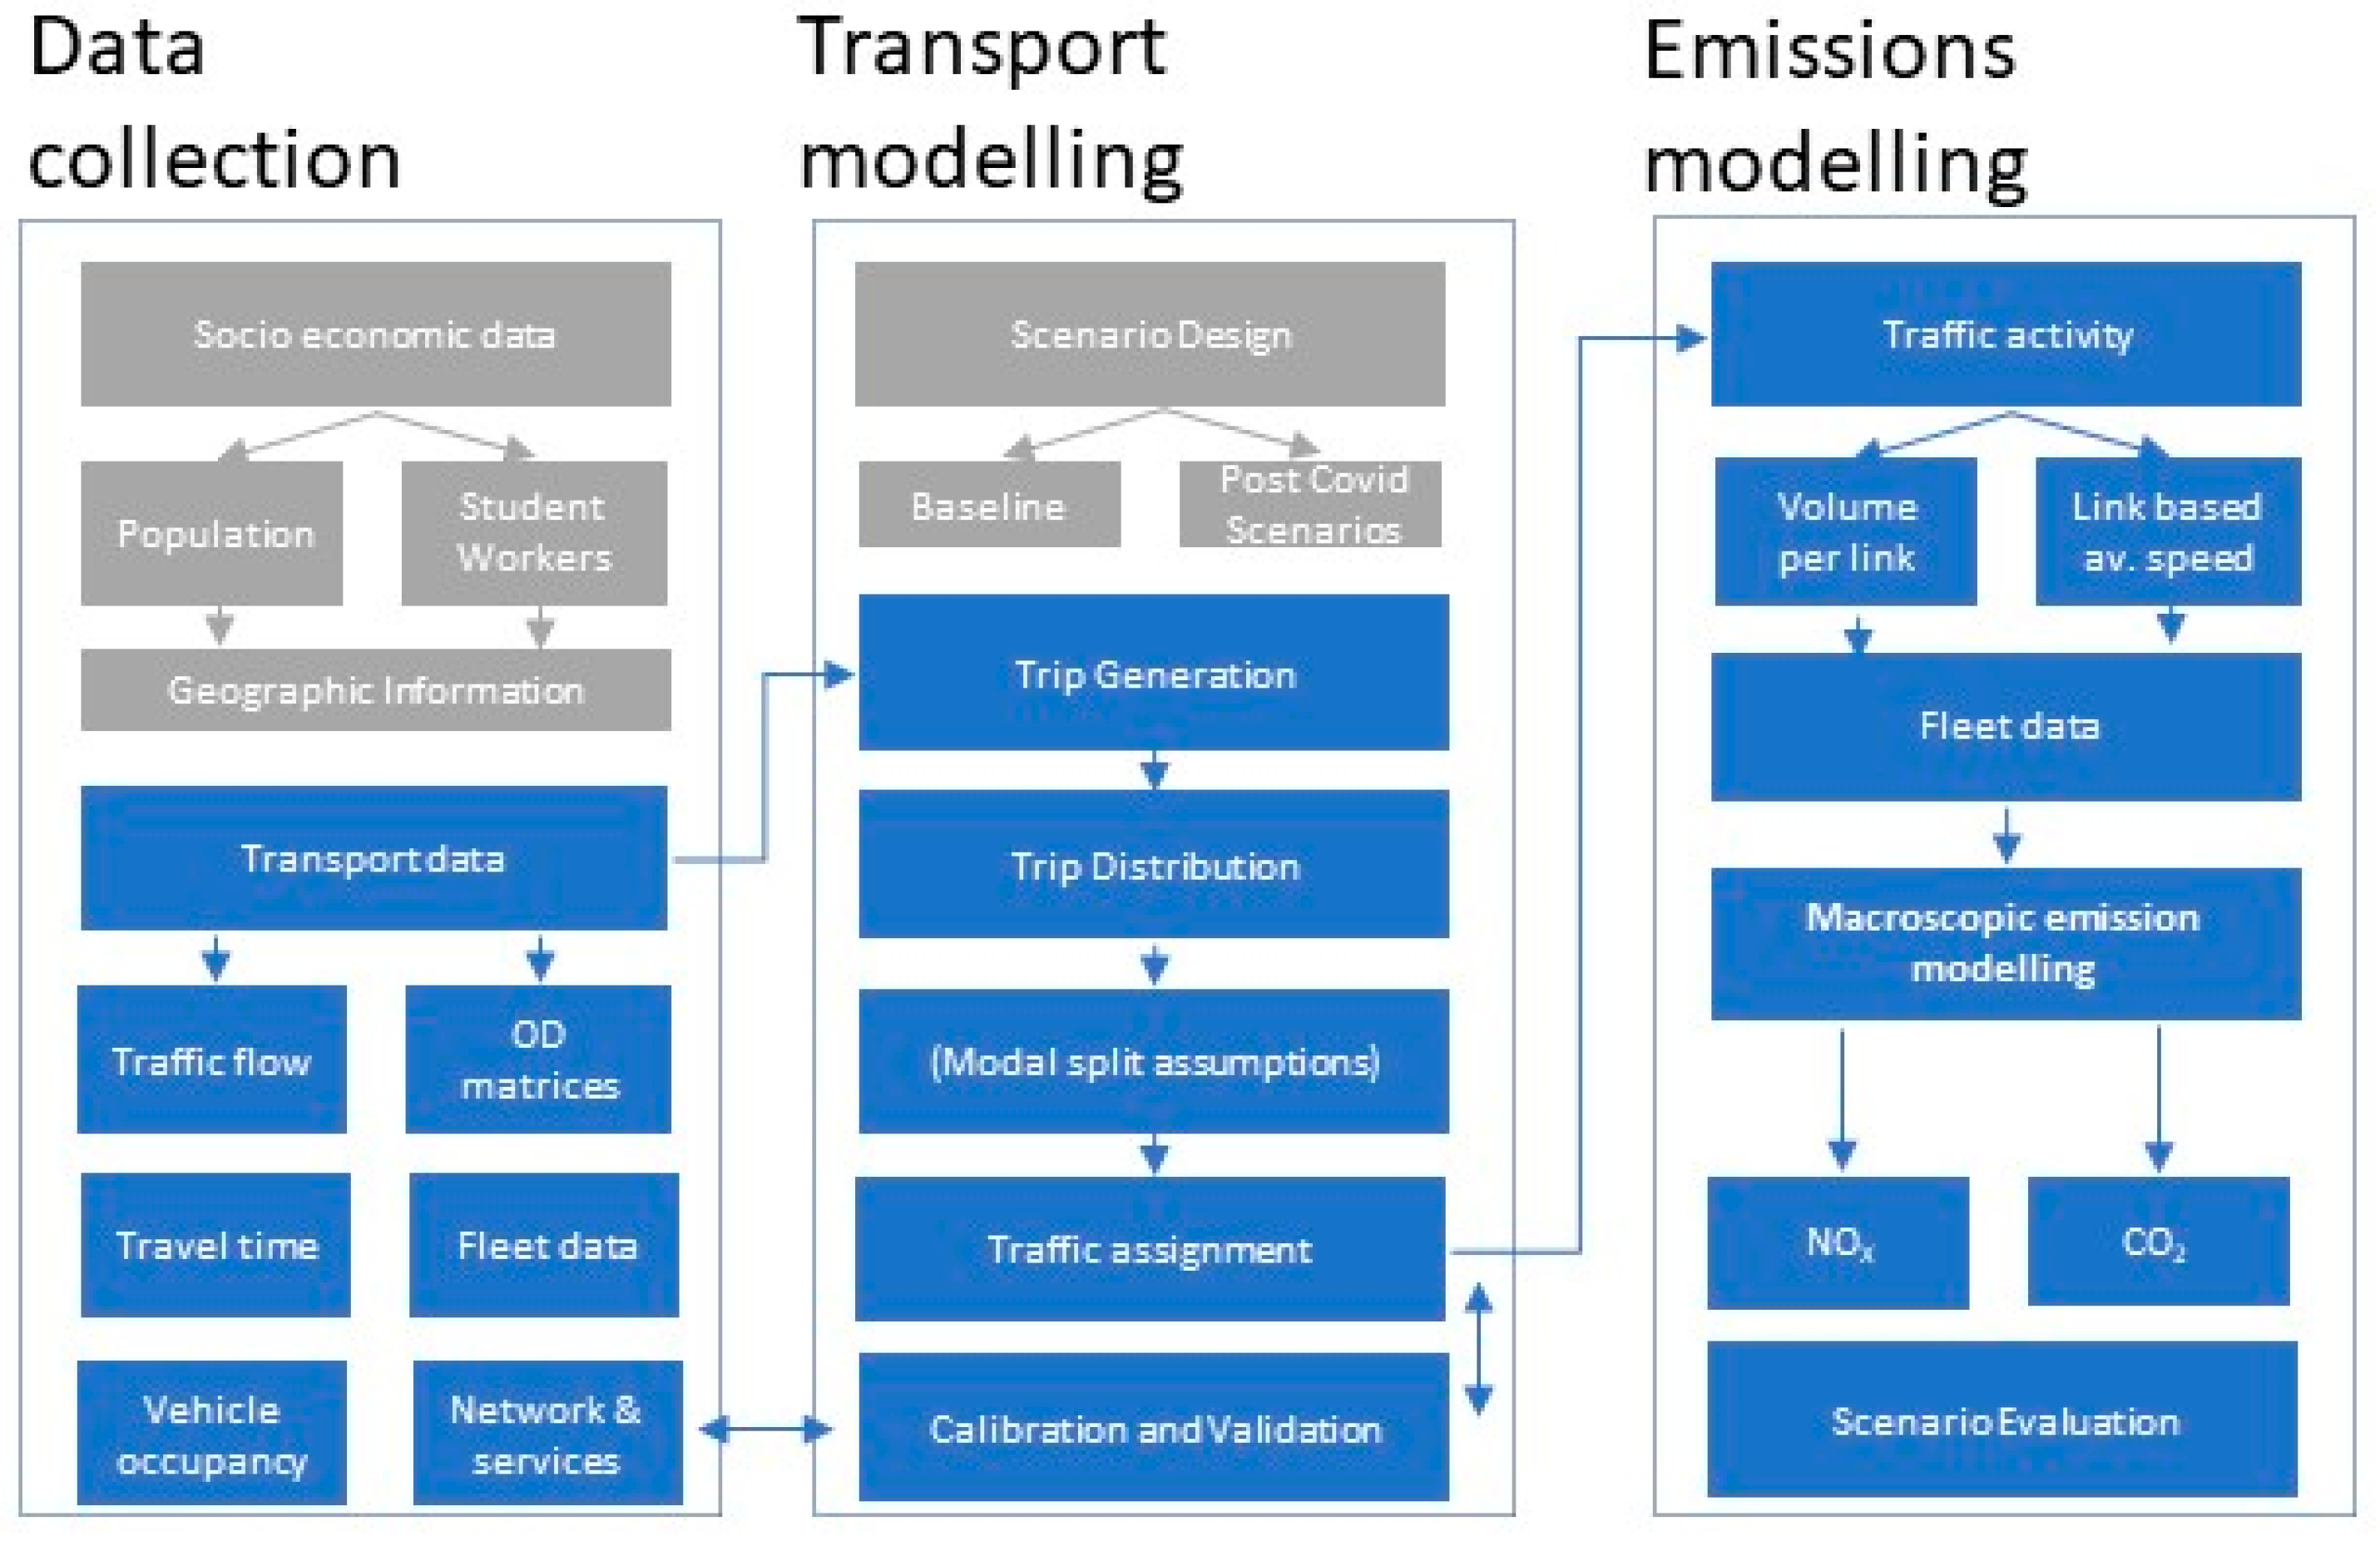
2. Methodology

The general methodology used for this study is illustrated in Figure 1.
The methodology of this study comprises of three different phases. The first phase consists of the data collection needed to calibrate and validate the traffic model in the second phase. The calibration and validation processes are performed using three main variables: travel time, OD matrices, and traffic flows. This process will generate the traffic model used to perform the traffic assignment, leading to the third phase focused on emissions modelling. The results consist of CO2 and NOx emissions and a V/C ratio (vehicles-to-capacity ratio) as a tool for assessing the traffic congestion in the network.
The network selected for the study is the intercity corridor between the cities of Aveiro and Coimbra, Portugal, since there is a significant number of intercity movements in this area. Both are cities in the Centro Region of Portugal. Aveiro has a population of 77,773 inhabitants while Coimbra has 133,940 inhabitants. The two cities are connected by two main roads: one highway with three tolls plazas (63 km) and one national road (62 km). The trips in this intercity corridor are mostly comprised of student, work, and leisure trips. Both cities have universities and significant industry and service works. The model developed shows that for the baseline pre-pandemic scenario for a typical peak hour, there were around 2400 movements, with 61% work-related trips, 12% school-related trips and 28% other activities-related trips [15]. The intercity corridor’s visual representation can be seen in Figure 2.

2.1. Scenarios Understudy

Four different post-pandemic scenarios are designed as follows.
The first scenario (1) is related to the idea that the number of public transport (train) passengers will decrease, which means that they will use individual transportation. Each passenger who previously travelled by public transport (train) will be transferred to the individual transportation matrix, adjusted for a vehicle’s usual occupancy rate, 1.30 occupants per vehicle.
Scenario (2) represents the possible constraints and changes in behaviour that the population may have after the pandemic, which will lead to a decrease in the usage of shared mobility options, such as sharing a vehicle or using less public transport. In this case, the occupancy rate of the vehicles will decrease. This scenario reflects the fear to use shared mobility options such as car sharing and carpooling.
The third scenario (3) will compare the overall emissions of peak and off-peak conditions, representing the peak hour period’s flattening if teleworking remains a favoured option.
The fourth scenario (4) analyses an increase in the occupancy rate of the vehicles. Thus, the number of vehicles in the network will decrease. This scenario is the opposite of scenario (2). It intends to show what would happen if the vehicles’ occupancy rate increases due to a successful car-sharing promotion.
To explore the impact of these scenarios affecting the trip movements, a traffic assignment using PTV VISUM for every scenario and specification is performed.
The specifications of each scenario can be observed in Table 1. The values for scenario (1) and (2) are based on the assumption that (1) the number of train passengers will decrease, and (2) people will avoid car-sharing, thus decreasing the occupancy rate.

2.2. Traffic Macroscopic Model

For traffic modelling, PTV VISUM was used, which is a 4-step simulation model. It is capable of generating the travel and distribution of all trips between and within all the zones [16]. The 4-step simulation comprises four different steps: trip generation, trip distribution, mode choice, and route choice. It also involves two systems: activity system (for example, socioeconomic data) and transport system, in this case, the car is used. The result of the simulation is the traffic flows through the network [17]. The selected network has 13 zones, and they were used to calibrate and validate the model. The network comprises an area of 55 km per 20 km with 163,876 links and 64,904 nodes. The interactions between the two main zones were used (representing the cities of Aveiro and Coimbra) were considered in the simulation. For the sake of simplicity of presentation of results, the analysis of this paper will focus on the OD pair linking the major cities. Figure 1 shows the data used to calibrate, validate, and build the model containing the individual transportation interactions between all zones, each zone representing a different municipality. The timeframe under analysis is the afternoon peak hour period.
General socioeconomic data were used to calibrate the model, including the overall population, number of students (University and other schools), and workers, which were retrieved from a Portuguese statistics organisation [15].
The calibration and validation of the model started by considering the travel time between zones., Google Maps information was used [18] to calibrate the travel time between zones. Google Maps can be a powerful tool to verify the expected travel time between two points as it uses position data from smartphones to obtain real-time traffic conditions.
The origin-destination (OD) number of movements from municipality mobility reports [19,20] was used to calibrate the OD matrices used in the model. The mobility reports are not made every year, and these two are the last ones prepared for the region under study. Population, the number of workers and students were also considered, and the following production/attraction function was used:
f i = c i × [ P O P .   G r o u p ] i × ( a i 2 ) × b i
where a is the average number of trips per inhabitant; b is the percentage of individual transportation, c is an adjustment factor and i the population group (workers, students, other).
The factors used for the population group can be seen in Table 2.
For traffic flow calibration, data containing hourly and daily traffic data in specific road segments of the network were provided by [21,22]. While the OD matrices represent the number of trips during 24 h, to characterise the peak-hour and off-peak hour periods, hourly traffic data was used to adjust the traffic volumes for those timeframes. The Linear User Cost Equilibrium (LUCE) algorithm [23] was used to perform the traffic assignment. This algorithm has the ability to achieve high convergence in the assignment of each OD pair to the several route options [23].
For validation, it is recommended that for travel times should not have an error higher than 22% [24]. The same threshold is used for OD matrices and traffic flows, and it is never exceeded. Travel time validation had an average deviation of 9%, while the validation of OD matrices and traffic flow had an average deviation of 6% and 16%, thus respecting the threshold of 22%.

2.3. Emissions and Volume/Capacity Ratio

The emissions are estimated using an average speed-based emission methodology presented in [25]. Due to the macroscopic nature of the network, this was the methodology selected to estimate emissions, since it only requires each road segment’s average speed, which is one of the VISUM traffic model’s main outputs. Emissions are computed for a reasonable range of speeds, considering the road types, using the software COPERT5.2 and considering a representative vehicle of the national vehicle fleet composition, which considers the age of vehicles, motorisation, Euro standard and segment. The main advantage of this methodology is that the emission factors can be obtained without prior information on vehicle technology, and they are established for a representative vehicle type. This makes the methodology suitable to apply for emissions estimation in macroscopic models [25]. Taking into account the fleet from Portugal, 51% of the vehicles in the network are diesel, while 49% are petrol [1].
The CO2 and NOx emissions factors (g/km) are given for a typical Portuguese diesel and petrol passenger car and can be found in the following expressions [25]:
For a petrol vehicle:
E F P t ,   C O 2 ( s ) = { 0.167 s 2 14.469 s + 477.342 , s 50   k p h 0.016 s 2 2.362 s + 224.54 , 50 < s 90   k p h 0.010 s 2 + 3.173 s 62.782 , s > 90   k p h
E F P t ,   N O x ( s ) = { 3.419 E 0.7 s 4 + 3.433 E 05 s 3 0.001 s 2 + 0.015 s + 0.191 , s 50   k p h 0.0013 s + 0.132 , 50 < s 90   k p h 3.664 E 05 s 2 + 0.011 s 0.473 , s > 90   k p h
For a diesel vehicle:
E F D i ,   C O 2 ( s ) = { 0.072 s 2 7.530 s + 360.424 , s 50   k p h 0.016 s 2 2.382 s + 232.506 , 50 < s 90   k p h 0.013 s 2 + 4.063 s 118.60 , s > 90   k p h
E F D i ,   N O x ( s ) = { 0.0003 s 2 0.0281 s + 1.3511 , s 50   k p h 0.0001 s 2 0.0142 s + 1.0232 , 50 < s 90   k p h 0.001 s 2 + 0.0334 s 1.5687 , s > 90   k p h
where s is the average speed (kph) of the road segment, EF is the emission factor, Pt is for petrol vehicles and Di is for diesel vehicles.
Using the average speed of each road segment, an emission factor is associated with each road segment of the network. Thus, the emissions for each road segment can be estimated by using the following function:
E R S ,   P = E F R S , P , T × D R S × Q R S
where E is the emissions (g) for each RS (road segment) and P (pollutant—CO2 or NOx). D is the distance of each RS and Q is the traffic flow of each RS.
The volume-to-capacity ratio of each road segment is also analyzed:
V / C R S = V o l u m e   ( v e h ) R S R o a d   c a p a c i t y   ( v e h ) R S
It will be important to evaluate how the network behaves in terms of congestion for different scenarios. If the V/CRS is greater than 1, it means that the road segment under severe congestion.

3. Results

In this section, the results of the baseline scenario and all the different scenarios will be presented. The overall CO2 and NOx emissions are analyzed. Furthermore, the major differences in the network conditions such as the V/C ratio and the traffic density are considered.

3.1. Baseline Scenario

The baseline scenario represents the situation before the COVID-19 pandemic. The graphic results for the baseline scenario from the network assignment can be seen in Figure 3.
The baseline scenario comprises the traffic conditions at the afternoon peak hour in the pre-pandemic scenario. Two main roads are preferred for individual transportation, one highway and one national road. From Aveiro to Coimbra, the highway has around 550 vehicles per hour (vph), while the national road has around 650 vph. From Coimbra to Aveiro, the highway has around 450 vph and the national road 650 vph. It is possible to see in Figure 2, that the highway has higher specific CO2 emissions than the national road. For the baseline scenario, the overall estimated CO2 and NOx emissions are 23 tons and 0.07 ton, respectively. Around 56 road segments have a V/C ratio above 1, and the number of vehicles per km is 3084. The congested road segments are found in road segments with lower capacity, mainly at the entries and exits of both towns.

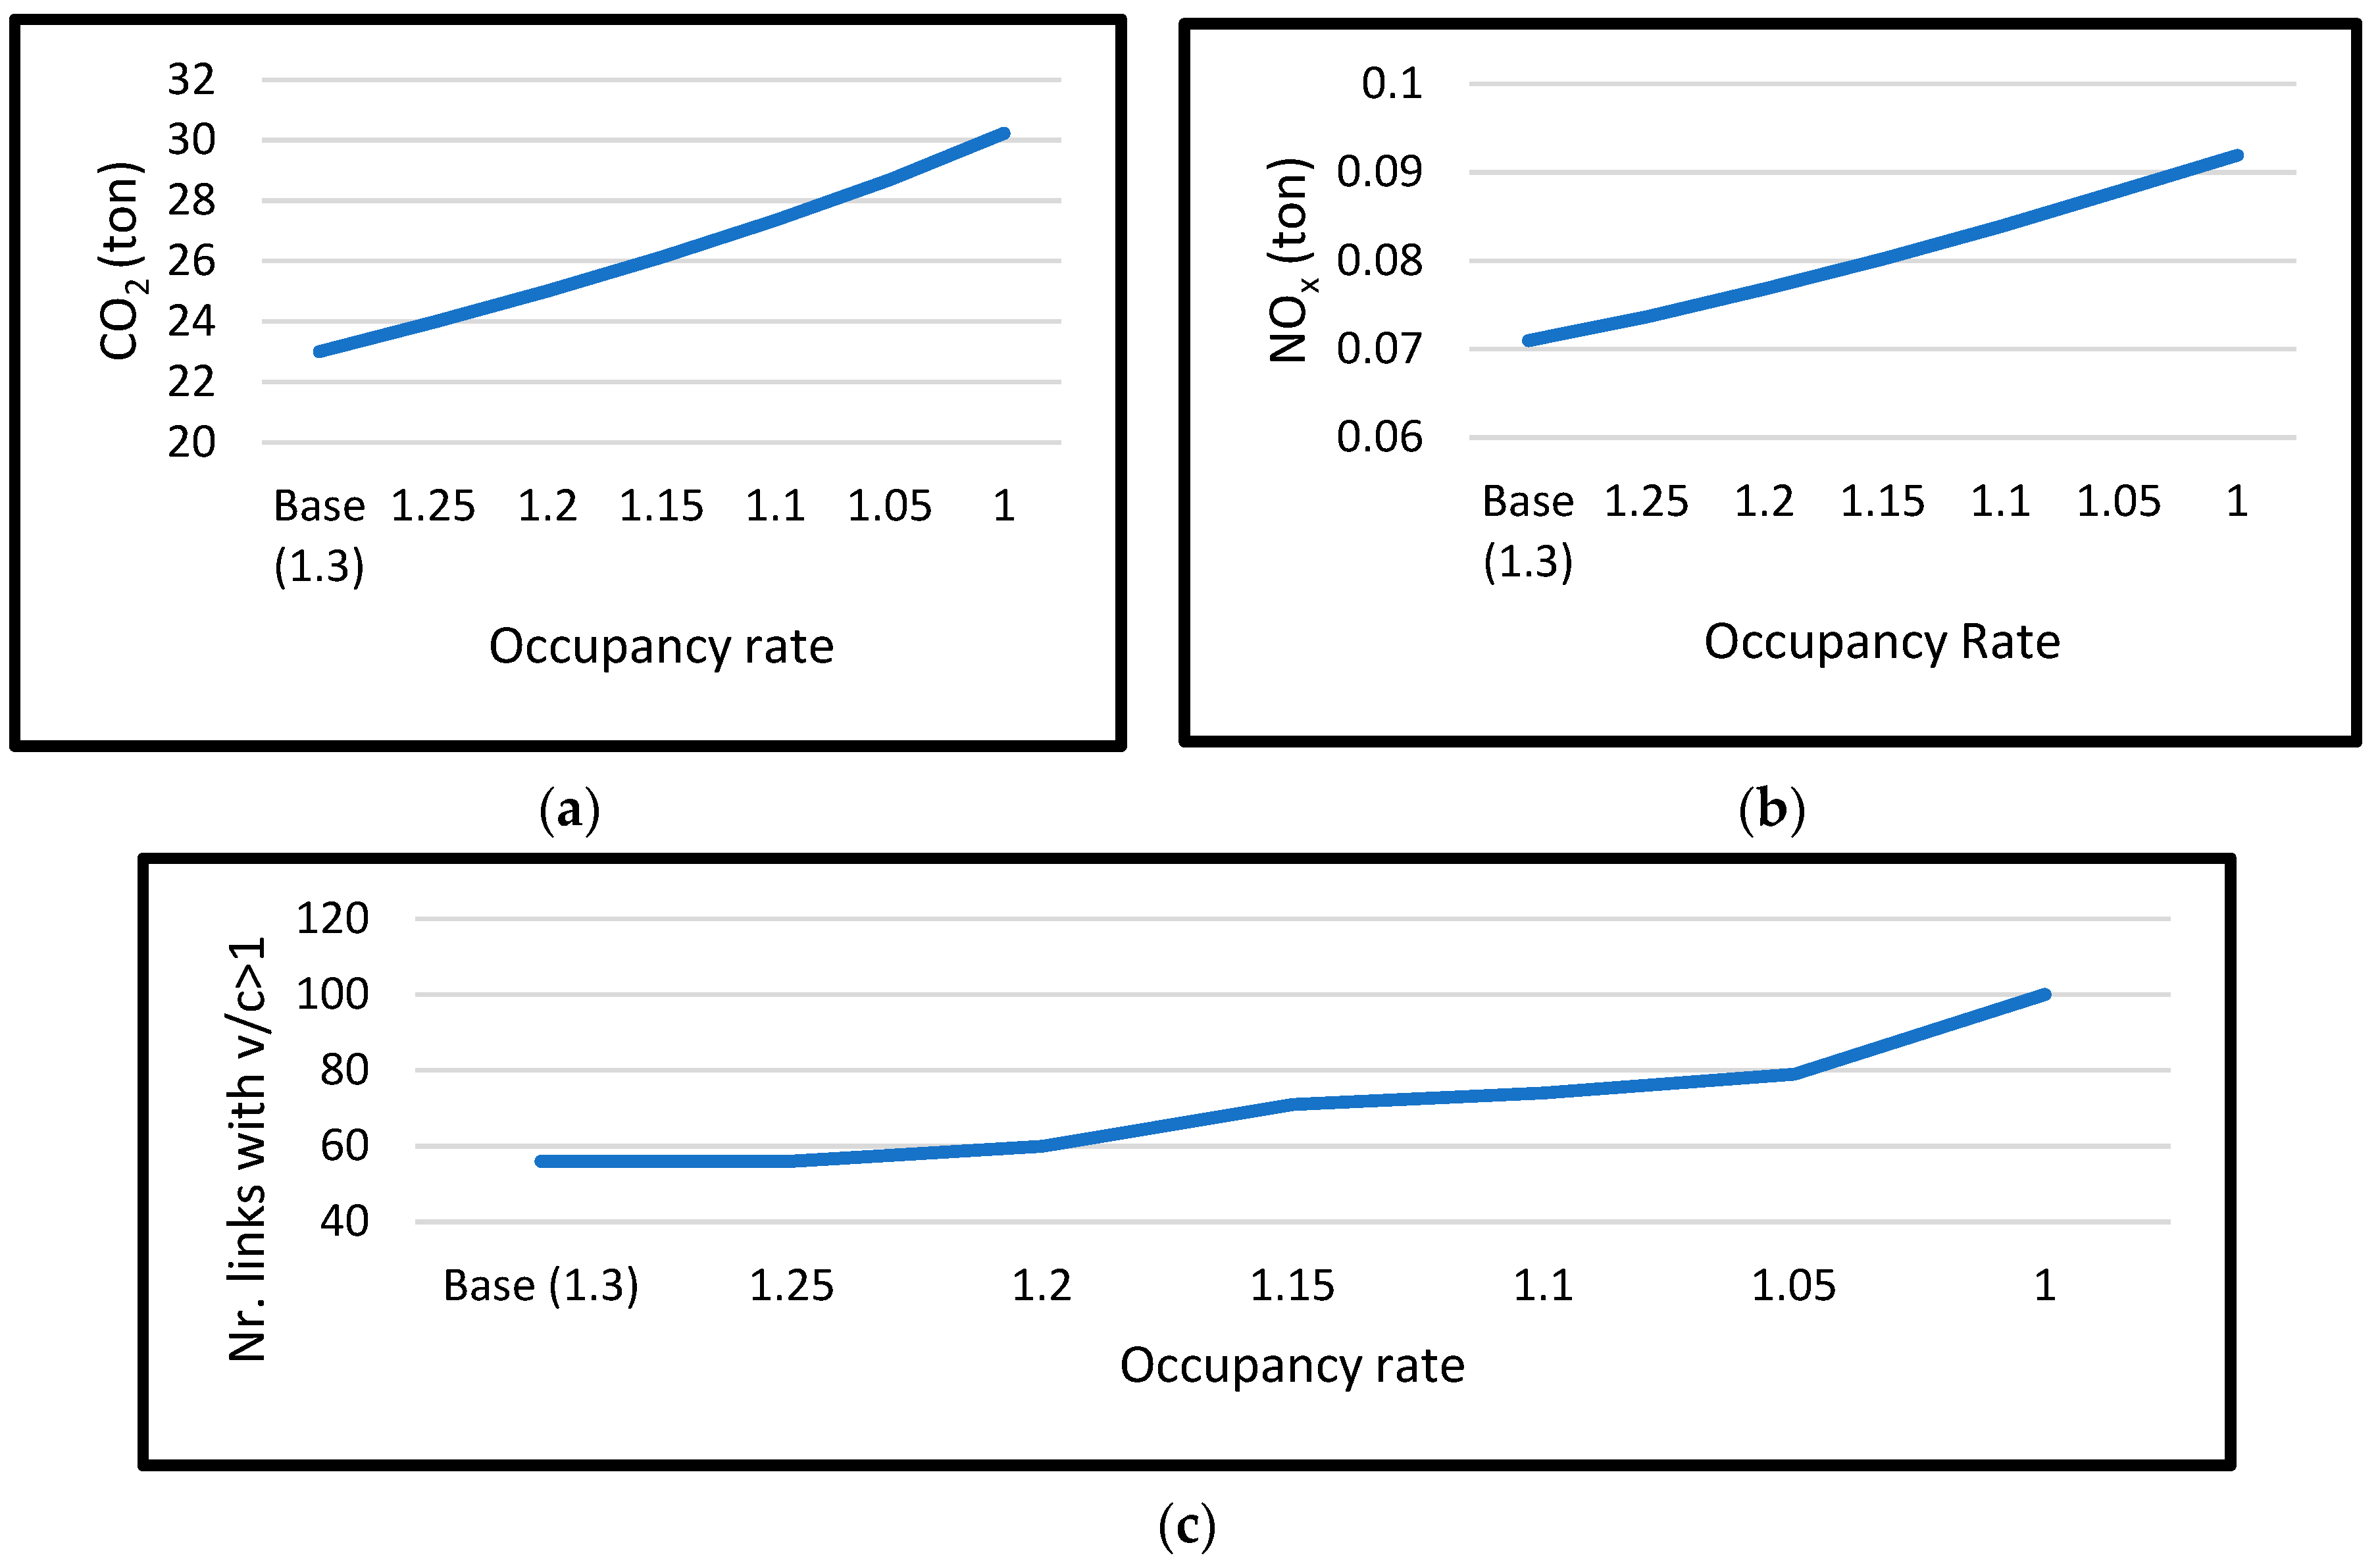
3.2. Alternative Scenarios

In scenario (1), the number of people travelling by train will decrease. Figure 4 shows the impacts on CO2 and NOx emissions variation due to public transport demand variation. The number of links with a V/C ratio higher than 1 is also analyzed.
As expected, the decrease in public transport (PT) ridership leads to increased CO2 and NOx emissions. For the V/C ratio, the number of links below maximum capacity remains constant up to 10% and 20% PT reduction of ridership. After 30% PT reduction, the number of congested road segments increases to 59, and for 40% to 69, and for 50% to 70. CO2 and NOx emissions increase approximately 2.6% and 2.2% through each reduction step in the public transport ridership. For the most extreme scenario, a reduction of 50% in public transport usage, the CO2 emissions are expected to increase by 12.8%. The number of vehicles per km decreases until a reduction of 30%, a decrease of 0.51%, while at 40% and 50%, this factor increases by 1.50% and 3.50%, respectively. These values are aligned with the major increase in the V/C ratio after the reduction of 30%.
In scenario (2), in addition to the fear of using mass public transport, the fear of contamination is still partially observed in ridesharing solutions. Therefore, people use less shared mobility options, decreasing the vehicles’ occupancy rate and leading to a higher number of vehicles in the network. Figure 5 shows the impacts on CO2 and NOx emissions variation due to a reduction in the usage of shared mobility options. The number of links with a V/C ratio higher than 1 is also analyzed.
The overall CO2 and NOx emissions increases. The same happens with the number of links with a V/C ratio greater than 1, this usually happens in entries and exits of each city.
Regarding CO2 and NOx emissions, for each reduction in occupancy rate, the emissions will increase. The growth rate can be seen in Table 3.
In the most extreme scenario, an occupancy rate of only 1 person per vehicle, it is expected that CO2 and NOx emissions to increase 31% and 29%, respectively, when compared with the baseline scenario. As can be seen in Table 3, the growth rate of NOX emissions is lower than that of CO2. This fact can be explained because the reduction in speed caused by the increase in demand (higher V/C ratio) in general has a more damaging effect on CO2 emissions than on NOX emissions that are emitted mainly at higher speeds.
Table 4 shows how the V/C ratio, average vehicles per km and average gCO2/veh. Km change for every occupancy rate under study.
As the occupancy rate decreases, the number of road segments with a V/C greater than 1 increase. For an occupancy rate of 1, the number of road segments prone to congestion is expected to be 100, almost double the baseline scenario (56 road segments with V/C ratio > 1). When analysing the average number of vehicles per km, this value decreases when comparing an occupancy rate of 1.30 and 1.25. However, it increases from 1.25 to 1.10 and decreases again for an occupancy rate of 1.05 and 1.00. The average gCO2/veh·km follows the same trend. It has a small decrease from 1.30 and 1.25 and then increases until an occupancy rate of 1.10. For an occupancy rate of 1.05 and 1.00, the average gCO2/veh·km is lower than the baseline scenario. The average number of vehicles and gCO2/veh per km does not follow a linear growth trend. Such oscillation in the CO2 emission factor per vehicle can be justified in the by the redistribution of vehicles on the network resulting from new equilibrium conditions due to changes in overall demand. Consequently, the average speed of the traffic flows is also affected, leading to slight changes in the vehicles’ environmental performance observed in each occupancy rate scenario.
When comparing the baseline scenario and the occupancy rate scenarios of 1.05 and 1.00, an increase in CO2 emissions is observed. Simultaneously, there is a decrease in the average value per km and terms of traffic density (number of vehicles per km). These results suggest that, although more vehicles are circulating in the network, drivers may start to use alternative routes as the number of road segments congested increases. The overall emissions increase but not linearly (see Table 3) due to a change in route choice behaviour.
In scenario (3), the off-peak hours are chosen to be representative of a flattening of the peak hour period due to teleworking. The number of vehicles in the network can be compared in Figure 6.
CO2 and NOx decreased by approximately 30%, while the number of road segments prone to congestion presented a decrease of more than 35%, mainly near the exits and entries of both cities.
In scenario (4), it is simulated that people tend to adopt shared mobility solutions, avoiding the risk of travelling in large capacity public transport solutions, looking instead for shared mobility solutions of lower capacity and with lower potential perceived contagion. The results are reported in Table 5.
In this alternative scenario, the CO2 and NOx emissions decrease. For an occupancy rate of 1.35, CO2 emissions decrease by 4%, while for an occupancy rate of 1.40, the emissions decrease by almost 8%. The NOx emissions decrease by more than 3% (occupancy rate of 1.35) and 7% (occupancy rate of 1.40). The number of links with a V/C ratio greater than 1 only decreases for an occupancy rate of 1.40.

4. Discussion

This paper’s main objective is to assess how the emissions in intercity movements may be affected during and after the COVID-19 pandemic. For this purpose, several scenarios were simulated, reflecting the changes that the COVID-19 may have on the population’s behaviour. Less usage of shared mobility options such as public transport and carpooling may occur. For this effect, four scenarios were tested in a peak-hour period for an intercity corridor: (1) a decrease of the use of public transport; (2) a decrease of the use of generally shared mobility options; (3) analysis of the peak hour flattening simulating the effects of teleworking, and (4) a scenario where people will use more carpooling.
Results show that if the population uses less shared options, an increase in CO2 and NOx emissions would occur. Regarding scenario number (1), it is expected to increase emissions, a reduction in public transport usage by 50% may lead to a 13% increase of CO2 emissions. In comparison, NOx emissions may increase by a percentage of 12%. It is also expected that the congestion will increase. The number of road segments prone to congestion will increase to 70 from 56 (base scenario). The scenario (1) represents an increase in vehicles in the network as the number of the population travelling by public transportation decreases, overall, which led to an increase in emissions and congestion. In scenario (2), a general decrease in the use of shared mobility options will lead to a lower occupancy rate per car. This is the more expected scenario as it covers the lesser use of public transport and for example, carpooling or ridesharing. This will represent an increase in both CO2 and NOx emissions. For the most extreme scenario, with only 1 person per car, the CO2 emissions and NOx emissions are expected to increase by 31% and 29%, respectively. The congestion will also increase, and the number of road segments prone to congestion will increase to 100. In this scenario, it was possible to observe that the overall emissions do not decrease linearly. The average value of CO2 per km and vehicle is actually lower in the most extreme scenario (0.6% lower) compared with the baseline scenario. Such results suggest that not only does the number of vehicles in the network increase, but the route choice behaviour also changes. In scenario (2), the continuous use of private transportation with less people sharing the same vehicle leads to an increase in the number of vehicles using the network, which will represent an increase in emissions and congestion. For scenario (3), a flattening of the peak hour is tested by analysing the off-peak period. The CO2 and NOx emissions are around 30% less when comparing the off-peak hour with the base scenario. Scenario (3) intends to study what will happen if teleworking persists and there is a flattening of the hourly traffic, which will mean that there will be fewer vehicles during the peak hour but more vehicles in the off-peak period. The more homogeneous distribution of demand throughout the day will improve congestion and allow for a decrease in emissions levels. In scenario (4), a different approach is tested, and the number of persons by car increases. The CO2 emissions may decrease by around 8% when compared with the base scenario. Scenario (4) was designed to analyse the network with fewer vehicles in circulation, meaning more people use shared mobility solutions or public transportation. The emissions decrease and the road segments prone to congestion will be fewer.

5. Conclusions

This work shows that if the use of shared mobility options (such as public transport and carpooling) is not perceived as safe in intercity corridors, emissions and congestion will increase, which is also expressed in [3]. It will be important that policymakers adopt policies that ensure that public transportation is clean and safe, followed by educational measures so that public transport and carpooling are safe and perceived as a safe option by users to travel between cities such as those stated in [7]. The results of this study generate findings with policy and planning implications, and some recommendations should be highlighted:
(1)
Changes in demand patterns can generate a new balance of passenger demand and traffic distribution in the transport network. Eventually, these changes may increase negative environmental pressures in more sensitive areas that need new monitoring tools;
(2)
Intercity trips account for a very significant component of the transport sector’s contributions to climate change. New mobility habits must be taken into consideration and, if necessary, redesign the planning of services and infrastructures in IC corridors;
(3)
Public transport is a major solution to decrease emissions. If necessary, the public transport offer should be better adjusted to suit the population needs;
(4)
Use of ICT tools to improve and foster public transport should be used, for example, transport operators could have solutions such as pre-booking seats; real-time crowding information to see how many people are using a given public transport; and dynamic prices and innovative ticketing strategies;
(5)
Regarding private transportation, a set of tools to mitigate the environmental impacts should also be considered, mainly the adjustment of toll prices and the use of, for example, dynamic tolls.
There were some limitations regarding this work. For example, it was impossible to collect field data due to sanitary and safety measures. For future work, it is suggested to (1) deepen the study of the impacts that all the measures applied in public transport, such as social distancing, have in the traffic flows and (2) to perform survey data collection to see how the population feels regarding the mobility between cities in a post-pandemic situation (namely, to find out if people will use more or less shared mobility options or will choose to telework if the employer allows it).

Author Contributions

Conceptualization, C.S., M.C.C. and J.M.B.; methodology, C.S., M.C.C. and E.M.; software, C.S.; validation, C.S., M.C.C., E.M. and J.M.B.; formal analysis, C.S., M.C.C. and E.M.; investigation, C.S.; resources, C.S. and J.M.B.; data curation, C.S., E.M. and J.M.B.; writing—original draft preparation, C.S.; writing—review and editing, C.S., M.C.C., E.M. and J.M.B.; visualization, C.S., M.C.C., E.M. and J.M.B.; supervision, M.C.C., E.M. and J.M.B.; project administration, J.M.B.; funding acquisition, C.S., M.C.C. and J.M.B. All authors have read and agreed to the published version of the manuscript.

Funding

This work was supported by the projects: UIDB/00481/2020 and UIDP/00481/2020—FCT—Fundação para a Ciencia e a Tecnologia; and CENTRO-01-0145-FEDER-022083—Centro Portugal Regional Operational Programme (Centro2020), under the PORTUGAL 2020 Partnership Agreement, through the European Regional Development Fund; InFLOWence (POCI-01-0145-FEDER-029679), DICA-VE (POCI-01-0145-FEDER-029463, Driving2Driverless (POCI-01-0145-FEDER-31923). C. Sampaio also acknowledges the FCT support for the Scholarship SFRH/BD/138746/2018.

Institutional Review Board Statement

Not applicable.

Informed Consent Statement

Not applicable.

Data Availability Statement

Not applicable.

Conflicts of Interest

The authors declare no conflict of interest.

References

  1. EMISIA. COPERT Countries Data. 2019. Available online: https://www.emisia.com/utilities/copert-data/ (accessed on 20 September 2021).
  2. IEA (International Energy Agency). Changes in Transport Behaviour during the COVID-19 Crisis—Analysis. IEA. 2020. Available online: https://www.iea.org/articles/changes-in-transport-behaviour-during-the-covid-19-crisis (accessed on 20 September 2021).
  3. Kanda, W.; Kivimaa, P. What opportunities could the COVID-19 outbreak offer for sustainability transitions research on electricity and mobility? Energy Res. Soc. Sci. 2020, 68, 101666. [Google Scholar] [CrossRef] [PubMed]
  4. Aloi, A.; Alonso, B.; Benavente, J.; Cordera, R.; Echániz, E.; González, F.; Ladisa, C.; Lezama-Romanelli, R.; López-Parra, A.; Mazzei, V.; et al. Effects of the COVID-19 lockdown on urban mobility: Empirical evidence from the city of Santander (Spain). Sustainability 2020, 12, 3870. [Google Scholar] [CrossRef]
  5. Askitas, N.; Tatsiramos, K.; Verheyden, B. Lockdown Strategies, Mobility Patterns and COVID-19; IZA Discussion Papers 13293; Institute of Labor Economics (IZA): Bonn, Germany, 2020. [Google Scholar]
  6. Musselwhite, C.; Avineri, E.; Susilo, Y. Editorial JTH 16 –The Coronavirus Disease COVID-19 and implications for transport and health. J. Transp. Health 2020, 16, 100853. [Google Scholar] [CrossRef] [PubMed]
  7. De Vos, J. The effect of COVID-19 and subsequent social distancing on travel behaviour. Transp. Res. Interdiscip. Perspect. 2020, 5, 100–121. [Google Scholar] [CrossRef]
  8. Le Quéré, C.; Jackson, R.B.; Jones, M.W.; Smith, A.J.P.; Abernethy, S.; Andrew, R.M.; De-Gol, A.J.; Willis, D.R.; Shan, Y.; Canadell, J.G.; et al. Temporary reduction in daily global CO2 emissions during the COVID-19 forced confinement. Nat. Clim. Chang. 2020, 10, 647–653. [Google Scholar] [CrossRef]
  9. Beck, M.J.; Hensher, D.A. Insights into the impact of COVID-19 on household travel and activities in Australia—The early days of easing restrictions. Transp. Policy 2020, 99, 95–119. [Google Scholar] [CrossRef] [PubMed]
  10. Dong, H.; Ma, S.; Jia, N.; Tian, J. Understanding public transport satisfaction in post COVID-19 pandemic. Transp. Policy 2021, 101, 81–88. [Google Scholar] [CrossRef]
  11. Ceccato, R.; Rossi, R.; Gastaldi, M. Travel Demand Prediction during COVID-19 Pandemic: Educational and Working Trips at the University of Padova. Sustainability 2021, 13, 6596. [Google Scholar] [CrossRef]
  12. Kolarova, V.; Eisenmann, C.; Nobis, C.; Winkler, C.; Lenz, B. Analysing the impact of the COVID-19 outbreak on everyday travel behaviour in Germany and potential implications for future travel patterns. Eur. Transp. Res. Rev. 2021, 13, 27. [Google Scholar] [CrossRef]
  13. Thombre, A.; Agarwal, A. A paradigm shift in urban mobility: Policy insights from travel before and after COVID-19 to seize the opportunity. Transp. Policy 2021, 110, 335–353. [Google Scholar] [CrossRef]
  14. Sampaio, C.; Macedo, E.; Coelho, M.C.; Bandeira, J.M. Characterisation of road traffic externalities in an intercity corridor. Int. J. Transp. Dev. Integr. 2019, 3, 222–231. [Google Scholar] [CrossRef]
  15. PORDATA. Pordata Statistics. 2020. Available online: https://www.pordata.pt/ (accessed on 20 September 2021).
  16. Piątkowski, B.; Maciejewski, M. Comparison of traffic assignment in visum and transport simulation in MATSim. Transp. Probl. 2013, 8, 113–120. [Google Scholar]
  17. Kuang, Y.; Yen, B.T.H.; Suprun, E.; Sahin, O. A soft traffic management approach for achieving environmentally sustainable and economically viable outcomes: An Australian case study. J. Environ. Manag. 2019, 237, 379–386. [Google Scholar] [CrossRef] [PubMed]
  18. Google Maps. Google Maps 2021. Available online: https://www.google.pt/maps (accessed on 20 September 2021).
  19. TiS. Plano Intermunicipal de Mobilidade e Transportes da Região de Aveiro—Relatório de Síntese. 2014. Available online: https://www.regiaodeaveiro.pt/regiaodeaveiro/uploads/document/file/1354/relat_c3_b3rio_20sintese_20final_20_n_c3_a3o_20t_c3_a9cnico_.pdf (accessed on 20 September 2021).
  20. TRENMO. Plano Intermunicipal de Mobilidade e Transportes da Região de Coimbra. 2016. Available online: https://www.cim-regiaodecoimbra.pt/cim-rc/o-que-fazemos/estudos-e-planeamento/pimt-plano-intermunicipal-de-mobilidade-e-transportes/ (accessed on 20 September 2021).
  21. IMT (Instituto da Mobilidade e dos Transportes). Relatório de Tráfego na Rede Nacional de Autoestradas—1o Trimestre de 2019. 2019. Available online: http://www.imt-ip.pt/sites/IMTT/Portugues/InfraestruturasRodoviarias/RedeRodoviaria/Relatrios/Relat%C3%B3rio%20de%20Tr%C3%A1fego%20-%201%C2%BA%20Trimestre%20de%202019.pdf (accessed on 20 September 2021).
  22. IMT (Instituto da Mobilidade e dos Transportes). Traffic data (intercity corridor Aveiro—Coimbra). 2020. Available online: https://www.imt-ip.pt/sites/IMTT/Portugues/Paginas/IMTHome.aspx (accessed on 20 September 2021).
  23. Gentile, G.; Roma, D.; Noekel, K.; Ag, P. Linear User Cost Equilibrium: The new algorithm for traffic assignment in VISUM. In Proceedings of the European Transport Conference 2009, Noordwijkerhout, The Netherlands, 5–7 October 2009; Available online: https://www.researchgate.net/publication/228425160_Linear_User_Cost_Equilibrium_the_new_algorithm_for_traffic_assignment_in_VISUM (accessed on 20 October 2021).
  24. Kim, S.-J.; Kim, W.; Rilett, L.R. Calibration of Microsimulation Models Using Nonparametric Statistical Techniques. Transp. Res. Rec. 2005, 1935, 111–119. [Google Scholar] [CrossRef]
  25. Macedo, E.; Tomás, R.; Fernandes, P.; Coelho, M.C.; Bandeira, J.M. Quantifying Road traffic emissions embedded in a multi-objective traffic assignment model. Transp. Res. Procedia 2020, 47, 648–655. [Google Scholar] [CrossRef]
Figure 1. Methodology overview.
Futuretransp 02 00013 g001
Figure 2. Case study visual representation.
Futuretransp 02 00013 g002
Figure 3. Results obtained for the baseline scenario: (a) the number of vehicles; (b) specific CO2 emissions for a petrol car.
Futuretransp 02 00013 g003
Figure 4. Results regarding scenario (1): (a) CO2 ton; (b) NOx ton, and (c) number of links with a V/C ratio greater than 1. Peak-hour period.
Futuretransp 02 00013 g004
Figure 5. Results regarding scenario (2): (a) CO2 ton; (b) NOx ton, and (c) number of links with a V/C ratio greater than 1. Peak-hour period.
Futuretransp 02 00013 g005
Figure 6. Representation of the number of vehicles in the network: (a) baseline scenario and (b) off-peak scenario.
Futuretransp 02 00013 g006
Table 1. Scenarios under study and their specifications.
ScenarioSpecifications
(1)The number of train passengers will decrease by 10%; 20%; 30%; 40% and 50%, representing an increase in the number of vehicles.
(2)The occupancy rate will decrease: 1.25; 1.20; 1.15; 1.10; 1.05 and 1.00. This will lead to an increase in the number of vehicles.
(3)This scenario compares the off-peak and peak scenarios, simulating the teleworking impact
(4)The occupancy rate will increase by 1.35 and, 1.40. Fewer vehicles in the network
Table 2. Factors used in production/attraction functions.
Population Group (i)abc
Workers20.551
Students(University)20.201
Other20.051
Other1.20.70.25
Table 3. CO2 and NOx emissions growth rate for scenario (2).
Occupancy RateCO2 Emissions Growth Rate (%) NOx Emissions Growth Rate (%)
1.30–1.254.23.8
1.25–1.204.54.4
1.20–1.154.94.8
1.15–1.105.35.2
1.10–1.055.95.6
1.05–1.006.65.7
Table 4. Network conditions for scenario (2).
Occupancy RateNumber of Road Segments with V/C > 1Average Vehicles per kmAverage gCO2/veh·km
1.30 (baseline scenario)563084161.6
1.25563053161.5
1.20603091161.8
1.15713208162.3
1.10743222162.5
1.05792947161.4
1.001002831160.7
Table 5. Results obtained for scenario (4).
ScenarioCO2 EmissionsNOx EmissionsV/C (nr. of Links with V/C > 1)
Baseline23.000.07156
Occupancy rate of 1.3522.090.06956
Occupancy rate of 1.4021.260.06754
Publisher’s Note: MDPI stays neutral with regard to jurisdictional claims in published maps and institutional affiliations.

