Article

Scenarios of Automated Mobility in Austria: Implications for Future Transport Policy

by
Aggelos Soteropoulos
1,*,
Paul Pfaffenbichler
2,
Martin Berger
1,
Günter Emberger
3,
Andrea Stickler
4 and
Jens S. Dangschat
4
1
Institute for Transportation System Planning, Technical University of Vienna, 1040 Vienna, Austria
2
Institute for Transport Studies, University of Natural Resources and Life Sciences, 1180 Vienna, Austria
3
Institute for Transport Planning and Traffic Engineering, Technical University of Vienna, 1040 Vienna, Austria
4
Centre for Sociology, Technical University of Vienna, 1040 Vienna, Austria
*
Author to whom correspondence should be addressed.
Future Transp. 2021, 1(3), 747-764; https://doi.org/10.3390/futuretransp1030041
Submission received: 6 September 2021 / Revised: 11 October 2021 / Accepted: 2 November 2021 / Published: 1 December 2021

Abstract

:
Developments in the field of automated mobility will greatly change our mobility and the possibilities to get from one place to another. This paper presents different scenarios for personal mobility in Austria, anticipating the possibilities and developments in the field of automated vehicles (AVs). The scenarios were developed using a systematically formalized scenario technique and expand the social and political discourse on automated mobility, which is currently characterized by a lack of experience and visibility as an established transport service. Using system dynamics modeling techniques, i.e., the Metropolitan Activity Relocation Simulator (MARS), impacts of the scenarios on the Austrian transportation system are estimated. The simulations show that, without suitable transport policy measures, automated mobility will lead to a significant increase in the volume of individual traffic and to modal shift effects with lower traffic volumes for public transport, walking and cycling. In addition, without a link between AVs and post-fossil propulsion systems, increases in pollutant emissions can also be expected. In contrast, the simulation results of an increased use of AVs in public transport show positive effects for the support of a more sustainable mobility. Hence, transport policy measures accompanying the introduction and development of automated vehicles will be needed in the future to reach a sustainable development.

1. Introduction

The increasing digitalization and automation will lead to a significant change in the transport system and mobility. This is especially true for highly automated driving (level 4 high automation), i.e., vehicles that perform all aspects of the dynamic driving task only in specific areas and under specific conditions and, in particular, fully automated driving (level 5 full automation), i.e., vehicles that perform the dynamic driving task under all roadway and environmental conditions [1]. However, it is still completely unclear in what form and to what extent this will happen. Numerous drivers and developments, such as climate change, technological and demographic developments or urbanization, are working in parallel, but are also interpenetrating and thus increasing complexity. At the same time, however, companies, public administrations and politicians need as concrete a framework as possible on how to use increasingly automated services for the mobility of people and goods. This framework for action is particularly important if automated vehicles (AVs) should support the goals of sustainable spatial and transport development.
In this regard, scenarios as representations of possible futures, including their development paths [2], could help to better imagine possible futures. Scenarios are classified as the central and most widespread method of future research [3]. With the presentation of developments that are thought from the present into the future (forecasting), complex future situations are described as ideal types which, however, do not necessarily have to occur in this form [4]. Scenarios are therefore not prognoses, i.e., they do not describe a certain future, but represent coherent and plausible visions of the future or alternative possibilities (“this is how it could be”). It is largely uncertain whether and which of these possibilities will certainly occur. In the future, therefore, elements from all developed scenarios (Section 4) will unite to varying degrees. New developments, trends and innovations that are not yet foreseeable may also be added [3].
This paper presents (a) scenarios for personal mobility in Austria that were developed using a systematically designed scenario technique, considering the possibilities of AVs discussed in the scientific literature, as well as (b) their impacts on multimodal passenger transport demand using system dynamics modeling and simulation techniques. Thus, it explores the question of how the future of personal mobility with AVs in Austria can be envisioned and what impacts on the transport system can be expected by considering several possible developments of relevant influencing factors. In this regard, the paper explicitly focuses on passenger transport. The freight transport and related implications of AVs in this regard (e.g., [5,6])—although they might also have impacts on passenger transport—are outside the scope of this paper.
The paper is structured as follows: Section 2 presents a literature review on this topic and stresses the particular contribution of this study with regard to previous research. Section 3 describes the methodology used for the development of the scenarios and the modeling of their impacts on the transportation system. In Section 4, the three developed scenarios for automated mobility for Austria are presented. Section 5 presents the impacts of the scenarios on the Austrian transportation system. Section 6 provides a conclusion, discussion, policy implications and limitations of the study.

2. Literature Review

AVs and their possible impacts on the future transport system are subject to a significant amount of research lately. Several studies have already been carried out, addressing the impacts of AVs on traffic flow (e.g., [7,8]), travel behavior and land use (e.g., [9,10]), safety (e.g., [11]) or wider societal or environmental implications (e.g., [12]). As AVs are not yet available to the public at large and gathering empirical data for further analysis is not possible on a large scale, most studies applied various models and simulations to analyze these impacts [9]. In addition, lately, some studies based on empirical data from on-road trials and real-world operations of AVs were also published.
Milakis et al. [12] conducted a broad review of the several implications AVs might have and argue that AVs affect several areas sequentially, i.e., first: travel cost, road capacity and travel choices; second: vehicle ownership and sharing, location choices and land use and transport infrastructure; third: energy consumption, safety, social equity, economy and public health. However, they also indicate that these impacts involve multiple complex dynamic interactions and are dependent on several assumptions on the implementation of AVs, e.g., market penetration rates or the availability of AVs as private or shared vehicles and other developments, and that these are also associated with urban and transport policies. Harb et al. [10], Azmat et al. [13] and Wintersberger et al. [14] indicate that, in this regard, the acceptance and adoption of automated vehicles from the public is also important. Safety impacts of AVs, of course, also play a role here and the first studies based on empirical data from on-road trials and real-world operation of AVs show promising benefits of AVs on safety; however, also problems in the interaction with conventional vehicles (e.g., involvement in rear-end crashes caused by conventional vehicles) [15].
With regard to the possible impacts of AVs on the national transport system, only a few studies have been conducted so far, mainly based on the application of macroscopic travel demand models or land-use transportation interaction models. These studies mostly assumed specific scenarios on the transport supply with AVs (private AVs or shared AVs) and applied different assumptions for AVs (e.g., regarding the penetration rate with AVs or concerning reductions of the value of time (VOT) and increases of road capacity) ex-ante, without a broader consideration of scenario development with stakeholders. For Germany and the USA, Kröger et al. [16] used an aspatial travel demand model and assumed different market shares for private AVs and a decrease of the VOT by 25%. They indicate an increase in vehicle kilometers traveled of up to 8.6%, an increase in the model share of cars by up to 3.8 percentage points and a decrease in the public transport share by up to 0.9 percentage points. Gelauff et al. [17] used a land-use transportation interaction model to analyze the impacts of AVs in the Netherlands. They assumed (1) a reduction of the value of time for AVs by 20% and a reduction of travel time by AVs by 20% compared to the private car, as well as (2) a reduction of the out-of-vehicle time for automated public transport by 100%. For the former, an increase in the modal share of cars and private AVs is reported while, for the latter, an increase in the public transit share is reported.
In the last years, scenario studies on AVs were also carried out that tried to envision different futures with AVs and incorporate other current and future development trends [18] that are regarded as the main factors for the different implementation of AVs, as well as relevant for the future transport system. In these studies, scenarios of AVs were not assumed ex-ante, but were part of a broader scenario process in which other factors relevant for the development of AVs in the transport system were also tried to be accounted for (see Table A1 in Appendix A for an overview). However, within these scenario studies, impacts of the developed scenarios on the national transportation system were not analyzed at all, only carried out qualitatively or only assessed and discussed by experts.
Tillema et al. [19], for example, presented four scenarios with AVs based on variations of the two key factors, automation (level 3, 4/level 5) and sharing (low/high): (1) multimodal and shared automation, (2) mobility as a service: any time, any place, (3) letting go on highways and (4) fully automated private luxury. Impacts of the scenarios were only assessed qualitatively with increases in the volume of car traffic and decreases in the public transport share, especially in scenario 4, and increases in the public transport share and no changes in the volume of car traffic in scenario 1.
However, none of the scenario studies on AVs so far used a systematic, formalized scenario technique, which usually includes (a) the identification, variation and combination of key influencing factors by determining influencing factors, (b) a consistency analysis in order to arrive at meaningful combinations and (c) setting up a scenario funnel to generate various scenarios in it [3]. Instead, the scenarios developed in former studies were mostly based on the variations of only two key factors and the scenario studies so far did not account for the various influencing factors that affect the development of AVs and their impacts on the transportation systems. On the other hand, studies on the impacts of AVs on the national transport system that are existent only assume different scenarios ex-ante, but the scenarios were not part of a broader scenarios process, also lacking the involvement of experts and stakeholders to develop the different scenarios. However, these studies showed that the impacts of AVs on the transport system involve multiple complex dynamic interactions that need to be accounted for.
This paper, therefore, presents the first scenarios on future mobility with AVs using a systematically designed scenario technique and estimates their impacts on the national transportation system of Austria using system dynamics modeling techniques, a method designed to deal with the complex dynamic interactions, i.e., cause–effect chains and feedback loops, that characterize the relationship between AV take-up, travel demand and environmental effects.

3. Methodology

3.1. Development of the Scenarios

For the development of the scenarios, the systematically formalized scenario technique, an established, widespread method of strategic planning in the field of mobility and transport [3,20,21], was used. In contrast to earlier scenario studies on AVs, which were mostly based on variations of two key factors and lacked engagement of stakeholders and experts in the scenario process, this method has the advantage of including different influencing factors more comprehensively, as well as incorporating views of stakeholders and experts in the development of the scenarios. Table 1 gives an overview of the various steps of the scenario development. This included scientific research and an analysis on influencing factors, as well as the use of participative elements in the development and discussion of the scenarios together with external Austrian experts and stakeholders. A focus within the scenario development was also on the visual design of the scenarios, which is regarded as essential in order to make the scenarios more “alive”, more comprehensible and, therefore, more communicable.

3.1.1. Influencing Factors

The future development of automated driving is embedded in numerous overarching trends and drivers, as well as other technological and social transformation processes which affect the future development of the transport system in different ways. At the beginning of the methodically controlled scenario process, different trends and influencing factors were identified for the future transportation system with automated vehicles and key factors in existing scenario studies for automated driving. Table A1 in the Appendix A gives an overview of the key factors in existing scenarios studies on automated driving.

3.1.2. Key Factors

Considering the results of the literature research, an intensive dialogue with experts and stakeholders (e.g., workshops, reflections), interlinked with several feedback loops, resulted in the following influencing factors that were used as essential key factors for the description of the multiple visions of the future, i.e., scenarios. These key factors are considered, on the one hand, to be particularly effective but, on the other hand, to be largely “insecure”: (1) mobility and transport policy, (2) AV technology/artificial intelligence, (3) mobility as a service (MaaS), (4) shared mobility, (5) mobility attitudes and (6) propulsion technologies.
Within the workshops on relevant influencing factors, stakeholder and experts from academia, the industry, public transport providers and national and local government bodies from different parts of Austria (e.g., Vienna, Styria) took part.

3.1.3. Projections

The projections for each of the six key factors were developed based on extensive literature research on the most relevant characteristics of the key factors and possible variations of these characteristics. The projections are intended to capture the main possibilities for the future development of a factor, but not the most extreme ones (possible and plausible projections). For each key factor, two to four projections were developed. A larger number of projections was explicitly excluded in order to avoid excessive complexity and poor comprehensibility of the projections. As an example, Table A2 in Appendix B gives an overview of the projections developed for the key factor mobility as a service.

3.1.4. Raw Scenarios and Reflection of Raw Scenarios

To build the raw scenarios, at first, a consistency analysis of the developed projections was undertaken to assess the relationship between the projections of each of the key factors. This was done against the background of the question of which projections of a key factor are in conflict or consistent with which projections of the other key factor. As an example, Figure A1 in Appendix C shows the assessment of the consistency between the projection “shared skepticism” of the key factor mobility attitudes and the projection “no implementation of MaaS” of the key factor mobility as a service.
Since a large number of combinations are possible, depending on the number of key factors and their projections, the scenario software, ScenarioWizard [22], was used to develop consistent raw scenarios. With this software, the impact balances (sum of consistency values) can be determined on the basis of the consistencies determined within the consistency analysis. Using the software, the three scenarios with the highest impact balances and, therefore, the “most consistent” scenarios, were selected. In addition, however, it was also considered that the scenarios cover a certain breadth, i.e., the scenarios should also have as many different projections as possible to better depict the scope of possibilities.
For the finalization of the scenarios, the external experts and stakeholders that were involved in the workshop on the influencing and key factors (see Section 3.1.2) were again involved to reflect on the developed raw scenarios. This was done using the online tool, Padlet [23]. The comments of the experts and stakeholders were then incorporated into the three raw scenarios to finalize the scenarios.

3.2. Modeling the Impacts of the Scenarios on the Transportation System

3.2.1. Approach for Modeling Transportation Impacts of the Scenarios

Effects of the different scenarios were simulated using a modified version of the strategic, dynamic, integrated land-use and transport model, MARS (Metropolitan Activity Relocation Simulator). MARS is implemented in VENSIM®, a system dynamics software environment, and consists of a transport model and a land-use model, as well as a set of sub-modules, and deals with the multitude of complex cause–effect chains and feedback loops that characterize the relationship between AV take-up, travel demand and environmental effects [24].
The basis was a calibrated national version of MARS, which was developed for the client Environment Agency Austria [24]. The model covers the entire federal territory at the administrative district level, i.e., 120 model zones. For the analysis, zones can be clustered in five different region types: (1) Vienna, (2) urban regions, (3) suburban regions, (4) rural regions with good PT supply and (5) rural regions with poor PT supply [25]. In this model version, housing and business location choice models are substituted by external scenarios for the spatio-temporal development of population and jobs. These scenarios are based on the ÖROK regional forecasts for population, labor and household characteristics [26,27,28]. The model is bi-annually utilized for the estimation of demand-side effects of passenger transport policies in projects led by the Environment Agency Austria [29,30].
MARS iteratively simulates the development of total travel demand, destination and mode choice of the population of a case study area between a starting year and a predefined time horizon. MARS is policy sensitive. Whenever policies or scenarios have an effect on travel time or costs components, this affects travel demand, destination and mode choice. The development of passenger and vehicle kilometers is a key output of the simulations. The Austrian power plant mix and emission factors from the Austrian Federal Environment Agency are used to calculate the development of greenhouse gas emissions [31,32].
A detailed description of the basic principles and mathematical relationships of the MARS model can be found in [33,34,35].

3.2.2. Adaptation of MARS and Implementation of Scenarios

Different adaptations of the base model were necessary to simulate the impacts of the scenarios defined in Section 3. In a first step, the potential effects of automated driving on travel times and cost components were analyzed qualitatively [24]. The attractiveness of using a certain mode of transport (walking, cycling, individual motorized transport or public transport) depends on the three elements: (a) availability, (b) evaluated (weighted) travel times and (c) evaluated (weighted) costs. Automated driving changes the characteristics of these elements via various cause–effect chains and, ultimately, influences the individual choice of means of transport and their intensity of use.
In a second step, the cause–effect relationships identified as relevant were quantified and parametrized in the MARS model. The adaptations incorporate AV-related properties, such as road capacity changes caused by AVs, impacts of remote parking and changes in the valuation of in-vehicle time (see also [9,12,36,37]). By implementing and parameterizing these cause–effect chains, the transport effects of the respective scenarios can be simulated and quantified. In addition, for the assessment of transport-related impacts of the scenarios defined in Section 3, a range of different automated vehicle (AV) modes (private AV, sharing AV, ride sharing AV, AV in public transport) were implemented in the MARS model. Table 2 gives an overview of all implemented parameters for modeling the scenarios defined in Section 3. A detailed description of all changes implemented to accommodate automated driving in the model MARS can be found in [24,38].
To model the transport impacts of the different scenarios, assumptions on the described parameters were derived according to the respective scenario and are further described in Section 4.1.
Note that the MARS model is, by nature, a strategic, spatially relative, highly aggregated but dynamic model. This means that microscopic effects, such as the capacity increase due to lower vehicle following times, cannot be modelled internally. However, MARS can be used to simulate the secondary effects of automating the vehicle fleet. Secondary effects are effects that arise from changes in transport demand. These affect both mode choice and destination choice [43]. MARS does not internally model the acceptance and market development of automated vehicles. The development of the market shares of level 4 and 5 vehicles is a scenario variable from external sources. In MARS, market shares are converted to fleet shares using a stock-flow model. Primary effects, i.e., effects arising from the efficiency gains of automated vehicles, are also externally defined scenario variables. However, efficiency gains may, again, cause changes in demand via changes in operating costs.

4. Scenarios of Automated Mobility in Austria

In the course of the scenario development, three scenarios for automated mobility for Austria for the year 2030 were developed: (1) market-driven AV euphoria, (2) policy-driven AV governance and (3) individualized mobility and slow AV development. Where Section 3.1 describes each scenario in detail, Section 3.2 gives a comparative overview of the three scenarios.

4.1. Scenarios

Table 3 gives a general verbal overview of the three different developed scenarios. Table A3 in Appendix D gives a comparative overview of the three developed scenarios with regard to their different characteristics of the six key factors.

5. Impacts of the Scenarios on the Austrian Transportation System

5.1. Implementation of Scenarios in MARS Model

For the implementation of the three developed scenarios, different input assumptions for the parameters mentioned in Section 3.2.2 were derived for each of the scenarios based on their characteristics (Table 4). For example, regarding the market share of level 4 and 5 AVs, a much faster market penetration of level 4 and 5 AVs until the year 2050 was assumed for scenario 1 (market-driven AV euphoria) and 2 (policy-driven AV governance) in comparison to scenario 3 (individualized mobility and slow AV development). For the business model of AVs, for scenario 1, which is characterized by a spread of car sharing and leasing, car sharing was assumed as the predominant business model of AVs, whereas, for scenario 2, which is characterized by an extensive spread of all forms of sharing, ride sharing was assumed as the predominant business model of AVs. For scenario 3, characterized by no spread of sharing, predominant private AVs were assumed as, in this scenario—in contrast to scenarios 1 and 2—shared mobility has only barely caught on in Austria.
Moreover, to have a better comparison, a business-as-usual scenario (BAU scenario) was modelled. The BAU scenario represents the expected socio-demographic, economic and transport supply development in Austria until 2050 with no market take-up of highly and fully automated vehicles.
For all scenarios, only the assumptions on the parameters in Table 4 were implemented and varied. Underlying growth rates for population, assumptions regarding the spatial distribution (urban versus rural), implementation of national official forecasts for the individual exogenous input variables, information on major transport infrastructure under construction and assumptions regarding future developments of these are the same for all the scenarios [44].

5.2. Impacts of Scenarios

Table 5 provides an overview of the results of the quantitative modeling of the three scenarios and the Business as Usual scenario. There, the values of the indicator shares of the main modes of transport in trips (modal share), passenger kilometers by mode of transport, vehicle kilometers, number of trips by mode of transport and CO2 emissions are presented in each case in the years 2030 and 2050, as well as the base year, 2015. The modes of public transport and passenger cars include both non-automated and automated vehicles. The results of the modeling of the scenarios are described in detail in the following sections.

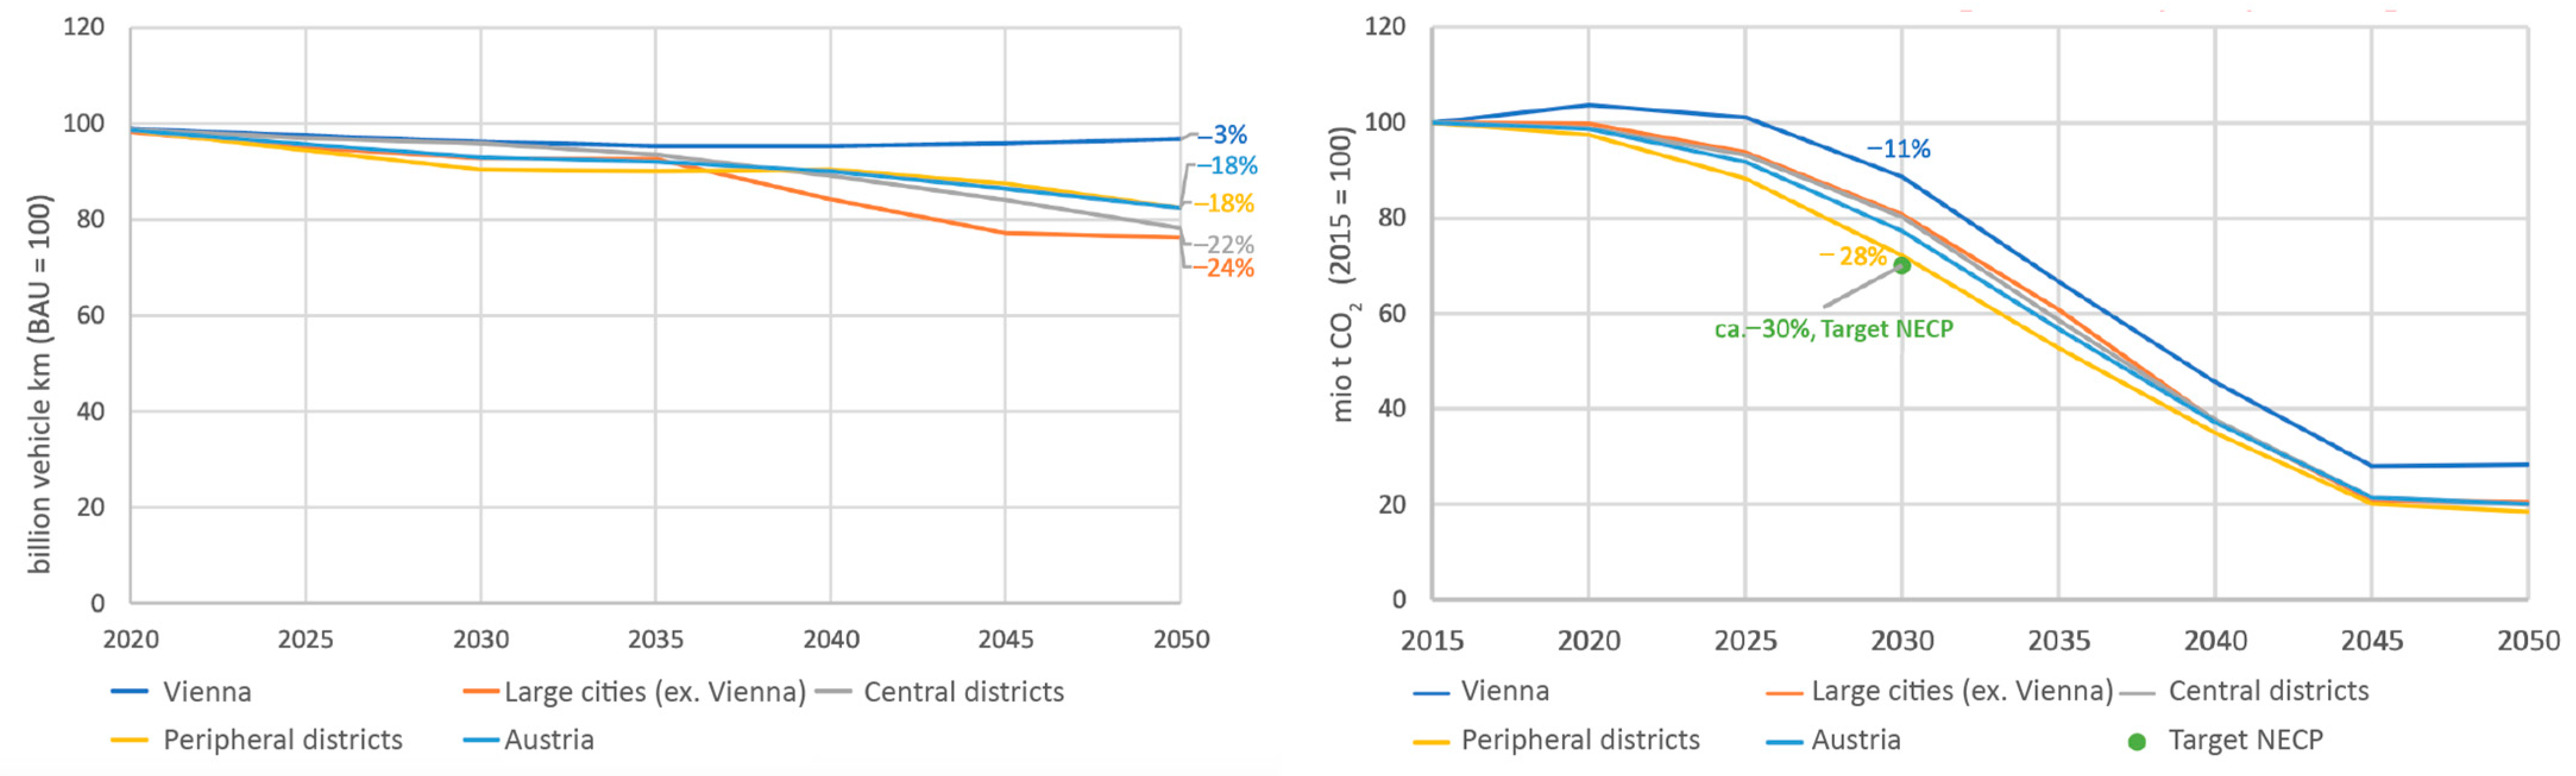
5.2.1. Scenario 1: Market-Driven AV Euphoria

In scenario 1 (market-driven AV euphoria), Austria-wide passenger car kilometers traveled decline slightly over the entire period under consideration. In 2050, it is around seven percent below that of the Business as Usual scenario. There are significant regional differences. In Vienna, car kilometers in 2050 are around 16 percent higher than in the Business as Usual scenario. In the central districts category, on the other hand, car kilometers are around 14 percent lower than in the Business as Usual scenario. The stepwise changes caused by the introduction of automated services on the last mile of public transport are clearly visible in the development of car kilometers in the region of large cities (excluding Vienna) (Figure 1, left).
In the Business as Usual scenario, the share of journeys made by private motorized transport increases slightly and continuously. In 2050, about two-thirds of all trips will be made by private motorized transport. In contrast, the share of journeys made on foot, by bicycle or by public transport continuously decreases slightly. In scenario 1 (market-driven AV euphoria), the share of motorized individual transport increases more strongly. In 2050, the share of private motorized transport is almost three percentage points higher than in the Business as Usual scenario. The share of public transport also increases relatively and is almost two percentage points higher in 2050 than in the Business as Usual scenario. The share of non-motorized trips, on the other hand, decreases in relative terms by almost three percentage points for walking and by almost two percentage points for cycling (Table 5).
In scenario 1 (market-driven AV euphoria), Austria-wide greenhouse gas emissions from passenger transport fall to around 40 percent of the 2015 level by 2050. The main reason for this is the electrification of passenger car propulsion. In 2030, however, the target of the National Energy and Climate Plan (NECP) [45] is clearly missed at minus eleven percent. In 2030, the regional bandwidth ranges from plus two percent in Vienna to minus 15 percent in the peripheral districts (Figure 1, right).

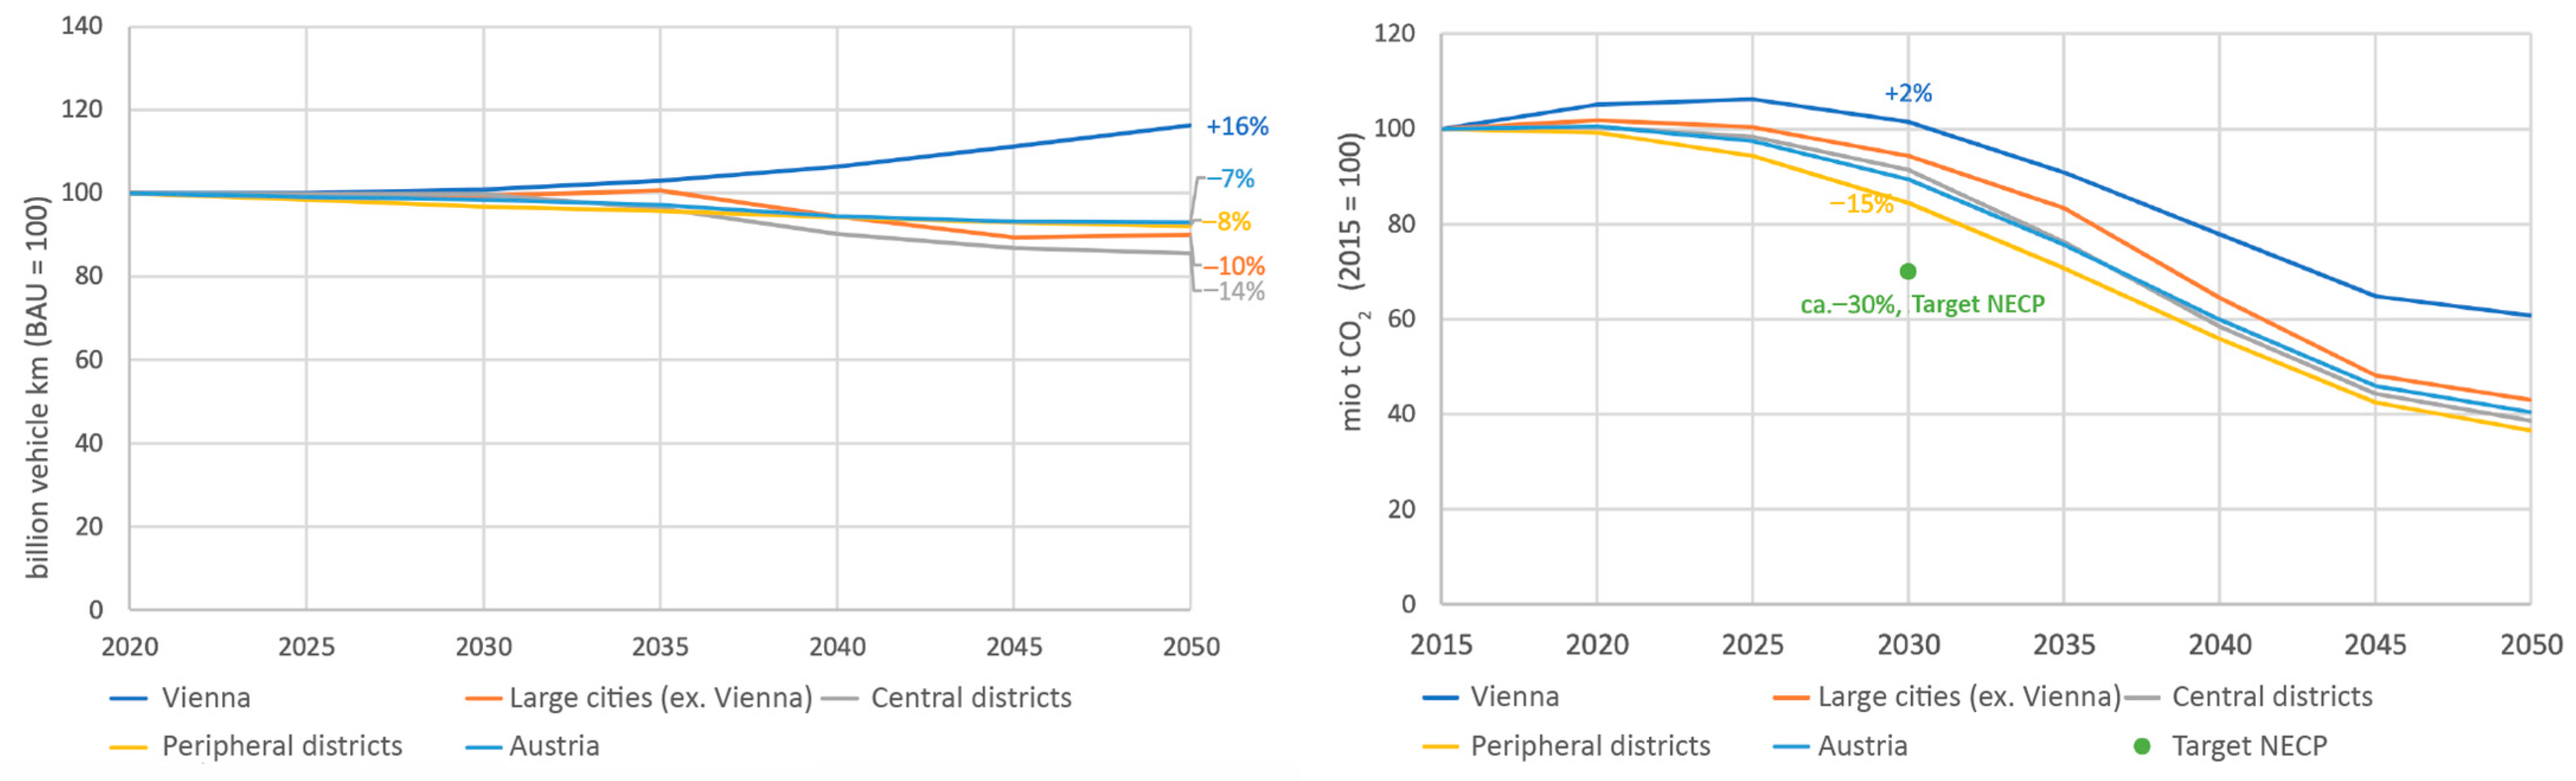
5.2.2. Scenario 2: Policy-Driven AV Governance

In scenario 2 (policy-driven AV governance), Austria-wide passenger car kilometers decline rather significantly over the entire simulation period. In 2050, it is about 18 percent below that of the Business as Usual scenario. There are significant regional differences. In Vienna, car kilometers in 2050 are only about three percent lower than in the Business as Usual scenario. In the major cities (excluding Vienna), on the other hand, these are around 24 percent lower than in the Business as Usual scenario. The stepwise change caused by the introduction of automated services on the last mile of public transport is clearly visible in the development of car traffic in the region of large cities (excluding Vienna) (Figure 2, left).
In scenario 2 (policy-driven AV governance), the share of motorized individual transport increases less strongly than in the BAU scenario. In 2050, the share of private motorized transport is slightly less than two percentage points below that of the Business as Usual scenario. The share of public transport increases relatively strongly and is slightly more than five percentage points higher in 2050 than in the Business as Usual scenario. The share of non-motorized trips decreases by almost two percentage points for both walking and cycling (Table 5).
In scenario 2 (policy-driven AV governance), Austria-wide greenhouse gas emissions from passenger transport fall to around 20 percent of the 2015 level by 2050. This is due to the complete electrification of passenger car propulsion in 2050. In 2030, the National Energy and Climate Plan target of minus 23 percent is not quite achieved. In 2030, the regional bandwidth ranges from minus eleven percent in Vienna to minus 28 percent in the peripheral districts (Figure 2, right).

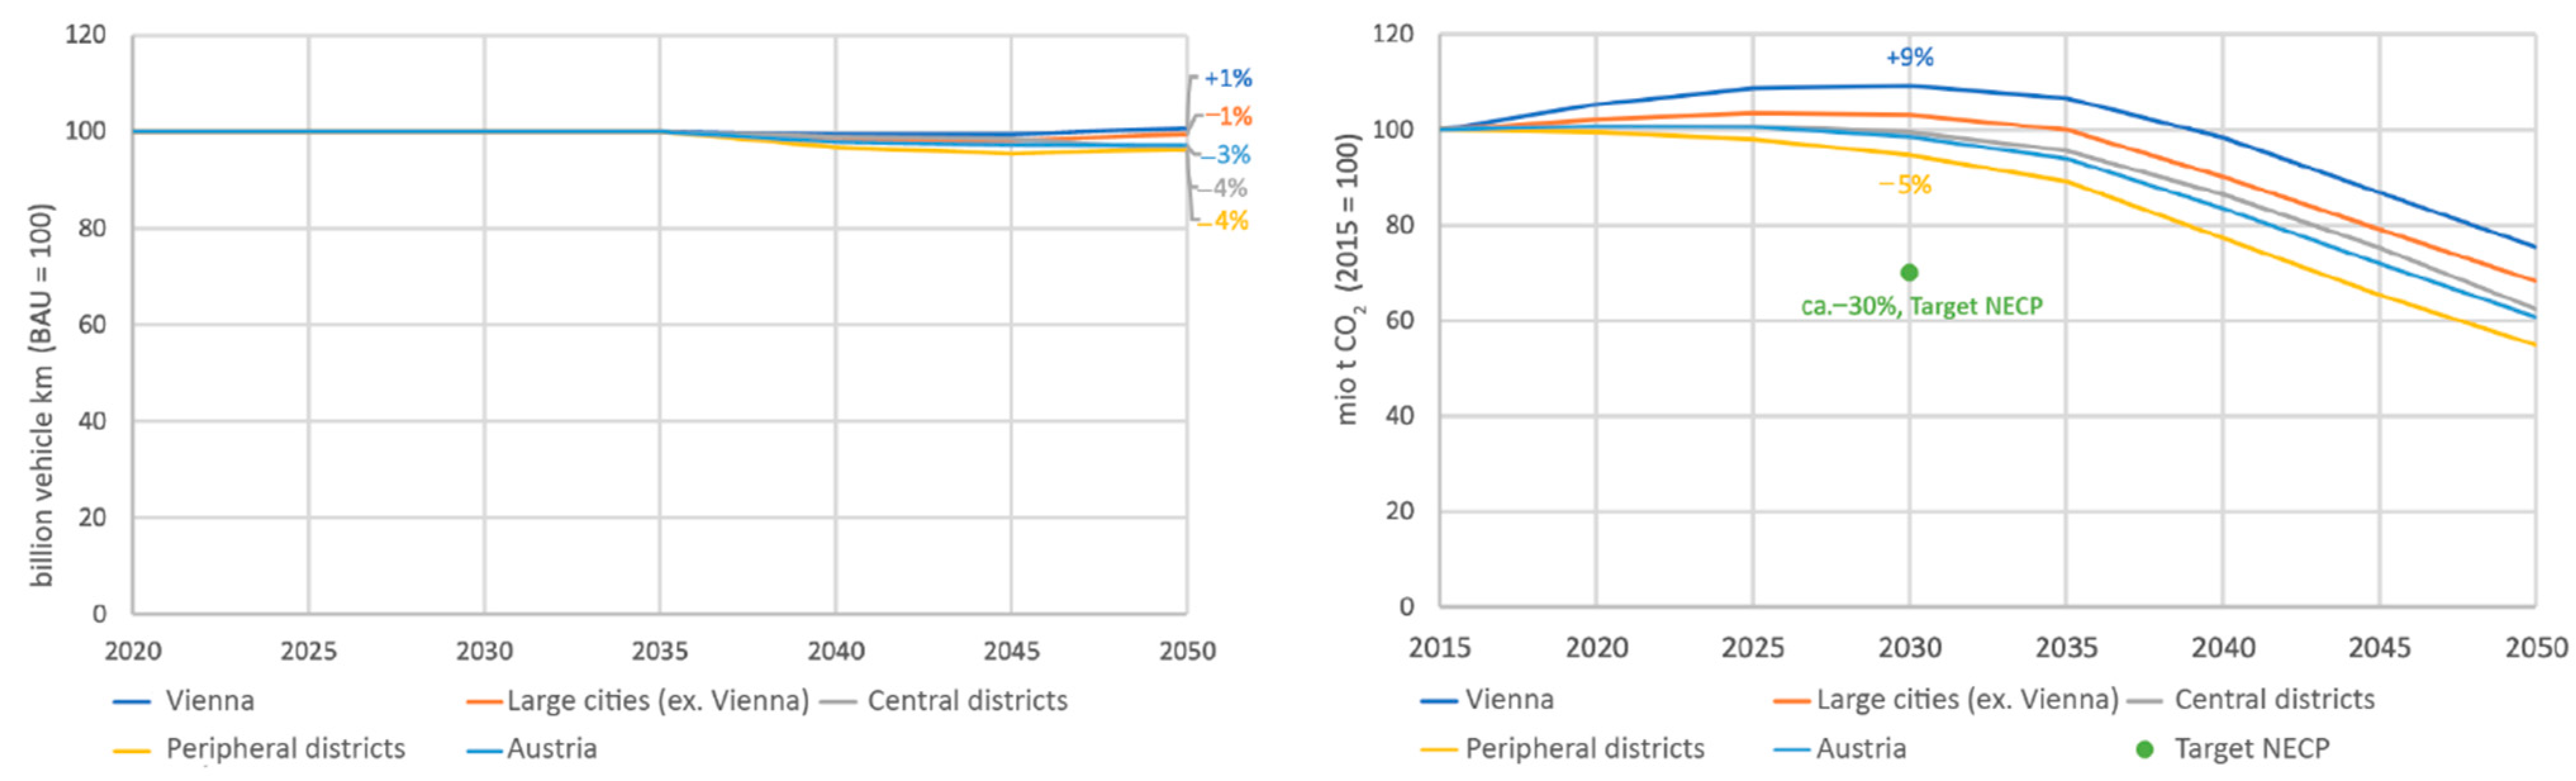
5.2.3. Scenario 3: Individualized Mobility and Slow AV Development

In Scenario 3 (individualized mobility and slow AV development), Austria-wide car kilometers decrease slightly over the entire period under consideration. In 2050, they are about three percent below that of the scenario Business as Usual. There are slight regional differences. In Vienna, car kilometers in 2050 are about one percent higher than in the Business as Usual scenario. In the central and peripheral districts, on the other hand, these are around four percent below that of the Business as Usual scenario (Figure 3, left).
In scenario 3 (individualized mobility and slow AV development), the share of motorized individual transport increases somewhat more strongly than in the Business as Usual scenario. In 2050, the share of motorized individual transport is about one percentage point higher than in the Business as Usual scenario. The share of public transport also increases relatively and is almost two percentage points higher in 2050 than in the Business as Usual scenario. The share of non-motorized trips, on the other hand, decreases in relative terms by just under two percentage points in pedestrian traffic and by about one percentage point in bicycle traffic (Table 5).
In scenario 3 (individualized mobility and slow AV development), Austria-wide greenhouse gas emissions from passenger transport fall to around 60 percent of the 2015 level by 2050, with the electrification of passenger car propulsion being the main factor responsible. With a reduction of minus one percent, the National Energy and Climate Plan target will be far from achieved. In 2030, the regional bandwidth ranges from plus nine percent in Vienna to minus five percent in the peripheral districts (Figure 3, right).

6. Discussion and Conclusions

Using the systematically formalized scenario technique, three different scenarios of automated mobility for Austria were developed and their impacts on the Austrian transportation system were estimated using system dynamics modeling techniques, i.e., the model MARS. These scenarios are representations of possible futures with automated vehicles in Austria, including their development paths, which vary depending on the framework conditions, i.e., developments of the key influencing factors identified in discussions with experts and stakeholders. With these scenarios, the future situation with AVs is described as ideal types which, however, do not necessarily occur in this form: each of the three scenarios does not describe a certain future but represents a coherent and plausible vision of the future or alternative possibility regarding automated mobility in Austria.
The three scenarios developed expand the social and political discourse on automated mobility, which is currently characterized by a lack of experience and visibility as an established transport service. It is not a single image of the future that exclusively suggests a future transport with private AVs (“narrowed view”), but multiple images of the future with many modes and forms of use such as shared mobility, alternative drive systems, new organizational structures, user preferences, etc., that stand for an uncertain future of automated mobility. The focus lies on a transformation process in the sense of a sustainable, emission-free mobility. For this process, appropriate development paths are shown using the scenarios, which have to be followed.
The simulations show that automated mobility without suitable transport policy measures, such as mobility pricing and parking space management, but also measures to increase sharing of vehicles, i.e., vehicle occupancy rates, will lead to an increase in the volume of individual traffic. In comparison to the current situation, an increase in vehicle kilometers traveled is observable in all scenarios, with highest increases for scenario 3 with predominant private AVs, whereas, for scenario 2 with ride sharing as the predominant business model of AVs, increases are much lower.
In addition, without accompanying measures, there will be modal shift effects with lower traffic volumes for public transport, walking and cycling, again, especially observable in scenarios 1 and 2. This is associated with a higher land consumption and a greater separating effect, etc. Furthermore, looking at the results on the CO2 emissions of scenario 2, which is characterized by a fast market penetration of electric vehicles, and scenario 3, in which electric vehicles play a somewhat less important role, without a link between automated vehicles and post-fossil propulsion systems, increases in pollutant emissions can also be expected. In contrast, the simulation results of an increased use of AVs in public transport—especially observable for scenario 2 with a relatively significant decline of Austria-wide passenger car kilometers—show positive effects for the support of a more sustainable mobility.
Moreover, the scenarios make it clear that the technological development of automated transport will progress at different speeds (and also more slowly than expected by many) and that a long transition phase in the mixed traffic of automated and non-automated vehicles is therefore highly probable: while in scenario 1 “Market-driven AV euphoria”, technological development proceeds very rapidly, in scenario 2 “Policy-driven AV governance” and especially in scenario 3 “Individualized mobility and slow AV development”, a long phase of transition to high and full automation becomes apparent. This long transition phase in the mixed traffic of automated and non-automated vehicles entails many uncertainties and risks, e.g., road safety, social inequalities due to changes in location (see, e.g., [46]) and high costs for transport infrastructure, which should be considered at an early stage in order to secure political room for maneuver for infrastructure financing, quality of life, needs of different user groups, etc., and to take advantage of the automated transport without obtaining negative side effects.

6.1. Policy Implications

Overall, the scenarios of automated mobility in Austria and their simulated impacts show that positive effects from automated mobility with regard to existing national climate and environmental targets (decarbonization agenda) in the Austrian transport system [45] can only be expected if consistent transport policy governance strategies are adopted to largely avoid undesirable new effects.
The choice of means of transport by the population has to be influenced in the sense of a clear prioritization in such a way that (1) the active mobility of walking and cycling in the sense of mobility sufficiency is the first priority, (2) an attractive public transport system (suburban railway, subway, express buses) optimized by AV and strongly connected with other modes represents an essential backbone of the transport supply, (3) the potentials of AV ride sharing with the increased occupancy rates should be used and (4) only then, with lower significance, AV car sharing should be forced. On the other hand, the increase in traffic expected from private AVs is so great that its priority should be the lowest. In addition, AV-specific controlling measures are important, including all mobility pricing measures, such as weight-based taxation of AVs with conventional drives (as a link between AVs and post-fossil propulsion systems is crucial), differentiated road taxes depending on time and occupancy rate, etc., and charges on empty rides of AVs.
Furthermore, possible measures for the mixed traffic phase are, for example, speed reductions to improve traffic safety or the control of settlement development via land policy (e.g., land-use planning).

6.2. Limitations

Although, within the study, the scenarios developed show possible futures with AVs in Austria and the associated impacts on the transport system in Austria have also been assessed, there are several limitations within the study that have to be taken into account.
The scenarios developed within the study particularly focus on personal mobility. Implications of AVs on freight and logistics, which would also have an impact on developments in personal mobility with AVs were not considered.
With regard to the simulation using the MARS model, it is important to take into account that the model does not include an internal modeling of the acceptance and market development of AVs. Instead, the development of the market shares of level 4 and 5 vehicles is an external scenario variable and was based on [39], and market shares were converted into fleet shares using a stock-flow model.
Furthermore, the acceptance of car sharing vehicles is currently not represented internally in the model but is taken into account via scenario assumptions. In other words, the model does not provide any conclusions as to which policies are necessary for the transformation from private cars to shared cars to take place, but only which demand effects can be expected in the event of the transformation.
In addition, the effect of ride sharing services is represented in a simplified way by an increase in the occupancy rate. This means that no direct statements can be made about how many vehicles would be necessary for an operation and how this would have to be organized. The same applies to the automation of the last mile in public transport. Here, too, no direct statements can be made about the concrete design of the operation.
Lastly, with regard to the market shares of AVs, but also with regard to other relevant parameters used to simulate the different developed scenarios within the MARS model, several input assumptions—although based on existing literature—have been made (e.g., with regard to increases in road capacity) and varied between the scenarios that clearly have an impact on the results.

Author Contributions

Conceptualization, A.S. (Aggelos Soteropoulos) and P.P.; methodology, A.S. (Aggelos Soteropoulos), P.P., M.B., G.E., J.S.D. and A.S. (Andrea Stickler); formal analysis, P.P. and G.E.; writing—original draft preparation, A.S. (Aggelos Soteropoulos) and P.P.; writing—review and editing, A.S. (Aggelos Soteropoulos) and P.P.; visualization, A.S. (Aggelos Soteropoulos) and P.P.; supervision, P.P. All authors have read and agreed to the published version of the manuscript.

Funding

This paper was written within the framework of the research project “SAFIP” (number: 865166), funded by the Austrian Federal Ministry of Transport, Infrastructure and Technology in the framework of the Mobility of the Future program.

Institutional Review Board Statement

Not applicable.

Informed Consent Statement

Not applicable.

Data Availability Statement

The MARS model used for this study can be found under https://www.fvv.tuwien.ac.at/forschung/mars-metropolitan-activity-relocation-simulator/downloads/ (23 October 2021). Restrictions apply to the availability of data for the simulation which were obtained by and are available from the Institute for Transport Planning and Traffic Engineering of the Technical University of Vienna (https://www.fvv.tuwien.ac.at (23 October 2021)) with their permission.

Acknowledgments

The authors want to thank all partners of the research project “SAFIP—System Scenarios for Automated Driving in Personal Mobility”, including the Austrian Road Safety Board (KFV), the Wiener Lokalbahnen (WLB) and the Institute for Advanced Studies (IHS).

Conflicts of Interest

The authors declare no conflict of interest.

Appendix A. Overview of Key Factors of Scenarios Used in Former Studies

Table A1. Key factors of scenarios in former studies.
Authors, CountryKey Factors of Scenarios
Beiker, 2015 [47]Automation (partial/conditional/high/full), area boundaries (none/regional/local), use (individual/private/public), ownership (individual/private/central/commercial).
Tillema et al., 2015 [19], Netherlands Degree of vehicle automation (level 3, 4 or 5). Extent of vehicle sharing (high or low).
Gertz & Dörnemann, 2016 [48], GermanyFramework conditions for autonomous services (promoting or inhibiting framework conditions), mobility behaviour of residents (collective or individual).
Milakis et al., 2017 [49], NetherlandsPolitical regulation with regard to automated driving (restrictive or supportive), technological development (high or low).
Perret et al., 2017 [50], SwitzerlandStoryline based on fulfilled requirements regarding legal, technological, infrastructural and societal aspects.
Mitteregger et al., 2020 [51]Political planning stance: market-driven, policy-driven, community-driven.

Appendix B. Example for the Developed Projections for the Key Factor Mobility as a Service

Table A2. Overview of developed projections for the key factor mobility as a service.
Projection 1Projection 2Projection 3
Dominance of local MaaS services of
private companies
(individual providers, weak interfaces to partner services and public transport)
Urban-regional public MaaS
(increased cooperation between providers, expansion of public platforms)
No implementation of MaaS

Appendix C. Example for the Consistency Analysis

Figure A1. Example for the consistency analysis: consistency between the projection “shared skepticism” of the key factor mobility attitudes and the projection “no implementation of MaaS” of the key factor mobility as a service.
Futuretransp 01 00041 g0a1

Appendix D. Comparative Overview of the Scenarios

Table A3. Overview of the different characteristics of the six key factors within the three developed scenarios.
Scenario 1: Market-Driven AV euphoria
Futuretransp 01 00041 i012
Scenario 2: Policy-Driven AV governance
Futuretransp 01 00041 i013
Scenario 3: Individualized
Mobility and Slow AV Development
Futuretransp 01 00041 i014
Mobility and transport policyStrong, active technology-driven AV policy
focus on competitiveness and economy
Active environmental protection-driven AV policy
focus on environmental sustainability and social inclusion
Strong, active technology-driven AV policy
focus on competitiveness and economy
Mobility as a service (MaaS)Dominance of local MaaS
services of private companies
individual providers, weak interfaces to partner services and public transport
Urban-regional public MaaS
increased cooperation between providers, expansion of public platforms
No implementation of MaaS
Shared mobilityCar sharing
spread of car sharing and leasing
Shared economy
extensive spread of all forms of sharing: car sharing, ride sharing, etc.
No sharing
no spread of sharing
Mobility attitudesEuphoria
extensive euphoria about AVs and sharing
Spatial ambivalence
positive attitudes towards public transport and sharing in cities, positive attitudes towards private cars at most in sparsely populated places (automated and non-automated)
Polarization of society
predominantly positive attitudes towards private cars (automated and non-automated), but low-income groups urged to use public transport
AV technology/artificial intelligenceDisruptive level 5
fully automated driving in (almost) all operational design domains, safety level worse than today
Fast level 4
highly automated driving in simple operational design domains, safety level better than today
Evolutionary level 3
conditional-automated driving in the simplest operational design domains, safety level somewhat lower than today
Propulsion technologiesHybrid on the road
high increase of hybrid drives/interim solutions
Electric mobility progress
significant increase of electric vehicle registrations
Optimization of combustion engines
status quo development for vehicles with alternative drives

References

  1. SAE International. Taxonomy and Definitions for Terms Related to Driving Automation Systems for On-Road Motor Vehicles–J3016. 2021. Available online: https://www.sae.org/standards/content/j3016_202104/ (accessed on 9 October 2021).
  2. Sieber, M.; Stoiber, T.; Haefeli, U.; Matti, D. Forschungspaket Verkehr der Zukunft (2060): Initialprojekt; Forschungsprojekt SVI: Bern, Switzerland, 2015. [Google Scholar]
  3. Ahrend, C.; Kollosche, I.; Steinmüller, K.; Schulz-Montag, B. E-Mobility 2025. Szenarien für die Region Berlin. Szenarioreport; Technische Universität Berlin: Berlin, Germany, 2011. [Google Scholar]
  4. Gausemeier, J.; Fink, A.; Schlake, O. Szenario-Management; Planen und Führen mit Szenarien: Munich, Germany, 1995. [Google Scholar]
  5. Flämig, H. Autonomous vehicles and autonomous driving in freight transport. In Autonomous Driving; Maurer, M., Gerdes, C.J., Lenz, B., Winner, H., Eds.; Springer: Berlin, Germany, 2016; pp. 365–385. [Google Scholar]
  6. Ghandriz, T.; Jacobson, B.; Laine, L.; Hellgren, J. Impact of automated driving systems on road freight transport and electrified propulsion of heavy vehicles. Transp. Res. Part C Emerg. Technol. 2020, 115, 102610. [Google Scholar] [CrossRef]
  7. Makridis, M.; Mattas, K.; Ciuffo, B.; Raposo, M.A.; Thiel, C. Assessing the impact of connected and automated vehicles. A freeway scenario. In Microsystems for Automotive Applications 2017; Springer: Cham, Switzerland, 2018; pp. 213–225. [Google Scholar]
  8. Mahmassani, H.S. Autonomous vehicles and connected vehicle systems: Flow and operations considerations. Transp. Sci. 2016, 50, 1140–1162. [Google Scholar] [CrossRef]
  9. Soteropoulos, A.; Berger, M.; Ciari, F. Impacts of automated vehicles on travel behaviour and land use: An international review of modelling studies. Transp. Rev. 2019, 39, 29–49. [Google Scholar] [CrossRef]
  10. Harb, M.; Stathopoulos, A.; Shiftan, Y.; Walker, J.L. What do we (Not) know about our future with automated vehicles? Transp. Res. Part C Emerg. Technol. 2021, 123, 102948. [Google Scholar] [CrossRef]
  11. Tafidis, P.; Farah, H.; Brijs, T.; Pirdavani, A. Safety implications of higher levels of automated vehicles: A scoping review. Transp. Rev. 2021, 1–23. [Google Scholar] [CrossRef]
  12. Milakis, D.; van Arem, B.; van Wee, B. Policy and society related implications of automated driving: A review of literature and directions for future research. J. Intell. Transp. Syst. 2017, 21, 324–348. [Google Scholar] [CrossRef]
  13. Azmat, M.; Schuhmayer, C.; Kummer, S. Innovation in mobility: Austrian expert’s perspective on the future of urban mobility with self-driving cars. In Innovation Arabia 9: Quality and Business Management Conference (Business Innovation-Imperative for knowledge Economy); HBMSU Publishing House: Dubai, United Arab Emirates, 2016; Volume 9, pp. 142–160. [Google Scholar]
  14. Wintersberger, S.; Azmat, M.; Kummer, S. Are We Ready to Ride Autonomous Vehicles? A Pilot Study on Austrian Consumers’ Perspective. Logistics 2019, 3, 20. [Google Scholar]
  15. Schwall, M.; Daniel, T.; Victor, T.; Favaro, F.; Hohnhold, H. Waymo public road safety performance data. arXiv Prepr. 2020, arXiv:2011.00038. [Google Scholar]
  16. Kröger, L.; Kuhnimhof, T.; Trommer, S. Does context matter? A comparative study modelling autonomous vehicle impact on travel behaviour for Germany and the USA. Transp. Res. Part A Policy Pract. 2019, 122, 146–161. [Google Scholar] [CrossRef]
  17. Gelauff, G.; Ossokina, I.; Teulings, C. Spatial and welfare effects of automated driving: Will cities grow, decline or both? Transp. Res. Part A Policy Pract. 2019, 121, 277–294. [Google Scholar] [CrossRef]
  18. Azmat, M.; Kummer, S.; Moura, L.T.; Gennaro, F.D.; Moser, R. Future outlook of highway operations with implementation of innovative technologies like AV, CV, IoT and Big Data. Logistics 2019, 3, 15. [Google Scholar] [CrossRef] [Green Version]
  19. Tillema, T.; Berveling, J.; Gelauff, G.; van der Waard, J.; Harms, L.; Derriks, H. Driver at the Wheel? Self-Driving Vehicles and the Traffic and Transport System of the Future; KiM. Netherlands Institute for Transport Policy Analysis: The Hague, The Netherlands, 2015. [Google Scholar]
  20. Ehrhart, C.E.; Müller, J.D.; Oppolzer, J. Delivering Tomorrow. Logistik 2050; Eine Szenariostudie. Deutsch Post AG: Bonn, Germany, 2012. [Google Scholar]
  21. Phleps, P.; Feige, I.; Zapp, K. Die Zukunft der Mobilität. Szenarien für Deutschland in 2035; Ifmo—Institut für Mobilitätsforschung: Berlin, Germany, 2015. [Google Scholar]
  22. ScenarioWizard. Available online: http://www.cross-impact.org/english/CIB_e_ScW.htm (accessed on 30 August 2021).
  23. Padlet. Available online: https://en.padlet.com/ (accessed on 1 February 2021).
  24. Emberger, G.; Pfaffenbichler, P. A quantitative analysis of potential impacts of automated vehicles in Austria using a dynamic integrated land use and transport interaction model. Transp. Policy 2020, 98, 57–67. [Google Scholar] [CrossRef]
  25. Müller, A.; Redl, C.; Haas, R.; Tuerk, A.; Liebmann, L.; Steininger, K.; Brezina, T.; Mayerthaler, A.; Kreuzer, D.; Steiner, A.; et al. Energy Investment Strategies and Long Term Emission Reduction Needs (EISERN); Technische Universität Wien Institut für Energiesysteme und Elektrische Antriebe: Vienna, Austria, 2012; Available online: https://www.fvv.tuwien.ac.at/fileadmin/mediapool-verkehrsplanung/News/EISERN/m%C3%BCller-2012_EISERN-Endbericht.pdf (accessed on 2 November 2021).
  26. Hanika, A. Kleinräumige Bevölkerungsprognose für Österreich 2010–2030 mit Ausblick bis 2050-Teil 1: Endbericht zur Bevölkerungsprognose. Österreichische Raumordnungskonferenz (ÖROK); Statistik Austria: Vienna, Austria, 2010. [Google Scholar]
  27. Hanika, A. Kleinräumige Bevölkerungsprognose für Österreich 2010–2030 mit Ausblick bis 2050-Teil 3: Endbericht zu den Modellrechnungen zur regionalen Haushaltsentwicklung. Österreichische Raumordnungskonferenz (ÖROK); Statistik Austria: Vienna, Austria, 2010. [Google Scholar]
  28. Kytir, J.; Biffl, G.; Wisbauer, A. Kleinräumige Bevölkerungsprognose für Österreich 2010–2030 mit Ausblick bis 2050-Teil 2 Endbericht zur Erwerbsprognose. Österreichische Raumordnungskonferenz (ÖROK); Statistik Austria: Vienna, Austria, 2010. [Google Scholar]
  29. Krutzler, T.; Zechmeister, A.; Stranner, G.; Wiesenberger, H.; Gallauner, T.; Gössl, M.; Heller, C.; Heinfellner, H.; Ibesich, N.; Lichtblau, G. Energie- und Treibhausgas-Szenarien im Hinblick auf 2030 und 2050; Umweltbundesamt: Vienna, Austria, 2017. [Google Scholar]
  30. Heinfellner, H.; Ibesich, N.; Lichtblau, G.; Svehla-Stix, S.; Vogel, J.; Wedler, M.; Winter, R. Sachstandsbericht Mobilität und mögliche Zielpfade zur Erreichung der Klimaziele 2050 mit dem Zwischenziel 2030; Endbericht. Umweltbundesamt: Vienna, Austria, 2019. [Google Scholar]
  31. Umweltbundesamt Emissionsfaktoren für Verkehrsmittel. Umweltsituation-Verkehr-Daten. 2018. Available online: http://www.umweltbundesamt.at/umweltsituation/verkehr/verkehrsdaten/emissionsfaktoren_verkehrsmittel/ (accessed on 1 September 2021).
  32. Beermann, M.; Lorenza, C.; Jungmeier, G. Transportdienstleistung von E-Fahrzeugen in Österreich Zielsetzung; Symposium Energieinnovation: Graz, Austria, 2012; Available online: https://www.tugraz.at/fileadmin/user_upload/Events/Eninnov2012/files/pr/PR_Beermann_2.pdf (accessed on 1 September 2021).
  33. Pfaffenbichler, P. The Strategic, Dynamic and Integrated Urban Land Use and Transport Model MARS (Metropolitan Activity Relocation Simulator)-Development, Testing and Application; Vienna University of Technology: Vienna, Austria, 2003. [Google Scholar]
  34. Pfaffenbichler, P.C.; Emberger, G.; Shepherd, S.P. A system dynamics approach to land use transport interaction modelling: The strategic model MARS and its application. Syst. Dynam. Rev. 2010, 26, 262–282. [Google Scholar] [CrossRef]
  35. Institute for Transport Planning and Traffic Engineering. MARS (Metropolitan Activity Relocation Simulator). Available online: https://www.fvv.tuwien.ac.at/forschung/mars-metropolitan-activity-relocation-simulator/overview/ (accessed on 1 September 2021).
  36. Bösch, P.M. Kapazitätsauswirkungen vollautonomer Fahrzeuge in der Schweiz. 26; PTV Traffic Seminar: Karlsruhe, Germany, 2016. [Google Scholar]
  37. Bösch, P.M.; Becker, F.; Becker, H.; Axhausen, K.W. Cost-based analysis of autonomous mobility services. Transp. Policy 2018, 64, 76–91. [Google Scholar] [CrossRef]
  38. Soteropoulos, A.; Stickler, A.; Sodl, V.; Berger, M.; Dangschat, J.; Pfaffenbichler, P.; Emberger, G.; Frankus, E.; Braun, R.; Schneider, F.; et al. SAFiP -Systemszenarien Automatisiertes Fahren in der Personenmobilität; Forschungsbericht: Vienna, Austria, 2019. [Google Scholar]
  39. McKinsey & Company. Automotive Revolution—Perspective towards 2030. How the Convergence of Disruptive Technology-Driven Trends Could Transform the Auto Industry. 2016. Available online: https://www.mckinsey.com/~/media/mckinsey/industries/automotive%20and%20assembly/our%20insights/disruptive%20trends%20that%20will%20transform%20the%20auto%20industry/auto%202030%20report%20jan%202016.pdf (accessed on 2 November 2021).
  40. Busch, F.; Krause, S.; Motamedidehkordi, N.; Hoffmann, S.; Vortisch, P.; Hartmann, M. Auswirkungen des teil- und hochautomatisierten Fahrens auf die Kapazität. Fernstraßeninfrastruktur; Verband der Automobilindustrie, Forschungsvereinigung Automobiltechnik: Berlin, Germany, 2017. [Google Scholar]
  41. Gruber, C.J.; Eisenberger, I.; Fellendorf, M.; Gruber, C.; Kohla, B.; Lachmayer, K.; Neuhold, R.; Röschel, G.; Sammer, G.; Sammer, G.; et al. Forschungsprojekt AUTO-NOM Analyse, Evaluierung und Anforderungen an innovative Anwendungen von autonomen Fahrzeugen aus verkehrspolitischer Sicht-Teil 1: Verkehrliche Auswirkungen und verkehrspolitische Aussagen; Mobilität der Zukunft: Graz, Austria, 2018; Available online: https://mobilitaetderzukunft.at/resources/pdf/projektberichte/AUTO-NOM_2017_Teil1_Verkehrliche_Auswirkungen_und_verkehrspolitische_Aussagen_1101.pdf (accessed on 2 November 2021).
  42. Wadud, Z.; MacKenzie, D.; Leiby, P. Help or hindrance? The travel, energy and carbon impacts of highly automated vehicles. Transport. Res. Pol. Pract. 2016, 86, 1–18. [Google Scholar] [CrossRef] [Green Version]
  43. Krail, M.; Hellekes, J.; Schneider, U.; Dütschke, E.; Schellert, M.; Rüdiger, D.; Steindl, A.; Luchmann, I.; Waßmuth, V.; Flämig, H.; et al. Energie- und Treibhausgaswirkungen des automatisierten und vernetzten Fahrens im Straßenverkehr; The National Academies of Sciences, Engineering, and Medicine: Karlsruhe, Germany, 2019; Available online: https://www.isi.fraunhofer.de/content/dam/isi/dokumente/ccn/2019/energie-treibhausgaswirkungen-vernetztes-fahren.pdf (accessed on 31 August 2021).
  44. Pfaffenbichler, P.; Emberger, G. SAFiP-Systemszenarien Automatisiertes Fahren in der Personenmobilität—Deliverable 3.1; Institute for Transport Planning and Traffic Engineering: Vienna, Austria, 2019. [Google Scholar]
  45. Bundesministerium für Nachhaltigkeit und Tourismus. #mission2030. Die österreichischen Klima- und Energiestrategie. Vienna, Austria. 2018. Available online: https://www.bundeskanzleramt.gv.at/dam/jcr:903d5cf5-c3ac-47b6-871c-c83eae34b273/20_18_beilagen_nb.pdf (accessed on 1 September 2021).
  46. Soteropoulos, A.; Mitteregger, M.; Berger, M.; Zwirchmayr, J. Automated Drivability: Toward an assessment of the spatial deployment of level 4 automated vehicles. Transp. Res. Part A 2020, 136, 64–84. [Google Scholar] [CrossRef]
  47. Beiker, S. Einführungsszenarien für höhergradig automatisierte Straßenfahrzeuge. In Autonomes Fahren; Maurer, M., Gerdes, C.J., Lenz, B., Winner, H., Eds.; Springer Vieweg: Berlin, Germany, 2015; pp. 197–217. [Google Scholar]
  48. Gertz, C.; Doörnemann, M. Wirkungen des autonomen/fahrerlosen Fahrens in der Stadt. Entwicklung von Szenarien und Ableitung der Wirkungsketten; Bremen, Germany, 2016; Available online: https://www.bauumwelt.bremen.de/sixcms/media.php/13/_Wirkungen_autonomen_fahrerlosen%20Fahrens_in_der_Stadt%20.pdf (accessed on 2 November 2021).
  49. Milakis, D.; Snelder, M.; van Arem, B.; van Wee, B. Homem de Almeida Correia, G. 2017. Development and transport im-plications of automated vehicles in the Netherlands: Scenarios for 2030 and 2050. Eur. J. Transp. Infrastruct. Res. 2017, 17, 63–85. [Google Scholar]
  50. Perret, F.; Bruns, F.; Raymann, L.; Hofmann, S.; Fischer, R.; Abegg, C.; de Haan, P.; Straumann, R.; Heuel, S.; Deublein, M.; et al. Einsatz automatisierter Fahrzeuge im Alltag—Denkbare Anwendungen und Effekte in der Schweiz. EBP; Basler Fonds: Zurich, Switzerland, 2017. [Google Scholar]
  51. Mitteregger, M.; Bruck, E.; Soteropoulos, A.; Stickler, A.; Berger, M.; Dangschat, J.S.; Scheuvens, R.; Banerjee, I. AVENUE21. Automatisierter und vernetzter Verkehr: Entwicklungen des urbanen Europa; Springer: Wiesbaden, Germany, 2020. [Google Scholar]
Figure 1. Development of billion vehicle kilometers (left) and mio t CO2 (right) in scenario 1 “market-driven AV euphoria” in comparison to the Business as Usual scenario (BAU) until 2050 for Austria and different regions.
Futuretransp 01 00041 g001
Figure 2. Development of billion vehicle kilometers (left) and mio t CO2 (right) in scenario 2 “policy-driven AV governance“ in comparison to the Business as Usual scenario (BAU) until 2050 for Austria and different regions.
Futuretransp 01 00041 g002
Figure 3. Development of billion vehicle kilometers (left) and mio t CO2 (right) in scenario 3 “Individualized mobility and slow AV development” in comparison to the Business as Usual scenario (BAU) until 2050 for Austria and different regions.
Futuretransp 01 00041 g003
Table 1. Overview of the various steps within the scenario process.
StepsDescriptionIntegration of External Experts and Stakeholders
Influencing factors
Futuretransp 01 00041 i001
  • Initial situation: big-picture (mega-)trends and influencing factors;
  • Investigation of key factors in existing scenario studies for automated driving;
  • Discussion of influencing factors and possible additions of factors within a scenario workshop;
Futuretransp 01 00041 i002Input of external experts and stakeholders
Key factors and cross-scenario factors
Futuretransp 01 00041 i003
  • Assessments of key factors and cross-scenario factors within a scenario workshop;
  • Feedback of the results from the literature (previous key factors) and final determination considering the coverage of a broad spectrum in the areas of society, mobility, politics and technology, as well as with a special focus on public transport;
Futuretransp 01 00041 i004Input of external experts and stakeholders
Projections
Futuretransp 01 00041 i005
  • Extensive literature research on the characteristics and specifications of the determined key factors and elaboration of morphological boxes as preliminary work for the projections;
  • Determination of the relevance of the individual characteristics through internal discussions in the research team regarding the projections and final determination of the projections;
Raw scenarios
Futuretransp 01 00041 i006
  • Assessment of the consistency between the projections based on internal discussions in the research team (consistency analysis);
  • Utilization of the results of the consistency analysis to develop consistent raw scenarios using the scenario software, ScenarioWizard;
Final scenarios
Futuretransp 01 00041 i007
  • Presentation and reflection of the developed scenarios through experts and stakeholders via online consultation;
  • Incorporation of comments and finalization of scenarios.
Futuretransp 01 00041 i008Input of external experts and stakeholders
Table 2. Overview of parameters for modeling the developed scenarios in MARS.
ParameterDescription
Market share of level 4 and 5 AVsInput assumptions on the vehicle fleet penetration of AVs (level 4 and 5). These assumptions were based on a market share study carried out by McKinsey & Company [39], entailing low- and high-disruption scenarios for level 4 and 5 AV market penetration.
Market share of electric vehiclesInput assumptions on the vehicle fleet penetration of electric vehicles. These assumptions were based on Krutzler et al. [29], entailing different scenarios for the vehicle penetration of electric vehicles in Austria.
AV ownership/business modelInput assumptions on the business model of AVs (AVs as private cars, car sharing with AVs, ride sharing with AVs), extension of user groups (no driving licences needed) and costs of using AVs.
Road capacityInput assumptions on the impact of AVs on road capacity. Whereas, on the one hand, studies (e.g., [12,40,41]) assume that AVs can drive closer together and, therefore, the road capacity increases, on the other hand, some studies (e.g., [41]) conclude that there will be a reduction of travel speeds and an increase of travel time during off-peak because AVs must strictly adhere to traffic rules with regard to visibility, stopping distance, permissible maximum speed, etc.
Parking place search and egress timeInput assumptions about the impact of AVs for parking place search and egress time as AVs can just pick up the passengers at the entrance to their homes and drop them off in front of their destinations.
In-vehicle value of time (VOT)Input assumptions on the impact of AVs on the in-vehicle value of time (VOT) as a variety of studies on automated driving (e.g., [41,42]) argue that the comfort gain with AVs will change the valuation of in-vehicle time.
Implementation of first/last mile AVs in public transport (share of population within 15 min of public transport stop)Input assumptions on the intensity of implemented first/last mile AVs in public transport by assumptions and variations of the share of population living within a 15 min radius to public transport stops.
Table 3. Verbal description of each of the three developed scenarios.
ParameterDescription
Scenario 1: Market-driven AV euphoria
Futuretransp 01 00041 i009
With the scenario “Market-driven AV euphoria”, a spread of au-tomated car sharing and leasing services with weak interfaces to public transport is sketched against the background of a mobility and transport policy geared especially towards competitiveness and economic development, as well as a great progress in automa-tion technologies and sharing by the population. Most people in Austria travel with hybrid drives.
Scenario 2: Policy-driven AV governance
Futuretransp 01 00041 i010
In the scenario “Policy-driven AV governance”, against the background of a mobility and transport policy oriented towards ecological sustainability and social inclusion and the use of highly automated vehicles in simple operational design domains, an extensive spread of all forms of sharing as well as an important role of public transport and active mobility in Austria is described. These transport services are largely integrated into urban-regional public mobility services (MaaS). Electric vehicles are widespread due to technological progress (shorter charging times, extended range) and falling battery prices.
Scenario 3: Individualized mobility and slow AV development
Futuretransp 01 00041 i011
In the scenario “Individualized mobility and slow AV development”, against the background of a mobility and transport policy geared especially towards competitiveness and economic development, as well as only slight progress in automation technologies, it is assumed that motorized individual transport will continue to be widespread in Austria, while public transport or ride sharing services will hardly prevail and are regarded as rather insecure. Electric vehicles are not very attractive—mainly due to their short range, a high charging time and high purchase costs.
Table 4. Overview of the assumptions for implementing and modeling the developed scenarios in the MARS model.
ParameterBAU: Business as UsualScenario 1: Market-Driven AV EuphoriaScenario 2: Policy-Driven AV GovernanceScenario 3: Individualized Mobility and Slow AV Development
Market share of level 4 and 5 AVs20200%0%0%0%
20250%7%4%0%
20300%22%14%0%
20350%55%29%4%
20400%72%44%7%
20450%85%68%22%
20500%92%85%55%
Market share of electric vehicles20203%4%5%3%
20257%9%12%7%
203014%23%31%14%
203523%41%57%23%
204035%58%82%35%
204550%75%98%50%
205063%82%99%63%
AV ownership/business modelBusiness model Car sharing with AVsRide sharing with AVsAVs as private cars
User group extension for AVsNo extension (18 year olds or older with driving licence, living in household with car)15–17 year olds and persons without driving licences (including disabled and elderly), all households15–17 year olds and persons without driving licences (including disabled and elderly), all households15–17 year olds and persons without driving licences (including disabled and elderly) living in household with AVs
AV occupancy rate 1.051.261.05
Empty load share +5%+5%no change
Detour factor 0+5%0
Cost per person km 55 cent/km55 cent/kmno change
Road CapacityUrban roadsno changePeak: −5%; Off-peak: +7%
Interurban roadsno changePeak: −10%; Off-peak: +5%
Motorwaysno changePeak: −15%; Off-peak: +13%
Parking place search timeLevel 4 and 5 AVs Reduction to 0
In-vehicle VOTLevel 4 and 5 AVs −20%
Implementation of first/last mile AVs in public transport(share of population within 15 min of public transport stop)Vienna97%97%100%97%
Urban72%80%90%80%
Suburban32%60%75%60%
Rural (good PT service)22%30%50%30%
Very rural (poor PT service)10%30%50%30%
Table 5. Overview results of the quantitative modeling of the scenarios 2030 and 2050.
ScenarioIndicatorYearWalkingBicyclePTCarTotal
Scenario 1: Market-driven AV euphoriaModal share-trips203013.9%7.2%15.4%63.4%100.0%
205010.2%4.9%15.7%69.2%100.0%
Billion person-km20302.281.6016.4087.08107.36
20501.651.0717.4790.37110.56
Billion vehicle-km2030 66.4066.40
2050 72.6672.66
Billion trips20301.030.531.144.697.39
20500.750.361.165.087.34
Million t CO22030 13.66
2050 6.19
Scenario 2: Policy-driven AV governanceModal share-trips203014.2%7.3%16.9%61.5%100.0%
205011.1%4.9%19.4%64.7%100.0%
Billion person-km20302.251.5718.4582.47104.73
20501.630.9621.4383.44107.47
Billion vehicle-km2030 62.7462.74
2050 64.3064.30
Billion trips20301.010.521.204.387.12
20500.740.321.294.316.66
Million t CO22030 11.80
2050 3.09
Scenario 3: Individualized mobility and slow AV developmentModal share-trips203014.7%7.8%14.5%63.0%100.0%
205011.3%5.5%15.8%67.4%100.0%
Billion person-km20302.491.7815.5088.68108.45
20501.861.2216.1097.83117.01
Billion vehicle-km2030 67.4467.44
2050 75.8875.88
Billion trips20301.120.591.114.807.63
20500.840.411.174.997.41
Million t CO22030 15.05
2050 9.28
BAU: Business as usualModal share-trips201516.1%8.6%14.9%60.4%100.0%
203014.7%7.8%14.5%63.0%100.0%
205013.0%6.7%14.0%66.3%100.0%
Billion person-km20152.421.7515.5779.7499.48
20302.491.7815.5088.68108.45
20502.261.5914.09102.57120.52
Billion vehicle-km2015 60.8560.85
2030 67.4467.44
2050 78.0578.05
Billion trips20151.090.581.014.106.78
20301.120.591.114.807.63
20501.020.531.105.227.87
Million t CO22015 15.28
2030 15.05
2050 9.54
Publisher’s Note: MDPI stays neutral with regard to jurisdictional claims in published maps and institutional affiliations.

