Article

Deep Learning-Based Multi-Class Body Fluid Cell Type Classification: A Comparative Evaluation of Image Enhancement Techniques


by
Tanatorn Tanantong
1,
Kanyarat Kanchanaphayak
1,
Nittaya Chemkomnerd
1,
Nawarerk Chalarak
1,
Krittakom Srijiranon
1,
Chollanot Kaset
2,
Kitiya Tanantong
3 and
Pokpong Songmuang
1,*
1
Thammasat University Research Unit in Data Innovation and Artificial Intelligence, Department of Computer Science, Faculty of Science and Technology, Thammasat University, Pathum Thani 12121, Thailand
2
Department of Medical Technology, Faculty of Allied Health Sciences, Thammasat University, Pathum Thani 12121, Thailand
3
Kitiya Medical Clinic (Dermatology and Aesthetic Medicine), Pathum Thani 12000, Thailand
*
Author to whom correspondence should be addressed.
BioMedInformatics 2026, 6(4), 50; https://doi.org/10.3390/biomedinformatics6040050
Submission received: 4 June 2026 / Revised: 19 July 2026 / Accepted: 23 July 2026 / Published: 27 July 2026

Abstract

Accurate classification of cells from body fluid specimens can support cytological analysis, but microscopic images often present challenges such as low contrast, unclear boundaries, staining variation, class imbalance, and overlapping morphology. This study evaluated the impact of image enhancement techniques on deep learning-based multi-class classification of body fluid cells. The dataset comprised 7071 microscopic images from Srinagarind Hospital, Thailand, annotated by expert technologists. After preprocessing and cell extraction, 22,062 single-cell images across 13 cell types were obtained. A 70:30 train–test split was used, with augmentation and random undersampling applied only to the training set. Nine individual enhancement filters and five combined settings were tested using MobileNetV3, DenseNet121, ResNet50, and EfficientNetB3. Performance was measured using weighted accuracy, precision, recall, and F1-score. DenseNet121 with Edge Enhance achieved the best individual-filter performance (accuracy 83.36%, F1-score 83.08%). For combined settings, DenseNet121 with CLAHE followed by Detail performed best (accuracy 83.01%, F1-score 82.54%), though it did not surpass the top individual filter. Multi-step enhancement provided limited additional benefit. Class-wise results showed strong performance for distinct cell types, while macrophages, monocytes, and lymphocytes remained challenging. Grad-CAM visualization further indicated that model attention was generally concentrated on relevant cellular regions, including nuclei, cytoplasm, and cell boundaries. Overall, selected enhancement techniques offer modest improvements, but effectiveness depends on model architecture and data characteristics. As this study used a single-institution dataset without external validation, the approach should be considered an assistive framework rather than a clinically validated diagnostic system.

1. Introduction

Cells from body fluid are important diagnostic indicators for several clinical conditions, including infection, inflammation, neurological disorders, and malignancy [1]. The analysis of cells obtained from body fluid specimens, such as cerebrospinal fluid, pleural fluid, and ascitic fluid, provides useful information about patient conditions and supports clinical decision-making [2]. However, the classification of body fluid cells still commonly relies on microscopic examination by medical professionals. This process can be time-consuming and may be influenced by the experience of the examiner, particularly when cell morphology is complex or ambiguous [3].
In recent years, artificial intelligence, particularly deep learning, has been widely applied in medical image analysis because of its ability to automatically learn important visual features and achieve high classification performance [4]. In the Thai medical context, deep learning has also been applied to skin disease classification and psoriasis lesion assessment, demonstrating its potential for supporting image-based clinical analysis [5,6]. Many studies have successfully applied deep learning models to classify cells from microscopic images, especially blood cell images [7,8]. Nevertheless, applying deep learning to body fluid cell classification remains challenging. Body fluid cells show high morphological diversity, and several cell types have similar visual characteristics [9]. In addition, body fluid specimens may contain degenerated cells, inconsistent staining, overlapping cells, and low-quality images with poor contrast or unclear nuclear and cytoplasmic details [10]. Another important challenge is the limited and imbalanced nature of body fluid cytology datasets [11,12]. Some cell types, particularly rare or malignancy-associated cells, may appear in much smaller numbers than common inflammatory cells, making it difficult for deep learning models to learn representative features across all classes [13]. These factors can limit the ability of deep learning models to extract discriminative features and may reduce classification performance, especially for minority or morphologically similar cell types.
Image quality enhancement is therefore an important preprocessing step before model training. Enhancement techniques can improve image contrast, sharpen cell boundaries, reduce noise, and highlight important cellular structures, thereby supporting more effective feature extraction by deep learning models [14]. Previous studies have shown that image enhancement techniques, such as Histogram Equalization (HE), Contrast-Limited Adaptive Histogram Equalization (CLAHE), Sharpen, and other sharpening-based methods, can improve image details and enhance model performance [15]. However, most existing studies focus on specific datasets or apply only a limited number of preprocessing techniques. There is still a lack of comprehensive comparison of multiple image enhancement filters for body fluid cell classification, especially in datasets with many cell classes and a high degree of class imbalance.
To address this gap, this study investigates the effect of nine image quality enhancement techniques on deep learning-based body fluid cell classification while considering the challenges of limited and imbalanced data. The evaluated techniques include Blur, Detail, Edge Enhance (EE), Edge Enhance More (EEM), Sharpen, Unsharp Mask (UM), Histogram Equalization (HE), Fuzzy Histogram Equalization (FHE), and Contrast-Limited Adaptive Histogram Equalization (CLAHE). The original unfiltered images were also used as the baseline for comparison. The classification task involved 13 body fluid cell types: Abnormal Mononuclear Cell, Atypical Lymphocyte, Basophil, Cells Stained Dark Blue with Fused Boundaries, Eosinophil, Lymphocyte, Macrophage, Mesothelial Cell, Mitotic Cell, Monocyte, Neutrophil, Plasma Cell, and Signet-Ring Cell. This task is challenging because body fluid cytology datasets often contain unequal class distributions, with rare or malignancy-associated cells appearing in much smaller numbers than common cell types [16]. In addition, several cell types share similar morphological characteristics, making automated classification more difficult [9,10]. Therefore, this study applied data augmentation and random undersampling to balance the dataset before model training, while image enhancement techniques were evaluated to improve the visual quality of cell images and support feature extraction.
In addition to evaluating individual filters, this study also examines combined image enhancement techniques to determine whether sequentially applying multiple filters can further improve classification performance. Four deep learning architectures, namely MobileNetV3, DenseNet121, ResNet50, and EfficientNetB3, were trained and compared under the same experimental settings. The main contribution of this study is a systematic evaluation of single and combined image quality enhancement strategies for multi-class body fluid cell classification. The findings provide insight into how different enhancement techniques affect deep learning performance and may support the development of automated body fluid cytology analysis systems for future clinical applications.

2. Theory and Related Works

2.1. Cytological Analysis of Body Fluid Cells

Body fluid cytology is an important procedure in clinical pathology for the diagnosis of inflammation, infection, and malignancy. Common body fluid specimens include pleural fluid, peritoneal fluid, pericardial fluid, and cerebrospinal fluid [2]. Cytological examination of these fluids provides useful information for assessing abnormalities of internal organs and monitoring disease severity [17]. The cells found in body fluid specimens are diverse in terms of morphology, biological function, and clinical significance [18]. Therefore, cell identification and classification require knowledge and experience in cytological interpretation.
Body fluid cells are categorized into three major groups according to their characteristics and clinical roles [19]: inflammatory cells, cytology-specific cells, and malignancy-associated cells. Inflammatory cells are associated with immune responses and are commonly found in body fluid specimens. This group includes Neutrophils (NEUT), Eosinophils (EOS), Basophils (BASO), Monocytes (MONO), and Lymphocytes (LYMPH). Neutrophils are characterized by multilobed nuclei and are commonly associated with bacterial infection or acute inflammation. Eosinophils contain orange-red cytoplasmic granules and have bilobed nuclei, and they are often observed in allergic conditions or parasitic infections [20]. Lymphocytes are commonly present in normal body fluids; however, an unusually high number of lymphocytes may be associated with tuberculosis or lymphoma [21]. Although inflammatory cells often show relatively distinctive morphological features, cell degeneration during specimen preparation, uneven staining, and the overlapping of different cell types may make cell identification more difficult. Cytology-specific cells are commonly encountered in body fluid cytology and often show complex morphological characteristics. This group includes Mesothelial Cell (MESO), Macrophage (MAC), Plasma Cell (PLAS), Atypical Lymphocyte (ATL), and Abnormal Mononuclear Cell (AMC). Mesothelial cells may form clusters and resemble malignant cells, which can make interpretation challenging [2]. Macrophages may share morphological similarities with both mesothelial cells and monocytes, leading to considerable overlap in visual appearance [9]. In addition, atypical lymphocytes and abnormal mononuclear cells may show altered nuclear and cytoplasmic features that resemble other cell types. Therefore, their identification requires careful consideration of detailed morphological characteristics [10]. The differences among cells in this group can be subtle, requiring close observation of nuclear features, cell shape, cytoplasmic appearance, and staining patterns [22]. Malignancy-associated cells are clinically important because they may be related to malignant processes or abnormal cell proliferation [23]. This group includes Signet-Ring Cell (SRC), Mitotic Cell (MIT), and Cells Stained Dark Blue with Fused Boundaries (CSDB). Signet-ring cells are characterized by a large vacuole that displaces the nucleus toward the cell periphery, which is an important feature of metastatic carcinoma, particularly from the gastrointestinal tract [24]. Mitotic cells are cells undergoing division, in which chromosomes can be clearly observed. A high number of mitotic cells may indicate abnormal proliferation in malignant tumors [25]. Cells Stained Dark Blue with Fused Boundaries are characterized by dark blue staining and connected cell boundaries, making it difficult to separate individual cells and evaluate their morphology. Moreover, malignancy-associated cells are often found in smaller numbers than other cell types, which further increases the difficulty of cytological examination and diagnosis [16].
Because of the diversity of the 13 cell types and the morphological similarities among several classes, body fluid cytology is a complex task that requires expertise from cytologists or pathologists for accurate cell identification. This is particularly important when cells are degenerated, staining is inconsistent, or several cell types share similar morphological features. In addition, differences in cell distribution across classes and variations in cellular morphology are important factors that contribute to the difficulty of clinical interpretation. Therefore, understanding the distinctive characteristics of each cell type is an essential foundation for studying cell image analysis methods and developing diagnostic support systems in cytology.

2.2. Image Quality Enhancement

Image quality enhancement is an important step in medical image processing. Its main purpose is to improve image clarity, reduce noise, and emphasize relevant details for image analysis and classification [26]. In medical and cell image analysis, image quality directly affects feature extraction [27] and the predictive performance of deep learning models [14]. Therefore, appropriate enhancement techniques can improve the visibility of important cell structures and support more effective classification.
Previous studies have applied various image enhancement techniques to improve classification performance. These techniques differ in their functions, including noise reduction, edge enhancement, detail sharpening, and contrast improvement. Smoothing and noise reduction filters, such as Blur, reduce image noise by averaging neighboring pixel values. Although this technique can suppress irrelevant small details, it may also reduce the sharpness of cell boundaries and important structures [28]. Edge enhancement filters, including Edge Enhance and Edge Enhance More, are used to increase the distinctiveness of object boundaries. Edge Enhance provides moderate edge improvement while preserving most original image details, whereas Edge Enhance More produces stronger boundary enhancement but may increase noise or make the image appear overly sharp in some cases [29].
Detail enhancement and sharpening filters are used to improve the visibility of fine image structures. The Detail filter emphasizes small textures and internal image patterns without excessively increasing edge sharpness. The Sharpen filter improves overall image clarity by increasing pixel intensity differences around object boundaries, although it may also amplify noise. Unsharp Mask (UM) is another widely used sharpening technique that creates a blurred version of the original image and uses the difference between the two images to emphasize edges more naturally [30].
Contrast enhancement techniques aim to improve the visibility of image details by adjusting pixel intensity distribution. Histogram Equalization (HE) is a global contrast enhancement method that redistributes pixel intensity values across the full intensity range, making dark and bright regions more distinguishable. However, HE may cause over-enhancement and noise amplification in some images [7]. Fuzzy Histogram Equalization (FHE) integrates fuzzy logic with histogram equalization by transforming pixel intensities into fuzzy membership values before contrast adjustment. This approach provides more flexible contrast enhancement and helps reduce excessive image modification [31]. Contrast-Limited Adaptive Histogram Equalization (CLAHE) improves local contrast by dividing the image into small tiles and applying histogram equalization to each region. Its clip limit mechanism prevents excessive contrast enhancement and reduces noise amplification, making it suitable for medical image enhancement [32].
Based on these functions, this study evaluates image enhancement filters from four groups: smoothing and noise reduction, edge enhancement, detail enhancement and sharpening, and contrast enhancement. These filters were applied to body fluid cell images to investigate their effects on deep learning-based cell classification performance.

2.3. Deep Learning-Based Cell Image Analysis

Deep learning is a subfield of machine learning developed from artificial neural networks (ANNs). It uses multi-layer network structures to learn complex patterns and automatically extract feature representations from raw data without requiring manually designed features. This capability makes deep learning suitable for medical image analysis, where image data often contain complex visual patterns. In clinical imaging, deep learning has been applied to image classification, segmentation, object detection, and computer-aided diagnosis across several domains, including radiology, histopathology, cytology, and hematology imaging [10].
Among deep learning architectures, Convolutional Neural Networks (CNNs) are widely used for image analysis because they can learn spatial information through convolution and pooling operations. CNNs can detect hierarchical image features ranging from low-level features, such as edges, shapes, and textures, to more complex structures. In pathology and cytology, CNN-based models have been used to analyze cell morphology, including nuclear characteristics, cell size, cell shape, staining patterns, and structural relationships between cells [16]. These capabilities are useful for cell classification because morphological interpretation is a key component of cytological diagnosis.
Cell image classification has been studied in several medical domains, including body fluid cytology, blood cell images, bone marrow cells, and cervical cytology. A summary of previous studies on cell classification using image preprocessing and deep learning techniques is presented in Table 1. In body fluid cytology, Uysal [12] compared VGG16, VGG19, MobileNet, InceptionV3, and DenseNet121 using a two-class body fluid cytology dataset. Class weighting and data augmentation were applied to address class imbalance, and DenseNet121 achieved the highest accuracy of 95.02%. Park et al. [33] studied pleural effusion cytology images from breast cancer patients using oversampling, data augmentation, and color normalization. Several models, including Inception-ResNet-V2, EfficientNet-B1, ResNeXt50, MobileNetV2, DenseNet121, and ResNet50, were evaluated, with Inception-ResNet-V2 achieving the best accuracy of 93.8%. Jiang et al. [34] developed a deep neural network for four-class cerebrospinal fluid cytology classification and reported an accuracy of 95%.
Deep learning has also been widely applied to blood cell classification. Kaur et al. [35] used EfficientNetB3 to classify five blood cell types and reported accuracy, precision, and recall values of 95%. Saidani et al. [7] compared VGG16, InceptionV3, MobileNetV2, ResNet50, and a proposed CNN model for white blood cell classification. Histogram equalization and edge smoothing were applied during preprocessing, and the proposed CNN achieved the highest accuracy of 99.86%. Hussein and El-Mougi [8] investigated eight-class peripheral blood cell classification using class weighting and data augmentation, comparing ResNet50, InceptionV3, EfficientNetB3, MobileNetV3, Swin Transformer, and a custom CNN, with the best accuracy of 98.83%. Several studies in cervical cytology have emphasized the importance of image preprocessing before deep learning classification. Khiruddin et al. [36] proposed a preprocessing technique combining gamma correction, histogram equalization, and denoising before training CNN, ResNet50, VGG16, InceptionV3, and EfficientNetB0 models. Verma and Barthwal [15] applied CLAHE, wavelet denoising, background correction, and Laplacian sharpening before training several architectures, including CNN, InceptionV3, Xception, attention-based models, and a fuzzy ensemble model. Alsalatie et al. [37] used median filtering and image sharpening with a CNN model and achieved an accuracy of 99.6.
Although previous studies have demonstrated the effectiveness of deep learning for cell image classification, several challenges remain, particularly in body fluid cytology. Cell images from body fluid specimens often contain high morphological variability, uneven cell density, overlapping cells, inconsistent staining, and image quality variation. In addition, abnormal or malignancy-associated cells are often less frequent than other cell types, resulting in class imbalance. These factors can make it difficult for deep learning models to learn discriminative features effectively [9]. To address these limitations, previous studies have applied several strategies, including data augmentation, class weighting, oversampling, image enhancement, and sampling methods, to improve model performance and reduce the impact of dataset-related constraints [12,33,36]. Beyond conventional supervised learning approaches, recent studies have also explored self-supervised learning to improve medical image analysis under limited-label conditions. For example, SimCLR-based self-supervised learning has been applied to acne severity grading to address label scarcity in medical image datasets [38]. These studies suggest that both preprocessing strategies and learning-based approaches are important for improving model robustness when working with challenging medical image data.
Overall, previous studies indicate that deep learning, particularly CNN-based architectures, can achieve strong performance in microscopic cell image classification. However, most existing studies focus on binary classification or a limited number of cell classes, typically ranging from two to eight classes. Research on multi-class body fluid cytology remains limited, especially for datasets with many cell types, substantial morphological similarity, and severe class imbalance. Therefore, this study investigates multiple image enhancement filters and their combinations for classifying 13 body fluid cell types. The aim is to identify effective image enhancement strategies that can improve deep learning-based cell classification and support future clinical application.
Table 1. Summary of previous studies on cell type classification using deep learning.
Author(s)YearDatasetImages (Classes)Imbalance HandlingImage EnhancementModel(s)Best Accuracy
Alsalatie et al. [37]2022Cervical cytology liquid-based Pap smear images963 (4)Data augmentationMedian filter; sharpeningCNN99.6%
Jiang et al. [34]2022Body fluid CSF cytology images1300 (4)DNN95%
Park et al. [33]2023Pleural effusion cytology images from breast cancer cases569 WSIs (2)Data augmentation; oversamplingColor normalizationInception-ResNet-V2; EfficientNet-B1; ResNeXt50; MobileNetV2; DenseNet121; ResNet5093.8% (Inception-ResNet-V2)
Saidani et al. [7]2024Blood WBC microscopy images2872 (5)Data augmentationHE; edge smoothingVGG16; InceptionV3; MobileNetV2; ResNet50; proposed CNN99.86% (proposed CNN)
Hussein and El-Mougi [8]2025Peripheral blood cell images17,092 (8)Class weighting; data augmentationResNet50; InceptionV3; EfficientNetB3; MobileNetV3; Swin Transformer; custom CNN98.83% (ResNet50)
Kaur et al. [35]2025Blood cell microscopy images5000 (5)EfficientNetB395%
Khiruddin et al. [36]2025Cervical cytology Pap smear images917 (3)Data augmentationGamma correction; HE; denoisingBaseline CNN; ResNet50; VGG16; InceptionV3; EfficientNetB084.15% (ResNet50)
Mehmood et al. [13]2025Bone marrow cell images15,000 (6)Data augmentation; undersamplingCLAHEAlexNet; DenseNet; GoogleNet; Inception-ResNet-V2; VGG1695%
Uysal [12]2025Body fluid cytology images693 (2)Class weighting; data augmentationVGG16; VGG19; MobileNet; InceptionV3; DenseNet12195.02% (DenseNet121)
Verma and Barthwal [15]2025Cervical cytology Pap smear images4049 (5)Data augmentationCLAHE; wavelet denoising; background correction; Laplacian sharpeningCNN; InceptionV3; Xception; attention-based models; fuzzy ensemble98.3%
This study2026Body fluid cytology images22,062 (13)Data augmentation; undersamplingBlur; Detail; EE; EEM; Sharpen; UM; HE; FHE; CLAHEMobileNetV3; DenseNet121; ResNet50; EfficientNetB383.36% (DenseNet121 + EE)
Values in the Images (Classes) column are reported as the number of images followed by the number of classes in parentheses. WBC = White Blood Cell; CSF = Cerebrospinal Fluid; WSI = Whole-Slide Image; HE = Histogram Equalization; CLAHE = Contrast-Limited Adaptive Histogram Equalization; EE = Edge Enhance; EEM = Edge Enhance More; UM = Unsharp Mask; FHE = Fuzzy Histogram Equalization.

3. Materials and Methods

3.1. Data Collection

The dataset used in this research was obtained from Srinagarind Hospital, Khon Kaen, Thailand. Ethical approval for the study was granted by the Thammasat University Ethics Committee under approval number 120/2567. The dataset comprises 7071 microscopic images of body fluid samples collected from multiple anatomical sites. The stained body-fluid cytology slides used in this study were obtained from approximately 300 patients. However, the analytic image dataset was de-identified before analysis and did not contain patient identifiers or image-to-patient linkage. Therefore, the exact number of unique patients represented in the final image dataset could not be confirmed. Clinicopathological data, including final diagnosis, disease category, specimen-to-patient linkage, and malignant/benign status, were not available. Accordingly, this study focused only on image-based cell-type classification and did not include patient-level or disease-level analysis.
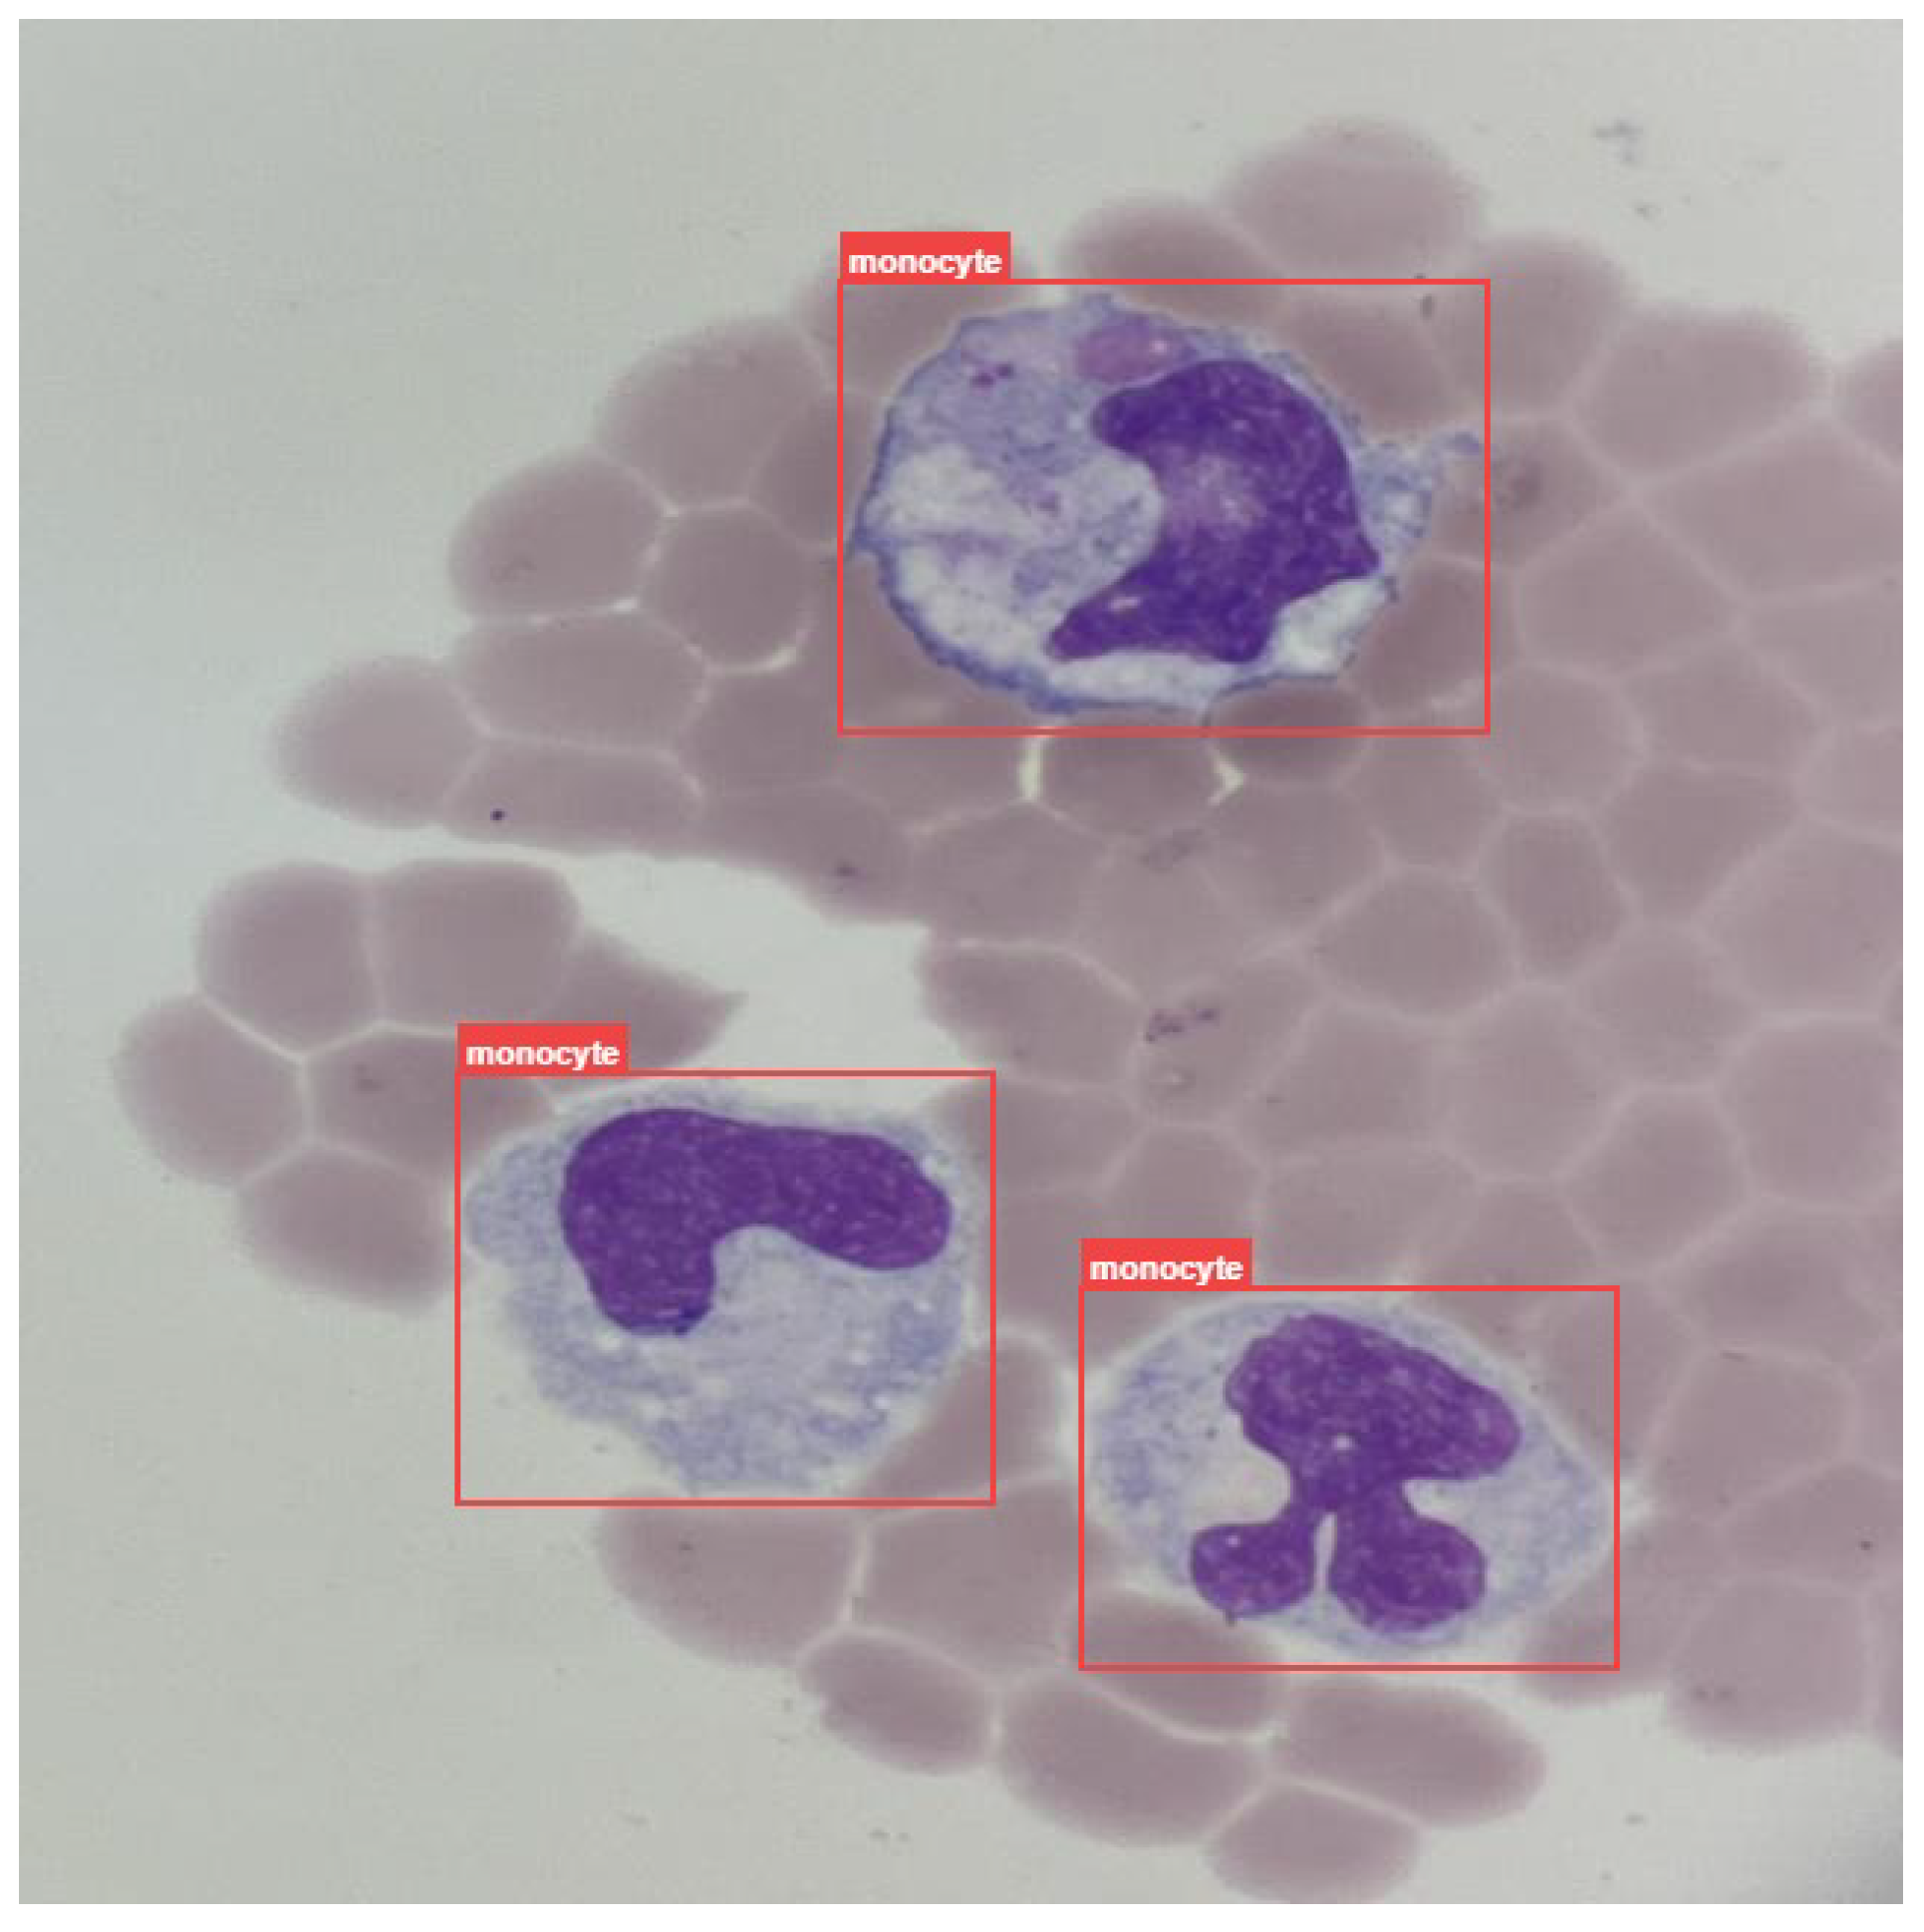
All images have a resolution of 640 × 640 pixels and were captured manually from stained body-fluid cytology slides. Image acquisition was performed using a smartphone camera attached to a microscope eyepiece with a clamp. The operator manually selected microscopic fields containing relevant cells and captured the images through the smartphone camera. The smartphone was used as the image-capturing device, and no automatic smartphone application was used for cell detection or image collection. The original microscopic images contained multiple cells per image. To construct the single-cell dataset used for model training and testing, individual cells were first annotated using bounding box by three expert medical technologists from the Department of Medical Technology, Thammasat University, with approximately 30, 20, and 15 years of professional experience. Before full annotation, interobserver agreement was assessed using randomly selected cells that were independently classified by the three experts according to established cytological criteria. Agreement was evaluated using Fleiss’ kappa for overall consensus and Cohen’s kappa for pairwise comparisons [39]. Then, the annotated cell were stored in Common Objects in Context (COCO) format, including the cell label and bounding-box coordinates for each annotated cell. Each single-cell image was then automatically extracted by cropping the original microscopic image according to the annotated bounding-box coordinates. Figure 1 presents an example of a body fluid image with annotated cells.

3.2. Data Preprocessing

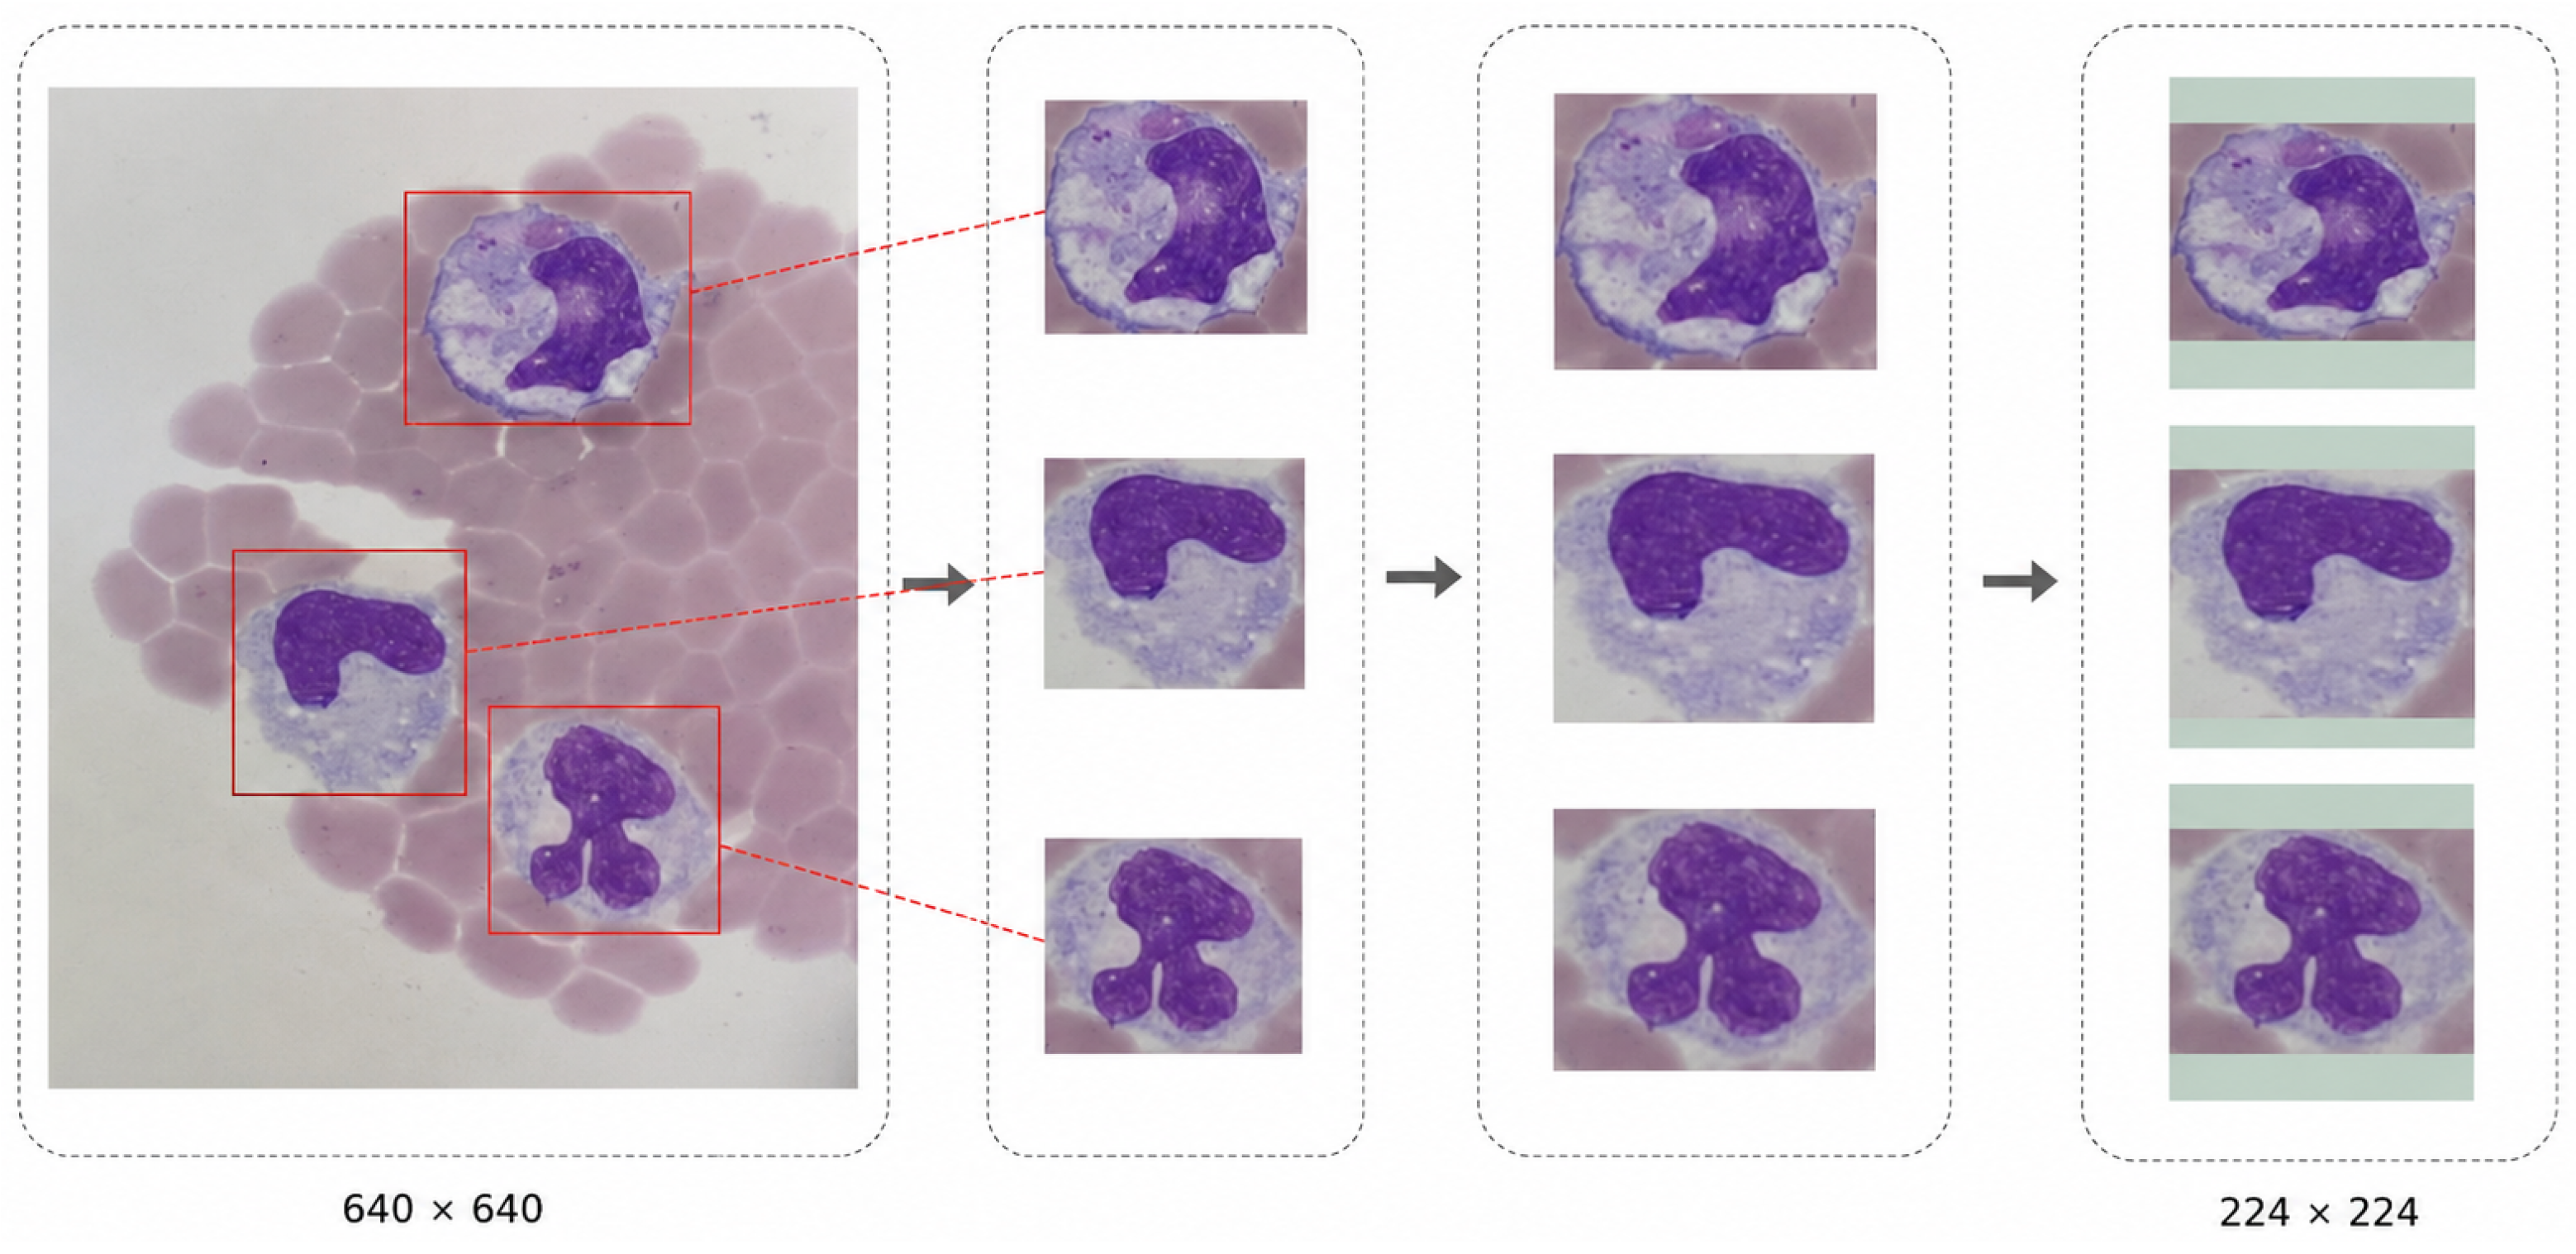
The original images may contain multiple annotated cells within a single image. Therefore, each multi-cell image was transformed into single-cell images by cropping individual cells based on the bounding box coordinates provided in the original annotation file. After extraction, each cropped cell image was resized to 224 × 224 pixels to match the input size required by the deep learning models. To preserve the original aspect ratio of the extracted cell region, padding was applied using a green background, as illustrated in Figure 2.
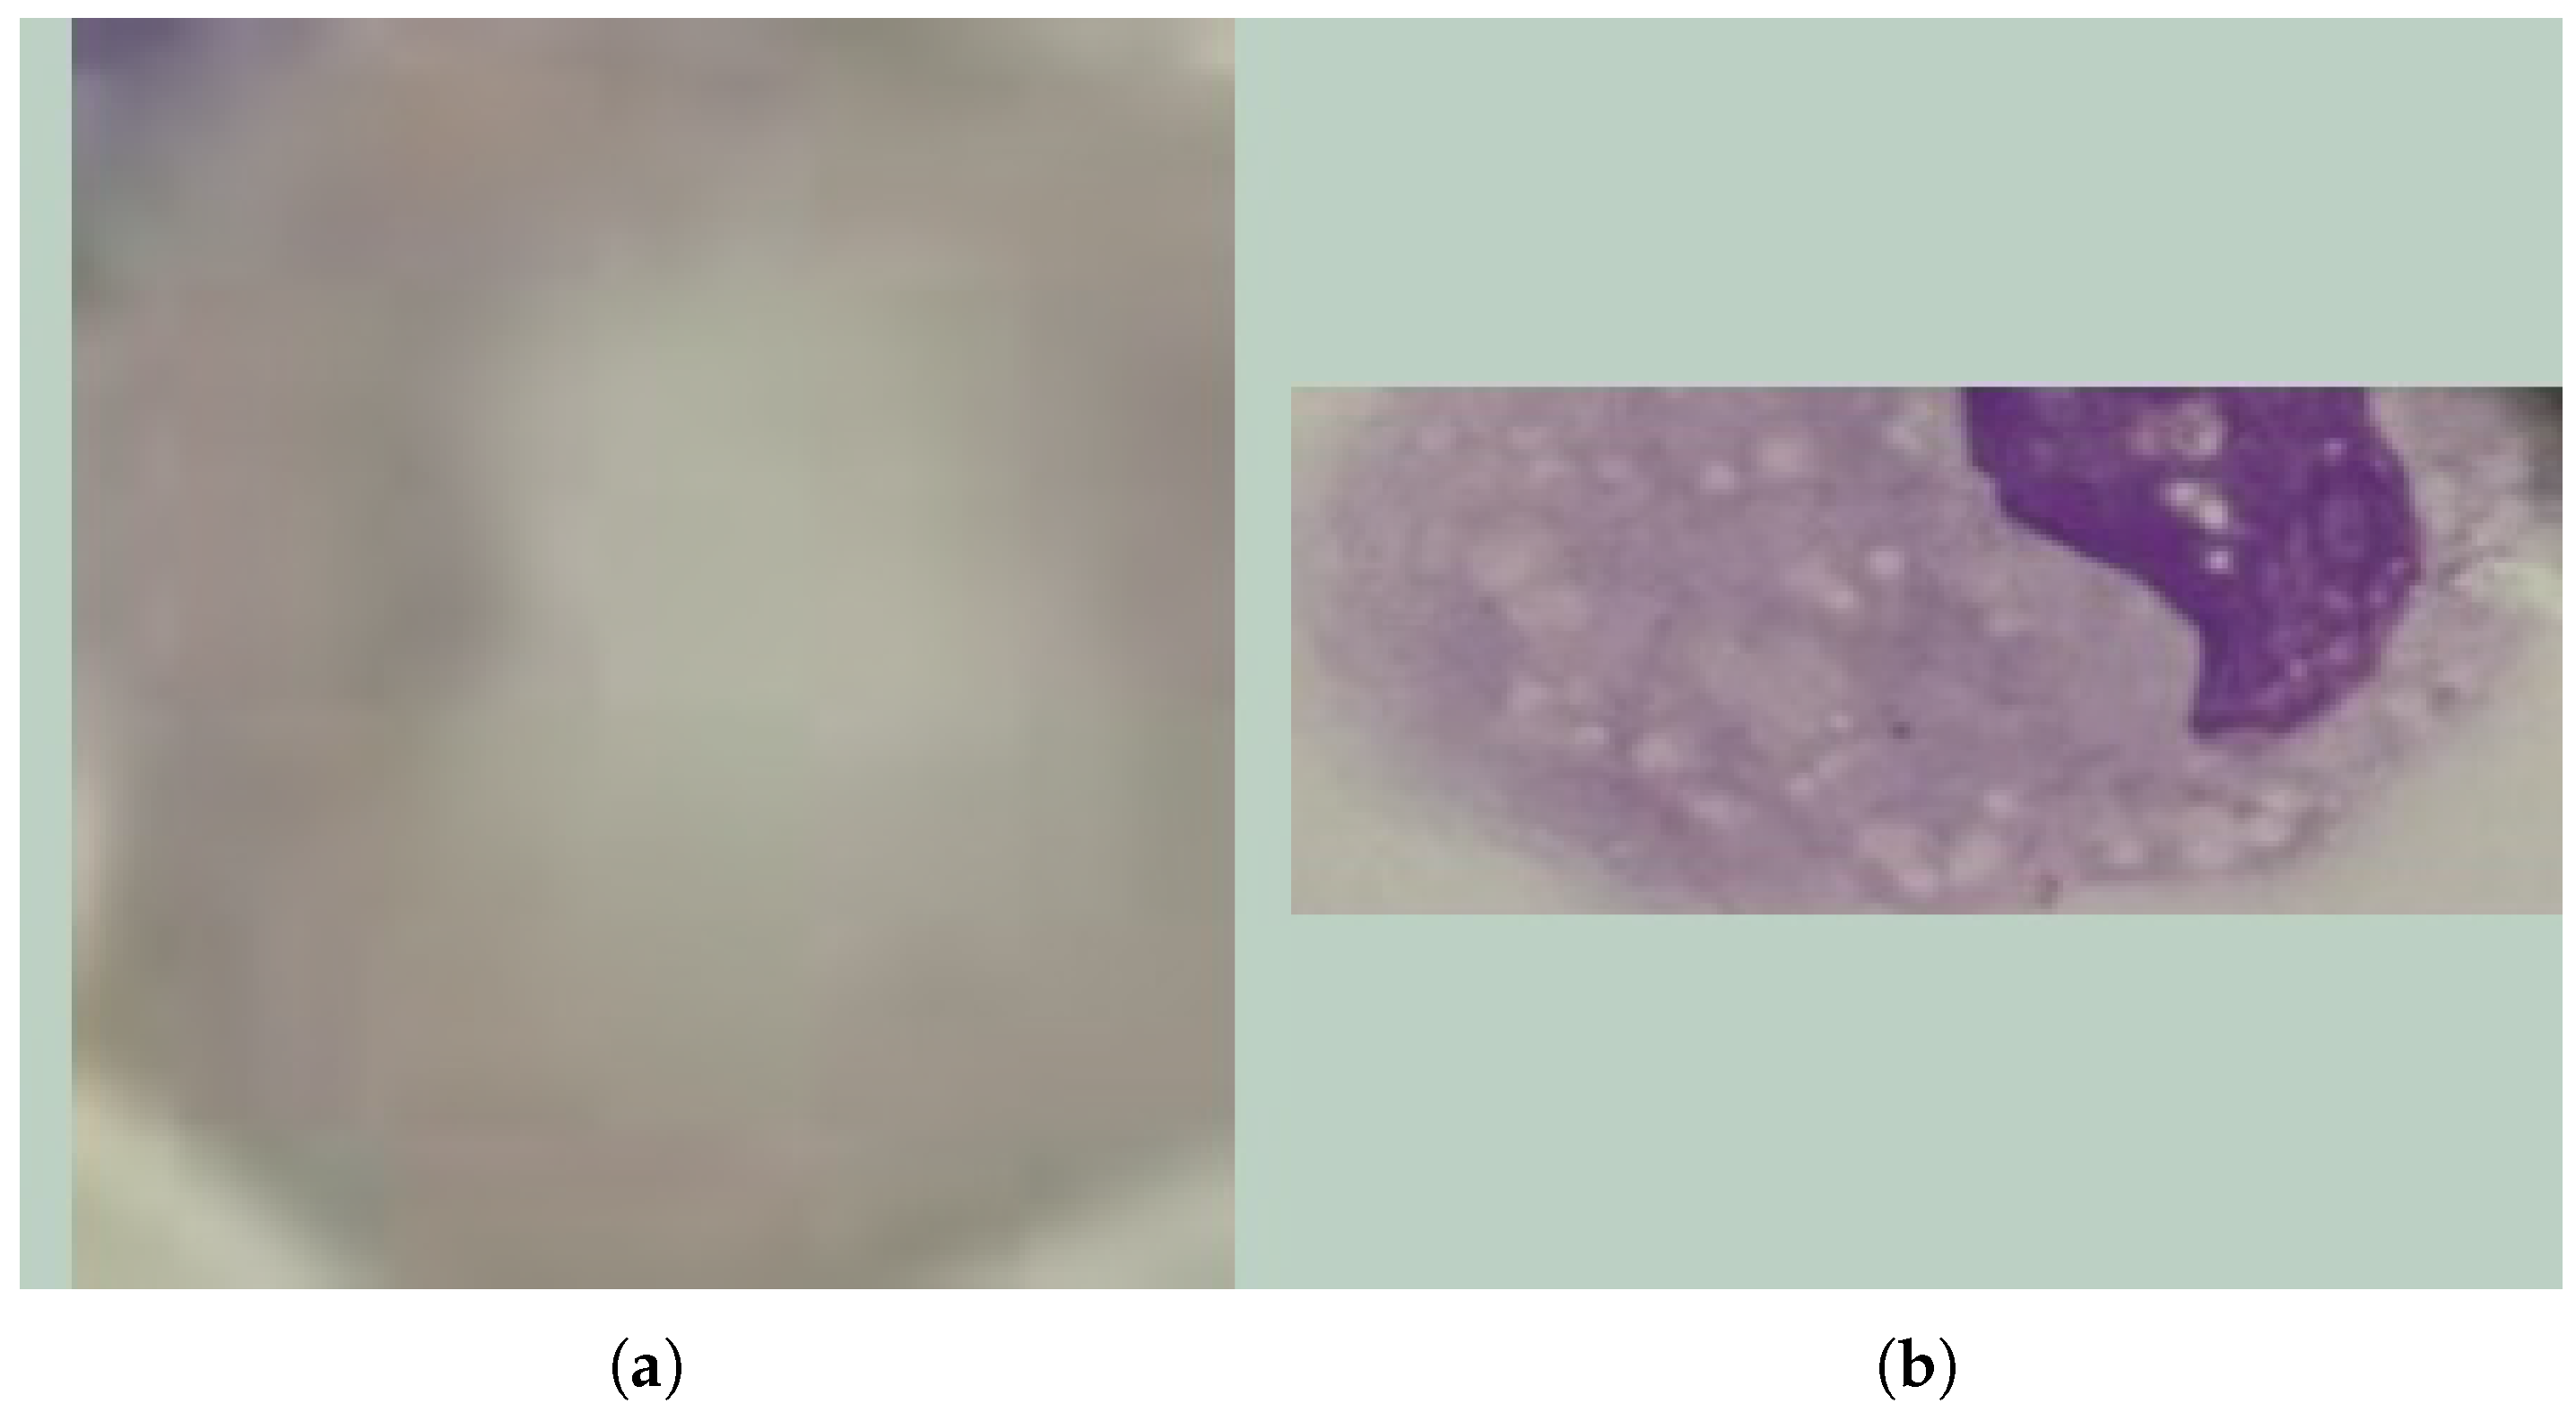
After cell extraction and resizing, a data cleaning process was conducted to remove unsuitable images. The excluded images included duplicate images, incomplete cell images, and images without visible cells, as shown in Figure 3. After data cleaning, the final dataset consisted of 22,062 single-cell images covering 13 labeled cell types. The number of images for each cell type is presented in Table 2.

3.3. Imbalanced Data Handling

As shown in Table 2, the number of images varied across the 13 cell types, indicating class imbalance in the dataset. Class imbalance can reduce classification performance by causing the model to become biased toward majority classes, while minority classes may be learned insufficiently [40]. Therefore, an imbalanced data handling strategy was applied to improve class representation and support more effective model training.
In this study, data augmentation was applied only to the training set to reduce class imbalance and increase image-level variation among minority classes. First, the original non-augmented extracted-cell images were divided into training and testing sets using a 70:30 split. After this split, augmentation was performed only on the training images, while the test set was kept unchanged and contained only original, unaugmented images. This procedure was used to prevent augmented versions of the same original cell from appearing in both the training and test sets.
To examine the influence of class balancing, experiments were conducted using both the original imbalanced training dataset and the balanced training dataset. For the balanced setting, the strategy followed the approach of Mehmood et al. [13], in which the target sample size was selected by considering the maximum class size and reducing it by approximately 50%. In this study, the balanced training set was adjusted to 2100 images per class to reduce majority-class dominance while maintaining computational feasibility. For classes with fewer than 2100 training images, augmentation was applied until the target number was reached. The augmentation techniques included flipping, rotation, shearing, elastic deformation, and grid distortion [41,42]. These transformations were applied randomly in terms of both the selected augmentation method and the order of application. For classes with more than 2100 training images, random undersampling was performed to reduce the number of training images to the same target level. As a result, the final balanced training set consisted of 2100 images for each of the 13 cell types, resulting in a total of 27,300 training images. Table 3 presents the number of cell images in training and test set. The test set was not augmented or undersampled and was used only for final model evaluation.

3.4. Image Quality Enhancement Techniques

Cell images obtained from body fluid samples may contain visual limitations such as low contrast, unclear cell boundaries, noise, or insufficient detail. These issues can affect the ability of deep learning models to extract meaningful visual features for classification. Therefore, this study applied nine image enhancement filters to improve different aspects of image quality. The original image without any enhancement was used as the baseline condition and is referred to as the raw image.
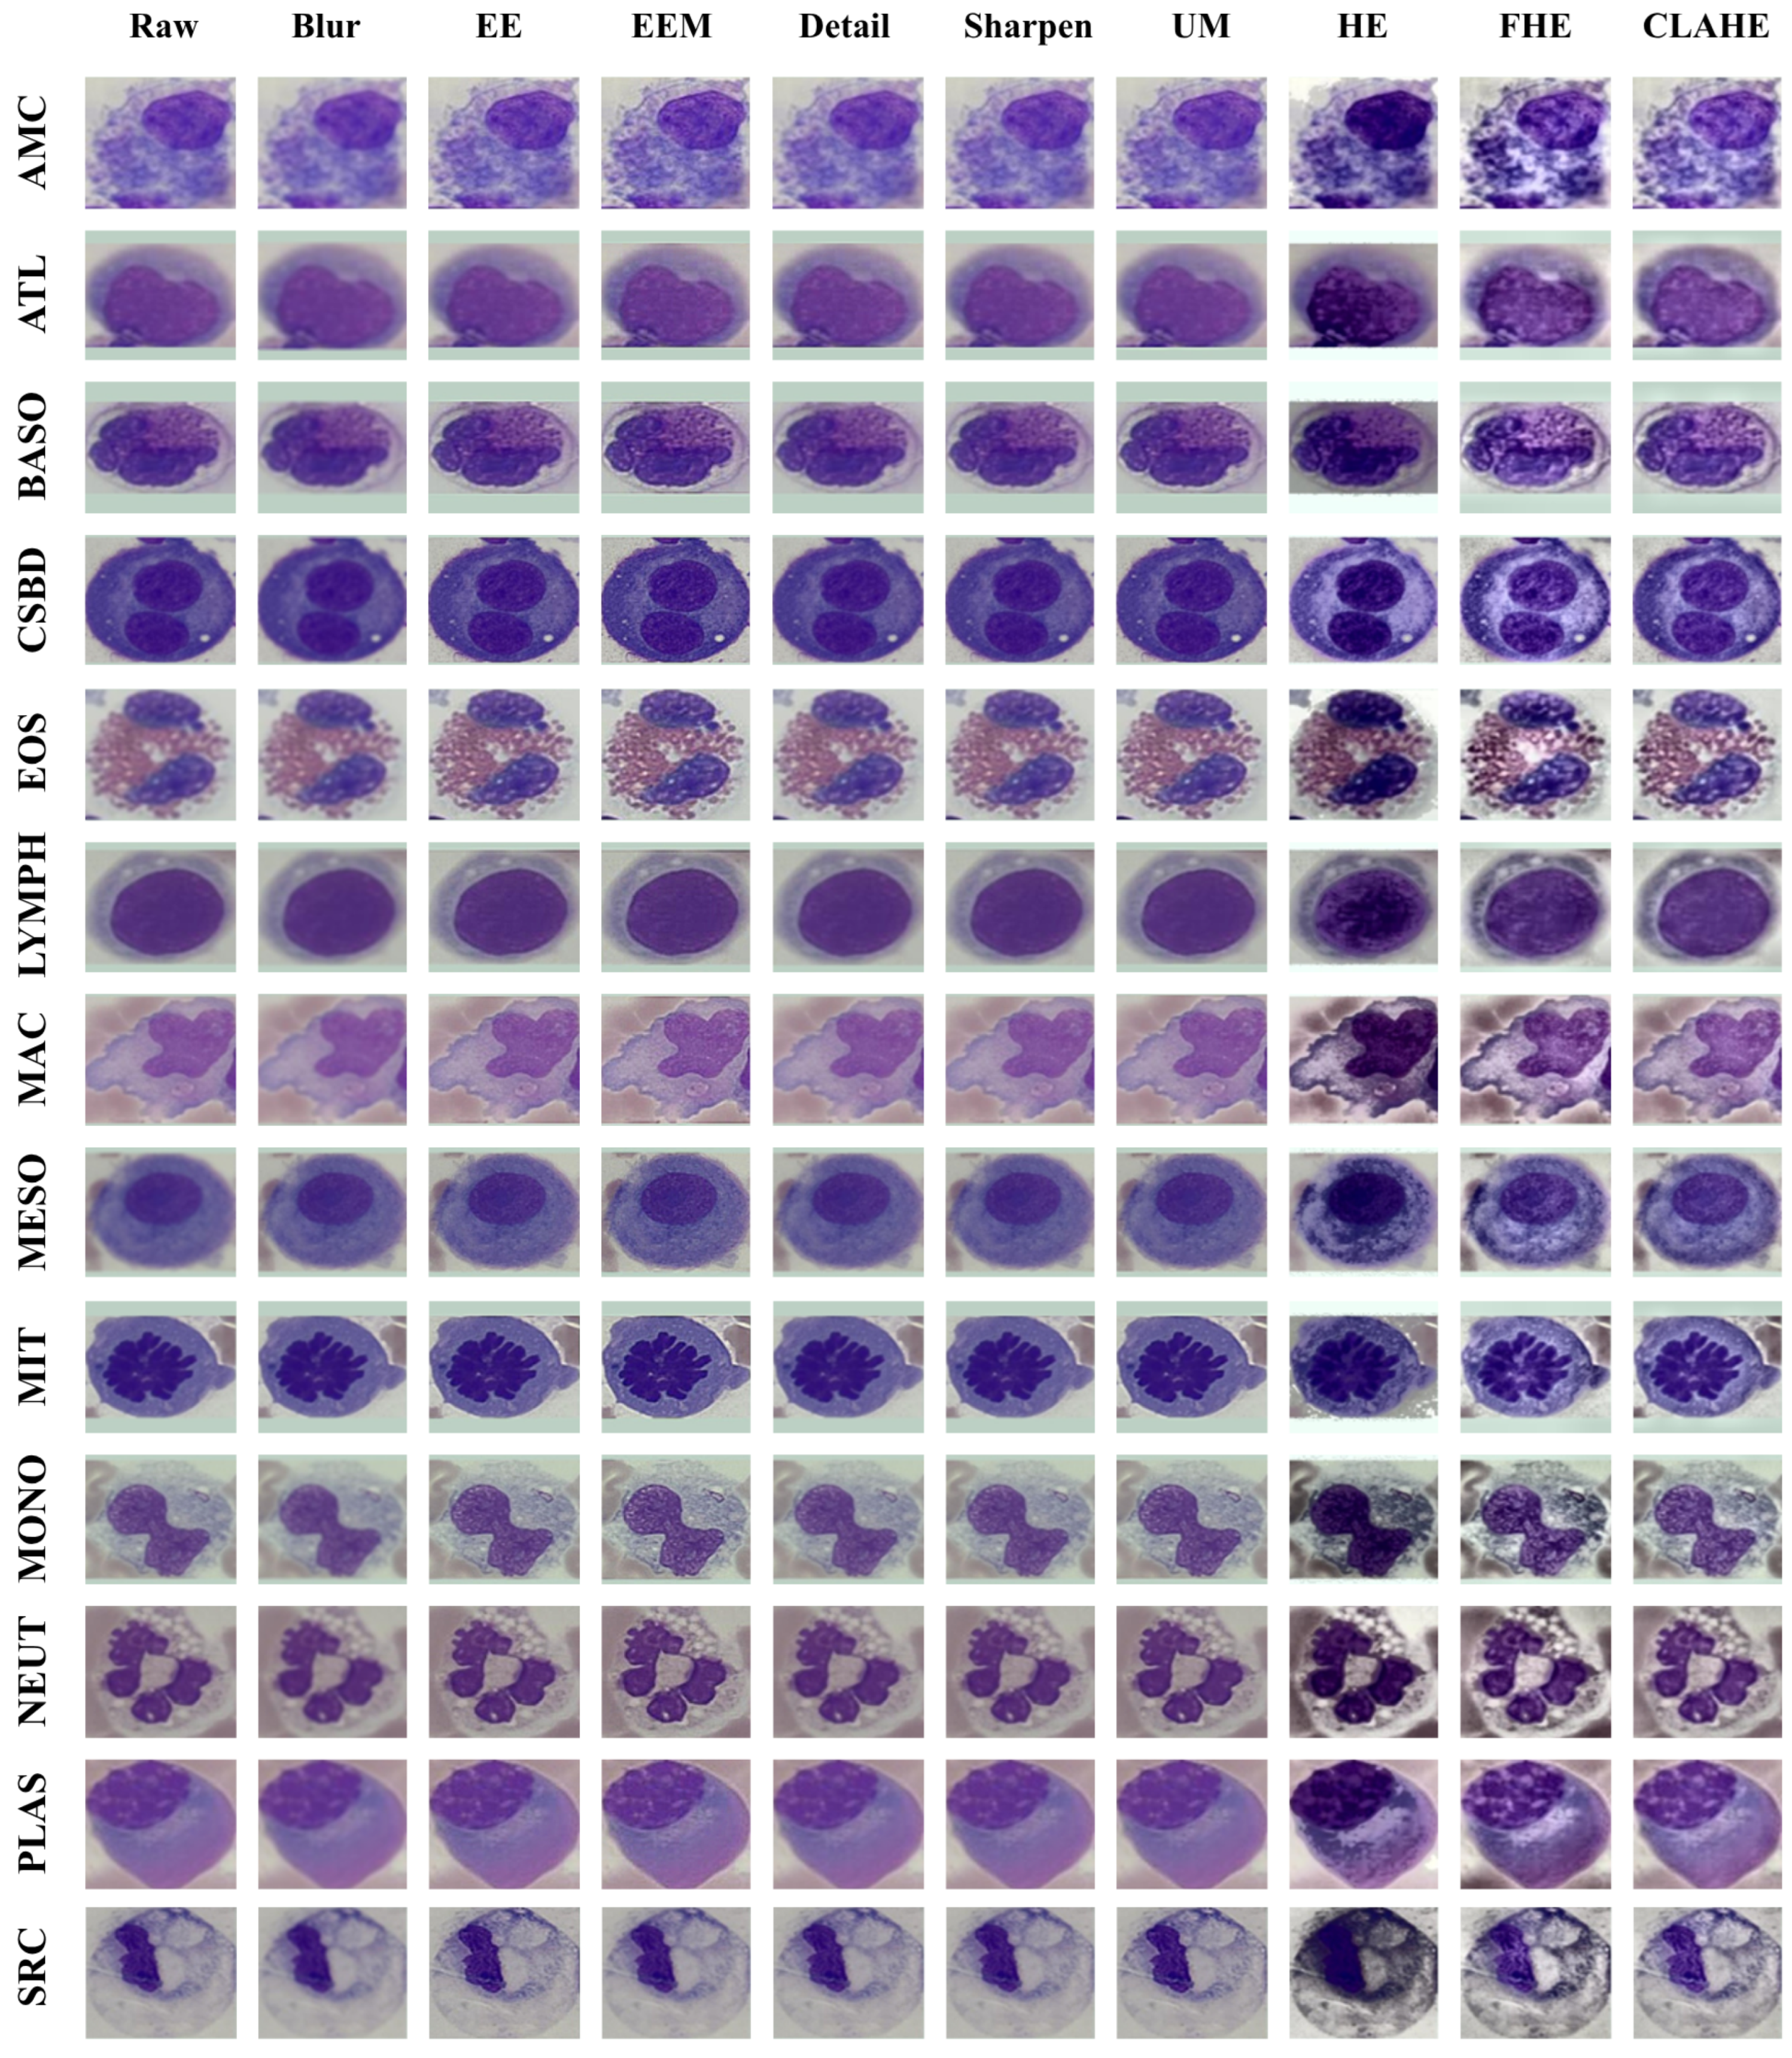
The selected filters were categorized into four groups according to their primary enhancement functions: smoothing and noise reduction, edge enhancement, detail enhancement and sharpening, and contrast enhancement, as described below. A visual comparison of the raw images and the images enhanced using the nine selected filters across all cell types is presented in Figure 4.
  • Smoothing and noise reduction filter: The Blur filter was applied to reduce noise and suppress unnecessary image details by averaging pixel values within a local neighborhood. This process helps smooth the image and reduce minor variations that may not be relevant to cell classification [28].
  • Edge enhancement filters: The Edge Enhance (EE) filter was used to increase the distinctiveness of object boundaries in the image. In addition, Edge Enhance More (EEM) was applied to produce a stronger edge enhancement effect and further improve the sharpness of cell boundaries [29].
  • Detail enhancement and sharpening filters: The Detail filter was applied to improve the visibility of fine structures within the image. The Sharpen filter was used to enhance the overall sharpness of the image. In addition, the Unsharp Mask (UM) filter was used to emphasize edge details by enhancing the difference between the original image and its blurred version [30].
  • Contrast enhancement filters: The Histogram Equalization (HE) filter was applied to redistribute pixel intensity values across the available intensity range, thereby improving global image contrast [7]. Fuzzy Histogram Equalization (FHE) combines fuzzy logic with histogram equalization to improve contrast while reducing the potential negative effects of excessive contrast enhancement [31]. Contrast-Limited Adaptive Histogram Equalization (CLAHE) enhances local contrast by dividing the image into small regions and applying a clip limit to prevent excessive noise amplification [43].
Table 4 presents the convolution kernel matrices used for the selected Pillow ImageFilter operations. These filters modify the image by applying a fixed kernel to each pixel and its neighboring pixels. The Blur filter uses a 5 × 5 kernel to smooth the image and reduce local variation [28]. In contrast, Edge Enhance, Edge Enhance More, Detail, and Sharpen use 3 × 3 kernels that emphasize differences between neighboring pixels. These operations can enhance cell boundaries, nuclear edges, and cytoplasmic details, which may help deep learning models extract discriminative visual features. In addition to the kernel-based filters, Unsharp Mask and CLAHE were applied using predefined parameter settings. For Unsharp Mask, the radius, percent, and threshold were set to 2, 120, and 3, respectively [30]. For HE, FHE and CLAHE, the clip limit was set to 2.0 and the tile grid size was set to 8 × 8 [43]. These parameters were selected to enhance local contrast and fine structural details while limiting excessive noise amplification. However, strong enhancement settings may also amplify artifacts or create artificial edges; therefore, their effect on classification performance should be evaluated experimentally.

3.5. Deep Learning Model Development

Cell type classification from body fluid images is an important task that can support effective analysis and disease diagnosis [44]. However, body fluid cell images often present several visual challenges, including variations in pixel intensity, image noise, overlapping cells, unclear cell boundaries, and small abnormal regions. These factors can affect feature extraction and reduce classification performance. Therefore, deep learning models are developed in this study to automatically learn discriminative image features and improve the accuracy of cell type classification.
Convolutional Neural Networks (CNNs) have been widely adopted in medical image analysis, particularly for clinical cell image classification. CNNs can automatically learn meaningful visual features from images, including low-level features such as cell edges, nucleus shape, and cytoplasm texture, as well as high-level features that may reflect more complex cellular abnormalities [45]. Previous studies have shown that CNN-based approaches can achieve better classification performance than traditional machine learning methods, such as k-nearest neighbors (k-NN) and support vector machines (SVM), in cell type and abnormal cell classification tasks [46].
In this study, four CNN architectures were selected for body fluid cell classification: MobileNetV3, DenseNet121, ResNet50, and EfficientNetB3. These architectures are well-known and have been widely applied in cell image classification tasks [47]. Each architecture has different strengths in terms of network structure, number of parameters, learning efficiency, and computational cost. To ensure a fair comparison, all selected models were trained and evaluated using the same dataset and experimental settings.

3.5.1. Deep Learning Architectures

MobileNetV3 is a lightweight CNN architecture designed for efficient image classification, particularly in mobile devices and edge computing environments [47,48]. The model size is approximately 21 MB, with around 3.3 million parameters. MobileNetV3 uses depthwise separable convolution and squeeze-and-excitation modules to reduce computational complexity while maintaining classification performance [12]. Its main advantage is its ability to balance accuracy and training efficiency, making it suitable for applications requiring lower computational resources [35].
DenseNet121 is a CNN architecture based on dense connectivity, where each layer receives feature information from all preceding layers. This structure promotes feature reuse, improves gradient flow, reduces the vanishing gradient problem, and enhances training efficiency. DenseNet121 has a model size of approximately 33 MB and contains around 7.3 million parameters. It has been widely used in medical image classification because of its ability to achieve high classification accuracy [12].
ResNet50 is a CNN architecture that applies residual learning through skip connections, allowing deeper networks to be trained more effectively. These residual connections help reduce degradation and vanishing gradient problems during training. ResNet50 has a model size of approximately 98 MB and contains around 24.1 million parameters. Its key strength is its ability to learn complex image features, which makes it effective for image classification tasks [35]. ResNet50 is also widely recognized and frequently used in medical image classification.
EfficientNetB3 is a CNN architecture based on the compound scaling concept, which balances network depth, width, and input image resolution to improve classification performance. The model size is approximately 48 MB, with around 11.2 million parameters. EfficientNetB3 is designed to achieve high accuracy while using fewer computational resources and parameters compared with many conventional deep learning models. Therefore, it is suitable for classification tasks that require both strong predictive performance and computational efficiency [48].

3.5.2. Classification Head Design

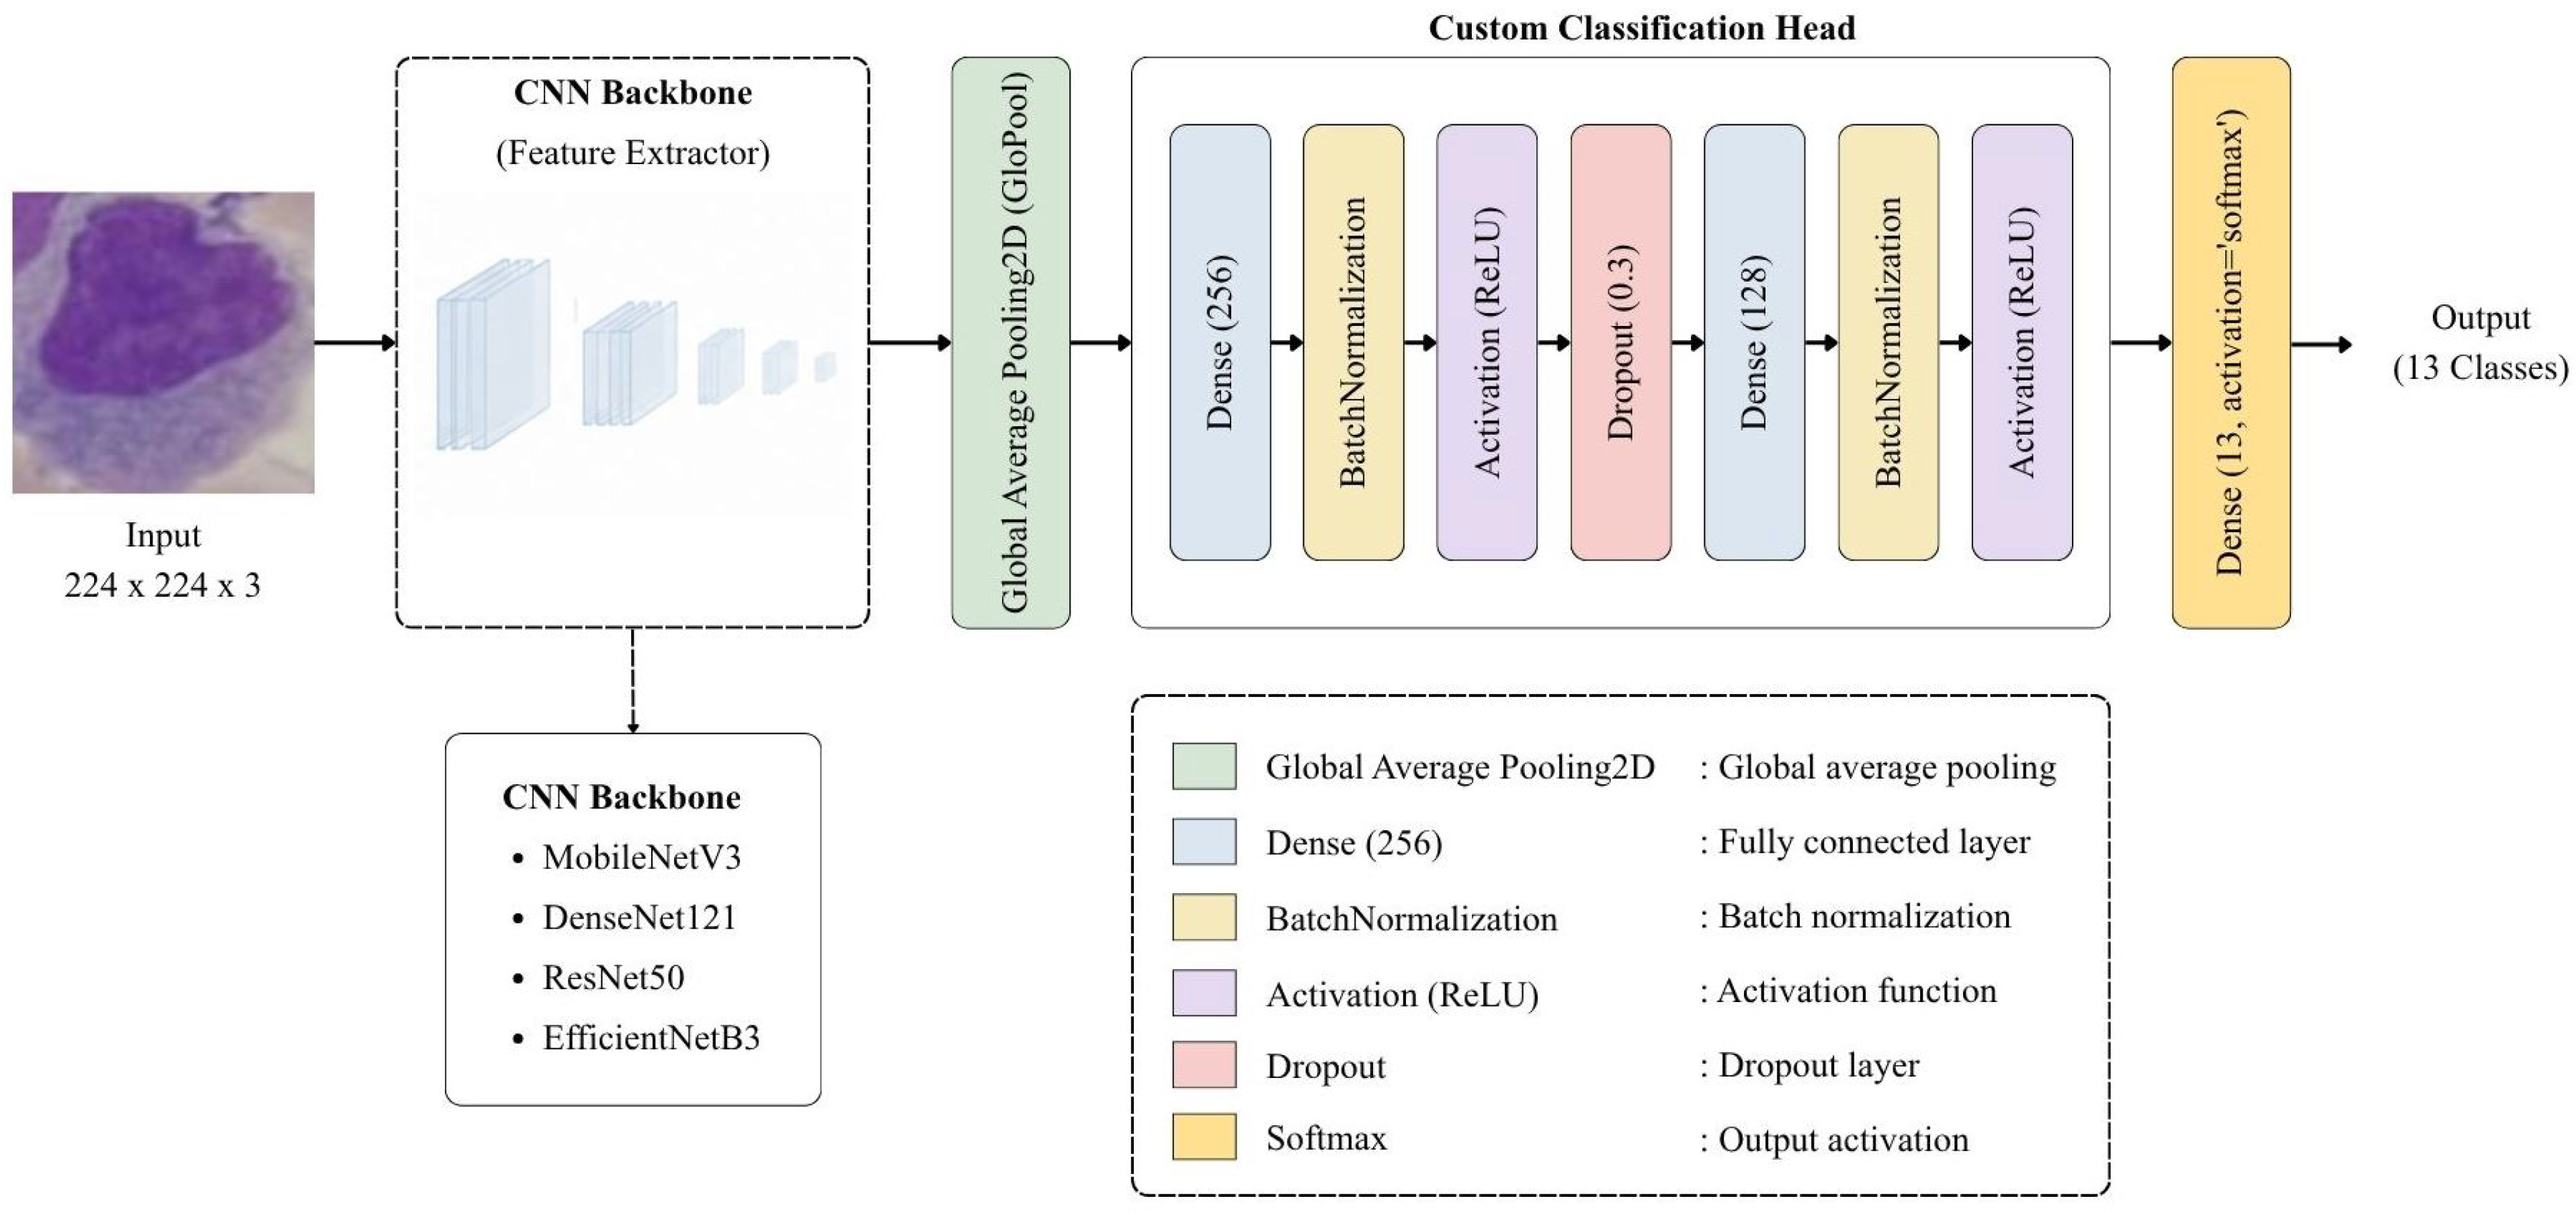
In this study, the convolutional backbone of each pretrained model was frozen during training, and only the newly added classification head was trained. To adapt the selected pretrained architectures to the body fluid cell classification task, the original classification layer of each base model was replaced with a custom classification head. The proposed classification head begins with a Global Average Pooling 2D layer, which receives the feature maps from the base model and converts the spatial feature maps into a compact feature vector. This operation reduces the number of trainable parameters while preserving important high-level feature information. The feature vector is then passed to a fully connected layer with 256 neurons, followed by batch normalization and a Rectified Linear Unit (ReLU) activation function. Batch normalization was applied to stabilize model training, while ReLU was used to introduce nonlinearity and support the learning of complex image features.
A dropout layer with a rate of 0.3 was then added to reduce the risk of overfitting during training. After that, the output was passed through another fully connected layer with 128 neurons, followed by batch normalization and ReLU activation. This layer was included to further refine the learned feature representation before classification. Finally, the output layer used the softmax activation function to generate class probability scores for the 13 cell types. The structure of the custom classification head is illustrated in Figure 5. This customized architecture was designed to improve feature learning and classification performance, particularly for medical cell images that may contain complex visual patterns and subtle differences between cell classes. The architectures and trainable parameters of the four deep learning models are summarized in Table 5 and Table 6.

3.5.3. Evaluation Metrics

The evaluation of body fluid cell classification models requires consideration of both overall predictive performance and the ability of the model to correctly distinguish each cell type. Therefore, this study used the confusion matrix as the fundamental tool for analyzing classification outcomes. A confusion matrix presents the relationship between the actual class and the predicted class, allowing the classification errors of the model to be examined clearly. In binary classification, the confusion matrix consists of four main components: True Positive (TP), which represents positive samples that are correctly classified as positive; True Negative (TN), which represents negative samples that are correctly classified as negative; False Positive (FP), which represents negative samples that are incorrectly classified as positive; and False Negative (FN), which represents positive samples that are incorrectly classified as negative [49].
The values obtained from the confusion matrix were used to calculate the performance metrics, including accuracy, precision, recall, and F1-score. For multi-class classification, precision, recall, and F1-score were reported as weighted average values, where each class contributes to the final score according to its number of test samples. This approach accounts for the unequal class distribution in the test set and provides an overall performance summary that reflects class support. These metrics were used to evaluate the models from different perspectives, including overall correctness, reliability of prediction, and the ability to detect target cell types [50]. The details of each metric are described as follows.
Accuracy measures the proportion of correctly classified cell images among all cell images. It reflects the overall classification performance of the model. A higher accuracy value indicates that the model can correctly classify a larger proportion of samples.
A c c u r a c y = T P + T N T P + T N + F P + F N
Precision measures the proportion of samples correctly predicted as a specific class among all samples predicted as that class. A higher precision value indicates that the model produces fewer false positive predictions and has higher reliability when assigning samples to a particular class.
P r e c i s i o n = T P T P + F P
Recall measures the proportion of samples from a specific class that are correctly detected by the model among all actual samples of that class. A higher recall value indicates that the model can more completely identify the target cell type.
R e c a l l = T P T P + F N
The F1-score is the harmonic mean of precision and recall. It is used to evaluate the balance between prediction reliability and detection completeness, particularly when the number of samples differs across classes.
F 1 - s c o r e = 2 × P r e c i s i o n × R e c a l l P r e c i s i o n + R e c a l l
Although the confusion matrix components are commonly described in the context of binary classification, this study involves multi-class classification of 13 body fluid cell types. Therefore, precision, recall, and F1-score were calculated for each class and then summarized to evaluate the overall model performance across all cell types.

3.6. Experimental Settings

The deep learning models for body fluid cell classification were developed, trained, validated, and tested using Python 3.9 in the Jupyter Notebook environment. The experiments were conducted on a workstation equipped with 32 GB of RAM, an NVIDIA RTX 4000 Ada Generation GPU with 20 GB of memory, and a 14th-generation Intel Core i5-14500 processor.
For model training, the same training hyperparameters were applied to all deep learning models to ensure a fair performance comparison. The details of the hyperparameters are summarized in Table 7. The batch size was set to 128 to balance computational efficiency and GPU memory usage [7]. The input image size was fixed at 224 × 224 pixels, and ImageNet pre-trained weights were used for the transfer-learning models. The backbone layers were frozen during training, and only the classification head was trained. Input images were normalized according to the preprocessing requirement of each corresponding CNN architecture. The loss function was set to categorical cross-entropy, which is suitable for multi-class classification tasks. The AdamW optimizer was used with a learning rate of 0.0001. AdamW is an extension of the Adam optimizer that incorporates decoupled weight decay into the optimization process, which can improve weight regularization and reduce overfitting in deep learning models [51]. No learning-rate scheduler was used, and the same fixed learning rate was applied across all models and enhancement conditions. A fixed random seed of 42 was used to support reproducibility.
To reduce overfitting and avoid unnecessary training, Early Stopping was applied [47]. The validation loss was used as the monitoring criterion, with a patience value of 10 epochs and a minimum delta of 0.001. The validation subset was created from the training data and used for early stopping. If the validation loss did not improve according to the defined criterion, the training process was automatically stopped. The maximum number of training epochs was set to 100. In addition, GlobalAveragePooling2D was used as the pooling layer before the final classification layers. The test set was not used for early stopping, hyperparameter selection, or model selection, and was used only for final performance evaluation.

4. Results and Discussion

4.1. Performance of Image Quality Enhancement Filters

4.1.1. Results Using the Original Non-Augmented Training Data (Single Filter)

The performance comparison of the four deep learning models using raw images and individual image enhancement filters with the original non-augmented training data is presented in Table 8. Overall, the classification performance under this condition was lower than that obtained from the augmented and balanced training data, indicating that limited and imbalanced training samples reduced the ability of the models to learn representative features across all cell types.
Among the evaluated models, ResNet50 achieved the best overall performance. The highest accuracy was obtained using the Detail filter, with an accuracy of 81.40%, precision of 80.62%, recall of 81.40%, and F1-score of 80.90%. ResNet50 also showed strong performance with Sharpen and raw images, achieving accuracies of 81.38% and 81.20%, respectively. For MobileNetV3, the raw images produced the highest accuracy of 80.77%, followed closely by CLAHE with an accuracy of 80.72%. DenseNet121 achieved its best performance using Edge Enhance, with an accuracy of 80.37%, while EfficientNetB3 obtained its highest performance using Unsharp Mask, with an accuracy of 79.82%.
The results show that the most effective filter differed across model architectures. Detail and Sharpen were beneficial for ResNet50, while Edge Enhance performed best for DenseNet121 and Unsharp Mask performed best for EfficientNetB3. In contrast, CLAHE did not provide the highest performance in the non-augmented condition, although it remained competitive for MobileNetV3. This suggests that when the training data are limited and imbalanced, the benefit of image enhancement may be constrained by insufficient class representation. In such cases, improving visual quality alone may not be enough for the model to learn robust and discriminative features, particularly for minority classes.
In addition, some filters reduced performance compared with raw images. Blur and HE generally produced lower results for most models, suggesting that smoothing or global contrast adjustment may remove or distort useful cellular features when training data are limited. These findings highlight that image enhancement does not automatically improve classification performance and that its effectiveness depends on the interaction between image characteristics, model architecture, and data distribution.
To further examine whether the observed differences among the single filters were statistically meaningful, a reconstructed contingency-table analysis was performed using the reported weighted accuracy values and the unchanged test set of 3979 cell images. The number of correctly and incorrectly classified images was estimated from the accuracy of each filter, and a chi-square test was applied within each model. The results showed that the differences among single filters were not statistically significant for any model under the original non-augmented condition: MobileNetV3,  χ 2 ( 9 ) = 1.537 p = 0.997 ; DenseNet121,  χ 2 ( 9 ) = 15.647 p = 0.075 ; ResNet50,  χ 2 ( 9 ) = 9.637 p = 0.381 ; and EfficientNetB3,  χ 2 ( 9 ) = 4.117 p = 0.904 . Therefore, although Raw images, Edge Enhance, Detail, and Unsharp Mask produced the highest numerical accuracies for MobileNetV3, DenseNet121, ResNet50, and EfficientNetB3, respectively, these differences should be interpreted as small performance variations rather than clear statistical superiority. Because this analysis was reconstructed from aggregate weighted accuracy values rather than image-level prediction results, it should be interpreted as an approximate statistical comparison.

4.1.2. Results Using the Augmented and Balanced Training Data (Single Filter)

The performance comparison of the four deep learning models using individual image enhancement filters with the augmented and balanced training data is presented in Table 9. In this experiment, data augmentation and class balancing were applied only to the training set, while the test set remained unchanged. Overall, the augmented and balanced training condition improved the performance of several models compared with the original non-augmented training condition, suggesting that balancing the training data helped the models learn more representative features across the 13 cell types.
Among all models and filters, DenseNet121 with Edge Enhance achieved the highest overall performance, with an accuracy of 83.36%, precision of 83.27%, recall of 83.36%, and F1-score of 83.08%. DenseNet121 also performed strongly with Edge Enhance More and CLAHE, achieving accuracies of 83.04% and 82.31%, respectively. For MobileNetV3, CLAHE produced the best performance, with an accuracy of 81.78%, precision of 81.37%, recall of 81.78%, and F1-score of 81.40%. For ResNet50, Unsharp Mask achieved the highest performance, with an accuracy of 81.78% and F1-score of 81.46%. EfficientNetB3 performed best with Edge Enhance More, reaching an accuracy of 81.68% and F1-score of 81.25%.
To further examine whether the observed differences among the single filters were statistically meaningful, a reconstructed contingency-table analysis was performed using the reported weighted accuracy values and the unchanged test set of 3979 cell images. The number of correctly and incorrectly classified images was estimated from the accuracy of each filter, and a chi-square test was applied within each model. The results showed that the differences among single filters were not statistically significant for any model under the original non-augmented condition. Therefore, although Raw images, Edge Enhance, Detail, and Unsharp Mask produced the highest numerical accuracies for MobileNetV3, DenseNet121, ResNet50, and EfficientNetB3, respectively, these differences should be interpreted as small performance variations rather than clear statistical superiority.
A reconstructed contingency-table analysis was also conducted for the single-filter experiments using the augmented and balanced training data. In contrast to the original data condition, statistically significant differences among filters were observed for MobileNetV3,  χ 2 ( 9 ) = 19.214 p = 0.023 ; DenseNet121,  χ 2 ( 9 ) = 21.698 p = 0.010 ; and EfficientNetB3,  χ 2 ( 9 ) = 18.729 p = 0.028 . CLAHE was the best-performing filter for MobileNetV3, Edge Enhance was the best-performing filter for DenseNet121, and Edge Enhance More was the best-performing filter for EfficientNetB3. However, no statistically significant difference among filters was observed for ResNet50,  χ 2 ( 9 ) = 9.192 p = 0.420 . These findings suggest that augmentation and class balancing made the effect of image enhancement more distinguishable for some architectures, although the most effective filter still depended on the model used.

4.2. Performance of Combined Image Quality Enhancement Settings

Although the updated single-filter experiments showed that the best-performing filter varied across model architectures, CLAHE was selected as the baseline technique for the combined enhancement settings because of its established effectiveness in medical and microscopic image enhancement. Previous studies have reported that CLAHE can improve image quality and support feature extraction for deep learning models by enhancing local contrast while limiting excessive noise amplification [13,15,43]. Unlike global contrast enhancement methods, CLAHE divides an image into small local regions and adjusts the contrast within each region. This allows important cellular structures, such as nuclei, cytoplasm, and cell boundaries, to become more distinguishable, which is particularly useful for microscopic cell images that may contain uneven staining, low contrast, and subtle morphological differences between cell types.
Since CLAHE belongs to the contrast enhancement group, it was combined with filters from other functional groups, including detail enhancement, sharpening, edge enhancement, and smoothing. The purpose of this experiment was to investigate whether combining local contrast enhancement with other image enhancement functions could further improve the visual representation of body fluid cell images and increase classification performance. The evaluated combined settings were Setting 1: CLAHE + Detail, Setting 2: CLAHE + Sharpen, Setting 3: CLAHE + Sharpen + Unsharp Mask + Edge Enhance More, Setting 4: CLAHE + Edge Enhance + Detail, and Setting 5: CLAHE + Blur + Unsharp Mask + Detail.

4.2.1. Results Using the Original Non-Augmented Training Data (Combine Filter)

The performance comparison of the combined image enhancement settings using the original non-augmented data is presented in Table 10. Overall, the best-performing setting varied across the deep learning architectures. For MobileNetV3, Setting 2 (CLAHE + Sharpen) achieved the highest performance, with an accuracy of 81.05%, precision of 80.25%, recall of 81.05%, and F1-score of 80.53%. DenseNet121 also obtained its best result using Setting 2, with an accuracy of 81.03% and F1-score of 80.61%. For ResNet50, Setting 1 (CLAHE + Detail) produced the strongest performance, achieving the highest overall accuracy among all combined settings at 82.32%, with precision of 81.55%, recall of 82.32%, and F1-score of 81.86%. In contrast, EfficientNetB3 performed best with Setting 4 (CLAHE + Edge Enhance + Detail), with an accuracy of 79.54% and F1-score of 78.97%.
These results indicate that combining CLAHE with additional enhancement filters can improve performance for some model architectures, particularly ResNet50. Compared with the single-filter results using the original data, ResNet50 with Setting 1 outperformed its best single-filter result, which was obtained using the Detail filter. This suggests that applying CLAHE before Detail may enhance local contrast and improve fine cellular structures in a complementary manner. However, the benefit of combined enhancement was not consistent across all models. Setting 3, which applied multiple sharpening and edge enhancement operations, produced the lowest performance for all architectures. This finding suggests that excessive sequential enhancement may distort cell morphology, amplify noise, or introduce artificial edges, reducing the quality of features learned by the models. Therefore, under the original non-augmented condition, simple combined settings such as CLAHE followed by Detail or Sharpen were more effective than more complex enhancement sequences.
The reconstructed contingency-table analysis for the combined enhancement settings using the original non-augmented data showed statistically significant differences among settings for MobileNetV3,  χ 2 ( 4 ) = 31.197 p < 0.001 ; DenseNet121,  χ 2 ( 4 ) = 29.767 p < 0.001 ; and ResNet50,  χ 2 ( 4 ) = 12.139 p = 0.016 . Setting 2 (CLAHE + Sharpen) was the best-performing setting for both MobileNetV3 and DenseNet121, whereas Setting 1 (CLAHE + Detail) achieved the highest performance for ResNet50. For EfficientNetB3, the differences among combined settings were not statistically significant,  χ 2 ( 4 ) = 3.098 p = 0.542 , even though Setting 4 produced the highest numerical accuracy. These results indicate that combined enhancement settings can significantly affect classification performance for some models, but the effect remains architecture-dependent.

4.2.2. Results Using the Augmented and Balanced Training Data (Combine Filter)

The performance comparison of the combined image enhancement settings using the augmented and balanced training data is presented in Table 11. Overall, Setting 1 (CLAHE + Detail) produced the most consistent performance across the evaluated models. For MobileNetV3, Setting 1 achieved the best result, with an accuracy of 81.53%, precision of 81.26%, recall of 81.53%, and F1-score of 81.17%. DenseNet121 also obtained the highest performance with Setting 1, achieving an accuracy of 83.01%, precision of 82.66%, recall of 83.01%, and F1-score of 82.54%. For EfficientNetB3, Setting 1 produced the highest accuracy and recall, both at 80.47%, although Setting 2 achieved slightly higher precision and F1-score. For ResNet50, the performance differences among Settings 1, 2, and 4 were relatively small; however, Setting 4 (CLAHE + EE + Detail) achieved the highest accuracy of 80.52% and F1-score of 80.05%.
Among all combined settings, DenseNet121 with Setting 1 achieved the highest overall performance, with an accuracy of 83.01% and F1-score of 82.54%. This suggests that applying Detail after CLAHE may provide complementary enhancement by improving local contrast while also emphasizing fine cellular structures. However, when compared with the best single-filter result using augmented and balanced training data, DenseNet121 with Edge Enhance still achieved a slightly higher accuracy of 83.36% and F1-score of 83.08%. Therefore, the combined enhancement settings did not outperform the best individual filter in this experiment.
Setting 3 (CLAHE + Sharpen + UM + EEM) produced the lowest performance for several models, particularly MobileNetV3 and ResNet50. This result suggests that applying multiple sharpening and edge-enhancement filters sequentially may over-enhance the images, introduce artificial boundaries, or amplify noise. Since body fluid cell classification depends on both cell boundaries and internal morphological details, excessive enhancement may reduce the quality of features learned by the deep learning models. These findings indicate that simple and balanced enhancement settings are generally more effective than complex multi-step enhancement settings, especially when the training data have already been augmented and balanced.
For the combined enhancement settings using the augmented and balanced training data, the reconstructed contingency-table analysis showed statistically significant differences among settings for MobileNetV3,  χ 2 ( 4 ) = 64.892 p < 0.001 ; ResNet50,  χ 2 ( 4 ) = 31.664 p < 0.001 ; and EfficientNetB3,  χ 2 ( 4 ) = 11.034 p = 0.026 . Setting 1 (CLAHE + Detail) was the best-performing setting for MobileNetV3 and EfficientNetB3, while Setting 4 (CLAHE + Edge Enhance + Detail) achieved the highest numerical performance for ResNet50. For DenseNet121, the difference among settings was marginal but not statistically significant,  χ 2 ( 4 ) = 9.035 p = 0.060 , although Setting 1 produced the highest accuracy. Overall, these findings suggest that simple combined enhancement settings, particularly CLAHE followed by Detail, were more effective than more complex sequential enhancement settings when the training data were augmented and balanced.

4.3. Discussion on Data Imbalanced and Data Limitations

The comparison between the original non-augmented data and the augmented and balanced training data shows that data augmentation and class balancing influenced model performance. For the single-filter experiments, the augmented and balanced training condition generally improved classification performance compared with the original data. In the original data condition, the highest overall performance was obtained by ResNet50 with the Detail filter, achieving an accuracy of 81.40% and F1-score of 80.90%. After applying augmentation and balancing to the training set, the highest overall performance increased to 83.36% accuracy and 83.08% F1-score, obtained by DenseNet121 with Edge Enhance. This improvement suggests that balancing the training data helped the model learn more representative features across the 13 cell types and reduced the effect of unequal class distributions.
A similar pattern was observed in the combined enhancement settings. Using the original data, the best combined result was obtained by ResNet50 with Setting 1 (CLAHE + Detail), which achieved an accuracy of 82.32% and F1-score of 81.86%. With the augmented and balanced training data, the best combined result was obtained by DenseNet121 with Setting 1 (CLAHE + Detail), achieving an accuracy of 83.01% and F1-score of 82.54%. Although the improvement in the combined settings was modest, the results indicate that augmentation and balancing can support more stable feature learning. However, the best combined setting did not outperform the best single-filter result under the augmented condition, suggesting that increasing data diversity may be more beneficial than applying more complex enhancement sequences.
These findings highlight the importance of data quantity and class distribution in body-fluid cell classification. The original dataset contained highly unequal numbers of images across cell types, and some rare cell types were represented by fewer than 20–30 original cell images. We acknowledge that this small number of source images limits the reliability of performance interpretation for these rare classes. Although data augmentation was applied to the training set to increase the number and variability of transformed images, augmentation does not create new biologically independent samples or fully represent the true morphological diversity of rare cell types. Therefore, augmentation can help reduce training imbalance, but it cannot replace the need for larger numbers of original images, especially for rare but clinically important cells such as Signet-Ring Cells. In addition, random undersampling of majority classes may help balance the training dataset, but it may also remove useful variation from common cell types. Because this study used a single-institution dataset, the robustness of the proposed approach to different microscopes, cameras, staining protocols, and acquisition settings remains unknown. Therefore, the results, particularly for rare cell types, should be interpreted cautiously, and external validation with larger and more diverse datasets is required before the enhancement strategy can be considered generalizable.
In this study, data augmentation and balancing were applied only to the training set, while the test set was kept unchanged. This design prevents augmentation-related data leakage and provides a more realistic evaluation than augmenting both training and testing data. However, the split was performed at the extracted-cell level rather than at the patient, specimen, or original microscopy image level. Because image-to-patient, image-to-specimen, and original microscopy image-level grouping identifiers were not available, related cells may have been assigned to different splits. This may lead to an optimistic estimate of model generalization, particularly if visually similar cells from the same original specimen or microscopy image appear in both training and testing sets. Therefore, while the results demonstrate the potential benefit of data augmentation and image enhancement for body fluid cell classification, they should be interpreted with this limitation in mind.

4.4. Class-Wise Classification Performance

Class-wise precision, recall, and F1-score were analyzed for Raw images, Edge Enhance (EE), and Setting 1 (CLAHE + Detail), as shown in Table 12. This analysis provides a more detailed evaluation beyond the overall weighted average metrics, which is important because the dataset contains imbalanced cell distributions and several morphologically similar cell types. Overall, most cell types achieved high classification performance across the three preprocessing conditions. Cells with distinctive morphology, such as Basophil, Cells Stained Dark Blue with Fused Boundaries, Eosinophil, Mitotic Cell, Neutrophil, Plasma Cell, and Signet-Ring Cell, generally showed high precision, recall, and F1-score. In particular, Basophil and Signet-Ring Cell achieved near-perfect performance under several preprocessing conditions, suggesting that the model could learn discriminative features for visually distinctive cell types.
Lower performance was observed for morphologically complex or visually similar cell types, especially Macrophage, Monocyte, and Lymphocyte. Macrophage and Monocyte showed F1-scores below 81% across the evaluated preprocessing conditions, while Lymphocyte had lower precision compared with many other classes. These results may be due to overlapping nuclear and cytoplasmic characteristics, variations in staining, and differences in cell appearance across images. This indicates that the main classification challenges were concentrated in cell types with subtle or overlapping morphology rather than in clearly distinguishable classes.
The effect of preprocessing also varied by cell type. EE improved the F1-score of some difficult classes, particularly Macrophage and Monocyte, compared with Raw images, suggesting that edge-based enhancement may help emphasize cell boundaries and internal structures. Setting 1 provided strong performance for several classes, including Abnormal Mononuclear Cell, Atypical Lymphocyte, Mesothelial Cell, Plasma Cell, and Signet-Ring Cell. However, the improvement was not consistent across all cell types, as Lymphocyte and Macrophage did not improve with Setting 1 compared with Raw or EE images. These findings support the overall result that image enhancement can influence classification performance, but its effect depends on cell morphology and preprocessing method. Future work should increase the number and diversity of difficult cell types and explore targeted preprocessing or class-specific augmentation to improve discrimination among morphologically similar cells.

4.5. Grad-CAM Analysis of Model Attention

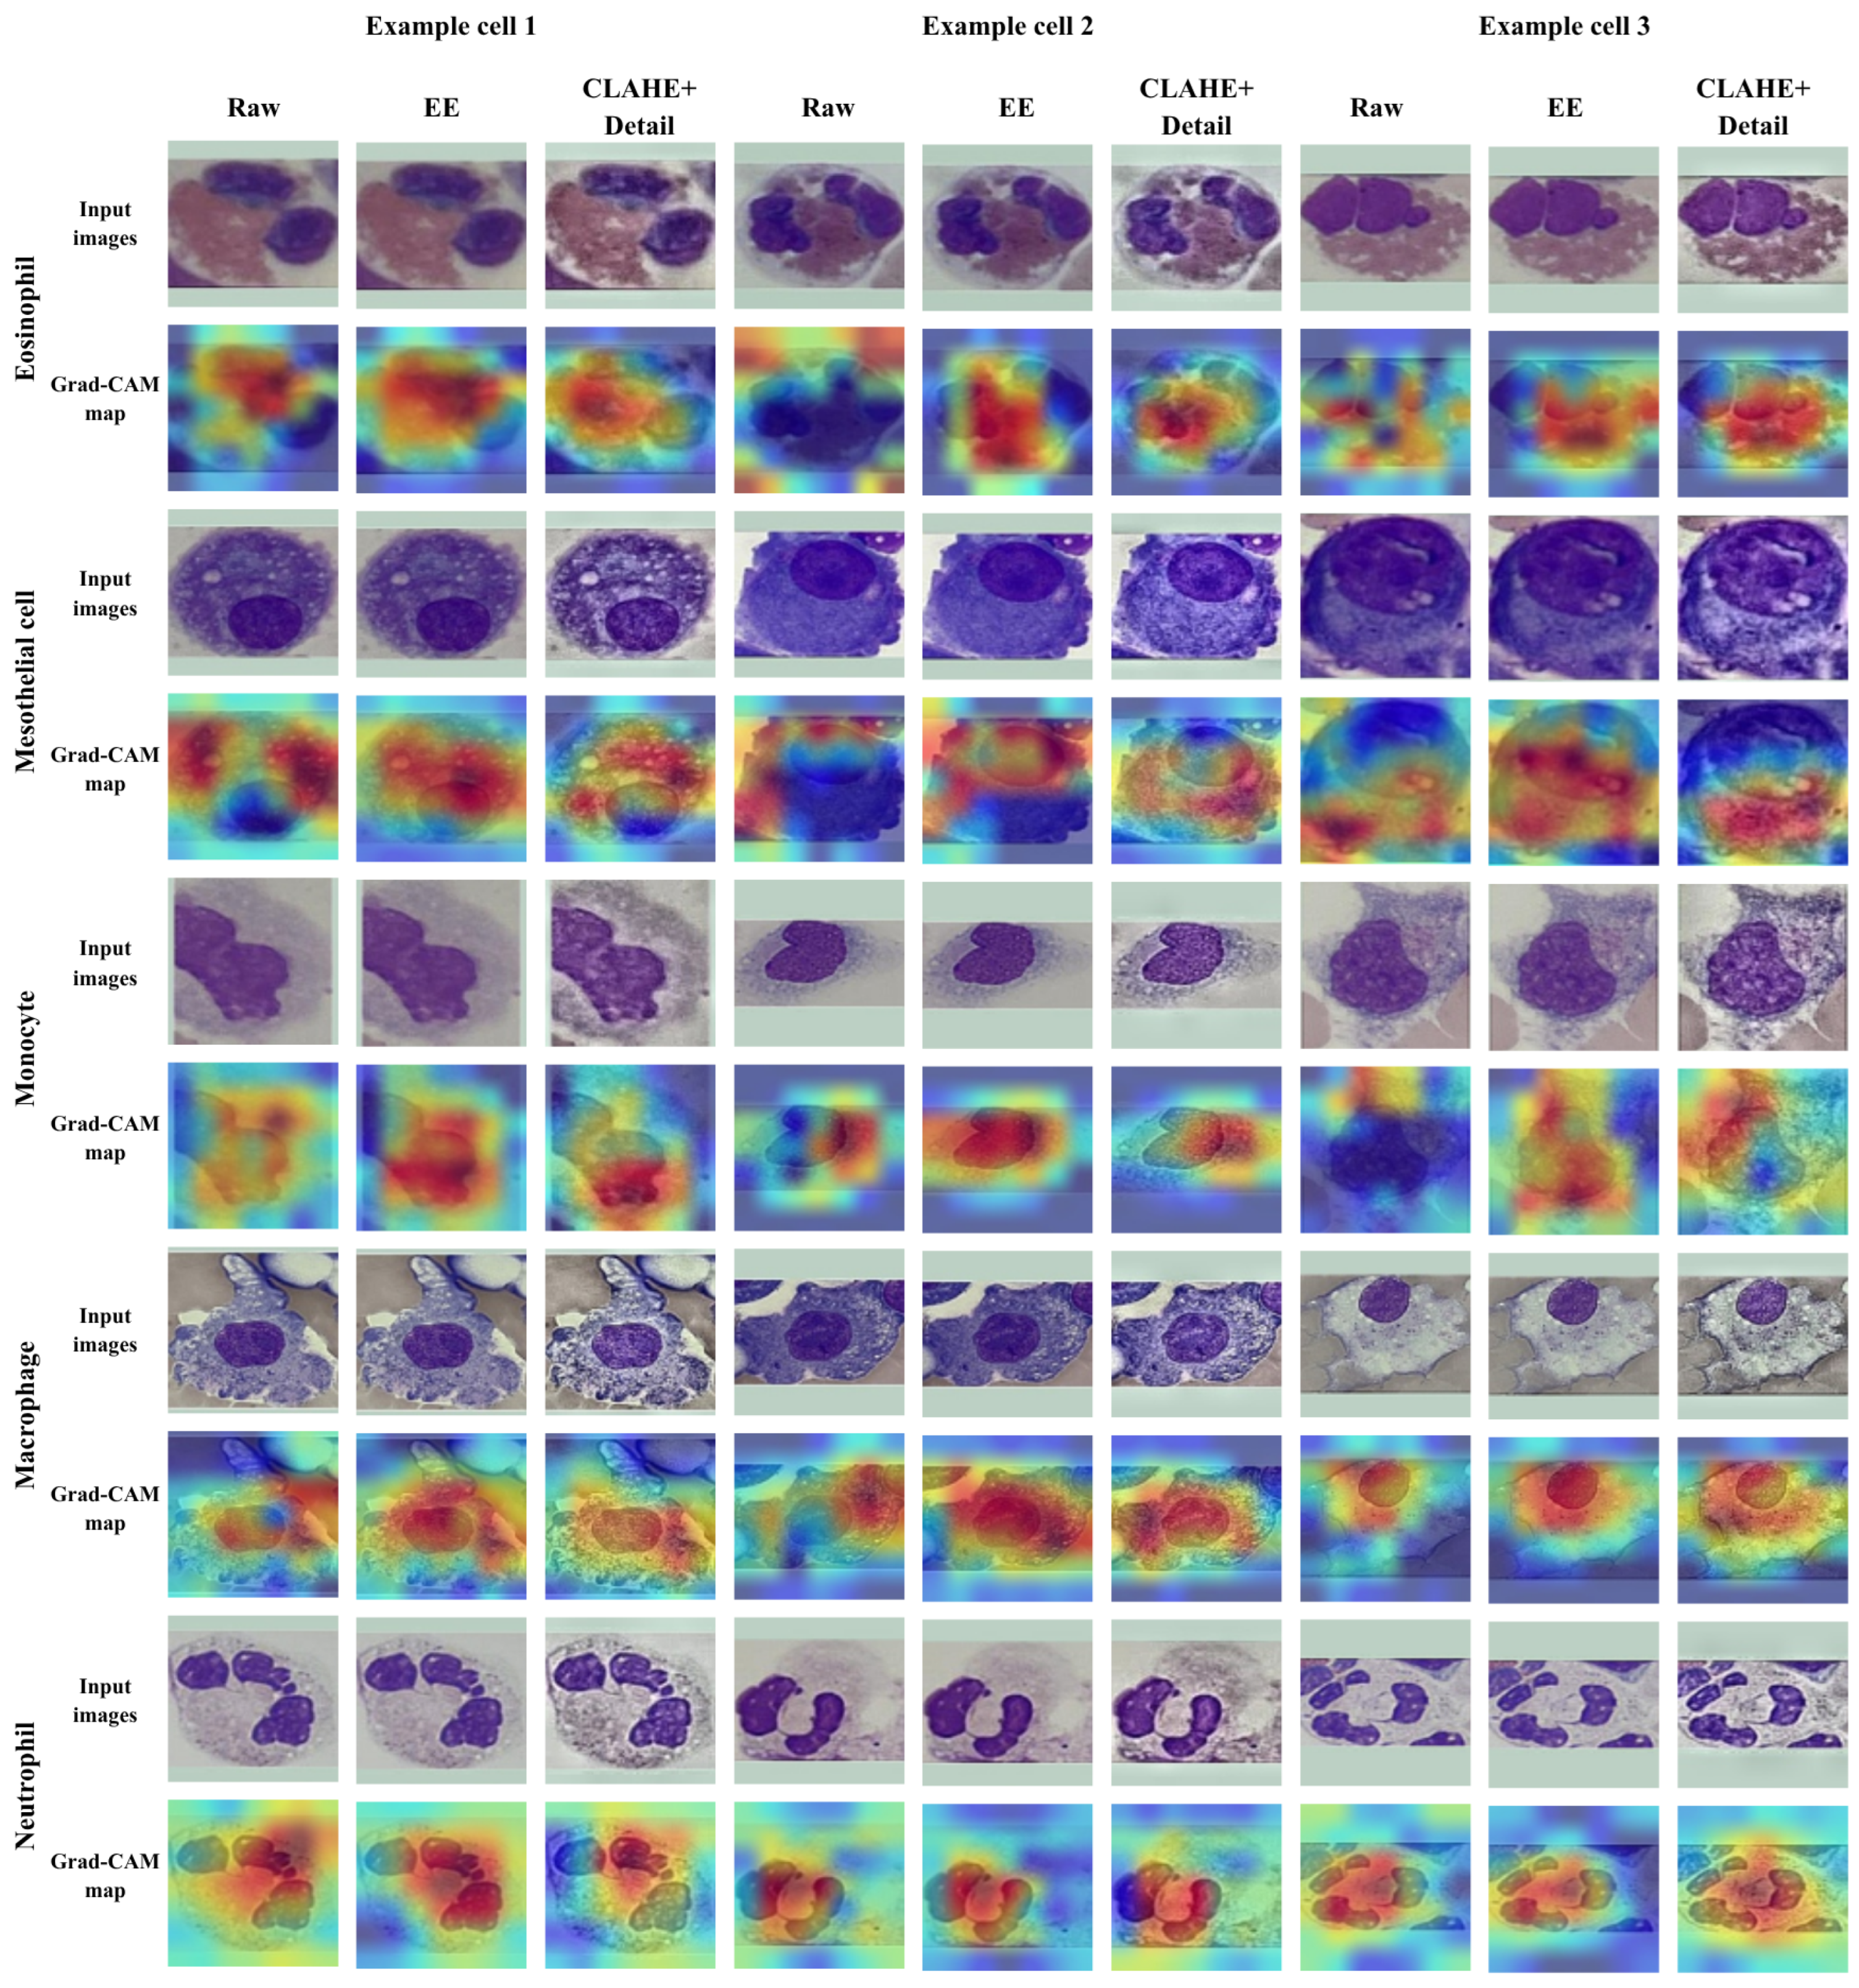
Gradient-weighted Class Activation Mapping (Grad-CAM) was used to provide visual interpretation of the model predictions [52]. This method highlights the image regions that contribute most strongly to the classification decision, allowing assessment of whether the model focuses on relevant cellular structures rather than background areas or irrelevant artifacts. In this study, Grad-CAM was applied to representative cell images processed using raw images, Edge Enhance, and Setting 1 (CLAHE + Detail), as shown in Figure 6.
The Grad-CAM results show that the model generally focused on the main cellular regions, including the nucleus, cytoplasm, and cell boundary areas. For cell types with more distinctive morphology, such as eosinophils and neutrophils, the highlighted regions were concentrated around characteristic cellular structures, suggesting that the model used relevant morphological information for classification. In contrast, for cells with more complex or overlapping morphology, such as monocytes, macrophages, and mesothelial cells, the activation areas appeared more dispersed across the cell region. This may reflect the greater difficulty of distinguishing these cell types based on subtle differences in nuclear shape, cytoplasmic texture, and staining patterns.
Comparing the preprocessing conditions, Edge Enhance tended to emphasize boundary-related regions, while Setting 1 appeared to provide clearer activation around both cell boundaries and internal cellular details. This suggests that combining local contrast enhancement with detail enhancement may help improve the visibility of discriminative structures used by the model. However, the Grad-CAM maps also indicate that preprocessing affects model attention differently depending on the cell type. Therefore, image enhancement should be selected carefully to improve feature visibility while preserving diagnostically relevant morphology.
Although Grad-CAM visualization showed that model activation was mainly concentrated on cellular regions rather than the green padding area, this analysis was qualitative. Therefore, the possible influence of padding cannot be completely excluded. Future studies should compare different padding strategies, including neutral-color padding, reflection padding, and background-matched padding.

4.6. Practical Implications

From an implementation perspective, the results suggest that more complex enhancement sequences are not necessarily preferable. Raw images achieved competitive performance in several experiments, indicating that the original microscopic images already contained sufficient discriminative information for CNN-based classification. This may indicate that modern CNN architectures are already relatively robust to moderate image-quality variations under the current experimental setup, or that image enhancement provides only limited practical benefit when the original images already contain sufficient discriminative cellular information. This may be because the cells were extracted into single-cell images, resized to a standardized input size, and classified using pretrained CNN architectures that are capable of learning low-level features such as edges, texture, color contrast, and local intensity patterns directly from the original images.
Another possible explanation is that some enhancement methods may modify the visual characteristics that are important for cell identification. In cytology, subtle differences in nuclear shape, cytoplasmic texture, granularity, and staining intensity are diagnostically meaningful. Strong contrast enhancement, sharpening, or repeated edge enhancement may amplify noise, create artificial boundaries, or change the natural appearance of cellular structures. This may explain why complex multi-step enhancement settings did not consistently improve performance and why Setting 3, which applied several sharpening and edge-enhancement operations sequentially, produced lower performance in several models. In this context, image enhancement should be viewed as a supportive preprocessing step rather than a universally beneficial procedure.
Therefore, the choice of preprocessing should depend on the quality of the input images, the target cell morphology, and the model architecture. If raw images are already of acceptable quality, avoiding unnecessary enhancement may be preferable because it reduces computational complexity, preserves the original cell morphology, and minimizes the risk of introducing artifacts. Simple enhancement settings may be more suitable when they provide measurable improvement while preserving diagnostically relevant structures [43]. For practical laboratory implementation, the selected preprocessing method should balance classification performance, morphological preservation, processing complexity, and ease of integration into the workflow.
This finding is consistent with the broader principle that input data quality is important for the reliability of healthcare AI systems. For example, in cardiac monitoring systems, signal quality assessment and contextual information have been used to reduce false alarms and improve system reliability [53,54]. Similarly, in automated body fluid cell classification, improving image quality before model training may help increase the reliability of model predictions. Therefore, preprocessing methods used in laboratory decision-support systems should be easy to reproduce, computationally efficient, and unlikely to alter diagnostically relevant cell morphology.
In future laboratory implementation, the proposed approach could be considered as part of a computer-aided cytology support system after further validation. To support reliable use, standardized image-acquisition guidelines would first be required, including microscope settings, magnification, focus, camera angle, and staining consistency. Microscopic images captured under these guidelines could then be processed by the selected enhancement method before single-cell regions are classified by the model. A possible future workflow may involve integration with a web-based application connected to microscope image acquisition, allowing users to upload or capture cell images and receive preliminary cell-type predictions. However, the current study did not include disease-level diagnosis, malignant/benign classification, or external validation across institutions, microscopes, cameras, or staining protocols. Therefore, the proposed approach should be interpreted as an assistive cell-type classification framework for future development, not as a clinically validated diagnostic system or a replacement for expert cytological interpretation.

5. Conclusions

This study investigated the effect of image quality enhancement techniques on deep learning-based classification of body fluid cell images. A total of 13 cell types were classified using four convolutional neural network architectures: MobileNetV3, DenseNet121, ResNet50, and EfficientNetB3. Nine individual image enhancement filters and five combined enhancement settings were evaluated to determine whether preprocessing could improve classification performance compared with raw images.
The results showed that image enhancement influenced classification performance, but its effect varied depending on the enhancement technique, deep learning architecture, and training data condition. For the individual-filter experiments using the original non-augmented data, the best-performing filter differed across models, and the reconstructed contingency-table analysis showed no statistically significant difference among filters for any architecture. This suggests that, under the original data condition, the observed differences among individual filters were relatively small. After applying augmentation and class balancing to the training set, the effect of image enhancement became more evident. DenseNet121 with Edge Enhance achieved the highest overall performance among the individual-filter experiments, with an accuracy of 83.36% and F1-score of 83.08%. Statistically significant differences among filters were observed for MobileNetV3, DenseNet121, and EfficientNetB3, although the best filter remained architecture-dependent.
For the combined enhancement settings, simple combinations were generally more effective than complex multi-step enhancement sequences. Using the original non-augmented data, ResNet50 with Setting 1 (CLAHE + Detail) achieved the highest combined-setting performance, with an accuracy of 82.32% and F1-score of 81.86%. Using the augmented and balanced training data, DenseNet121 with Setting 1 achieved the best combined-setting result, with an accuracy of 83.01% and F1-score of 82.54%. However, this did not exceed the best single-filter result obtained by DenseNet121 with Edge Enhance. In addition, Setting 3, which applied multiple sharpening and edge-enhancement operations, generally produced lower performance, indicating that excessive enhancement may introduce artificial boundaries, amplify noise, or distort useful cellular information. Overall, these findings suggest that image enhancement can support body fluid cell classification, but the most suitable preprocessing strategy should be selected according to the model architecture and data condition. Simple and balanced enhancement methods appear to be more appropriate than aggressive multi-step enhancement settings.
This study has several limitations that suggest directions for future research. First, the original image records did not include information on the anatomical source of each body fluid specimen, preventing specimen-specific performance analysis. Future work should include disease-level and patient-level metadata to evaluate whether image-based cell-type classification can support clinically relevant tasks, such as malignant versus benign cell recognition. In addition, external validation using datasets from different institutions, microscopes, cameras, and staining protocols is necessary to assess model robustness. Second, although data augmentation and random undersampling were applied to address class imbalance, rare but clinically important cell types, particularly Signet-Ring Cells, remained underrepresented. Expanding rare cell collections from multiple institutions would further improve model robustness and generalizability. Third, the annotation strategy focused on cell type classification rather than direct categorization of normal and abnormal cells. Therefore, the proposed model should be considered a tool for automated cell identification and laboratory workflow support rather than a standalone diagnostic system. Nevertheless, accurate cell type recognition provides an important foundation for future AI-assisted abnormal cell screening and malignancy detection. This study used a fixed training configuration for all models and enhancement conditions to support fair comparison. However, hyperparameter sensitivity analysis was not performed. Therefore, the relative performance of different enhancement methods may vary under alternative learning rates, weight-decay settings, or fine-tuning strategies. Future work should include systematic hyperparameter tuning and sensitivity analysis.
Overall, this study provides a controlled comparative evaluation of image enhancement techniques for deep learning-based body-fluid cell classification. The results suggest that selected enhancement methods may provide modest performance benefits under the current single-institution imaging conditions; however, raw images also achieved comparable performance in several settings. Therefore, image enhancement should be considered a supportive preprocessing step rather than a universally necessary requirement for CNN-based classification. Among the evaluated methods, CLAHE-based preprocessing and selected simple enhancement approaches showed competitive performance, while more complex enhancement pipelines offered limited additional benefit. However, because this study did not include external validation, patient-level diagnosis, or malignant/benign classification, the findings should not be interpreted as evidence of clinical deployment readiness. Future studies should use larger multi-center datasets, standardized image-acquisition protocols, and clinically oriented diagnostic tasks to further evaluate the generalizability and practical utility of AI-assisted body-fluid cytology systems.

Author Contributions

Conceptualization, T.T. and P.S.; methodology, T.T., K.K. and K.S.; software, T.T. and K.K.; validation, T.T., K.K. and N.C. (Nittaya Chemkomnerd); formal analysis, T.T. and K.S.; investigation, T.T., K.K., N.C. (Nittaya Chemkomnerd) and N.C. (Nawarerk Chalarak); resources, P.S., C.K. and K.T.; data curation, K.K., C.K. and N.C. (Nawarerk Chalarak); writing—original draft preparation, TT., K.K. and N.C. (Nittaya Chemkomnerd); writing—review and editing, T.T., P.S., N.C. (Nawarerk Chalarak), K.S. and K.T.; visualization, K.K.; supervision, T.T. and P.S.; project administration, T.T.; funding acquisition, P.S. All authors have read and agreed to the published version of the manuscript.

Funding

This study was supported by Thammasat University Research Fund, Contract No. TUFT 056/2569.

Institutional Review Board Statement

The study was conducted in accordance with the Declaration of Helsinki, and approved by the Institutional Review Board of the Human Research Ethics Committee of Thammasat University (Science), COA No. 120/2567.

Data Availability Statement

The data used in this study are not publicly available due to privacy and ethical restrictions but may be available from the corresponding author upon reasonable request and approval from the relevant authority.

Acknowledgments

The authors also acknowledge the support of computational resources, research infrastructure, and technical facilities provided by the Thammasat University Research Unit in Data Innovation and Artificial Intelligence. During the preparation of this manuscript, the authors used ChatGPT 5.5 for the purposes of generating text in manuscript. The authors have reviewed and edited the output and take full responsibility for the content of this publication.

Conflicts of Interest

The authors declare no conflicts of interest.

References

  1. Malhotra, S.; Miras, M.C.M.; Pappolla, A.; Montalban, X.; Comabella, M. Liquid biopsy in neurological diseases. Cells 2023, 12, 1911. [Google Scholar] [CrossRef] [PubMed]
  2. Xie, X.; Fu, C.C.; Lv, L.; Ye, Q.; Yu, Y.; Fang, Q.; Zhang, L.; Hou, L.; Wu, C. Deep convolutional neural network-based classification of cancer cells on cytological pleural effusion images. Mod. Pathol. 2022, 35, 609–614. [Google Scholar] [CrossRef] [PubMed]
  3. Lin, Y.J.; Chao, T.K.; Khalil, M.A.; Lee, Y.C.; Hong, D.Z.; Wu, J.J.; Wang, C.W. Deep learning fast screening approach on cytological whole slides for thyroid cancer diagnosis. Cancers 2021, 13, 3891. [Google Scholar] [CrossRef] [PubMed]
  4. Ali, M.; Benfante, V.; Basirinia, G.; Alongi, P.; Sperandeo, A.; Quattrocchi, A.; Giannone, A.G.; Cabibi, D.; Yezzi, A.; Di Raimondo, D.; et al. Applications of artificial intelligence, deep learning, and machine learning to support the analysis of microscopic images of cells and tissues. J. Imaging 2025, 11, 59. [Google Scholar] [CrossRef] [PubMed]
  5. Tanantong, T.; Chalarak, N.; Pandecha, P.; Tanantong, K.; Srijiranon, K. Mobile-Based Deep Learning Framework for Classifying Common Skin Diseases in Thailand. ICIC Express Lett. Part B Appl. ICIC Int. 2024, 15, 495–503. [Google Scholar]
  6. Tanantong, T.; Chalarak, N.; Jirattisak, S.; Tanantong, K.; Srijiranon, K. A study on area assessment of psoriasis lesions using image augmentation and deep learning: Addressing the lack of thai skin disease data. J. Curr. Sci. Technol. 2025, 15, 119. [Google Scholar] [CrossRef]
  7. Saidani, O.; Umer, M.; Alturki, N.; Alshardan, A.; Kiran, M.; Alsubai, S.; Kim, T.H.; Ashraf, I. White blood cells classification using multi-fold pre-processing and optimized CNN model. Sci. Rep. 2024, 14, 3570. [Google Scholar] [CrossRef] [PubMed]
  8. Hussein, M.; El-Mougi, F.A.E.S.Z. Integrating deep learning and transfer learning: Optimizing white blood cells classification in medical educational institutions. J. Big Data 2025, 12, 189. [Google Scholar] [CrossRef]
  9. Sharma, S.; Asotra, S.; Asotra, S. Cytomorphological analysis of effusion fluids for detection of malignant cells in a tertiary care hospital in northern India. J. Cancer Res. Ther. 2023, 19, S628–S632. [Google Scholar] [CrossRef] [PubMed]
  10. Li, M.; Lin, C.; Ge, P.; Li, L.; Song, S.; Zhang, H.; Lu, L.; Liu, X.; Zheng, F.; Zhang, S.; et al. A deep learning model for detection of leukocytes under various interference factors. Sci. Rep. 2023, 13, 2160. [Google Scholar] [CrossRef] [PubMed]
  11. Bonab, Z.A.; Shamekhi, S.; Talebi, M. Deep learning-based bone marrow cytology classification: A solution to class imbalance. Biomed. Signal Process. Control 2026, 111, 108247. [Google Scholar] [CrossRef]
  12. Uysal, E. Statistical performance evaluation of the deep learning architectures over body fluid cytology images. IEEE Access 2025, 13, 82540–82553. [Google Scholar] [CrossRef]
  13. Mehmood, S.; Shahzad, T.; Zubair, M.; Khan, F.M.; Khan, M.A.; Ouahada, K.; Gandomi, A.H. Improved leukocyte classification in bone marrow cytology using convolutional neural network with contrast enhancement. Sci. Rep. 2025, 15, 30466. [Google Scholar] [CrossRef] [PubMed]
  14. Ren, W.; Zhu, Y.; Wang, Q.; Jin, H.; Guo, Y.; Lin, D. Deep learning-based classification and targeted gene alteration prediction from pleural effusion cell block whole-slide images. Cancers 2023, 15, 752. [Google Scholar] [CrossRef] [PubMed]
  15. Verma, G.; Barthwal, A. Attention-enhanced deep learning for cervical cytology: Combining convolutional networks with multi-head attention and fuzzy logic. Pol. J. Radiol. 2025, 90, e414. [Google Scholar] [CrossRef] [PubMed]
  16. Mavropoulos, A.; Johnson, C.; Lu, V.; Nieto, J.; Schneider, E.C.; Saini, K.; Phelan, M.L.; Hsie, L.X.; Wang, M.J.; Cruz, J.; et al. Artificial intelligence-driven morphology-based enrichment of malignant cells from body fluid. Mod. Pathol. 2023, 36, 100195. [Google Scholar] [CrossRef] [PubMed]
  17. Otto, F.; Harrer, C.; Pilz, G.; Wipfler, P.; Harrer, A. Role and relevance of cerebrospinal fluid cells in diagnostics and research: State-of-the-art and underutilized opportunities. Diagnostics 2021, 12, 79. [Google Scholar] [CrossRef] [PubMed]
  18. Fleming, C.; Russcher, H.; Lindemans, J.; de Jonge, R. Clinical relevance and contemporary methods for counting blood cells in body fluids suspected of inflammatory disease. Clin. Chem. Lab. Med. 2015, 53, 1689–1706. [Google Scholar] [CrossRef] [PubMed]
  19. Mostafa, H.K. Different cells of the human body: Categories and morphological characters. J. Microsc. Ultrastruct. 2022, 10, 40–46. [Google Scholar] [CrossRef] [PubMed]
  20. Warjri, S.B.; Ete, T.; Mobing, H.; Naku, N.; Fanai, V.; Khan, S.A.; Kumar, A.; Mishra, A. Eosinophilic pleural effusion as a manifestation of taeniasis. Autops. Case Rep. 2020, 10, e2020195. [Google Scholar] [CrossRef] [PubMed]
  21. Li, C.; Kazzaz, F.I.; Scoon, J.M.; Estrada-Y-Martin, R.M.; Cherian, S.V. Lymphocyte predominant exudative pleural effusions: A narrative review. Shanghai Chest 2022, 6, 5. [Google Scholar] [CrossRef]
  22. Bon, E. Classical Methods for Studying the Structure of Cells. Biomed. J. Sci. Tech. Res. 2023, 50, 42029–42034. [Google Scholar] [CrossRef]
  23. Shidham, V.B. Diagnostic pitfalls in effusion fluid cytology. Cytojournal 2021, 18, 33. [Google Scholar] [CrossRef] [PubMed]
  24. Zhu, H.; Khattab, R.; Ondrejka, S.L.; Reynolds, J.P. Signet-ring cells in pleural and peritoneal effusions identified on Wright stains–A diagnostic pitfall. Cytojournal 2022, 19, 12. [Google Scholar] [CrossRef] [PubMed]
  25. Bertram, C.A.; Aubreville, M.; Donovan, T.A.; Bartel, A.; Wilm, F.; Marzahl, C.; Assenmacher, C.A.; Becker, K.; Bennett, M.; Corner, S.; et al. Computer-assisted mitotic count using a deep learning–based algorithm improves interobserver reproducibility and accuracy. Vet. Pathol. 2022, 59, 211–226. [Google Scholar] [PubMed]
  26. Vu, A.Q.; Bui, H.Q.; Nguyen, L.T.; Le, T.N. DCT-Based White Blood Cell Image Enhancement for Recognition Using Deep Learning. IEEE Access 2024, 12, 171571–171588. [Google Scholar] [CrossRef]
  27. Ahmad, R.; Awais, M.; Kausar, N.; Akram, T. White blood cells classification using entropy-controlled deep features optimization. Diagnostics 2023, 13, 352. [Google Scholar] [CrossRef] [PubMed]
  28. Devi, T.G.; Patil, N.; Rai, S.; Philipose, C.S. Gaussian blurring technique for detecting and classifying acute lymphoblastic leukemia cancer cells from microscopic biopsy images. Life 2023, 13, 348. [Google Scholar] [CrossRef] [PubMed]
  29. Oybek Kizi, R.F.; Theodore Armand, T.P.; Kim, H.C. A review of deep learning techniques for leukemia cancer classification based on blood smear images. Appl. Biosci. 2025, 4, 9. [Google Scholar] [CrossRef]
  30. Mishra, S.; Vishwakarma, A.; Kumar, A. Nuclei Segmentation using Multi-headed U-Net and Shearlet based Unsharp Masking. IEEE Trans. Artif. Intell. 2025, 7, 297–307. [Google Scholar]
  31. Benhari, M.; Hossseini, R. An Improved Fuzzy Deep Learning (IFDL) model for managing uncertainty in classification of pap-smear cell images. Intell. Syst. Appl. 2022, 16, 200133. [Google Scholar] [CrossRef]
  32. Xu, T.; Theera-Umpon, N.; Auephanwiriyakul, S. Staining-Independent Malaria Parasite Detection and Life Stage Classification in Blood Smear Images. Appl. Sci. 2024, 14, 8402. [Google Scholar] [CrossRef]
  33. Park, H.S.; Chong, Y.; Lee, Y.; Yim, K.; Seo, K.J.; Hwang, G.; Kim, D.; Gong, G.; Cho, N.H.; Yoo, C.W.; et al. Deep learning-based computational cytopathologic diagnosis of metastatic breast carcinoma in pleural fluid. Cells 2023, 12, 1847. [Google Scholar] [CrossRef] [PubMed]
  34. Jiang, L.; Niu, G.; Liu, Y.; Yu, W.; Wu, H.; Xie, Z.; Ren, M.X.; Quan, Y.; Jiang, Z.; Zhao, G.; et al. Establishment and Verification of Neural Network for Rapid and Accurate Cytological Examination of Four Types of Cerebrospinal Fluid Cells. Front. Med. 2022, 8, 749146. [Google Scholar] [CrossRef]
  35. Kaur, P.; Kalra, A.S.; Bhattacherjee, A.; Brar, R.; Kaushik, P. Blood Cell Classification for Cancer Detection Using EfficientNetB3. In Proceedings of the 2025 2nd International Conference on Integration of Computational Intelligent System (ICICIS); IEEE: Piscataway, NJ, USA, 2025; pp. 1–5. [Google Scholar]
  36. Khiruddin, K.; Mustafa, W.A.; Islam, M.A.; Jamaludin, K.R.; Alquran, H.; Rahman, K.S.A. Comparative analysis of cervical cancer classification of DPAGCHE-enhanced Pap smear images using convolutional neural network models. PLoS ONE 2025, 20, e0330103. [Google Scholar] [CrossRef] [PubMed]
  37. Alsalatie, M.; Alquran, H.; Mustafa, W.A.; Mohd Yacob, Y.; Ali Alayed, A. Analysis of cytology pap smear images based on ensemble deep learning approach. Diagnostics 2022, 12, 2756. [Google Scholar] [CrossRef] [PubMed]
  38. Srijiranon, K.; Varisthanist, N.; Tanantong, T. A Study of SimCLR-Based Self-Supervised Learning for Acne Severity Grading Under Label-Scarce Conditions. Technologies 2026, 14, 116. [Google Scholar] [CrossRef]
  39. Chomean, S.; Khemtonglang, N.; Mukda, E.; Kaset, C. AI-Powered Body Fluid Cell Classification: Development and Validation Using Roboflow and YOLOv11n Framework. Telemat. Inform. Rep. 2025, 19, 100243. [Google Scholar] [CrossRef]
  40. Gao, L.; Zhang, L.; Liu, C.; Wu, S. Handling imbalanced medical image data: A deep-learning-based one-class classification approach. Artif. Intell. Med. 2020, 108, 101935. [Google Scholar] [CrossRef] [PubMed]
  41. Alomar, K.; Aysel, H.I.; Cai, X. Data augmentation in classification and segmentation: A survey and new strategies. J. Imaging 2023, 9, 46. [Google Scholar] [CrossRef] [PubMed]
  42. Liu, X.; Karagoz, G.; Meratnia, N. Analyzing the impact of data augmentation on the explainability of deep learning-based medical image classification. Mach. Learn. Knowl. Extr. 2024, 7, 1. [Google Scholar] [CrossRef]
  43. Murcia-Gomez, D.; Rojas-Valenzuela, I.; Valenzuela, O. Impact of image preprocessing methods and deep learning models for classifying histopathological breast cancer images. Appl. Sci. 2022, 12, 11375. [Google Scholar] [CrossRef]
  44. Zhang, H.; Lin, X.; Huang, Y.; Wang, M.; Cen, C.; Tang, S.; Dique, M.R.; Cai, L.; Luis, M.A.; Smollar, J.; et al. Detection methods and clinical applications of circulating tumor cells in breast cancer. Front. Oncol. 2021, 11, 652253. [Google Scholar] [CrossRef] [PubMed]
  45. Babatunde, A.N.; Aroba, O.J.; Adeniyi, A.E.; Isiaka, S.O.; Abdulrahman, T.A.; Kadri, A.F.; Mohammed, S.B.; Rudolph, M. Joint segmentation and classification of cervical cells using U-Net and CNN ensemble for early detection of cervical cancer. Cancer Cell Int. 2026, 26, 148. [Google Scholar] [CrossRef] [PubMed]
  46. Liu, R.; Dai, W.; Wu, T.; Wang, M.; Wan, S.; Liu, J. AIMIC: Deep learning for microscopic image classification. Comput. Methods Programs Biomed. 2022, 226, 107162. [Google Scholar] [CrossRef] [PubMed]
  47. Mondal, S.K.; Talukder, M.S.H.; Aljaidi, M.; Sulaiman, R.B.; Tushar, M.M.S.; Alsuwaylimi, A.A. Efficient blood cell classification from microscopic smear images using U-Net segmentation and a lightweight CNN. Sci. Rep. 2025, 15, 45693. [Google Scholar] [CrossRef] [PubMed]
  48. Islam, S.; Mahmud, M.Z.; Alve, S.R.; Chowdhury, M.M.U.; Oishe, F.I. Deep learning approach for enhancing oral squamous cell carcinoma with LIME explainable AI technique. In Proceedings of the 2024 27th International Conference on Computer and Information Technology (ICCIT); IEEE: Piscataway, NJ, USA, 2024; pp. 381–386. [Google Scholar]
  49. Cheuque, C.; Querales, M.; León, R.; Salas, R.; Torres, R. An efficient multi-level convolutional neural network approach for white blood cells classification. Diagnostics 2022, 12, 248. [Google Scholar] [CrossRef] [PubMed]
  50. Sathyanarayanan, S.; Tantri, B.R. Confusion matrix-based performance evaluation metrics. Afr. J. Biomed. Res. 2024, 27, 4023–4031. [Google Scholar] [CrossRef]
  51. Sun, H.; Cui, J.; Shao, Y.; Yang, J.; Xing, L.; Zhao, Q.; Zhang, L. A gastrointestinal image classification method based on improved adam algorithm. Mathematics 2024, 12, 2452. [Google Scholar] [CrossRef]
  52. Selvaraju, R.R.; Cogswell, M.; Das, A.; Vedantam, R.; Parikh, D.; Batra, D. Grad-CAM: Visual explanations from deep networks via gradient-based localization. Int. J. Comput. Vis. 2020, 128, 336–359. [Google Scholar]
  53. Tanantong, T.; Nantajeewarawat, E.; Thiemjarus, S. False alarm reduction in BSN-based cardiac monitoring using signal quality and activity type information. Sensors 2015, 15, 3952–3974. [Google Scholar] [CrossRef] [PubMed]
  54. Tanantong, T.; Nantajeewarawat, E.; Thiemjarus, S. Automatic electrocardiogram signal quality assessment in continuous wireless monitoring. Maejo Int. J. Sci. Technol. 2016, 10, 127. [Google Scholar]
Figure 1. Example of a body fluid microscopic image with annotated cells.
Biomedinformatics 06 00050 g001
Figure 2. Single-cell extraction using bounding box cropping and aspect-ratio-preserving padding.
Biomedinformatics 06 00050 g002
Figure 3. Example of excluded image: (a) image without visible cell. (b) incomplete cell image.
Biomedinformatics 06 00050 g003
Figure 4. Visual comparison of raw images and nine image enhancement filters across the 13 cell types.
Biomedinformatics 06 00050 g004
Figure 5. Architecture of the custom classification head used for body fluid cell classification.
Biomedinformatics 06 00050 g005
Figure 6. Grad-CAM visualization of representative cell images under different preprocessing conditions. For each cell type, raw, edge-enhanced, and CLAHE+Detail-enhanced images are shown with their corresponding Grad-CAM maps. Warmer colors indicate image regions that contributed more strongly to the model prediction.
Biomedinformatics 06 00050 g006
Table 2. Distribution of single-cell images across 13 labeled cell types.
No.Cell TypeNo. of Images%
1Abnormal mononuclear cell (AMC)430.19%
2Atypical lymphocyte (ATL)7133.23%
3Basophil (BASO)100.05%
4Cells stained dark blue with fused boundaries (CSDB)60.03%
5Eosinophil (EOS)3951.79%
6Lymphocyte (LYMPH)742033.63%
7Macrophage (MAC)473521.46%
8Mesothelial cell (MESO)9564.33%
9Mitotic cell (MIT)120.05%
10Monocyte (MONO)20799.42%
11Neutrophil (NEUT)566625.68%
12Plasma-cell (PLAS)180.08%
13Signet-ring cell (SRC)90.04%
Total22,062100%
Table 3. Distribution of body fluid cell images in the training, augmented training, and test sets.
No.Cell TypeOrg. TrainOrg. TestAug. Train
1Abnormal Mononuclear Cell (AMC)30132070
2Atypical Lymphocyte (ATL)4982151602
3Basophil (BASO)642094
4Cells Stained Dark Blue with Fused Boundaries (CSDB)422096
5Eosinophil (EOS)2761191824
6Lymphocyte (LYMPH)2100900
7Macrophage (MAC)2100900
8Mesothelial Cell (MESO)6572881443
9Mitotic Cell (MIT)752093
10Monocyte (MONO)1455624645
11Neutrophil (NEUT)2100900
12Plasma Cell (PLAS)1262088
13Signet-Ring Cell (SRC)632094
Total10,261397919,049
Table 4. Convolution kernel matrices used by Pillow ImageFilter operations.
FilterKernel SizeConvolution Kernel
Blur5 × 5 1 1 1 1 1 1 0 0 0 1 1 0 0 0 1 1 0 0 0 1 1 1 1 1 1
Edge Enhance3 × 3 1 1 1 1 9 1 1 1 1
Edge Enhance More3 × 3 0 1 0 1 10 1 0 1 0
Detail3 × 3 0 1 0 1 10 1 0 1 0
Sharpen3 × 3 2 2 2 2 32 2 2 2 2
Table 5. Model architectures and trainable parameters for MobileNetV3 and DenseNet121.
Layer BlockMobileNetV3DenseNet121
Output Shape No. of Parameters Output Shape No. of Parameters
Input224 × 224 × 30224 × 224 × 30
Backbone7 × 7 × 9602,996,3527 × 7 × 10247,037,504
GAP960010240
Block 1256247,040256263,424
Dropout25602560
Block 212833,40812833,408
Block 3131677131677
Total 3,278,477 7,336,013
GAP = Global Average Pooling; Block 1 = Dense (256) + Batch Normalization + ReLU; Block 2 = Dense (128) + Batch Normalization + ReLU; Block 3 = Dense (13) + Softmax.
Table 6. Model architectures and trainable parameters for ResNet50 and EfficientNetB3.
Layer BlockResNet50EfficientNetB3
Output Shape No. of Parameters Output Shape No. of Parameters
Input224 × 224 × 30224 × 224 × 30
Backbone7 × 7 × 204823,587,7127 × 7 × 153610,783,535
GAP2048015360
Block 1256525,568256394,496
Dropout25602560
Block 212833,40812833,408
Block 3131677131677
Total 24,148,365 11,213,116
GAP = Global Average Pooling; Block 1 = Dense (256) + Batch Normalization + ReLU; Block 2 = Dense (128) + Batch Normalization + ReLU; Block 3 = Dense (13) + Softmax.
Table 7. Training hyperparameters used in this study.
HyperparameterValue
Random seed42
Batch size128
Image size224 × 224 pixels
Pre-trained weightsImageNet
Loss functionCategorical cross-entropy
OptimizerAdamW
Learning rate0.0001
Patience10
Maximum epochs100
Early stopping monitorValidation loss
Minimum delta0.001
PoolingGlobalAveragePooling2D
Table 8. Performance comparison of deep learning models using individual image enhancement filters with the original non-augmented data.
FiltersMobileNetV3DenseNet121ResNet50EfficientNetB3
Acc. Prec. Rec. F1 Acc. Prec. Rec. F1 Acc. Prec. Rec. F1 Acc. Prec. Rec. F1
Raw80.7780.0180.7780.2879.8479.2279.8479.3381.2080.4681.2080.7279.4778.4779.4778.84
Blur80.1779.4080.1779.6177.7877.2777.7877.2479.9779.1579.9779.4378.6677.8478.6678.04
EE80.5279.7280.5279.9580.3779.8180.3779.8580.6079.8480.6080.0679.4278.5579.4278.85
EEM80.4279.6780.4279.9179.0978.3879.0978.5680.1279.2080.1279.5379.5978.7279.5979.04
Detail80.3279.5180.3279.8079.5978.9679.5979.0581.4080.6281.4080.9079.1778.3579.1778.62
Sharpen80.3579.5480.3579.8279.6779.6779.6779.1181.3880.5681.3880.8579.2978.2979.2978.65
UM80.5279.7080.5279.9779.4278.6779.4278.8581.1880.5281.1880.6379.8278.9079.8279.25
HE79.8978.9979.8979.3477.9177.4177.9177.3279.5478.9079.5479.0379.1978.3279.1978.59
FHE80.5579.6880.5579.9978.5177.6578.5177.9680.4579.6180.4579.9078.3477.3578.3477.62
CLAHE80.7279.9180.7280.2278.6877.8978.6478.0580.3279.3180.3279.7179.2978.5179.2978.75
Bold values indicate the highest performance achieved by each model.
Table 9. Performance comparison of deep learning models using individual image enhancement filters with the augmented and balanced training data.
FiltersMobileNetV3DenseNet121ResNet50EfficientNetB3
Acc. Prec. Rec. F1 Acc. Prec. Rec. F1 Acc. Prec. Rec. F1 Acc. Prec. Rec. F1
Raw79.5679.5879.8479.5681.9881.7481.9881.7681.8081.1881.8081.3079.8479.5879.8479.56
Blur79.1978.9179.5279.1680.8280.7081.1080.8280.3079.8380.3079.8679.5278.9179.5279.16
EE81.2581.2181.6881.2583.3683.2783.3683.0880.5280.1780.5280.1780.1279.7780.1279.75
EEM81.4581.0681.4581.0983.0482.6783.0482.5581.5081.2181.5080.8881.6881.2181.6881.25
Detail80.1279.7780.1279.7581.5581.4681.5581.4781.3380.9981.3380.8181.4581.0681.4581.09
Sharpen79.2478.9179.2478.9581.3381.1381.3380.8481.7581.2281.7581.2779.2278.9179.2478.95
UM80.7780.5680.7780.5281.8881.6281.8881.6081.7881.4481.7881.4680.7780.5680.7780.52
HE79.9979.8379.9979.7480.2280.6480.2280.1480.2279.6780.2279.6779.9979.8379.9979.74
FHE80.2780.0980.2780.0382.1881.8682.1881.7781.3380.9081.3380.7579.2979.6179.2979.07
CLAHE81.7881.3781.7881.4082.3182.5882.3181.9180.7280.1380.7280.1081.2580.9481.2580.93
Bold values indicate the highest performance achieved by each model.
Table 10. Performance comparison of deep learning models using combined image enhancement settings with the original non-augmented data.
SettingsMobileNetV3DenseNet121ResNet50EfficientNetB3
Acc. Prec. Rec. F1 Acc. Prec. Rec. F1 Acc. Prec. Rec. F1 Acc. Prec. Rec. F1
Setting 180.9880.1780.9880.4679.3778.5479.3778.7982.3281.5582.3281.8679.1978.3079.1978.60
Setting 281.0580.2581.0580.5381.0380.4181.0380.6180.3579.4880.3579.8079.3478.5879.3478.84
Setting 376.8375.9976.8376.0676.1575.2075.1575.4979.4778.6379.4778.8778.0877.3378.0877.49
Setting 480.5579.6880.5579.9978.3177.5978.3177.7280.1579.5080.1579.5779.5478.6479.5478.97
Setting 580.4079.4280.4079.7778.4677.6978.4677.8880.0279.3280.0279.4078.9178.0878.9178.30
Bold values indicate the highest performance achieved by each model.
Table 11. Performance comparison of deep learning models using combined image enhancement settings with the augmented and balanced training data.
SettingsMobileNetV3DenseNet121ResNet50EfficientNetB3
Acc. Prec. Rec. F1 Acc. Prec. Rec. F1 Acc. Prec. Rec. F1 Acc. Prec. Rec. F1
Setting 181.5381.2681.5381.1783.0182.6683.0182.5480.2279.5480.2279.6280.4780.1680.4780.14
Setting 280.4780.0680.4780.1581.5781.7181.5781.4680.0779.5880.0779.4780.3780.2080.3780.04
Setting 375.0777.1075.0774.8181.5881.7181.5881.4676.1277.5876.1276.0277.9879.0977.9878.22
Setting 480.8280.4580.8280.5080.7780.5480.7780.4780.5280.0480.5280.0580.3780.0980.3780.03
Setting 579.8279.5079.8279.5580.7280.6880.7280.4779.5279.1779.5279.1180.0779.8380.0779.81
Bold values indicate the highest performance achieved by each model.
Table 12. Class-wise classification performance of Raw, EE, and Setting 1 without standard deviation values.
Cell TypeRawEESetting 1
Prec. Rec. F1 Prec. Rec. F1 Prec. Rec. F1
AMC97.5498.7798.1597.6598.3798.0198.0998.9798.52
ATL94.3189.9092.0594.0890.5792.2994.2591.3392.76
BASO99.97100.0098.3799.9099.9799.93100.00100.00100.00
CSDB99.77100.0099.8899.53100.0099.7799.77100.0099.88
EOS99.7799.7399.7599.7799.7399.7599.7399.7399.73
LYMPH88.3294.5391.4088.5094.0491.1886.6894.5090.40
MAC78.7174.3076.4379.4179.4580.2379.8773.1376.28
MESO91.9592.5392.2392.7092.1092.3992.2592.9392.58
MIT99.70100.0099.8599.7899.9799.8799.77100.0099.88
MONO76.8576.2076.5176.4577.0076.7077.2476.5076.84
NEUT97.7698.6798.2197.9598.6798.3197.8598.4098.12
PLAS98.7899.3097.2498.5199.3098.9099.3799.7399.55
SRC99.8799.9799.9299.9799.9499.9599.90100.0099.95
Disclaimer/Publisher’s Note: The statements, opinions and data contained in all publications are solely those of the individual author(s) and contributor(s) and not of MDPI and/or the editor(s). MDPI and/or the editor(s) disclaim responsibility for any injury to people or property resulting from any ideas, methods, instructions or products referred to in the content.