Article

Comparative Evaluation of Time–Frequency Transformations and Pretrained CNN Models for EEG-Based Parkinson’s Disease Detection


1
Department of Information Science, University of North Texas, Denton, TX 76207, USA
2
School of Computer Science and Electronic Engineering, University of Essex, Colchester CO4 3SQ, UK
*
Author to whom correspondence should be addressed.
These authors contributed equally to this work.
BioMedInformatics 2026, 6(2), 12; https://doi.org/10.3390/biomedinformatics6020012
Submission received: 19 January 2026 / Revised: 26 February 2026 / Accepted: 3 March 2026 / Published: 9 March 2026
(This article belongs to the Section Methods in Biomedical Informatics)

Abstract

Background: Parkinson’s disease is a progressive neurodegenerative disorder. Early PD detection plays a key role in effective therapy. Electroencephalography is a neuroimaging technique used to analyze brain abnormalities, such as those seen in patients with PD. However, the complex nature of EEG data requires advanced signal processing and classification methods. Methods: This study systematically evaluates three time-frequency (TF) representation techniques, namely discrete wavelet transform (DWT), continuous wavelet transform (CWT), and synchrosqueezing transform (SST), along with four pretrained convolutional neural network architectures for EEG-based PD detection. The experiments were performed using the San Diego dataset. Image-wise and subject-wise 5-fold cross-validation were employed to assess performance and generalization capability. Results: CWT and SST consistently outperform DWT across all evaluated architectures in image-wise CV evaluation. At the image-wise level, the CWT-EfficientNet-B0 model achieved 97.28% accuracy for HC vs. PD-OFF classification, while SST-EfficientNet-B0 reached 97.26% accuracy for HC vs. PD-ON classification. In subject-wise evaluation, acceptable accuracies of up to 84% were achieved, indicating the ability of the framework in learning PD patterns for unseen subjects. Conclusions: These findings demonstrate that the choice of TF representation has a strong impact on classification performance and that lightweight CNN architectures can achieve high image-wise accuracy with reduced computational cost.

1. Introduction

Parkinson’s disease (PD) is among the most common neurological disorders today [1]. The primary cause is the progressive degeneration of dopaminergic neurons in the substantia nigra [2]. Tremor, stiffness, bradykinesia, and postural instability are among the motor symptoms caused by this degeneration [3]. Cognitive impairment, sleep issues, autonomic dysfunction, and psychiatric symptoms are among the non-motor symptoms of PD [4]. Because PD progresses slowly and cannot be reversed, early detection is crucial. An earlier diagnosis can support timely treatment and may slow functional decline [5].
Neurophysiological studies suggest that changes in cortical oscillations can occur years before clear clinical symptoms appear [6]. These early abnormalities create opportunities for earlier diagnosis. However, their detection requires sensitive biomarkers that can capture subtle functional changes before structural or metabolic alterations become visible in routine clinical imaging [7].
Neuroimaging methods, such as positron emission tomography (PET), computed tomography (CT), and magnetic resonance imaging (MRI), are frequently employed to assess brain structure and function in patients with PD [8]. Despite their clinical value, they have major limitations in terms of early screening and repeated monitoring. These methods are expensive and are not always accessible [9]. Although functional imaging techniques, such as single-photon emission computed tomography (SPECT) and functional magnetic resonance imaging (fMRI), can reveal brain activity, these types of medical imaging are operationally demanding and have limited temporal resolution [10]. These factors reduce their feasibility for widespread clinical deployment.
Electroencephalography (EEG) provides a practical alternative for studying brain function [11]. EEG is a noninvasive, portable, and low-cost neuroimaging technique. It measures brain electrical activity and is suitable for real-world applications [12]. The accessibility of EEG makes it a promising tool for detecting functional abnormalities that may occur before the onset of overt PD symptoms [13]. However, EEG signals are nonlinear, non-stationary, and high-dimensional. Therefore, advanced signal processing is required to extract clinically useful patterns [11].
Time–frequency (TF) representation methods provide effective tools for analyzing EEG signals [14]. Approaches such as the short-time Fourier transform (STFT), wavelet transforms, and synchrosqueezing transforms map EEG into joint TF domains [15,16,17]. This transformation allows the identification of abnormal oscillatory activity, altered synchronization, and spectral power changes related to PD. Representing EEG data as TF images enables the use of deep learning methods originally developed for image analysis [18].
Convolutional neural networks (CNNs) have demonstrated strong performance in medical image classification. This is because CNNs automatically learn hierarchical features [19]. CNNs are also increasingly used for EEG-based diagnosis by learning discriminative patterns from TF images [20]. However, many CNN models are pretrained on natural image datasets, such as ImageNet [21]. EEG TF images differ substantially from natural images in terms of texture and structure, which can reduce the effectiveness of transfer learning. In addition, several modern CNN architectures are computationally expensive and often require extensive fine-tuning to capture EEG-specific features [22].
Although EEG-based PD detection has gained increasing attention, there are important gaps in the literature. First, studies often use different datasets and preprocessing pipelines, which limits reproducibility and fair comparison. Second, systematic comparisons of TF representations in deep learning settings remain limited. Third, few studies have evaluated multiple pretrained CNN models under consistent experimental conditions. Finally, many studies do not explicitly consider ON and OFF medication states, even though medication can strongly affect neural activity and is clinically important for evaluating disease states and treatment effects.
To address these limitations, this study systematically evaluates TF representations and pretrained CNN models for EEG-based PD classification. We examined four pretrained architectures: EfficientNet-B0, ResNet-18, MobileNetV3-L, and ShuffleNet-V2. We combined these models with three TF methods: discrete wavelet transform (DWT) [23,24,25,26,27], continuous wavelet transform (CWT) [27,28], and synchrosqueezing transform (SST) [29,30,31,32]. Experiments were conducted on two clinically relevant tasks: healthy control (HC) subjects versus PD patients under medication (HC vs. PD-ON) and HC subjects versus PD patients without medication (HC vs. PD-OFF). We used stratified cross-validation (CV) and evaluated the performance by measuring the classification metrics. The objective of this study was to identify robust TF-CNN combinations for reliable PD detection.
The remainder of this paper is organized as follows. Section 2 describes the dataset and proposed methodology, including the TF methods and CNN architectures. Section 3 presents and discusses the results. The paper is concluded in Section 4.

2. Materials and Methods

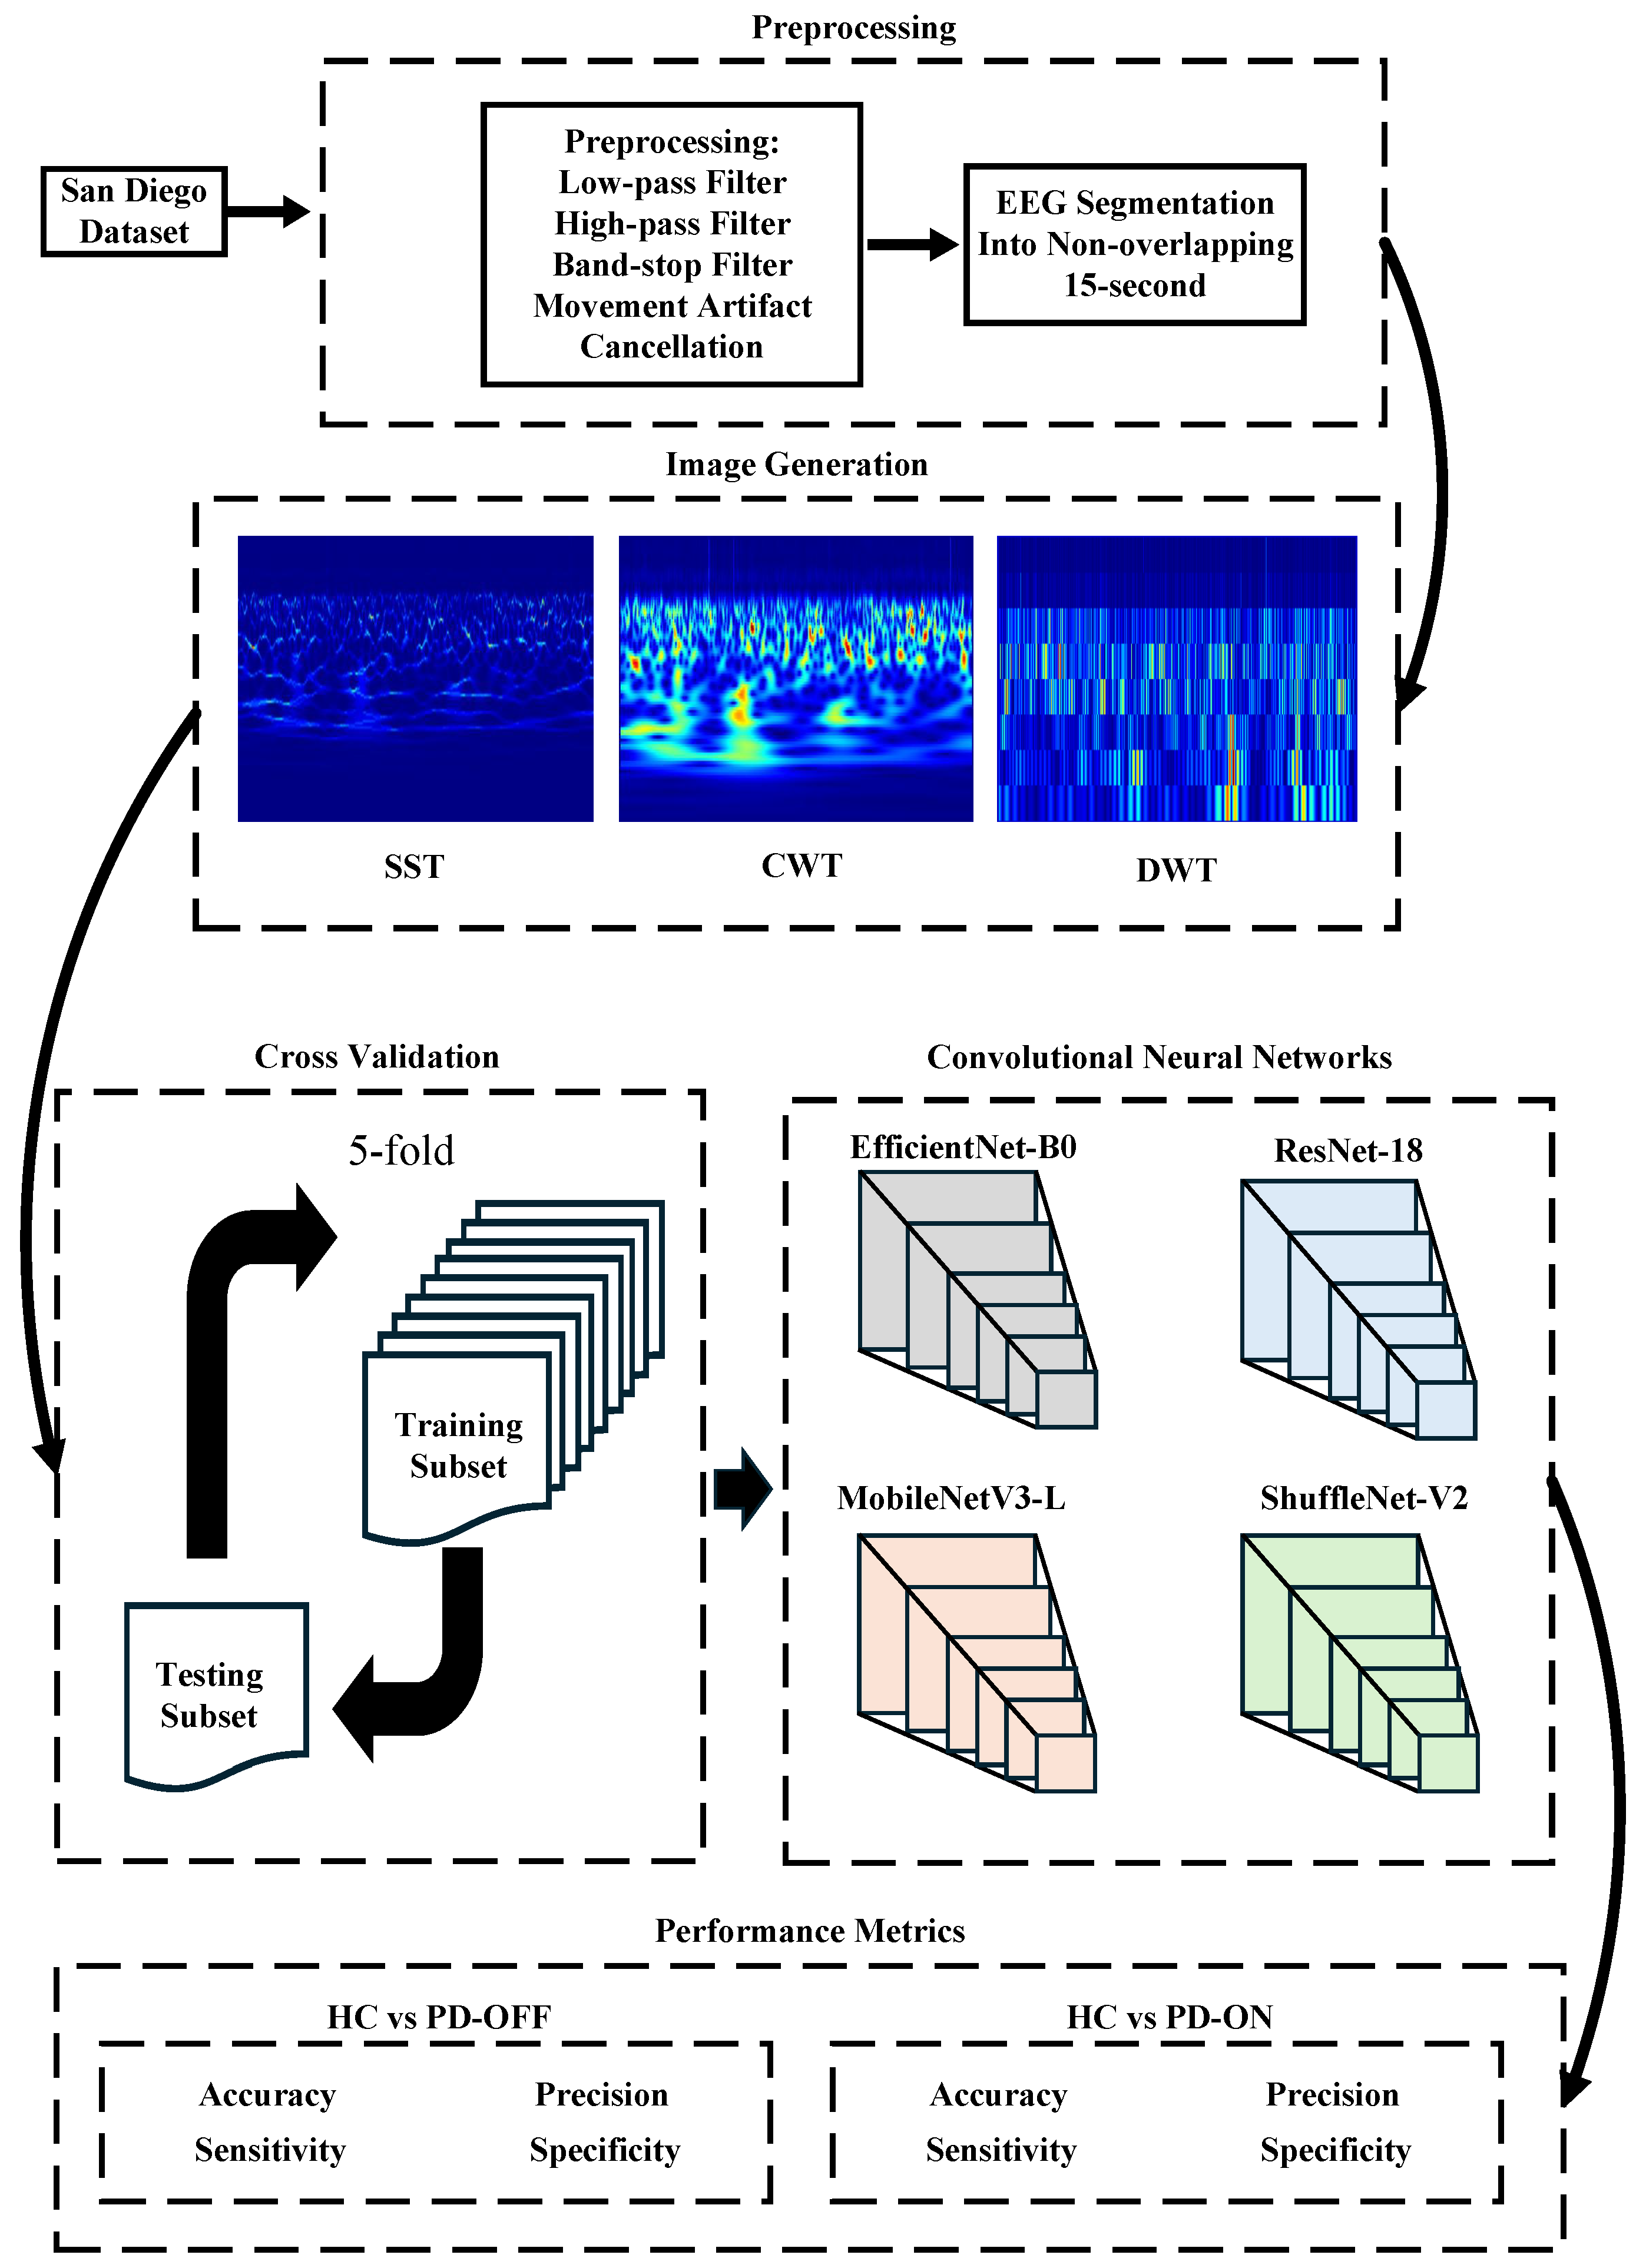
This section outlines the proposed method and the PD EEG dataset employed for the model evaluation. The overall framework of the proposed approach is shown in Figure 1. The TF implementations were carried out in MATLAB (2024a), while the deep learning implementations were performed in Python (3.12).

2.1. Dataset

This study utilized an EEG dataset acquired from the University of California, San Diego [33]. This publicly available dataset includes EEG recordings from 15 patients with PD and 16 HC subjects. Patients with PD were matched with HC subjects based on right-handedness, sex, age, and cognitive status. Cognitive ability was assessed using the Mini-Mental State Examination and North American Adult Reading Test. All patients were diagnosed with mild-to-moderate PD and classified as Stage II or Stage III according to the Hoehn and Yahr scale.
EEG recordings for patients with PD were obtained under two medication conditions, ON medication (PD-ON) and OFF medication (PD-OFF), on separate days. For the PD-ON condition, the patients followed their regular medication schedule. For the PD-OFF condition, medication was withdrawn for at least 12 h before recording. Both PD-ON and PD-OFF EEG data were collected from the same patient. The HC participants completed a single EEG recording session.
During data acquisition, the participants sat comfortably in a relaxed position. EEG signals were collected using a 32-channel setup for a minimum period of three minutes. The sampling frequency ( f s ) was set to 512 Hz. Comprehensive details regarding electrode positions, impedance verification, artifact rejection, preprocessing steps, and quality control metrics are available in the original publications associated with this dataset [33,34,35]. The demographic details of the San Diego dataset are summarized in Table 1.
Movement-related artifacts were removed using the preprocessing tools provided in EEGLAB [36]. Finite impulse response (FIR) filters were applied to the EEG data. A high-pass filter at 0.5 Hz was used to eliminate the baseline drift. A low-pass filter at 45 Hz was applied to suppress the high-frequency noise. Power-line interference was reduced using a notch filter at 60 Hz with a bandwidth of 57–63 Hz. All filtering procedures were performed using zero-phase forward and backward filtering via MATLAB’s filtfilt function.function to avoid phase distortion. Artifact Subspace Reconstruction (ASR), implemented in the EEGLAB toolbox using customized thresholds, was employed to cancel movement-related artifacts.
To ensure consistent processing across both datasets, the sampling frequency of all EEG recordings was confirmed to be 512 Hz. After filtering, the multichannel EEG signals were segmented into non-overlapping segments of 15 s. To reduce scale-related noise and enhance signal quality, multiscale principal component analysis was applied to each 15-s EEG segment. This step was implemented using the MATLAB function, wmulden. For the HC group (16 subjects), an average of 318 ± 42 images per subject were generated, resulting in a total of 5088 images. For the PD-ON group (15 subjects), an average of 375 ± 38 images per subject were obtained (5632 total images), while the PD-OFF group yielded an average of 361 ± 35 images per subject (5408 total images). The variation in image count across subjects reflects differences in recording duration and artifact rejection rates during preprocessing.

2.2. Time–Frequency Representations

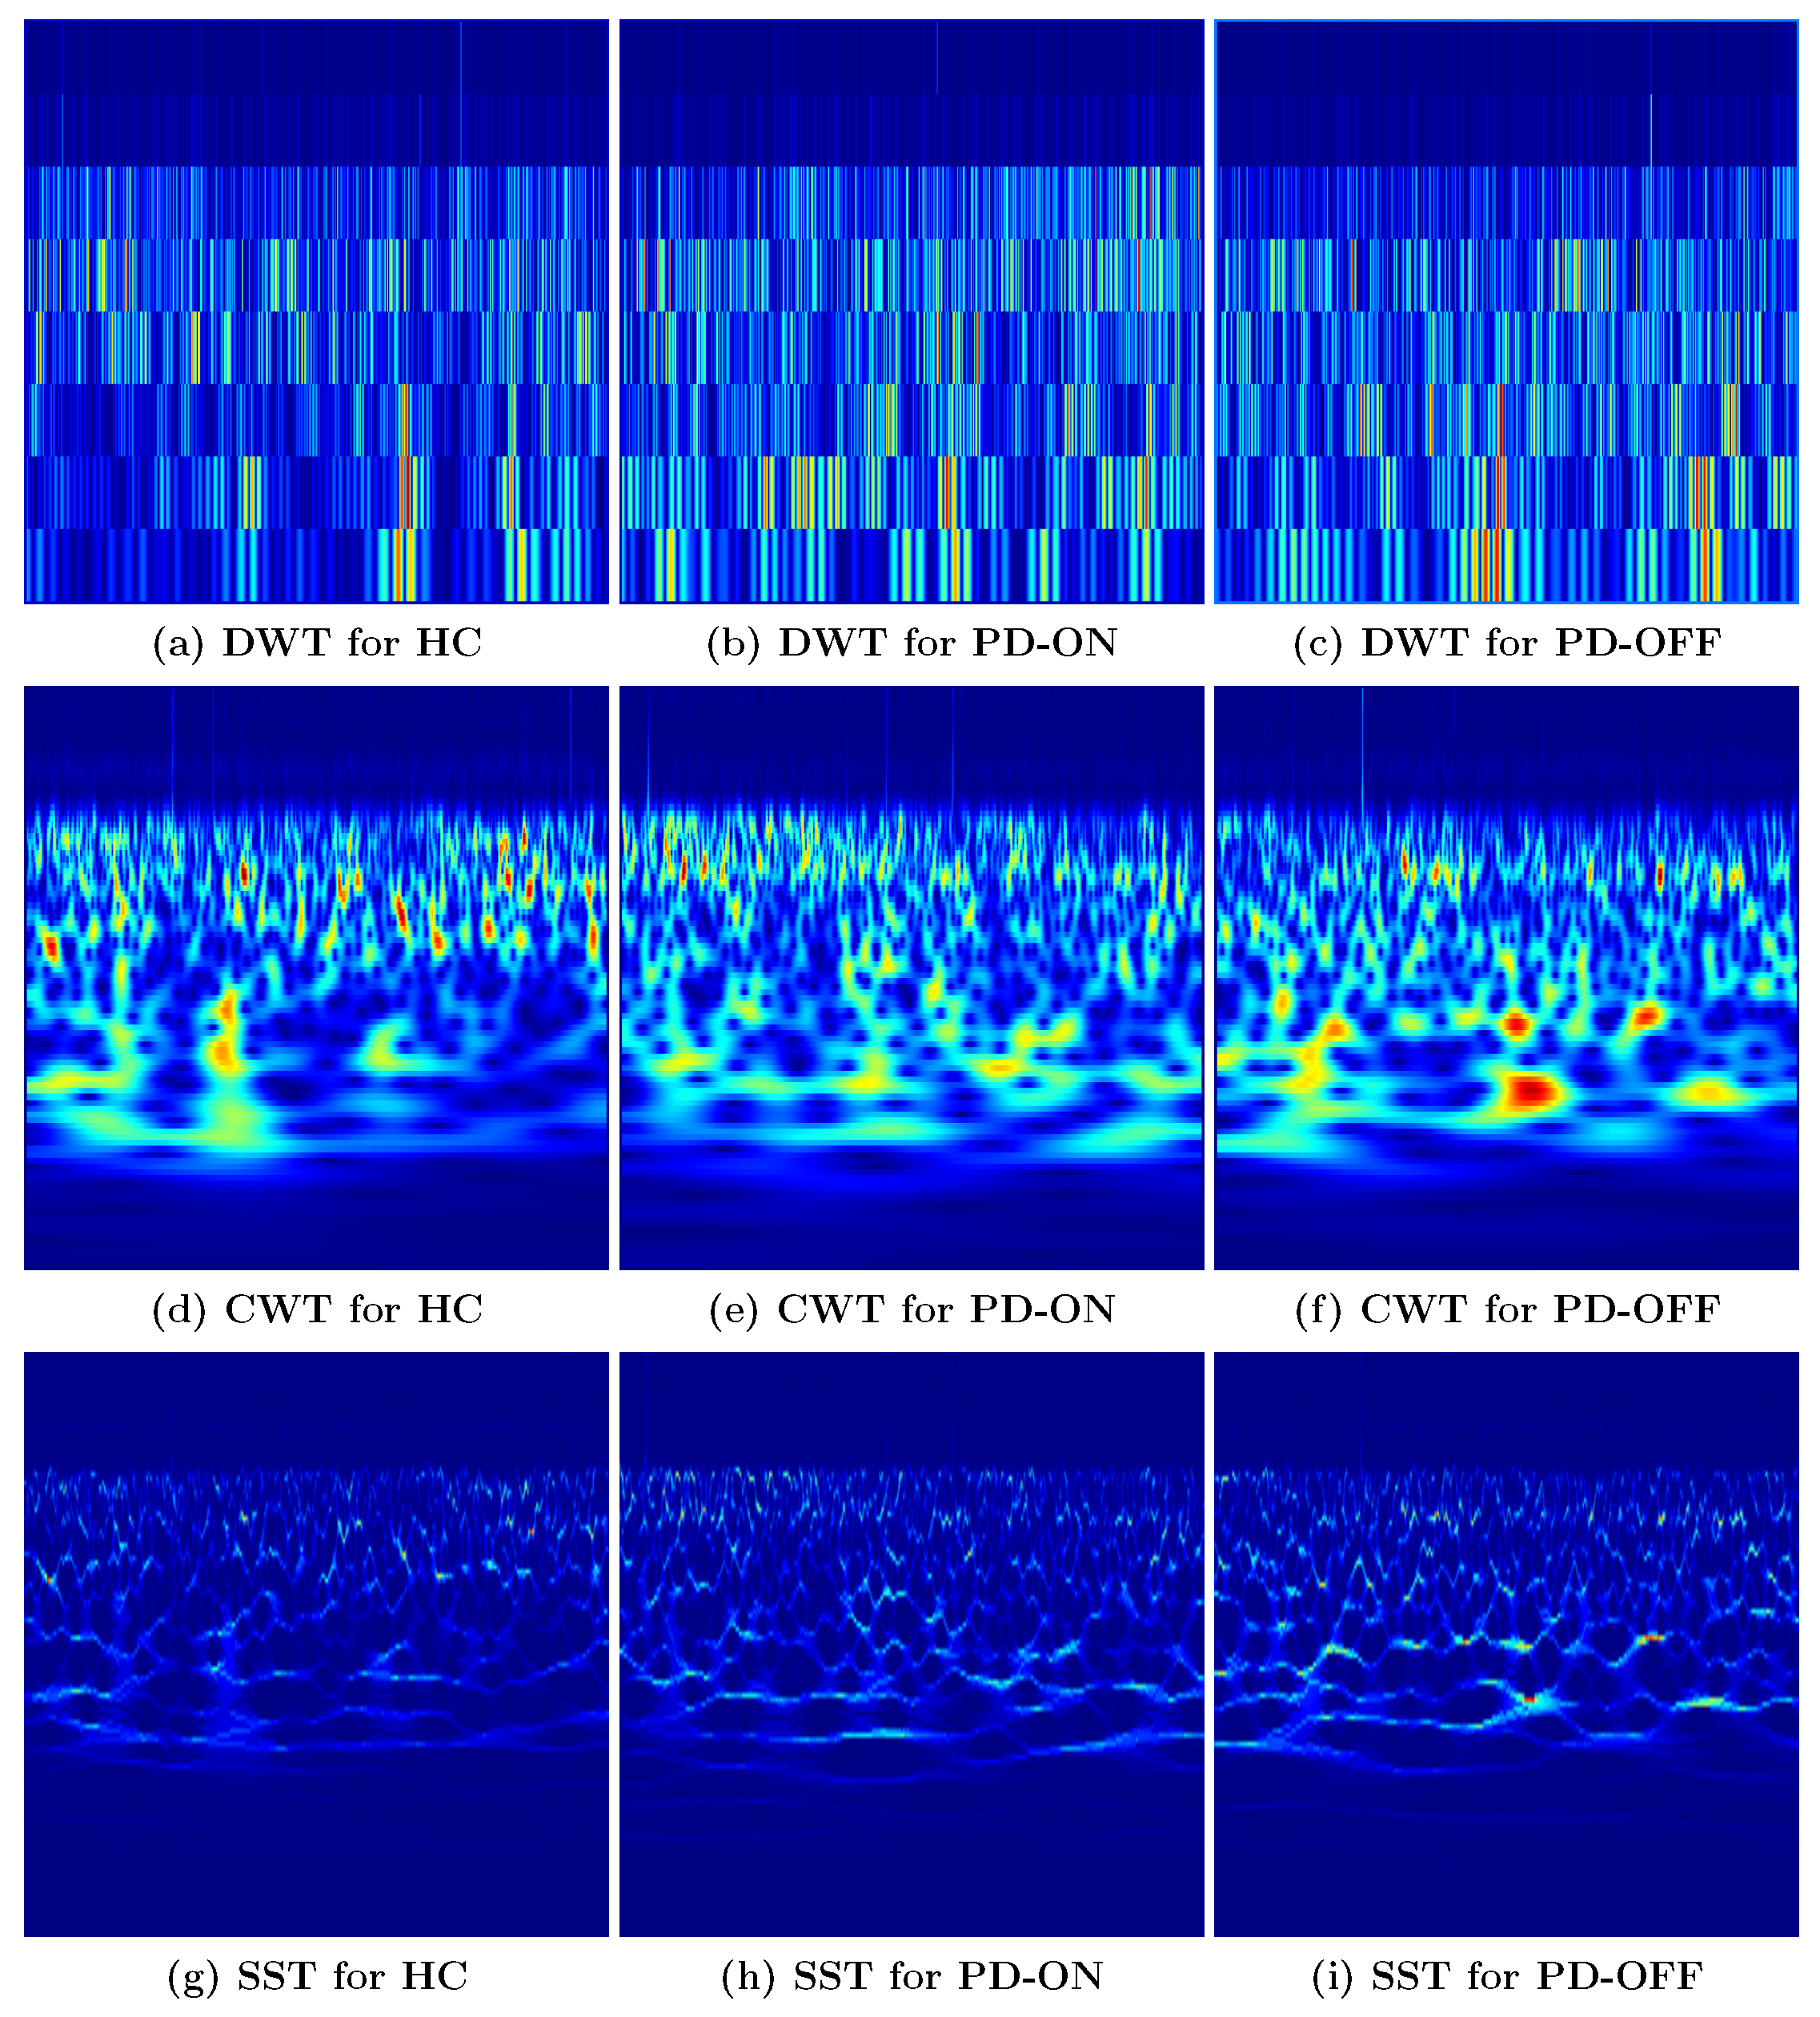
The transformation of raw EEG signals into TF representations is a key preprocessing step that enables the use of CNNs for classification [37]. TF methods decompose non-stationary EEG signals into joint TF domains [38]. The generated TF representations of EEG signals can reveal oscillatory patterns and spectral dynamics that may not be visible in time-domain analysis alone [39]. The discrete wavelet transform (DWT), continuous wavelet transform (CWT), and synchrosqueezing transform (SST) are the three TF representation approaches used in this study [40,41,42]. Each method produces a distinct image representation and offers different advantages in capturing PD-related EEG characteristics. Figure 2 shows the TF representations of the EEG signals using the DWT, CWT, and SST. In Sections S1–S3 of the Supplementary Material, these TF techniques are defined and the parameter settings are addressed.

2.3. Pretrained Deep Learning Models

Pretrained CNN architectures have become one of the most widely used techniques for biomedical data classification [43]. Here, pretrained CNN architectures were used to classify the TF representations of EEG signals into PD and HC groups. This study evaluated four pretrained CNN architectures, EfficientNet-B0, ResNet-18, MobileNetV3-L, and ShuffleNet-V2, for classifying EEG signals in PD applications [44,45,46,47]. These models were selected due to their favorable trade-off between classification performance and computational complexity and are well-established CNN architectures in transfer learning applications. Figure S1 in the Supplementary Materials illustrates the architectural structures of the evaluated CNN models.
EfficientNet-B0 uses a compound scaling strategy that jointly balances the network depth, width, and input resolution to achieve high performance at a low computational cost [48]. The EfficientNet-B0 architecture is built on mobile inverted bottleneck convolution blocks that use depth-wise separable convolutions and squeeze-and-excitation mechanisms. This design allows EfficientNet-B0 to achieve competitive performance with a small number of parameters, which can reduce overfitting when trained on limited biomedical datasets.
ResNet-18 is a residual convolutional network designed to improve the training stability of deep models [49]. Shortcut connections facilitate efficient information propagation across layers and preserve important feature representations. ResNet-18 has been widely used as a baseline architecture in transfer learning-based models for medical image and EEG-based classification tasks.
MobileNetV3-L is a lightweight CNN optimized for efficiency and low computational complexity [50]. It combines depth-wise separable convolutions with inverted residual blocks and channel attention modules, making it suitable for applications with limited computational resources.
ShuffleNet-V2 is an efficient CNN architecture developed for fast inference on resource-constrained hardware while maintaining competitive performance [47,51]. It uses channel splitting and channel shuffling operations to improve the information flow between feature groups without increasing the computational cost [47], providing a practical balance between speed and classification performance.

2.4. CNN Model Training and Hyperparameters

Four pretrained CNN architectures were evaluated: ResNet-18 [49], EfficientNet-B0 [48], MobileNetV3-L [50], and ShuffleNet-V2 [51]. All models were initialized with ImageNet-1K pretrained weights from torchvision and fine-tuned end-to-end with all layers trainable. The use of the RGB color space is common in signal-to-image transformation studies across biomedical applications. The pretrained models expect three-channel RGB inputs, and the TF representations were generated using a colormap mapping to three channels.
All architectures were trained using identical hyperparameters (Table 2) to ensure fair comparison. Only the final fully connected layer was replaced with a single output layer for binary classification. To prevent data leakage, the input images were normalized using the mean and standard deviation computed exclusively from the training set of each cross-validation fold, and the same statistics were applied to the corresponding validation and test sets. Data augmentation was applied only to the training data.

3. Results and Discussion

This section reports the results of the proposed EEG-based PD detection model. The San Diego dataset was used to evaluate the proposed framework. Two clinically relevant classification tasks were considered: HC vs. PD-ON and HC vs. PD-OFF. The number of EEG signals in each classification task is reported in Table 3. Although the number of images in all groups is sufficiently large, the total number of subjects is limited (i.e., 16 HC subjects and 15 PD patients), which is not suitable for generalized pattern extraction using deep learning.
The steps of the proposed model are shown in Figure 1. As described in Section 2.1, the EEG recordings were segmented into 15-s segments without overlap. Then, EEG images were generated from each 15-s segment. The EEG data were then converted from the time domain to the TF domain using TF techniques. As explained in Section 2.2, three TF decomposition methods, namely, DWT, CWT, and SST, were used to represent the spectral characteristics of the EEG signals. Examples of the generated TF images are shown in Figure 2. These representations were saved as images and served as inputs to four pretrained CNNs: EfficientNet-B0, ResNet-18, MobileNetV3-L, and ShuffleNet-V2 for classification. All experiments were performed under a 5-fold CV to prevent bias in the results. The CV was applied in two different manners: subject-wise and image-wise. In the image-wise CV strategy, the EEG images were separated into five folds with equal numbers of images in each fold. In the subject-wise CV strategy, the total number of subjects in the dataset was separated into five folds, regardless of the number of images per subject. The image-wise CV evaluates the ability of the proposed framework to detect PD patterns, whereas the subject-wise CV evaluates the generalization ability of the proposed framework for unseen data. A comparison between the image-wise and subject-wise CV strategies is presented in Table 4. Model performance is reported using accuracy (ACC), precision (PRE), sensitivity (SEN), specificity (SPE), and Matthews correlation coefficient (MCC).

3.1. Performance of the Proposed Framework Under Image-Wise 5-Fold CV Strategy

The performance of the four CNN architectures combined with the three TF representations for both the HC vs. PD-ON and HC vs. PD-OFF tasks under image-wise CV is reported in Table 5.
For the HC vs. PD-ON task, SST combined with EfficientNet-B0 achieved the highest ACC of 97.26%, although with a moderate SPE (89.74%) and a relatively high FAR (10.26%). The SST-ResNet-18 combination demonstrated the most balanced performance, with an ACC of 95.47% and the highest MCC of 0.95, indicating strong overall classification reliability. This configuration also achieved excellent PRE (97.14%) and SEN (97.66%). Among the CWT representations, EfficientNet-B0 achieved an ACC of 96.69% with well-balanced SEN and SPE (94.85% and 95.07%, respectively). DWT generally produced lower accuracies, with MobileNetV3-L showing the best DWT performance at an ACC of 91.65%, notably high PRE (96.61%), and an MCC of 0.93.
The HC vs. PD-OFF classification task demonstrated a generally higher performance across most configurations than the PD-ON task. The CWT-EfficientNet-B0 combination achieved the highest ACC of 97.28% with an exceptional balance across all metrics: 97.50% PRE, 97.21% SEN, and 97.35% SPE, yielding an MCC of 0.95. Remarkably, the CWT-ResNet-18 configuration produced performance metrics identical to those of CWT-EfficientNet-B0.
The SST-based models showed strong but slightly lower performance, with EfficientNet-B0 achieving 96.84% accuracy and an MCC of 0.92. DWT implementations again demonstrated the lowest performance range, though MobileNetV3-L still achieved respectable results with 92.39% accuracy and 96.69% PRE, maintaining an MCC of 0.92.
Across both classification tasks, the CWT consistently outperformed the other TF representations, particularly when combined with the EfficientNet-B0 or ResNet-18 architecture. The PD-OFF classification task was slightly more discriminable than PD-ON, with peak accuracies of 97.28% compared to 97.26%, respectively. MobileNetV3-L demonstrated consistently high PRE across all TF methods, though sometimes at the expense of overall accuracy. The MCC values, which provide a balanced measure accounting for class imbalance, ranged from 0.80 to 0.95, with the highest values consistently observed in CWT and SST configurations combined with deeper network architectures. Detailed per-fold ACC breakdowns for all configurations are provided in Supplementary Tables S1 and S2, demonstrating consistent performance across CV folds with standard deviations typically below 2%.
The choice of TF representation had a clear effect on the classification performance. The CWT consistently achieved the best results across both tasks and most architectures. For the HC vs. PD-OFF task, CWT-based models reached accuracies above 97%, with a maximum of 97.28%. These results indicate that the CWT effectively preserves the temporal and spectral information required to distinguish PD patterns.
As an illustrative example, for one image-wise fold of the 5-fold CV in the HC vs. PD-OFF task using the best-performing CWT-EfficientNet-B0 configuration, the test set would contain approximately 20% of the images, that is, about 1126 PD-OFF images and 1018 HC images, based on the full dataset sizes of 5632 PD-OFF and 5088 HC images. A representative confusion matrix (Table 6) consistent with the reported mean performance would therefore be approximately TP = 1095, FN = 31, TN = 991, and FP = 27. In other words, in this representative fold, the model would correctly classify 1095 PD-OFF images and 991 HC images, while misclassifying only 31 PD-OFF images as HC and 27 HC images as PD-OFF, demonstrating the strong and well-balanced discrimination ability of the our model.
SST showed competitive performance, especially in the HC vs. PD-ON task, where SST-EfficientNet-B0 achieved an MCC of 0.95. This suggests that the SST is suitable for capturing medication-related variations. However, SST showed slightly lower SPE in some cases, which may reflect its sensitivity to variability introduced by the medication.
DWT consistently produced lower accuracies than CWT and SST, with results ranging between 90.21% and 94.09%. Despite this limitation, DWT-based models achieved a high PRE, indicating reliable detection when PD was predicted. This reduced performance suggests that the DWT may be less effective in representing continuous frequency variations in EEG signals associated with PD. To assess whether the performance differences among TF representations generalize across CNN architectures, we performed a pooled statistical analysis combining the results from all four networks, yielding 20 samples per condition (i.e., 4 networks × 5 folds = 20). As shown in Table 7, both CWT and SST significantly outperformed DWT for both tasks based on the resulting classification accuracies, with p-values below 0.001. The difference between CWT and SST, however, was not statistically significant.
The selection of CNN architecture also influences performance. EfficientNet-B0 exhibited the most robust behavior, achieving the highest ACC in most configurations. Its design supports effective feature extraction from the TF representations. ResNet-18 performed particularly well with the SST and CWT, achieving an MCC of 0.95 in both the PD-ON and PD-OFF tasks. This indicates that residual connections support the learning of discriminative EEG features across different medication states. MobileNetV3-L achieved moderate ACC with consistently high PRE. This performance pattern suggests conservative classification behavior, which reduces false positives. ShuffleNet-V2 showed the lowest overall performance, though MCC values remained acceptable, indicating its potential use in computationally limited settings.
To evaluate the practical feasibility of the proposed architectures for clinical deployment, we measured computational requirements including model parameters and inference time. Table 8 summarizes the computational characteristics of each evaluated architecture. The inference time was averaged over 1000 forward passes with a batch size of 32 on a single NVIDIA Tesla T4 GPU. ShuffleNet-V2 offers the lowest computational cost (2.3 M parameters, 12.1 ms inference time), followed by MobileNetV3-L (5.5 M parameters, 22.5 ms). EfficientNet-B0, despite having relatively few parameters (5.3 M), exhibits the longest inference time (35.8 ms) owing to its compound scaling strategy and squeeze-and-excitation operations. Nevertheless, EfficientNet-B0 provides the best accuracy-efficiency trade-off when considering the classification performance alongside the computational requirements, achieving 97.28% ACC for HC vs. PD-OFF task. ResNet-18, despite having twice the number of parameters as EfficientNet-B0 (11.7 M), achieved a competitive but not superior ACC with a moderate inference time (27.5 ms), suggesting that depth alone does not guarantee better performance on TF EEG representations. All measured inference times are well within acceptable ranges for clinical diagnostic applications, where sub-second processing is typically sufficient.
The high performance achieved in both the PD-ON and PD-OFF tasks supports the clinical relevance of the proposed framework. The CWT-EfficientNet-B0 combination achieved balanced SEN and SPE values above 97%, which is suitable for screening and diagnostic support. Strong performance in the PD-OFF state is particularly important because it reflects disease characteristics without medication effects. A high SEN reduces missed diagnoses, whereas a high SPE limits unnecessary referrals. MCC values above 0.90 confirm reliable performance under class imbalance.
The availability of accurate results across different architectures allows for flexible deployment. Lightweight models can be used in resource-limited environments, while deeper models can support specialized clinical settings. Overall, EEG-based analysis offers a noninvasive and objective tool for the assessment and monitoring of Parkinson’s disease.
An important consideration in this study is whether the models capture core disease-related neurophysiological signatures or medication-induced EEG changes. Dopaminergic medication modulates cortical oscillatory activity, particularly in the beta and theta frequency bands [52]. The high classification ACC achieved for both HC vs. PD-ON (97.26%) and HC vs. PD-OFF (97.28%) tasks suggests that the models learn features related to PD pathology that persist across medication states, rather than primarily detecting medication effects. However, the slightly different optimal TF representations for each task (SST for PD-ON and CWT for PD-OFF) may reflect subtle differences in how medications modulate spectral dynamics. Future studies incorporating direct PD-ON vs. PD-OFF classification and feature interpretability analysis would help disentangle disease-specific biomarkers from medication-related confounds.

3.2. Performance of the Proposed Framework Under Subject-Wise 5-Fold CV Strategy

To ensure rigorous assessment of generalization to unseen patients, a subject-wise 5-fold CV strategy was implemented using the Group-K-Fold method from scikit-learn. Unlike conventional CV, which randomly splits individual samples, this approach ensures that all EEG images from a given subject are assigned exclusively to either the training or the test set, preventing information leakage and providing a clinically relevant evaluation of model generalizability.
Since each subject contributed multiple 15-s EEG images, a majority-voting decision aggregation strategy was applied: a subject was classified correctly if more than 50% of their images were correctly predicted. This ensures that the final diagnosis reflects consistent patterns across multiple temporal windows rather than transient fluctuations in individual images.
The classification results under subject-wise CV are reported in Table 9. As expected, the performance decreased substantially compared with the image-wise CV strategy, reflecting the increased difficulty in generalizing to entirely unseen individuals. For the HC vs. PD-ON task, accuracy ranged from 61.29% to 83.87%, with DWT-ShuffleNet-V2 achieving the highest ACC (83.87%) and MCC (0.68). CWT-based models showed weaker generalization in this task, with ShuffleNet-V2 achieving the lowest ACC of 61.29%. For the HC vs. PD-OFF task, performance was generally higher, with CWT-MobileNetV3-L achieving the best ACC of 83.87% and the highest MCC of 0.69, followed by DWT-ResNet-18 with identical ACC and a similar MCC of 0.68.
It is worth noting that identical performance values appearing across different configurations are not erroneous. Given the small number of subjects (15 PD + 16 HC = 31 total) and subject-level majority-voting aggregation, different model configurations could yield the same number of correctly classified subjects per fold, resulting in numerically identical metrics. This is an inherent consequence of the coarse subject-level granularity rather than a reporting artifact.
The substantial gap between image-wise and subject-wise CV results highlights the risk of overestimating model performance when subject identity is not controlled during data splitting. Despite the performance reduction, several configurations achieved accuracies above 80%, suggesting that the proposed framework captures generalizable PD-related EEG patterns. Nevertheless, expanding the dataset to include a larger number of subjects would be essential to validate and improve cross-subject generalization before clinical deployment.

3.3. Comparison with Existing Studies

Table 10 compares the proposed method with previous EEG-based PD studies evaluated using the San Diego dataset. For the HC vs. PD-OFF task, the proposed CWT-EfficientNet-B0 approach achieved an ACC of 97.28%, ranking second after the model proposed in [53], which reported 99.83% using stationary wavelet transform (SWT) and an AlexNet-based CNN. For the HC vs. PD-ON task, SST-EfficientNet-B0 achieved an ACC of 97.26%, again second to the model in [53]. Despite a slightly lower accuracy, the proposed method relies on an efficient deep-learning framework rather than handcrafted features.
A key contribution of this study is the systematic evaluation of three TF representations (DWT, CWT, and SST) across four CNN architectures (EfficientNet-B0, ResNet-18, MobileNetV3-L, and ShuffleNet-V2) under image-wise and subject-wise 5-fold CV strategies rather than a single image-wise evaluation [52,53,54,55,56]. The results show that the CWT and SST consistently outperform the DWT. The CWT performed best for PD-OFF detection, whereas the SST was more effective for PD-ON classification.
In addition to the ACC, the best configurations achieved high MCC, indicating reliable and balanced performance. EfficientNet-B0 also offers reduced computational costs compared to deeper networks, which is beneficial for practical and clinical deployment.
The proposed approach provides a competitive ACC with improved efficiency and a more precise understanding of the interaction between TF representations and CNN architectures.

3.4. Contributions and Limitations

This study makes several contributions to the automated use of EEG signals for PD identification. First, a systematic comparison of the TF representations shows that the CWT and SST consistently outperform the DWT across all evaluated CNN architectures, with image-wise accuracies reaching 97.28% for HC vs. PD-OFF (CWT with EfficientNet-B0) and 97.26% for HC vs. PD-ON (SST with EfficientNet-B0) (Table 5). Second, an analysis of four CNN models demonstrated how the network architecture interacts with the signal representation and identifies optimal configurations for both PD-ON and PD-OFF classification tasks. Third, the proposed framework achieved state-of-the-art performance for HC vs. PD-OFF (97.28%) and HC vs. PD-ON (97.26%) while relying on lightweight architectures that support computational efficiency and clinical deployment. Finally, high MCC values of up to 0.95 confirm a robust and reliable classification performance at the image-wise CV level.
This study had several limitations. The evaluation was conducted exclusively on the San Diego dataset with only 31 subjects (16 HC, 15 PD), which limits the generalizability to other populations with different demographic characteristics, disease stages, or EEG acquisition protocols. While subject-wise CV was performed (see Table 9), the results reveal substantially reduced performance compared to image-wise evaluation, with subject-wise accuracies ranging from 61.29% to 83.87% compared to 90–97% at the epoch level. This performance gap indicates that the models face considerable challenges when generalizing to entirely unseen subjects and underscores the critical need for validation on larger, independent cohorts before clinical translation can be considered. This study focused on binary classification tasks (HC vs. PD-ON and HC vs. PD-OFF) and did not address multi-class problems such as disease severity staging or differentiation among Parkinsonian syndromes. Additionally, more recent deep learning approaches, such as vision transformers [57] and attention mechanisms [58], have not been explored, and the interpretability of the learned features has not been investigated through methods such as Grad-CAM [59], which would enhance clinical trust and understanding of the automated diagnostic process. Moreover, the modest subject-wise classification performance highlights that the current models may be learning subject-specific patterns rather than generalizable disease biomarkers, reinforcing the necessity of multicenter validation studies with larger sample sizes.

4. Conclusions

This study systematically evaluated TF representation methods combined with pretrained CNNs for automated EEG-based PD detection. Three TF techniques (DWT, CWT, and SST) were evaluated using four lightweight CNN architectures (EfficientNet-B0, ResNet-18, MobileNetV3-L, and ShuffleNet-V2) under consistent experimental settings.
The results show that the choice of TF representation method has a significant impact on the classification performance. CWT and SST consistently outperformed DWT in all architectures. The best performance was achieved by CWT-EfficientNet-B0 for HC vs. PD-OFF classification (97.28%) and SST-EfficientNet-B0 for HC vs. PD-ON classification (97.26%). In other words, continuous TF representations are more effective for decoding EEG patterns related to PD.
Among the evaluated networks, EfficientNet-B0 demonstrated the most robust performance while maintaining its computational efficiency. The strong results obtained with lightweight architectures confirm that high classification accuracy can be achieved without complex or resource-intensive models, which is important for clinical application.
The findings demonstrate that combining appropriate TF representations with efficient pretrained CNN architectures achieves a high image-wise classification performance for EEG-based PD detection. However, the substantial performance gap between image-wise (90–97%) and subject-wise (67–84%) CV indicates that current models primarily capture dataset-specific or subject-specific patterns rather than fully generalizable disease biomarkers. The proposed methodology may provide a foundation for future clinical tools but requires rigorous validation on larger, independent, multicenter cohorts with subject-independent evaluation protocols before clinical translation can be considered. Future work should prioritize interpretability methods to confirm that models learn pathological neurophysiological signatures rather than confounding factors, and should incorporate longitudinal data to assess model robustness for disease monitoring and progression tracking.

Supplementary Materials

The following supporting information can be downloaded at: https://www.mdpi.com/article/10.3390/biomedinformatics6020012/s1, Figure S1: CNN architecture diagrams; Tables S1 and S2: Per-fold accuracy results and CV strategy comparison; Supplementary formulas for DWT, CWT, and SST mathematical formulations. Section S1: Discrete Wavelet Transform. Section S2: Continuous Wavelet Transform. Section S3: Synchrosqueezing Transform.

Author Contributions

Conceptualization, H.A.; methodology, H.A.; software, A.A. and H.A.; validation, A.A. and H.A.; formal analysis, H.A.; investigation, H.A.; data curation, A.A. and H.A.; writing-original draft preparation, H.A.; writing-review and editing, A.A., H.A., M.T.S., D.S. and M.M.; visualization, A.A. and H.A.; supervision, M.T.S., D.S. and M.M.; project administration, H.A. All authors have read and agreed to the published version of the manuscript.

Funding

This research received no external funding.

Institutional Review Board Statement

Ethical review and approval were waived for this study due to our study used a publicly available, de-identified dataset and did not involve direct interaction with human participants or access to identifiable private information.

Informed Consent Statement

Patient consent was waived due to the use of the publicly available San Diego EEG dataset. All participants in the original study were provided written informed consent in accordance with the Institutional Review Board of the University of California, San Diego, and the Declaration of Helsinki.

Data Availability Statement

The original data presented in the study are openly available in [33].

Acknowledgments

This research is dedicated to Hamidreza Akbari (Hesam Akbari’s uncle) and all patients with Parkinson’s disease. We hope that this study contributes to improving the well-being of these patients and supports ongoing efforts in their care. The authors also gratefully acknowledge Kaggle for providing the free GPU resources used in this study. In addition, we thank the College of Information and the Department of Information Science at the University of North Texas for their support of this study.

Conflicts of Interest

The authors declare no conflicts of interest.

Abbreviations

The following abbreviations are used in this manuscript:
PDParkinson’s disease
EEGElectroencephalography
TFTime–frequency
DWTDiscrete wavelet transform
CWTContinuous wavelet transform
SSTSynchrosqueezing transform
CNNConvolutional neural network
ASRArtifact Subspace Reconstruction
HCHealthy control
CVCross-validation
PETPositron emission tomography
CTComputed tomography
MRIMagnetic resonance imaging
SPECTSingle-photon emission computed tomography
fMRIFunctional magnetic resonance imaging
STFTShort-time Fourier transform
ACCAccuracy
PREPrecision
SENSensitivity
SPESpecificity
MCCMatthews correlation coefficient

References

  1. Khan, A.U.; Akram, M.; Daniyal, M.; Zainab, R. Awareness and current knowledge of Parkinson’s disease: A neurodegenerative disorder. Int. J. Neurosci. 2019, 129, 55–93. [Google Scholar] [CrossRef]
  2. Damier, P.; Hirsch, E.; Agid, Y.; Graybiel, A. The substantia nigra of the human brain: II. Patterns of loss of dopamine-containing neurons in Parkinson’s disease. Brain 1999, 122, 1437–1448. [Google Scholar] [CrossRef]
  3. Shahed, J.; Jankovic, J. Motor symptoms in Parkinson’s disease. Handb. Clin. Neurol. 2007, 83, 329–342. [Google Scholar]
  4. Poewe, W. Non-motor symptoms in Parkinson’s disease. Eur. J. Neurol. 2008, 15, 14–20. [Google Scholar] [CrossRef]
  5. Ugrumov, M. Development of early diagnosis of Parkinson’s disease: Illusion or reality? CNS Neurosci. Ther. 2020, 26, 997–1009. [Google Scholar] [CrossRef] [PubMed]
  6. Mathalon, D.H.; Sohal, V.S. Neural oscillations and synchrony in brain dysfunction and neuropsychiatric disorders: It’s about time. JAMA Psychiatry 2015, 72, 840–844. [Google Scholar] [CrossRef]
  7. Cutshaw, G.; Uthaman, S.; Hassan, N.; Kothadiya, S.; Wen, X.; Bardhan, R. The emerging role of Raman spectroscopy as an omics approach for metabolic profiling and biomarker detection toward precision medicine. Chem. Rev. 2023, 123, 8297–8346. [Google Scholar] [CrossRef]
  8. Bonakdarpour, B.; Takarabe, C. Brain networks, clinical manifestations, and neuroimaging of cognitive disorders: The role of computed tomography (CT), magnetic resonance imaging (MRI), positron emission tomography (PET), and other advanced neuroimaging tests. Clin. Geriatr. Med. 2023, 39, 45–65. [Google Scholar] [CrossRef] [PubMed]
  9. Nievelstein, R.; Quarles van Ufford, H.; Kwee, T.C.; Bierings, M.; Ludwig, I.; Beek, F.; De Klerk, J.; Mali, W.T.M.; de Bruin, P.W.; Geleijns, J. Radiation exposure and mortality risk from CT and PET imaging of patients with malignant lymphoma. Eur. Radiol. 2012, 22, 1946–1954. [Google Scholar] [CrossRef] [PubMed]
  10. Sahebari, M.; Rezaieyazdi, Z.; Khodashahi, M.; Abbasi, B.; Ayatollahi, F. Brain single photon emission computed tomography scan (SPECT) and functional MRI in systemic lupus erythematosus patients with cognitive dysfunction: A systematic review. Asia Ocean. J. Nucl. Med. Biol. 2018, 6, 97. [Google Scholar]
  11. Khare, S.K.; Blanes-Vidal, V.; Nadimi, E.S.; Acharya, U.R. Emotion recognition and artificial intelligence: A systematic review (2014–2023) and research recommendations. Inf. Fusion 2023, 102, 102019. [Google Scholar] [CrossRef]
  12. Akbari, H.; Sadiq, M.T. Detection of focal and non-focal EEG signals using non-linear features derived from empirical wavelet transform rhythms. Phys. Eng. Sci. Med. 2021, 44, 157–171. [Google Scholar] [CrossRef]
  13. Geraedts, V.J.; Boon, L.I.; Marinus, J.; Gouw, A.A.; van Hilten, J.J.; Stam, C.J.; Tannemaat, M.R.; Contarino, M.F. Clinical correlates of quantitative EEG in Parkinson disease: A systematic review. Neurology 2018, 91, 871–883. [Google Scholar] [CrossRef] [PubMed]
  14. Pachori, R.B. Time-Frequency Analysis Techniques and Their Applications; CRC Press: Boca Raton, FL, USA, 2023. [Google Scholar]
  15. Samiee, K.; Kovacs, P.; Gabbouj, M. Epileptic seizure classification of EEG time-series using rational discrete short-time Fourier transform. IEEE Trans. Biomed. Eng. 2014, 62, 541–552. [Google Scholar] [CrossRef]
  16. Hazarika, N.; Chen, J.Z.; Tsoi, A.C.; Sergejew, A. Classification of EEG signals using the wavelet transform. Signal Process. 1997, 59, 61–72. [Google Scholar] [CrossRef]
  17. Bagherzadeh, S.; Norouzi, M.R.; Ghasri, A.; Tolou Kouroshi, P.; Bahri Hampa, S.; Farokhshad, F.; Shalbaf, A. Automated depression detection via cloud based EEG analysis with transfer learning and synchrosqueezed wavelet transform. Sci. Rep. 2025, 15, 18008. [Google Scholar] [CrossRef]
  18. Madhavan, S.; Tripathy, R.K.; Pachori, R.B. Time-frequency domain deep convolutional neural network for the classification of focal and non-focal EEG signals. IEEE Sens. J. 2019, 20, 3078–3086. [Google Scholar] [CrossRef]
  19. Remigio, A.S. IncARMAG: A convolutional neural network with multi-level autoregressive moving average graph convolutional processing framework for medical image classification. Neurocomputing 2025, 617, 129038. [Google Scholar] [CrossRef]
  20. Bagherzadeh, S.; Shalbaf, A.; Shoeibi, A.; Jafari, M.; San Tan, R.; Acharya, U.R. Developing an EEG-based emotion recognition using ensemble deep learning methods and fusion of brain effective connectivity maps. IEEE Access 2024, 12, 50949–50965. [Google Scholar] [CrossRef]
  21. Filus, K.; Domańska, J. What is the doggest dog? Examination of typicality perception in ImageNet-trained networks. Neural Netw. 2025, 188, 107425. [Google Scholar] [CrossRef]
  22. Ozdemir, M.A.; Kisa, D.H.; Guren, O.; Akan, A. Hand gesture classification using time–frequency images and transfer learning based on CNN. Biomed. Signal Process. Control 2022, 77, 103787. [Google Scholar] [CrossRef]
  23. Mallat, S.G. A theory for multiresolution signal decomposition: The wavelet representation. IEEE Trans. Pattern Anal. Mach. Intell. 2002, 11, 674–693. [Google Scholar] [CrossRef]
  24. Zeng, W.; Li, M.; Yuan, C.; Wang, Q.; Liu, F.; Wang, Y. Identification of epileptic seizures in EEG signals using time-scale decomposition (ITD), discrete wavelet transform (DWT), phase space reconstruction (PSR) and neural networks. Artif. Intell. Rev. 2020, 53, 3059–3088. [Google Scholar]
  25. Alessio, S.M. Discrete wavelet transform (DWT). In Digital Signal Processing and Spectral Analysis for Scientists: Concepts and Applications; Springer: Cham, Switzerland, 2015; pp. 645–714. [Google Scholar]
  26. Torrence, C.; Compo, G.P. A practical guide to wavelet analysis. Bull. Am. Meteorol. Soc. 1998, 79, 61–78. [Google Scholar]
  27. Addison, P.S. The Illustrated Wavelet Transform Handbook: Introductory Theory and Applications in Science, Engineering, Medicine and Finance; CRC Press: Boca Raton, FL, USA, 2017. [Google Scholar]
  28. Le Van Quyen, M.; Foucher, J.; Lachaux, J.P.; Rodriguez, E.; Lutz, A.; Martinerie, J.; Varela, F.J. Comparison of Hilbert transform and wavelet methods for the analysis of neuronal synchrony. J. Neurosci. Methods 2001, 111, 83–98. [Google Scholar] [CrossRef]
  29. Daubechies, I.; Lu, J.; Wu, H.T. Synchrosqueezed wavelet transforms: An empirical mode decomposition-like tool. Appl. Comput. Harmon. Anal. 2011, 30, 243–261. [Google Scholar] [CrossRef]
  30. Amiri, M.; Aghaeinia, H.; Amindavar, H.R. Automatic epileptic seizure detection in EEG signals using sparse common spatial pattern and adaptive short-time Fourier transform-based synchrosqueezing transform. Biomed. Signal Process. Control 2023, 79, 104022. [Google Scholar] [CrossRef]
  31. Nucci, L.; Miraglia, F.; Pappalettera, C.; Rossini, P.M.; Vecchio, F. Exploring the complexity of EEG patterns in Parkinson’s disease. GeroScience 2025, 47, 837–849. [Google Scholar] [CrossRef]
  32. Khare, S.K.; Bajaj, V.; Acharya, U.R. SPWVD-CNN for automated detection of schizophrenia patients using EEG signals. IEEE Trans. Instrum. Meas. 2021, 70, 1–9. [Google Scholar] [CrossRef]
  33. Rockhill, A.P.; Jackson, N.; George, J.; Aron, A.; Swann, N.C. UC San Diego Resting State EEG Data from Patients with Parkinson’s Disease. 2021. [Google Scholar] [CrossRef]
  34. Khare, S.K.; Bajaj, V.; Acharya, U.R. PDCNNet: An automatic framework for the detection of Parkinson’s disease using EEG signals. IEEE Sens. J. 2021, 21, 17017–17024. [Google Scholar] [CrossRef]
  35. Loh, H.W.; Ooi, C.P.; Palmer, E.; Barua, P.D.; Dogan, S.; Tuncer, T.; Baygin, M.; Acharya, U.R. GaborPDNet: Gabor transformation and deep neural network for Parkinson’s disease detection using EEG signals. Electronics 2021, 10, 1740. [Google Scholar] [CrossRef]
  36. Delorme, A.; Makeig, S. EEGLAB: An open source toolbox for analysis of single-trial EEG dynamics including independent component analysis. J. Neurosci. Methods 2004, 134, 9–21. [Google Scholar] [CrossRef]
  37. Lekkas, G.; Vrochidou, E.; Papakostas, G.A. Time–Frequency Transformations for Enhanced Biomedical Signal Classification with Convolutional Neural Networks. BioMedInformatics 2025, 5, 7. [Google Scholar] [CrossRef]
  38. Khan, N.A.; Ali, S. A new feature for the classification of non-stationary signals based on the direction of signal energy in the time–frequency domain. Comput. Biol. Med. 2018, 100, 10–16. [Google Scholar] [CrossRef] [PubMed]
  39. Khan, S.; Noorani, S.H.; Frnda, J.; Rauf, U.; Arsalan, A.; Saeed, S.M.U. A Transfer Learning-based Framework for Enhanced Classification of Perceived Mental Stress using EEG Spectrograms. IEEE Access 2025, 13, 89266–89286. [Google Scholar] [CrossRef]
  40. Akbari, H.; Sadiq, M.T.; Jafari, N.; Too, J.; Mikaeilvand, N.; Cicone, A.; Serra Capizzano, S. Recognizing seizure using Poincaré plot of EEG signals and graphical features in DWT domain. Bratisl. Med. J. 2023, 124, 12–24. [Google Scholar] [CrossRef] [PubMed]
  41. Ghorbanian, P.; Devilbiss, D.M.; Hess, T.; Bernstein, A.; Simon, A.J.; Ashrafiuon, H. Exploration of EEG features of Alzheimer’s disease using continuous wavelet transform. Med. Biol. Eng. Comput. 2015, 53, 843–855. [Google Scholar] [CrossRef]
  42. Ozel, P.; Akan, A.; Yilmaz, B. Synchrosqueezing transform based feature extraction from EEG signals for emotional state prediction. Biomed. Signal Process. Control 2019, 52, 152–161. [Google Scholar] [CrossRef]
  43. Shin, H.C.; Roth, H.R.; Gao, M.; Lu, L.; Xu, Z.; Nogues, I.; Yao, J.; Mollura, D.; Summers, R.M. Deep convolutional neural networks for computer-aided detection: CNN architectures, dataset characteristics and transfer learning. IEEE Trans. Med. Imaging 2016, 35, 1285–1298. [Google Scholar] [CrossRef] [PubMed]
  44. Saadoon, Y.A.; Khalil, M.; Battikh, D. Predicting epileptic seizures using efficientnet-B0 and SVMs: A deep learning methodology for EEG analysis. Bioengineering 2025, 12, 109. [Google Scholar] [CrossRef]
  45. Bagherzadeh, S.; Norouzi, M.R.; Hampa, S.B.; Ghasri, A.; Kouroshi, P.T.; Hosseininasab, S.; Zadeh, M.A.G.; Nasrabadi, A.M. A subject-independent portable emotion recognition system using synchrosqueezing wavelet transform maps of EEG signals and ResNet-18. Biomed. Signal Process. Control 2024, 90, 105875. [Google Scholar] [CrossRef]
  46. Boulkrinat, N.E.H.; Yahiaoui, M.; Kaci, L. Parkinson’s disease detection from brain MRI using convolutional neural networks. Procedia Comput. Sci. 2024, 251, 660–665. [Google Scholar] [CrossRef]
  47. PS, T.; KR, V. Neurofusionnet: A comprehensive framework for accurate epileptic seizure prediction from EEG data with hybrid meta-heuristic optimization algorithm. Cogn. Neurodynamics 2025, 19, 113. [Google Scholar] [CrossRef]
  48. Tan, M.; Le, Q. Efficientnet: Rethinking model scaling for convolutional neural networks. In Proceedings of the International Conference on Machine Learning, Long Beach, CA, USA, 9–15 June 2019; pp. 6105–6114. [Google Scholar]
  49. He, K.; Zhang, X.; Ren, S.; Sun, J. Deep residual learning for image recognition. In Proceedings of the IEEE Conference on Computer Vision and Pattern Recognition, Las Vegas, NV, USA, 27–30 June 2016; pp. 770–778. [Google Scholar]
  50. Howard, A.; Sandler, M.; Chu, G.; Chen, L.C.; Chen, B.; Tan, M.; Wang, W.; Zhu, Y.; Pang, R.; Vasudevan, V.; et al. Searching for mobilenetv3. In Proceedings of the IEEE/CVF International Conference on Computer Vision, Seoul, Republic of Korea, 27 October–2 November 2019; pp. 1314–1324. [Google Scholar]
  51. Ma, N.; Zhang, X.; Zheng, H.T.; Sun, J. Shufflenet v2: Practical guidelines for efficient cnn architecture design. In Proceedings of the European Conference on Computer Vision (ECCV), Munich, Germany, 8–14 September 2018; pp. 116–131. [Google Scholar]
  52. Khare, S.K.; Bajaj, V.; Acharya, U.R. Detection of Parkinson’s disease using automated tunable Q wavelet transform technique with EEG signals. Biocybern. Biomed. Eng. 2021, 41, 679–689. [Google Scholar] [CrossRef]
  53. Siuly, S.; Khare, S.K.; Kabir, E.; Sadiq, M.T.; Wang, H. An efficient Parkinson’s disease detection framework: Leveraging time-frequency representation and AlexNet convolutional neural network. Comput. Biol. Med. 2024, 174, 108462. [Google Scholar] [CrossRef]
  54. Pozo Ruiz, S.A. Parkinson’s Disease Diagnosis Using Electroencephalographic (EEG) Signal Processing and Machine Learning Techniques. Bachelor’s Thesis, Universidad de Investigación de Tecnología Experimental Yachay, Imbabura, Ecuador, 2021. [Google Scholar]
  55. Qiu, L.; Li, J.; Pan, J. Parkinson’s disease detection based on multi-pattern analysis and multi-scale convolutional neural networks. Front. Neurosci. 2022, 16, 957181. [Google Scholar] [CrossRef]
  56. Motin, M.A.; Mahmud, M.; Brown, D.J. Detecting Parkinson’s disease from electroencephalogram signals: An explainable machine learning approach. In Proceedings of the 2022 IEEE 16th International Conference on Application of Information and Communication Technologies (AICT), Washington, DC, USA, 12–14 October 2022; pp. 1–6. [Google Scholar]
  57. Dosovitskiy, A.; Beyer, L.; Kolesnikov, A.; Weissenborn, D.; Zhai, X.; Unterthiner, T.; Dehghani, M.; Minderer, M.; Heigold, G.; Gelly, S.; et al. An image is worth 16x16 words: Transformers for image recognition at scale. In Proceedings of the International Conference on Learning Representations, Virtual Event, Austria, 3–7 May 2021. [Google Scholar]
  58. Vaswani, A.; Shazeer, N.; Parmar, N.; Uszkoreit, J.; Jones, L.; Gomez, A.N.; Kaiser, Ł.; Polosukhin, I. Attention is all you need. Adv. Neural Inf. Process. Syst. 2017, 30, 1–11. [Google Scholar]
  59. Selvaraju, R.R.; Cogswell, M.; Das, A.; Vedantam, R.; Parikh, D.; Batra, D. Grad-CAM: Visual Explanations from Deep Networks via Gradient-based Localization. In Proceedings of the IEEE International Conference on Computer Vision (ICCV), Venice, Italy, 22–29 October 2017; pp. 618–626. [Google Scholar]
Figure 1. Workflow of the proposed EEG-based model for detecting Parkinson’s disease.
Biomedinformatics 06 00012 g001
Figure 2. Representative TF representations of EEG signals from a HC subject (first column) and a PD patient in ON medication (second column) and OFF medication (third column) states. The first, second, and third rows show images generated using DWT, CWT, and SST, respectively.
Biomedinformatics 06 00012 g002
Table 1. Summary of demographic characteristics for the studied datasets.
GroupNumber of SubjectsGender (M/F)Age (Years)Disease Duration f s Number of Channels
HC167/963.5 ± 9.6-51232
PD158/763.2 ± 8.24.5 ± 3.551232
Table 2. CNN training configuration.
ParameterValue
CNN architecturesResNet-18, EfficientNet-B0, MobileNetV3-L, ShuffleNet-V2
Fine-tuning strategyAll layers fine-tuned (no frozen layers)
Channel mappingColor scalograms mapped to three channels
Input image size 224 × 224
Number of channelsRGB (3 channels)
Batch size32
Epochs12
OptimizerAdam
Learning rate 1 × 10 4 (fixed, no scheduler)
Loss functionBinary cross-entropy with logits
Class balancingNot applied
Early stoppingNot applied
Data augmentationRandom horizontal flip, random rotation ( 15 ), color jitter (brightness = 0.12, contrast = 0.12)
NormalizationPer-fold training-set statistics (mean and standard deviation computed from training data only)
Table 3. Number of generated TF images for each classification task.
TaskPD SamplesHC Samples
HC vs. PD-ON56325088
HC vs. PD-OFF54085088
Table 4. Comparison of image-wise and subject-wise CV strategies.
ParameterImage-Wise CVSubject-Wise CV
Number of folds55
Test set selectionImage-levelSubject-level
Data splittingImage-dependentSubject-independent
Training set4 folds (images)4 folds (subjects)
Validation set1 fold (images)1 fold (subjects)
Validation selectionRandom (image-level)Determined by subject grouping
Test set size20% of total images per foldAll images from unseen subjects per fold
Task: HC vs. PD-ON5088 vs. 5632 images3–4 HC subjects vs. 3 PD-ON subjects per fold
Task: HC vs. PD-OFF5088 vs. 5408 images3–4 HC subjects vs. 3 PD-OFF subjects per fold
Risk of data leakageHighEliminated
GoalPattern discoveryGeneralization discovery
Table 5. Classification performance for the HC vs. PD-ON and HC vs. PD-OFF tasks under the image-wise CV strategy using different TF representations.
HC vs. PD-ON (Image-Wise CV strategy)
TFRCNNACC (%)PRE (%)SEN (%)SPE (%)MCC
DWTEfficientNet-B093.3092.7894.6291.840.87
ResNet-1892.9592.7793.8991.900.86
MobileNetV3-L91.6590.8993.4889.620.83
ShuffleNet-V290.2189.6991.9488.310.80
CWTEfficientNet-B096.6996.0197.7695.500.93
ResNet-1896.5396.6196.7996.250.93
MobileNetV3-L94.9595.5194.8595.070.90
ShuffleNet-V294.2094.7094.2394.160.88
SSTEfficientNet-B097.2697.1497.6696.820.95
ResNet-1895.4795.4495.9594.930.91
MobileNetV3-L93.9691.3497.7689.740.88
ShuffleNet-V294.1995.6693.1695.320.88
HC vs. PD-OFF (Image-Wise CV Strategy)
TFRCNNACC (%)PRE (%)SEN (%)SPE (%)MCC
DWTEfficientNet-B094.0994.3294.2193.970.88
ResNet-1893.6794.2993.3893.990.87
MobileNetV3-L92.3991.7193.6991.000.85
ShuffleNet-V290.3589.2292.4488.130.81
CWTEfficientNet-B097.2897.5097.2197.350.95
ResNet-1895.7696.6995.0396.540.92
MobileNetV3-L95.8795.7596.2595.460.92
ShuffleNet-V295.1495.3595.2195.070.90
SSTEfficientNet-B096.8497.5896.2597.460.94
ResNet-1895.8795.8796.1495.600.92
MobileNetV3-L94.8595.1694.8294.870.90
ShuffleNet-V294.5794.8594.6094.540.89
Table 6. Confusion matrix for one representative fold of the image-wise 5-fold cross-validation experiment for HC vs. PD-ON classification (CWT, EfficientNet-B0).
Predicted
PD-ONHC
ActualPD-ON1095 (TP)31 (FN)
HC27 (FP)991 (TN)
Table 7. Statistical comparison of TF representations using pooled data from all CNN architectures.
TaskComparisonMean Difference (%)p-Value
HC vs. PD-ONCWT vs. DWT+3.44<0.001
SST vs. DWT+3.18<0.001
CWT vs. SST+0.260.538
HC vs. PD-OFFCWT vs. DWT+3.36<0.001
SST vs. DWT+2.93<0.001
CWT vs. SST+0.430.200
Table 8. Computational efficiency comparison of evaluated CNN architectures.
ArchitectureParameters (Million)Inference Time (ms)Model Size (MB)
EfficientNet-B05.335.8 ± 0.421.2
ResNet-1811.727.5 ± 0.544.8
MobileNetV3-L5.522.5 ± 0.221.6
ShuffleNet-V22.312.1 ± 0.19.2
Table 9. Subject-wise classification performance for the HC vs. PD-ON and HC vs. PD-OFF tasks using different time–frequency representations. Values are reported as mean ± 95% confidence interval (CI) computed over n = 31 subjects.
HC vs. PD-ON (Subject-Wise CV Strategy)
TFRCNNACC (%)PRE (%)SEN (%)SPE (%)MCC
DWTEfficientNet-B074.19 ± 15.466.67 ± 16.676.92 ± 14.872.22 ± 15.80.49
ResNet-1874.19 ± 15.480.00 ± 14.170.59 ± 16.078.57 ± 14.40.49
MobileNetV3-L67.74 ± 16.560.00 ± 17.269.23 ± 16.366.67 ± 16.60.35
ShuffleNet-V283.87 ± 12.980.00 ± 14.185.71 ± 12.382.35 ± 13.40.68
CWTEfficientNet-B074.19 ± 15.466.67 ± 16.676.92 ± 14.872.22 ± 15.80.49
ResNet-1867.74 ± 16.553.33 ± 17.672.73 ± 15.765.00 ± 16.80.36
MobileNetV3-L67.74 ± 16.553.33 ± 17.672.73 ± 15.765.00 ± 16.80.36
ShuffleNet-V261.29 ± 17.253.33 ± 17.661.54 ± 17.161.11 ± 17.20.22
SSTEfficientNet-B070.97 ± 16.060.00 ± 17.275.00 ± 15.268.42 ± 16.40.42
ResNet-1870.97 ± 16.080.00 ± 14.166.67 ± 16.676.92 ± 14.80.43
MobileNetV3-L67.74 ± 16.560.00 ± 17.269.23 ± 16.366.67 ± 16.60.35
ShuffleNet-V274.19 ± 15.473.33 ± 15.673.33 ± 15.675.00 ± 15.20.48
HC vs. PD-OFF (Subject-Wise CV Strategy)
TFRCNNACC (%)PRE (%)SEN (%)SPE (%)MCC
DWTEfficientNet-B074.19 ± 15.466.67 ± 16.676.92 ± 14.872.22 ± 15.80.49
ResNet-1883.87 ± 12.980.00 ± 14.185.71 ± 12.382.35 ± 13.40.68
MobileNetV3-L77.42 ± 14.773.33 ± 15.678.57 ± 14.476.47 ± 14.90.55
ShuffleNet-V277.42 ± 14.773.33 ± 15.678.57 ± 14.476.47 ± 14.90.55
CWTEfficientNet-B080.65 ± 13.973.33 ± 15.684.62 ± 12.777.78 ± 14.60.62
ResNet-1877.42 ± 14.773.33 ± 15.678.57 ± 14.476.47 ± 14.90.55
MobileNetV3-L83.87 ± 12.973.33 ± 15.691.67 ± 9.778.95 ± 14.40.69
ShuffleNet-V280.65 ± 13.980.00 ± 14.180.00 ± 14.181.25 ± 13.70.61
SSTEfficientNet-B077.42 ± 14.773.33 ± 15.678.57 ± 14.476.47 ± 14.90.55
ResNet-1877.42 ± 14.766.67 ± 16.683.33 ± 13.173.68 ± 15.50.56
MobileNetV3-L77.42 ± 14.773.33 ± 15.678.57 ± 14.476.47 ± 14.90.55
ShuffleNet-V280.65 ± 13.973.33 ± 15.684.62 ± 12.777.78 ± 14.60.62
Table 10. Comparison of existing EEG-based PD detection studies with the proposed approach on the San Diego dataset.
ReferenceMethodTaskACC
[52]Tunable Q-factor wavelet transform, nonlinear features, Support Vector MachineHC vs. PD-OFF96.13%
HC vs. PD-ON97.65%
[54]Waveform shape, spectral and statistical features, Gaussian process classifierHC vs. PD-OFF85.10%
HC vs. PD-ON83.90%
[55]Phase locking value and power spectral density, LeNet-5HC vs. PD-OFF89.16%
HC vs. PD-ON92.19%
[56]Top-ranked features, Support Vector MachineHC vs. PD-OFF87.09%
[53]Stationary wavelet transform, AlexNet-based CNNHC vs. PD-OFF99.83%
HC vs. PD-ON99.83%
This StudySST, EfficientNet-B0HC vs. PD-ON97.26%
CWT, EfficientNet-B0HC vs. PD-OFF97.28%
Disclaimer/Publisher’s Note: The statements, opinions and data contained in all publications are solely those of the individual author(s) and contributor(s) and not of MDPI and/or the editor(s). MDPI and/or the editor(s) disclaim responsibility for any injury to people or property resulting from any ideas, methods, instructions or products referred to in the content.