Article

Using Geometric Approaches to the Common Transcriptomics in Acute Lymphoblastic Leukemia and Rhabdomyosarcoma: Expanding and Integrating Pathway Simulations

by
Christos Tselios
1,†,
Ioannis Vezakis
2,†,
Apostolos Zaravinos
3,4 and
George I. Lambrou
2,5,6,*
1
Laboratory for the Research of Musculoskeletal Disorders, National and Kapodistrian University of Athens, 14561 Athens, Greece
2
Biomedical Engineering Laboratory, School of Electrical & Computer Engineering, National Technical University of Athens, 11527 Athens, Greece
3
Department of Life Sciences, European University Cyprus, 1516 Nicosia, Cyprus
4
Cancer Genetics, Genomics and Systems Biology Laboratory, Basic and Translational Cancer Research Center (BTCRC), 1516 Nicosia, Cyprus
5
Choremeio Research Laboratory, First Department of Pediatrics, National and Kapodistrian University of Athens, 11527 Athens, Greece
6
University Research Institute of Maternal and Child Health & Precision Medicine, National and Kapodistrian University of Athens, 11527 Athens, Greece
*
Author to whom correspondence should be addressed.
These authors contributed equally to this work.
BioMedInformatics 2025, 5(3), 45; https://doi.org/10.3390/biomedinformatics5030045
Submission received: 3 June 2025 / Revised: 6 August 2025 / Accepted: 8 August 2025 / Published: 15 August 2025
(This article belongs to the Section Methods in Biomedical Informatics)

Abstract

Background: The amount of data produced from biological experiments has increased geometrically, posing a challenge for the development of new methodologies that could enable their interpretation. We propose a novel approach for the analysis of transcriptomic data derived from acute lymphoblastic leukemia (ALL) and rhabdomyosarcoma (RMS) cell lines, using bioinformatics, systems biology and geometrical approaches. Methods: The expression profile of each cell line was investigated using microarrays, and identified genes were used to create a systems pathway model, which was then simulated using differential equations. The transcriptomic profile used involved genes with similar expression levels. The simulated results were further analyzed using geometrical approaches to identify common expressional dynamics. Results: We simulated and analyzed the system network using time series, regression analysis and helical functions, detecting predictable structures after iterating the modelled biological network, focusing on TIE1, STAT1, MAPK14 and ADAM17. Our results show that such common attributes in gene expression patterns can lead to more effective treatment options and help in the discovery of universal tumor biomarkers. Discussion: Our approach was able to identify complex structures in gene expression patterns, indicating that such approaches could prove useful towards the understanding of the complex tumor dynamics.

1. Introduction

Acute lymphoblastic leukemia (ALL) is the most common childhood malignancy [1]. Rhabdomyosarcoma (RMS), on the other hand, is a rare type of tumor that belongs to the primitive neuroectodermal family of tumors [2,3,4]. Despite the inter- and intratumoral heterogeneity, different patients and cancer types share some common characteristics, such as cellular proliferation outside the body homeostasis, energy consumption and evasion of apoptosis, irrespective of their heterogeneity [1,2,3,4,5]. Some of these traits have already been exploited pharmaceutically [1]. However, the mechanical properties of cancers are widely unknown. We postulate that tumors share common mechanisms, the elucidation of which should help us fight against them.
Until recently, the main approaches were based on the examination of several factors simultaneously. However, this gave a restricted perspective of the phenomenon. Using computational and systems biology, the aforementioned phenomena are better understood. Finding common mechanisms of progression across ALL and rhabdomyosarcoma is performed with reverse engineering and these are then iterated back to the cellular history. Despite the efforts and research in this area, most of the mechanisms underlying childhood cancer are not completely elucidated. Therefore, it is of interest to examine the common mechanisms across different childhood neoplasias.
In this study, we selected the CCRF-CEM and TE-671 cell lines to model T-cell ALL and RMS, respectively. These cell lines represent distinct pediatric malignancies of hematopoietic and mesenchymal origin. Despite their differences, both cancers are known to involve embryonal mechanisms and deregulated cellular programs such as proliferation, metabolism, and resistance to apoptosis. This common developmental background makes these models ideal for identifying potential shared gene expression dynamics and regulatory mechanisms.
We examined the common gene expressional profiles of T-cell ALL and RMS, using the CCRF-CEM and TE-671 cell lines as models. The expression profile of each cell line was investigated using microarrays, revealing co-deregulated (i.e., similarly expressed in both cell systems) genes and pathways common to both cell types, related to metabolic and signal transduction properties of the cancer cells. We then simulated these genes using first-degree differential equations, and the results were further regressed in order to find common expressional dynamics. Such common attributes can lead to more effective treatment options, as well as to the discovery of universal tumor biomarkers. Thus, we examined the common regulatory mechanisms between the two cell lines, based on their expression profile.

2. Materials and Methods

2.1. In Vitro Cell Models

We used the CCRF-CEM (ALL) [6,7,8] and TE-671 (RMS) as model cell lines. Both cell lines were purchased from the European Collection of Cell Cultures (ECACC) and cultivated using standard conditions, as previously described in detail [9]. Specifically, CCRF-CEM cells were maintained in RPMI-1640 medium (Gibco, Thermo Fisher Scientific, Waltham, MA, USA) supplemented with 10% fetal bovine serum (FBS; Gibco), 2 mM L-glutamine (Gibco) and 100 U/mL streptomycin/penicillin. TE-671 cells were cultured in Dulbecco’s Modified Eagle Medium (DMEM; Gibco) supplemented with 10% FBS, 2 mM L-glutamine and 100 U/mL streptomycin/penicillin. Both cell lines were maintained at 37 °C, 5% CO2 and 100% humidity.
The TE-671 was initially reported to be obtained from a cerebellar medulloblastoma, before irradiation therapy, of a six-year old Caucasian female [10] and was characterized later on [11]. It is known today that the TE-671 cell line is identical or highly similar to the rhabdomyosarcoma-derived RD cell line, though it was historically reported as a medulloblastoma line [12]. However, several reports still refer to this cell line as medulloblastoma [13,14]. The complete and detailed experimental procedure is described by Lambrou et al. (2012) [9].

2.2. Microarray Experimentation

Microarray experimentation has been extensively described previously [9,15,16]. In brief, RNA was isolated using TRIzol reagent (Invitrogen, Thermo Fisher Scientific) following the manufacturer’s protocol. RNA quality was assessed using spectrophotometry (SmartSpec 3000, BioRad, Berkley, CA, USA) with samples having A260/A280 ratios of 1.8–2.0 selected for further processing. RNA integrity was confirmed via 2% agarose gel electrophoresis. Samples were DNase-treated (RQ1 DNAse, Promega, Fitchburg, WI, USA) and further purified using the RNeasy mini kit (Qiagen, Hilden, Germany).
Gene expression profiling was investigated using two platforms of 1.2 and 4.8k cDNA transcripts. RNA from CCRF-CEM cells was stained with Cy3 (reference) and RNA from TE-671 cells with Cy5 (experiment) using the CyScribe Post-Labeling kit (GE Healthcare, Buckinghamshire, UK). Hybridization was performed overnight at 55 °C, followed by washing the next day. Slides were scanned with a ScanArray 4000 XL microarray scanner, and images were generated with ScanArray microarray acquisition software (Perkin-Elmer Inc., Waltham, MA, USA). The complete and detailed experimental procedure is described by Lambrou et al. (2012) [9].

2.3. Experimental Workflow

The steps we followed for analysis have been previously described in detail [9,15,16] and include the following: (a) cell culture and growth as described in Section 2.1; (b) allowing cell proliferation to reach the desired extent; (c) cell proliferation measurements; (d) cell collection, at desired time points, for further processing; (e) cell collection for RNA and DNA extraction, as well as protein extraction; (f) collection of cell culture supernatants for the measurement of extracellular molecules and factors; (g) flow cytometry; (h) extraction of the aforementioned molecules; (i) flow cytometry to assess cell death, cell size, granulation and cell cycle distribution; (j) computational analysis of flow cytometry data; (k) microarray experimental design and experimentation between selected samples; (l) computational analysis of microarray data; (m) statistical analysis and clustering of the differentially expressed genes; (n) prediction of Transcription Factor Binding Motifs (TFBMs); (o) chromosome distribution analyses; (p) Gene Ontology (GO) analyses; (q) pathway participation and mapping analyses; (r) pathway simulations; (s) protein–protein interactions prediction; and (t) the creation of the systems model, based on the transcripts identified through microarray experimentation.

2.4. Creation of the Systems Biology Model

The systems model was created with SimBiology, using MATLAB® R2019b (MathWorks, Natick, MA, USA). This environment provides a block diagram editor for building models, which can be further simulated with a library of known pharmacokinetic, pharmacodynamic and chemical dynamic models.

2.5. Simulation of the Systems Biology Model

Similarly, the system’s simulation was performed using SimBiology in MATLAB® R2019b. The complete systems biological map is described by Tselios et al. (2021) [16]. The principal structure of such a model is termed “species” (referred to as “molecules” or “species” throughout the text), which in our model refers to the simulated genes that we assumed to produce the respective protein. The model is also separated into different “compartments,” each one representing a cellular entity (e.g., membrane, cytoplasm, nucleus, etc.), and each species is located in its respective compartment. In addition, based on the results obtained from the Gene Ontology analysis, the respective species were added to their identified “compartments.” The interactions between genes were determined using Coremine Medical (https://coremine.com/medical/, accessed on 5 November 2022). In cases where no interaction could be determined, we curated interactions between genes from the literature. Gene Ontology enrichment was performed with the WebGestalt web application [17,18,19,20,21]. Gene Ontology enrichment is summarized in Supplementary Table S1.

2.6. The Analytical and Numerical Solutions to the System’s Simulation

In this study, the terms “gene,” “species,” and “molecule” refer to related but context-specific entities. “Genes” denote transcriptomic entities derived from microarray measurements. “Species” refer to simulated components in the systems biology model—assumed to represent gene products (proteins) based on Gene Ontology and pathway mapping. “Molecule” is used interchangeably with “species” in the context of dynamic simulation. For clarity, we now consistently use “species” when discussing elements of the model and “genes” when referring to original transcriptomic data.
The biological system we modeled was described with the following simple ordinary equations, which are of the form
u S = δ C S δ t
where us is the reaction speed of the species s, and δCs is the difference in concentration of the species s in a time margin δt. Equation (1) can be rewritten as
u S = d C S d t
Such a reaction could be described in a general form such as:
C R μ : a μ 1 R 1 + a μ 2 R 2 + + a μ n R n k μ b μ 1 P 1 + b μ 2 P 2 + + b μ n P n
where aμ and bμ are the stoichiometric factors of the reaction (CR); R and P are the reactants and products, respectively; and kμ is the reaction rate.
In the case of a network of reactions, which, in the present case, would be the interconnected signaling pathway, this can be solved by solving a system of equations of the form
d C i ( t ) d t = μ = 1 M a μ i k μ j = 1 n R j i μ j ( t ) , i = 1 , 2 , , n
For the present model, in order to describe interactions between molecules (the species), we used the law of mass action, as follows:
a R 1 + b R 2 k c P 1 + d P 2
where the reaction constant k is given by
k = C P 1 c C P 2 d C R 1 a C R 2 b
where CR,P are the concentrations of the respective reactants and products. Therefore, for the reaction of two or more species, we can formulate a differential equation describing the concentration change rate with respect to time, such as:
u R 1 , R 2 , P 1 , P 2 = 1 a d C R 1 d t = 1 b d C R 2 d t = 1 c d C P 1 d t = 1 d d C P 2 d t
For solving such a massive system of differential equations, we have used the explicit tau approximation method, which involves the calculation of the stochastic system by a leap τ, where the change in each step is described by
x ( t + τ ) = x ( t ) + P ( τ x ( t ) )
where P(τx′(t)) is a Poisson distributed random variable with mean τx′(t). All simulations were performed for 21 s, which produced a matrix with dimensions 84 × 185, which was further used for data analysis. In addition, in order to graphically represent our data, we applied a polar transformation of Cartesian data. Polar transformation for two coordinates x, y is estimated by the reverse tan function of the angle θ and the radius (r) of the circle passing from the (x,y) point [16].

2.7. Modelling the Simulated Data

Having produced the data from the systems simulation, we then modelled these data and in such a way that a more global pattern could be unraveled. Our main hypothesis was that there is a way to model data including all variables and not only two or three variables at a time. This was derived from a simple thought, meaning that if molecule’s regulation is coordinated in the cellular environment, we should be able to manifest it in a global manner. Therefore, we developed plots of one variable vs. another and added iterations of the same kind in the 3D space. Two- and three-dimensional spline curves were constructed using Matlab®.
First, data were treated as time series, plotting “species” expression over time. We then performed regression of three variables using equations of the form
f ( x , y ) = a n x n + a n 1 x n 1 y + a n 2 x n 2 y 2 + + a 2 x 2 y n 2 + a 1 x y n 1 + a 0 y n
In addition, we modelled the iterated 3D spline curves using helical functions of the form
f ( x , y ) = sin ( a x ) r 1 + cos ( a y ) r 2

3. Results

To facilitate the interpretation of our findings, we begin with a brief overview of the analytical strategy and the underlying dataset. We analyzed microarray-derived transcriptomic data from two distinct pediatric cancer cell lines—CCRF-CEM (T-cell acute lymphoblastic leukemia) and TE-671 (rhabdomyosarcoma)—with the goal of identifying shared expression dynamics. Instead of focusing on differentially expressed genes, we concentrated on genes with similar expression profiles across both cell lines, hypothesizing that these may reflect shared oncogenic or metabolic processes.
These similarly expressed genes (termed “species” within our systems model) were embedded into a pathway-based network and simulated using differential equations derived from known biochemical interactions. The resulting data were analyzed geometrically—using both Cartesian and polar transformations—to explore potential co-regulatory structures and dynamic behaviors not captured by conventional linear methods.

3.1. The Time-Series Iteration of the Simulated Data

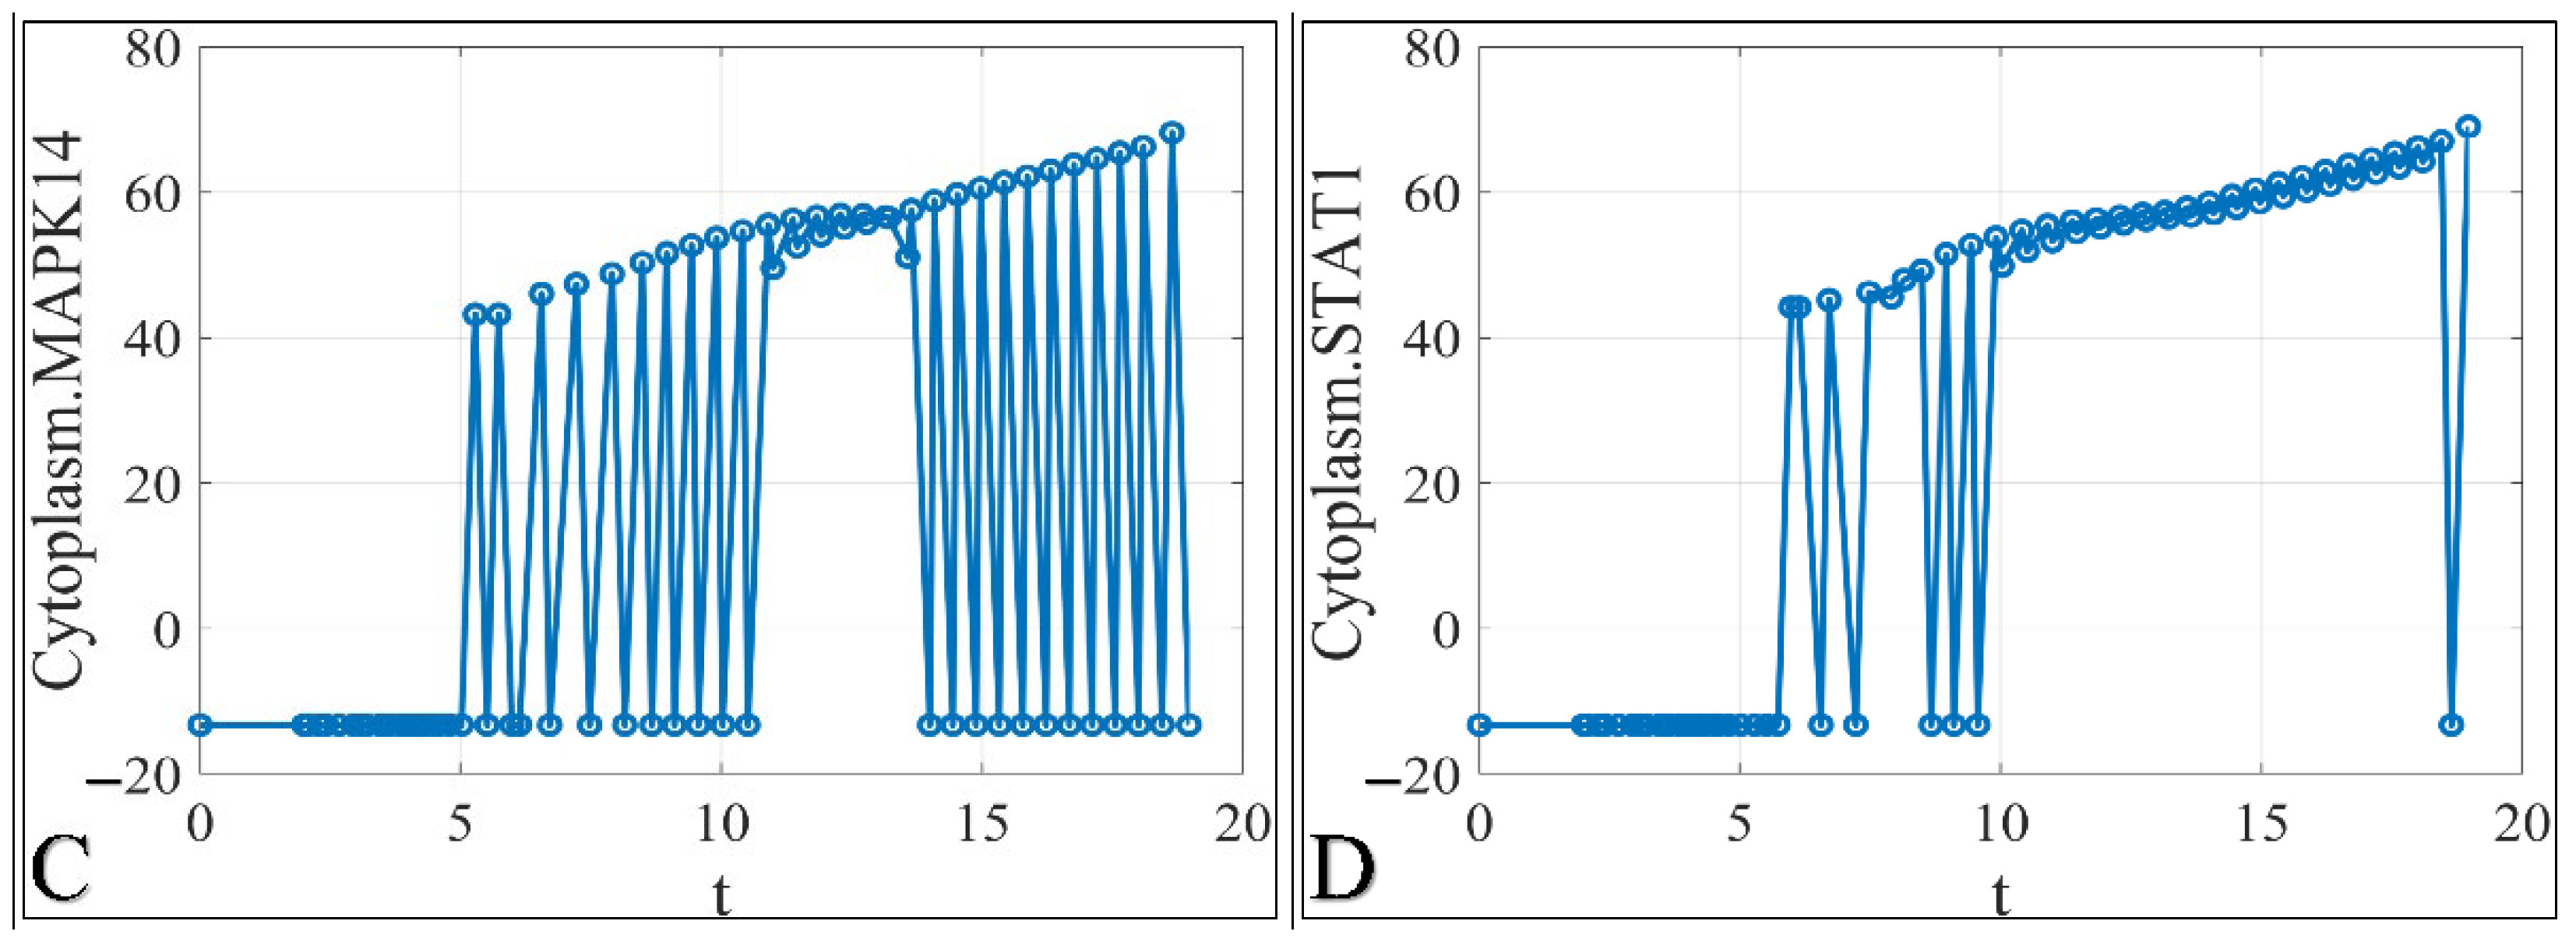
We selected four representative genes—TIE1 [22,23], ADAM17 [24,25], MAPK14 [26,27,28] and STAT1 [9,29,30]—for detailed simulation and visualization, based on the following two criteria: (1) they exhibited similar expression levels across both cell lines, and (2) they are well-established regulators of cancer-relevant processes such as angiogenesis, inflammation, signal transduction and immune response. These genes also demonstrated distinct dynamic behaviors in the simulation (e.g., oscillatory vs. logistic), which made them representative of the wider spectrum of modeled species. This diversity allowed us to showcase how different dynamic regimes could emerge from a common network model. Additional genes demonstrating similar expression behaviors are presented in Supplementary Figures S1 and S2. In addition, Supplementary Table S1 provides a full list of modeled genes and their associated Gene Ontology (GO) terms. Further on, these genes are known to be key players in tumor progression and survival as well as developmental differentiation processes. TIE1 manifested a logistic-like curve (Figure 1A), indicating a saturation role in the modelled system. Interesting behavior was manifested by ADAM17 (Figure 1B), MAPK14 (Figure 1C) and STAT1 (Figure 1D), which appeared to follow oscillatory dynamics, indicating non-linear expression. Although we chose these molecules as representative for the identified behaviors of the species in the modelled system, we found similar behavior for several other genes, including CCL11 (Figures S1A and S2A), CDK5 (Figures S1B,C and S2B,C), FLT3 (Figures S1D and S2D), TYR (Figures S1E–G and S2E–G) and USP1 (Figures S1H and S2H). We noticed that most genes manifested an oscillatory pattern, indicating that species are co-regulated and further patterns could be present amongst them. This interesting behavior could be caused by the need for a certain threshold that molecules must reach before being able to act and play their role in cellular physiology.
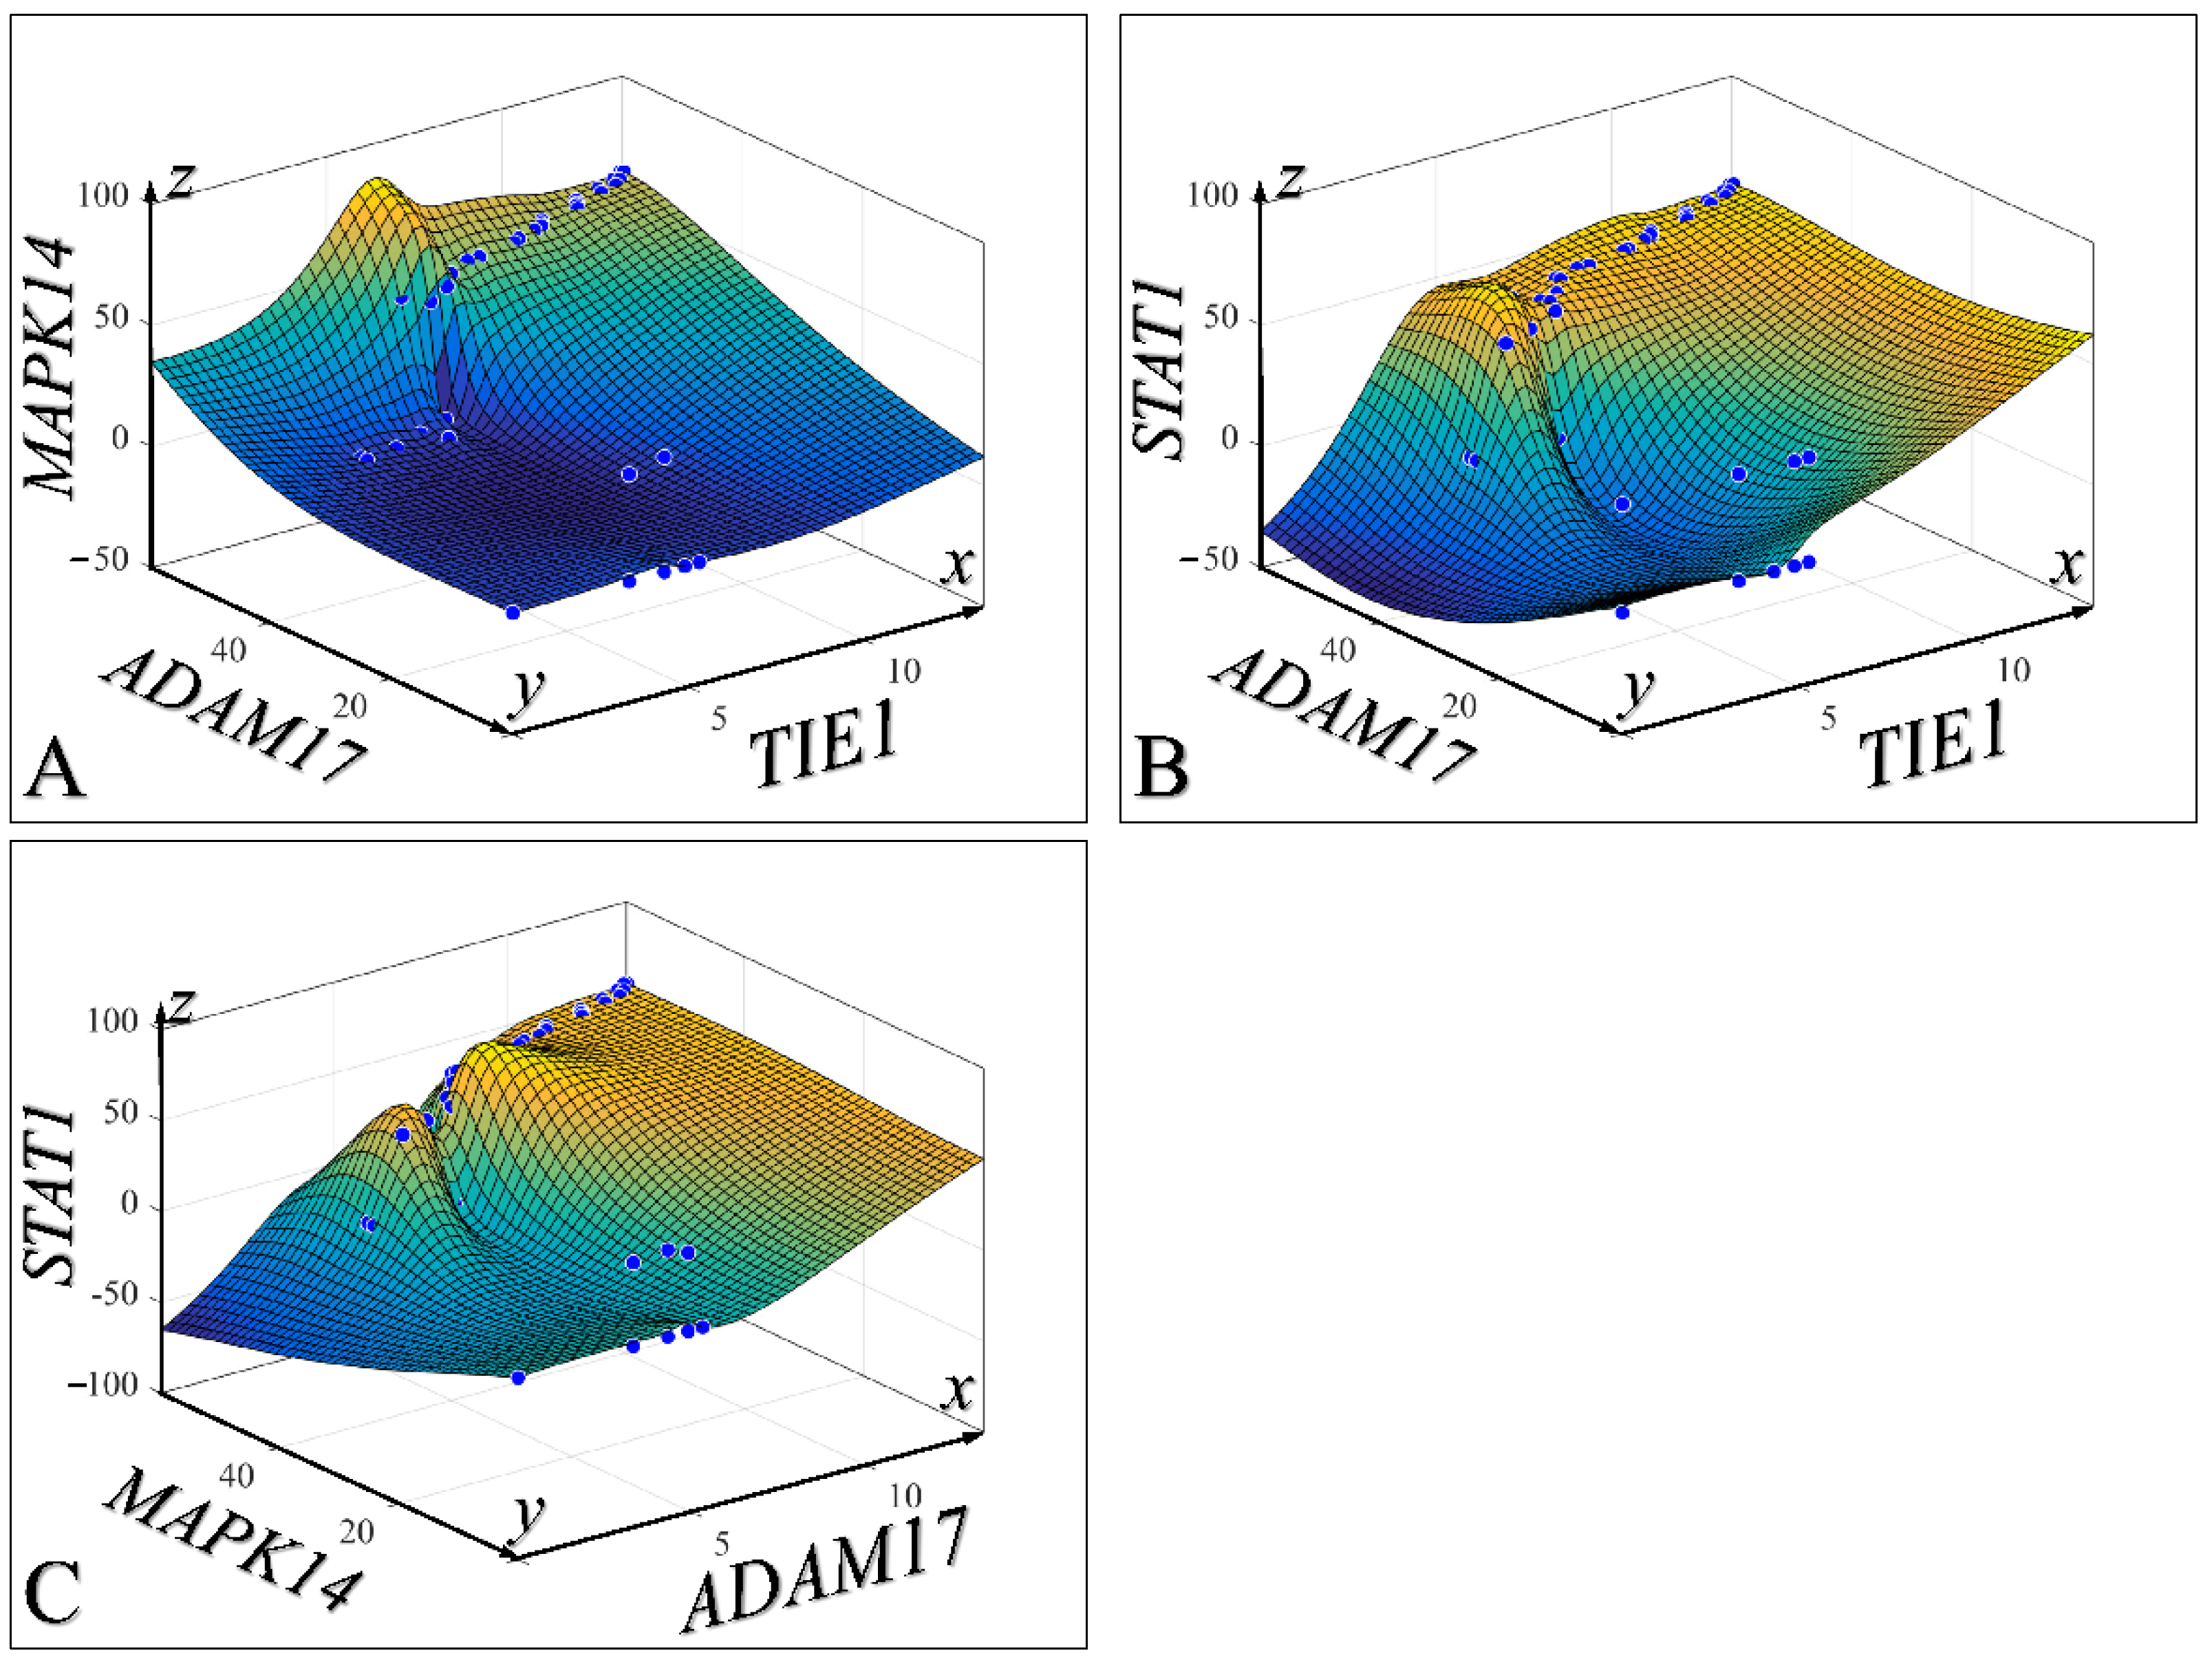
Regressing the aforementioned molecules using 3D polynomial equations, we found that they also manifest a pattern of expression, indicating possible co-regulation in the modeled system (Figure 2). This regression could be noticed at all time points, indicating a correlation and a possible etiological connection among them.

3.2. Polar Transformation of Time Series Iterations

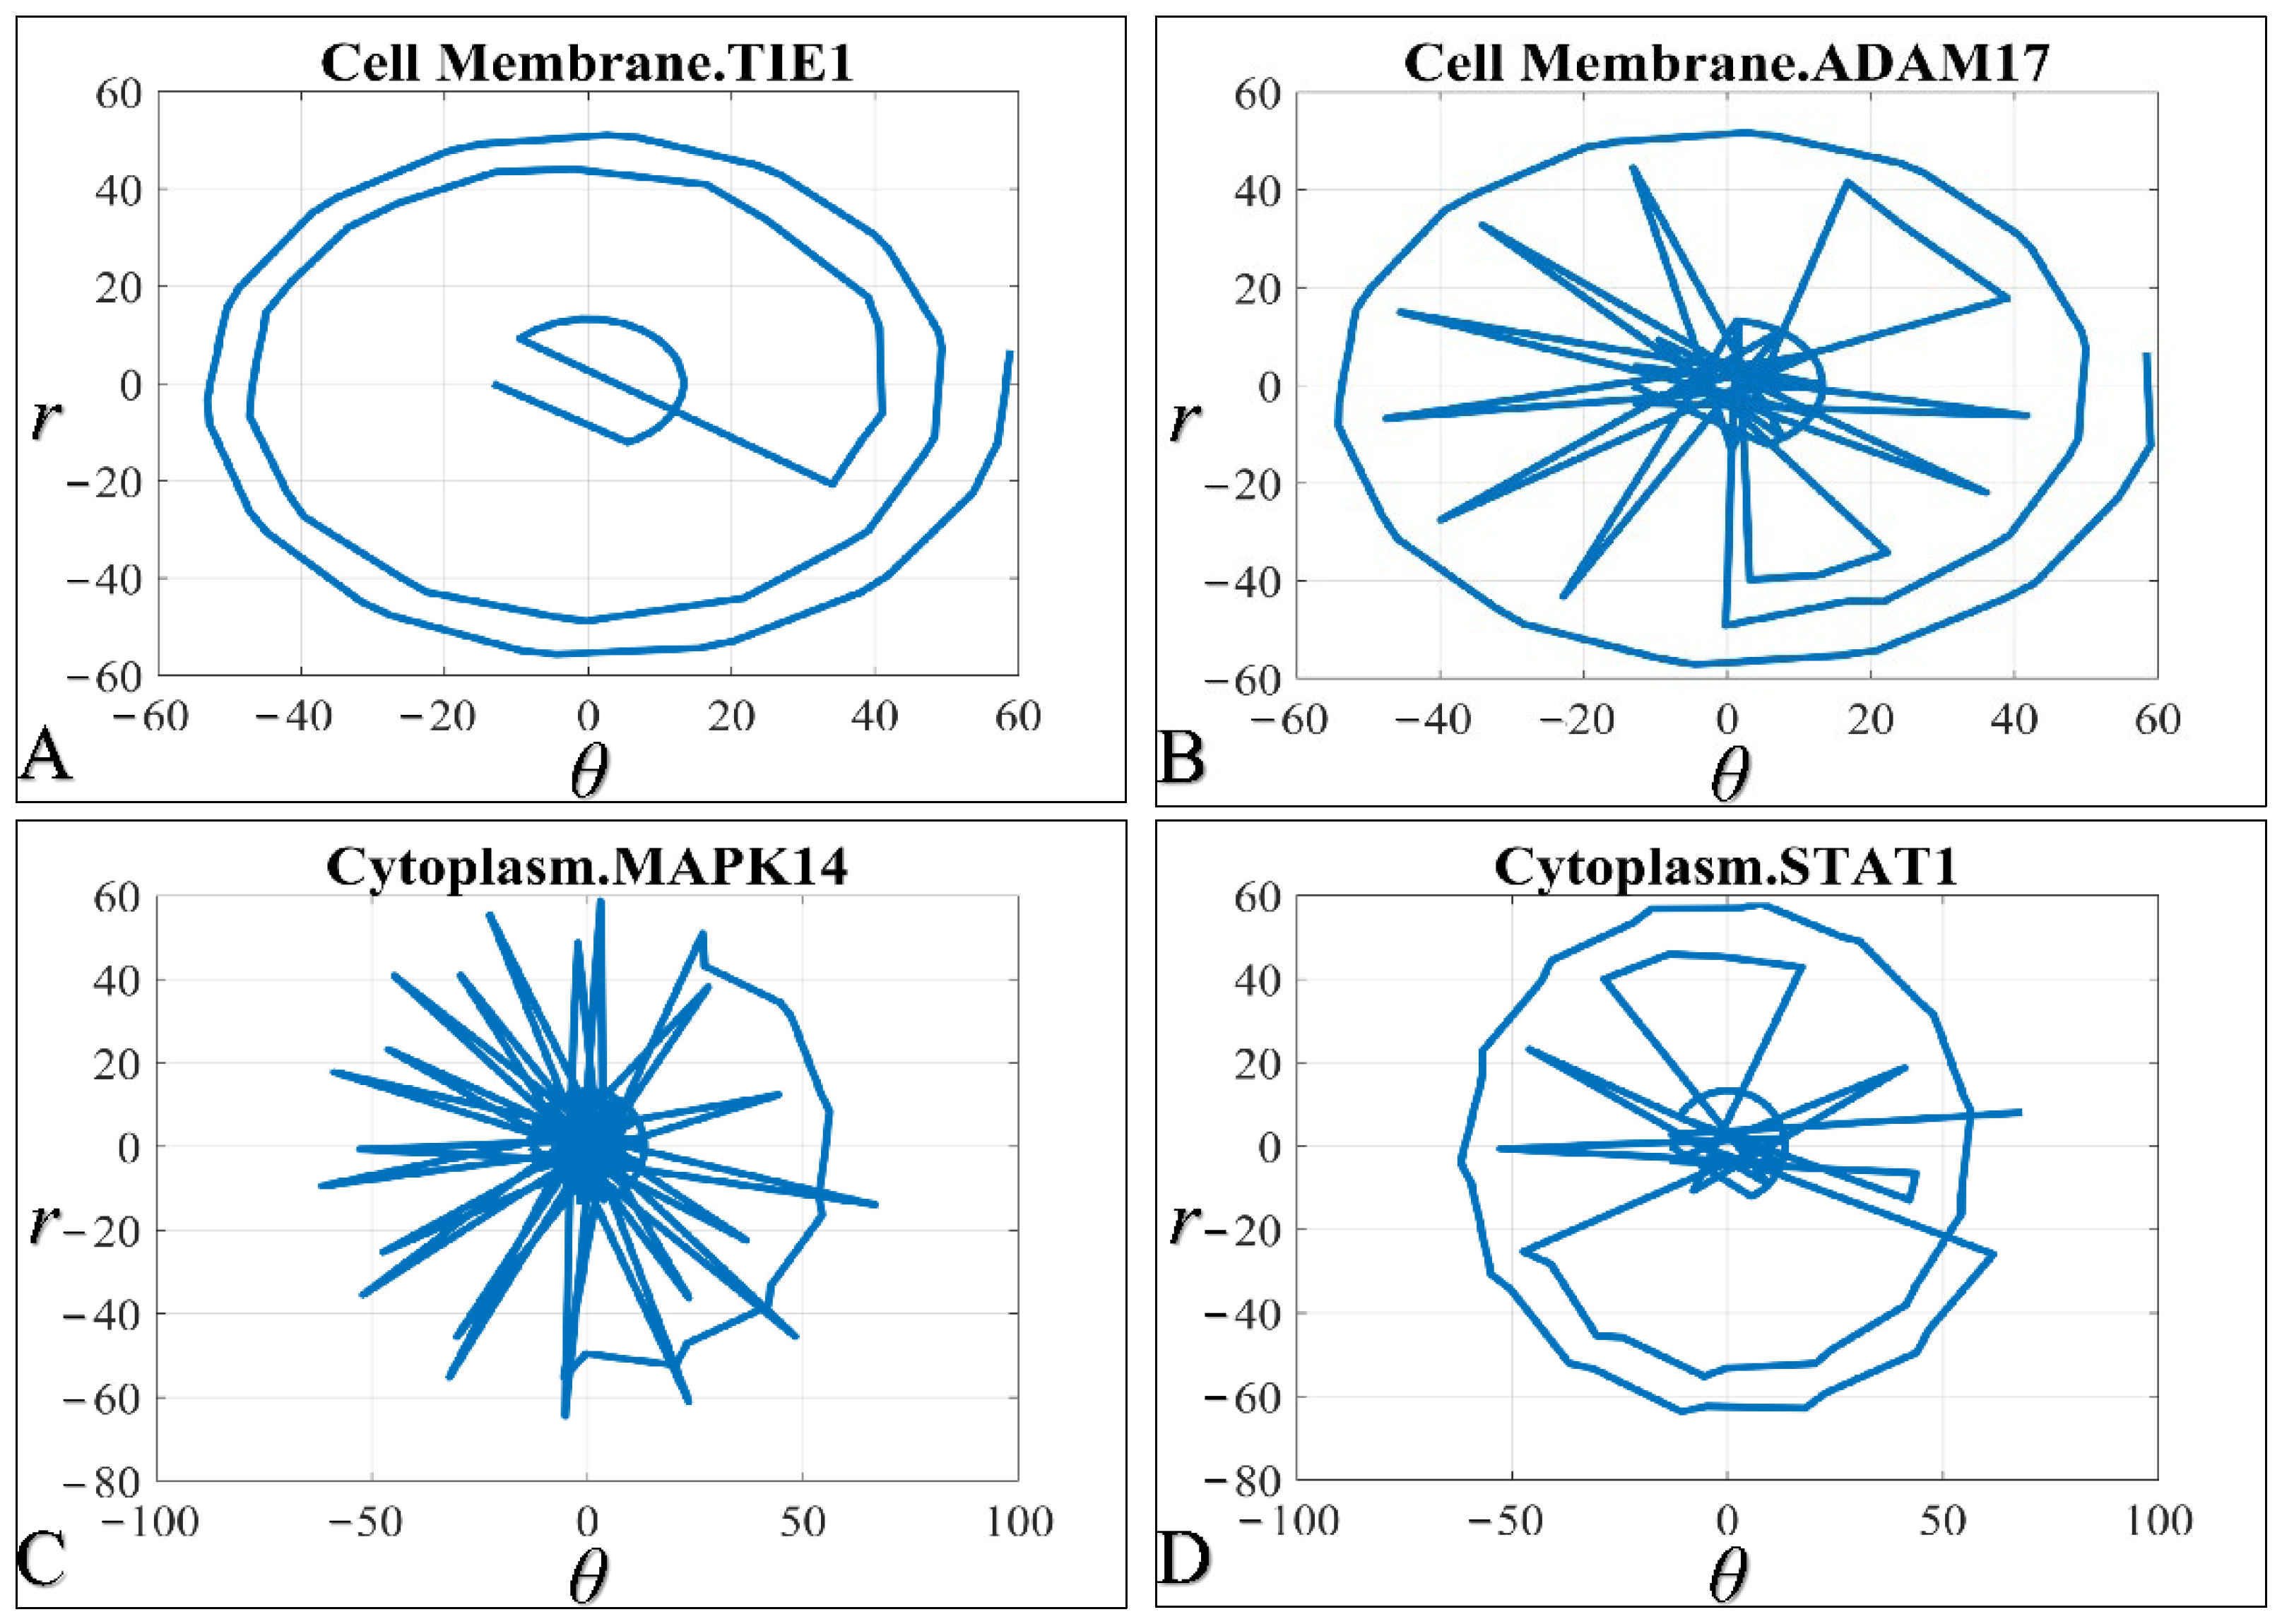
To further analyze the dynamic expression profiles of the simulated species, we applied polar transformations to the Cartesian (time vs. expression) data. In this context, each species’ expression is represented by a radius (r) and angle (θ), calculated from the simulated time-series data. Specifically, we define r = √(x2 + y2), and θ = arctangent (y/x), where x and y represent simulated expression values and time, respectively. This transformation provides a circular or helical visualization of expression dynamics, potentially reflecting cyclical regulatory behavior or feedback control within cellular networks. In particular, all four molecules manifested this behavior (Figure 3).

3.3. Time-Dependent Regression of All Species

To further explore the correlations in the complete modelled system, we performed a regression including all species, time and their expression levels (Figure 4A). The result suggests that the complete system could be modelled with respect to both time and expression levels. On the other hand, the polar transformation of Cartesian time-series data confirmed the presence of a “turbulent”-like graph (Figure 4B), indicating that the system under investigation manifests a global behavior of coordination.
This type of representation is an alternative to a 3D graph of all molecules in time (Figure 4A). Interestingly, time-dependent trajectories manifested a turbulence-like structure (Figure 4B).

3.4. Chromosomal-Dependent Regression of All Species

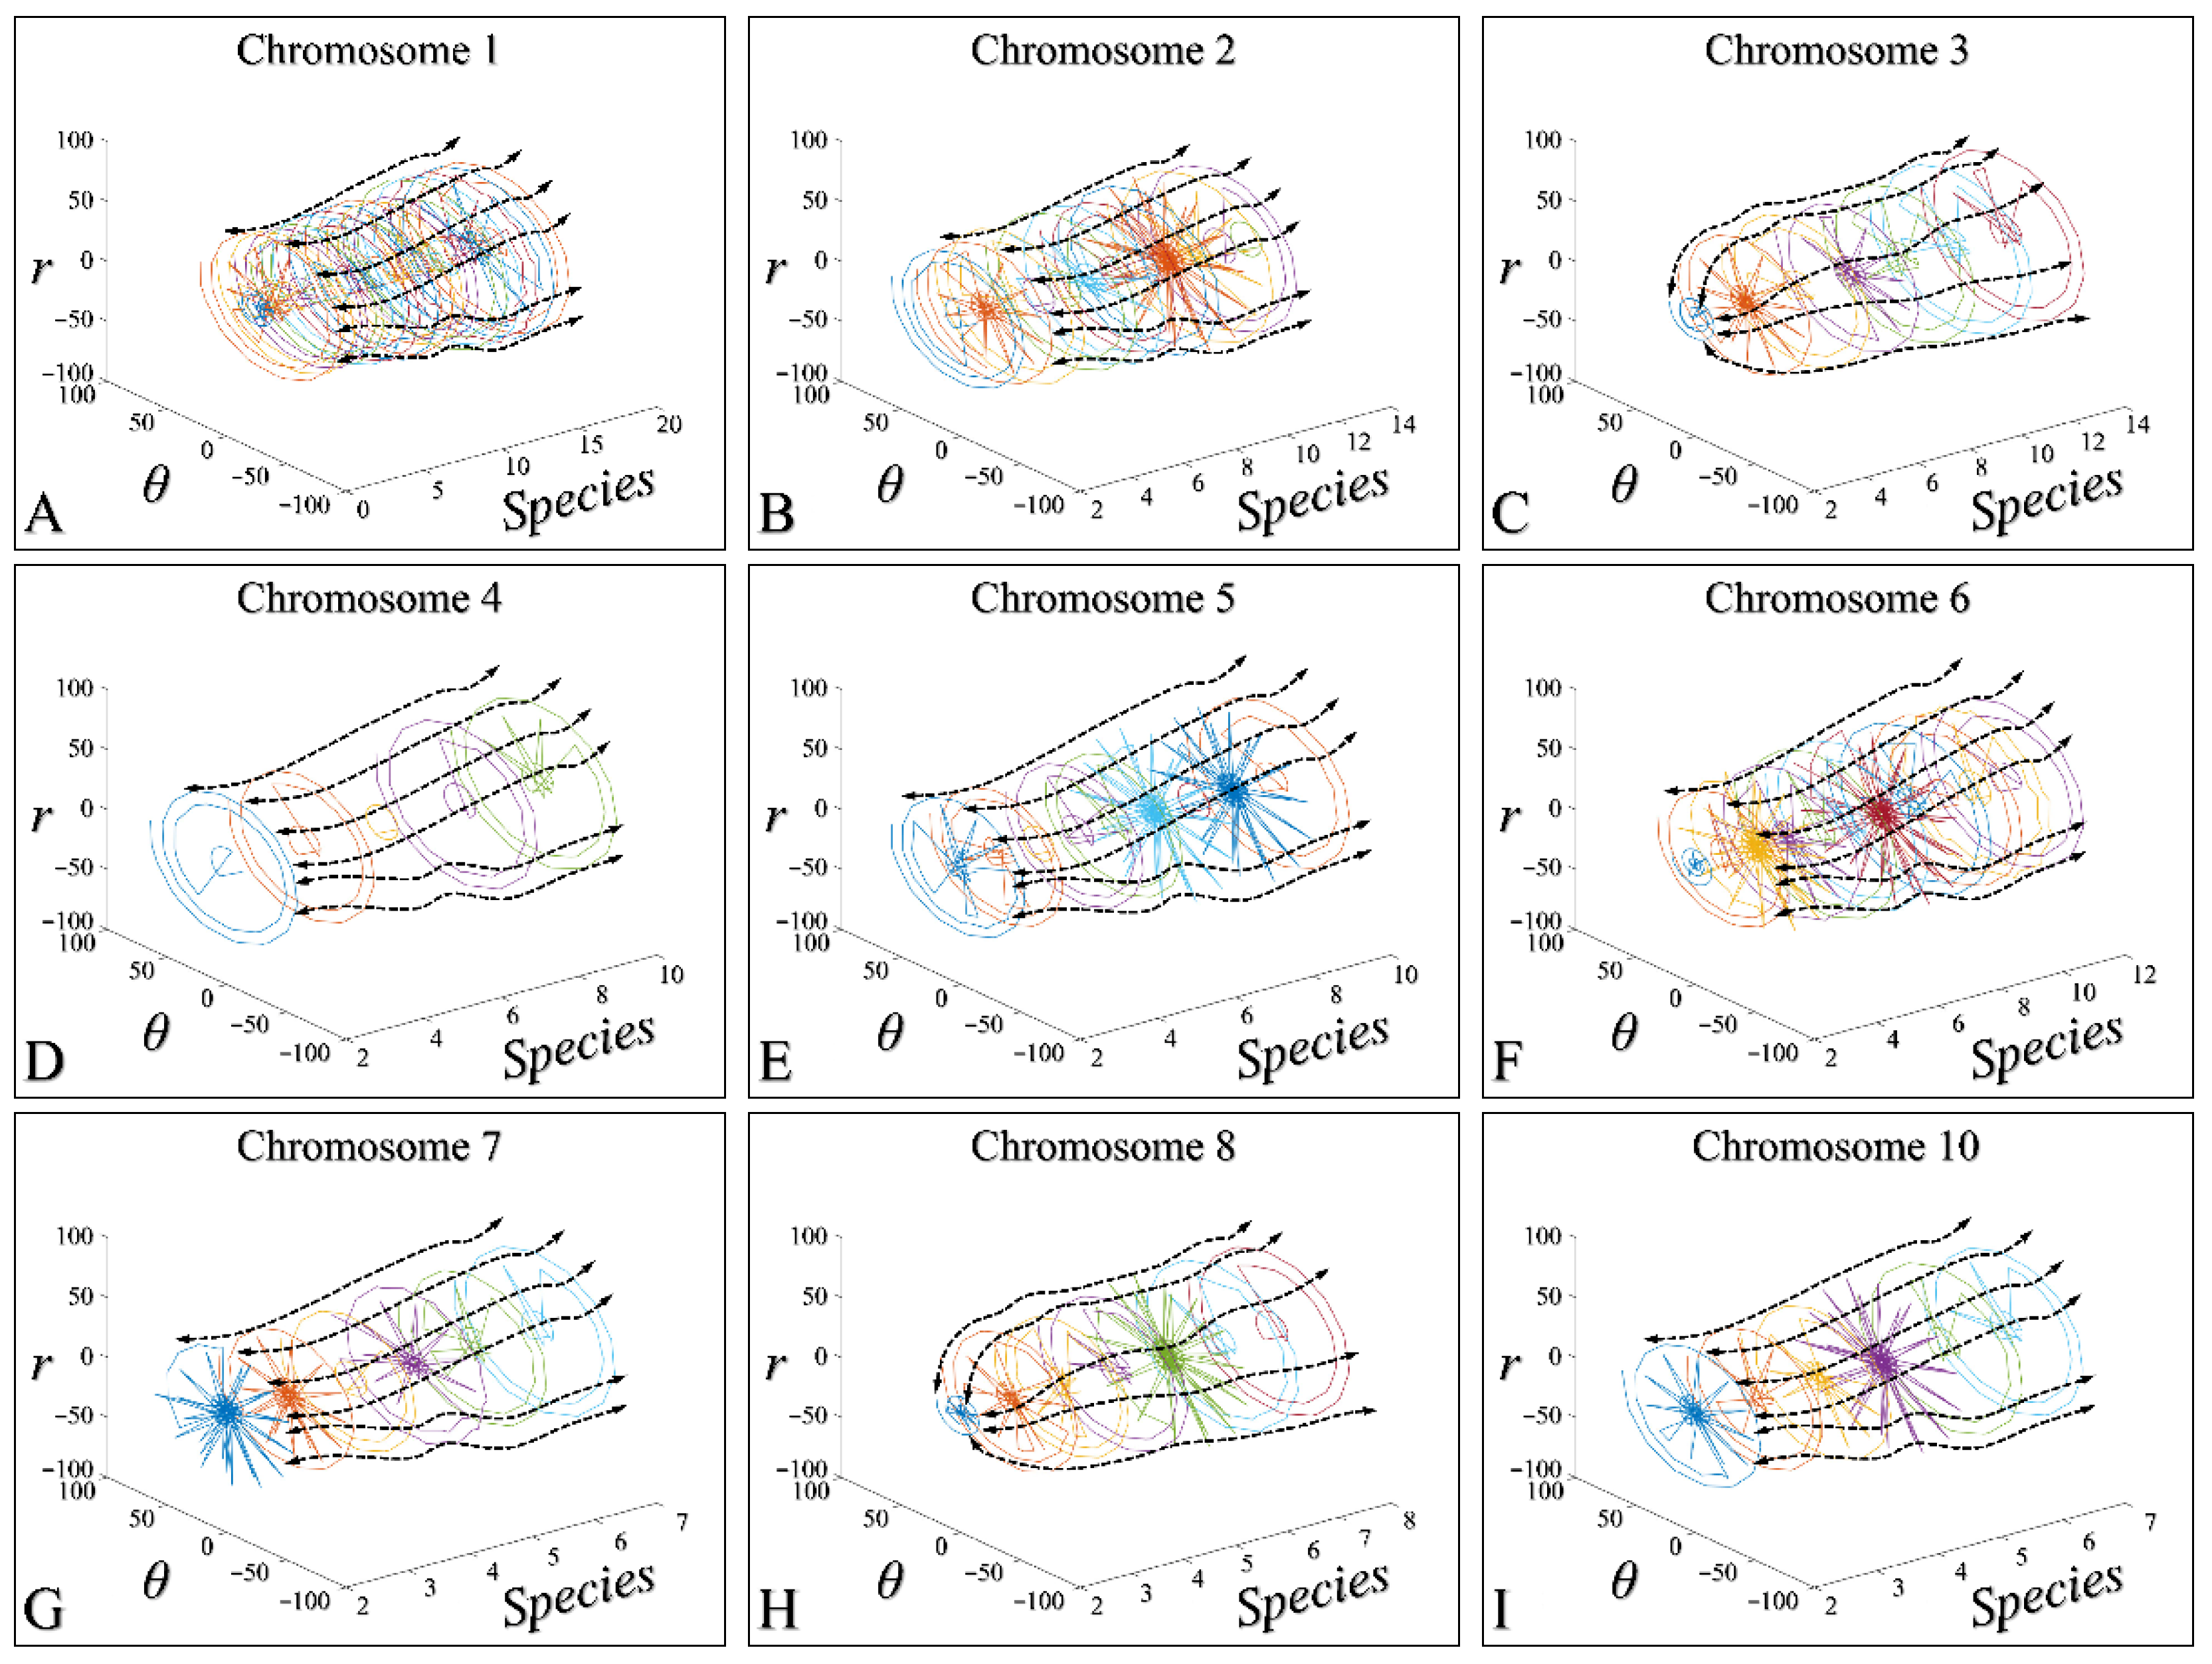
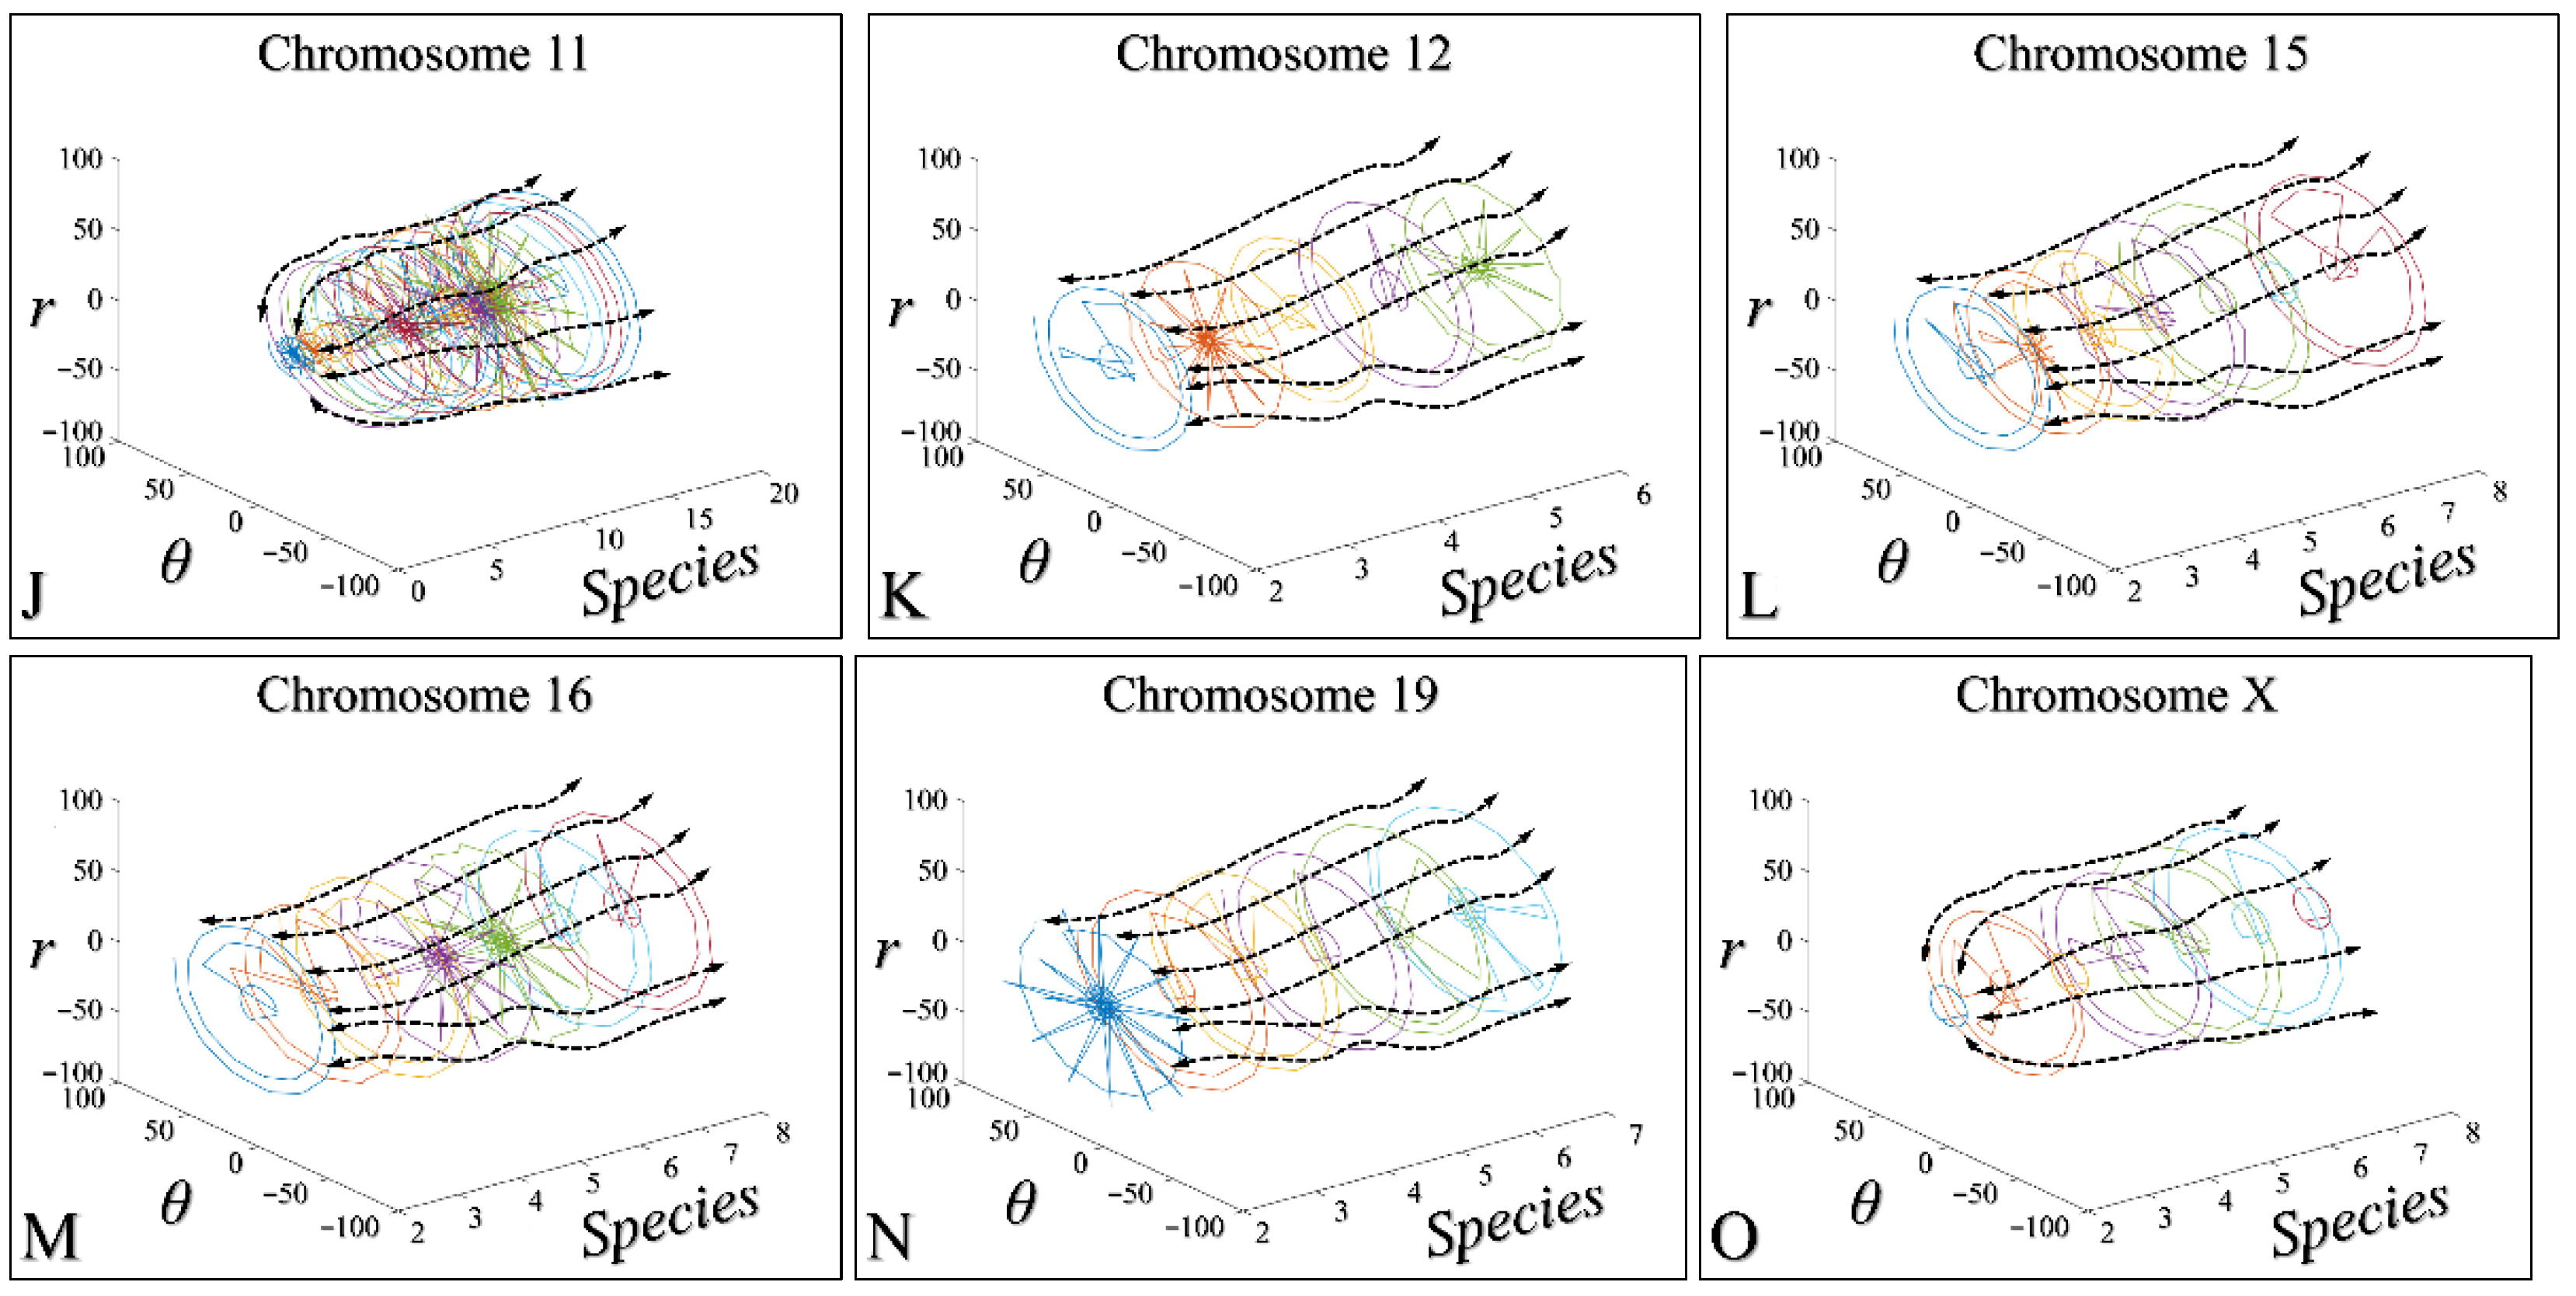
Further on, we tried to investigate the expression of species with respect to their respective gene location. Chromosomal-related expression also manifested quasi-turbulent graphs, which is also manifested by the dashed arrows, indicating the general direction of the model (Figure 5). A total of 15 out of 23 chromosomes are represented.

3.5. Three-Dimensional Modelling of the Time-Dependent Evolution

Based on the aforementioned observations, we questioned whether it is possible to model these graphs in a more formal way. Since the species’ trajectories resembled helices, we performed regressions of specific molecules vs. all other species, based on the functions that produce helical structures. Our approximation gave very interesting results, showing that those trajectories can be modelled with Equations (9) and (10).
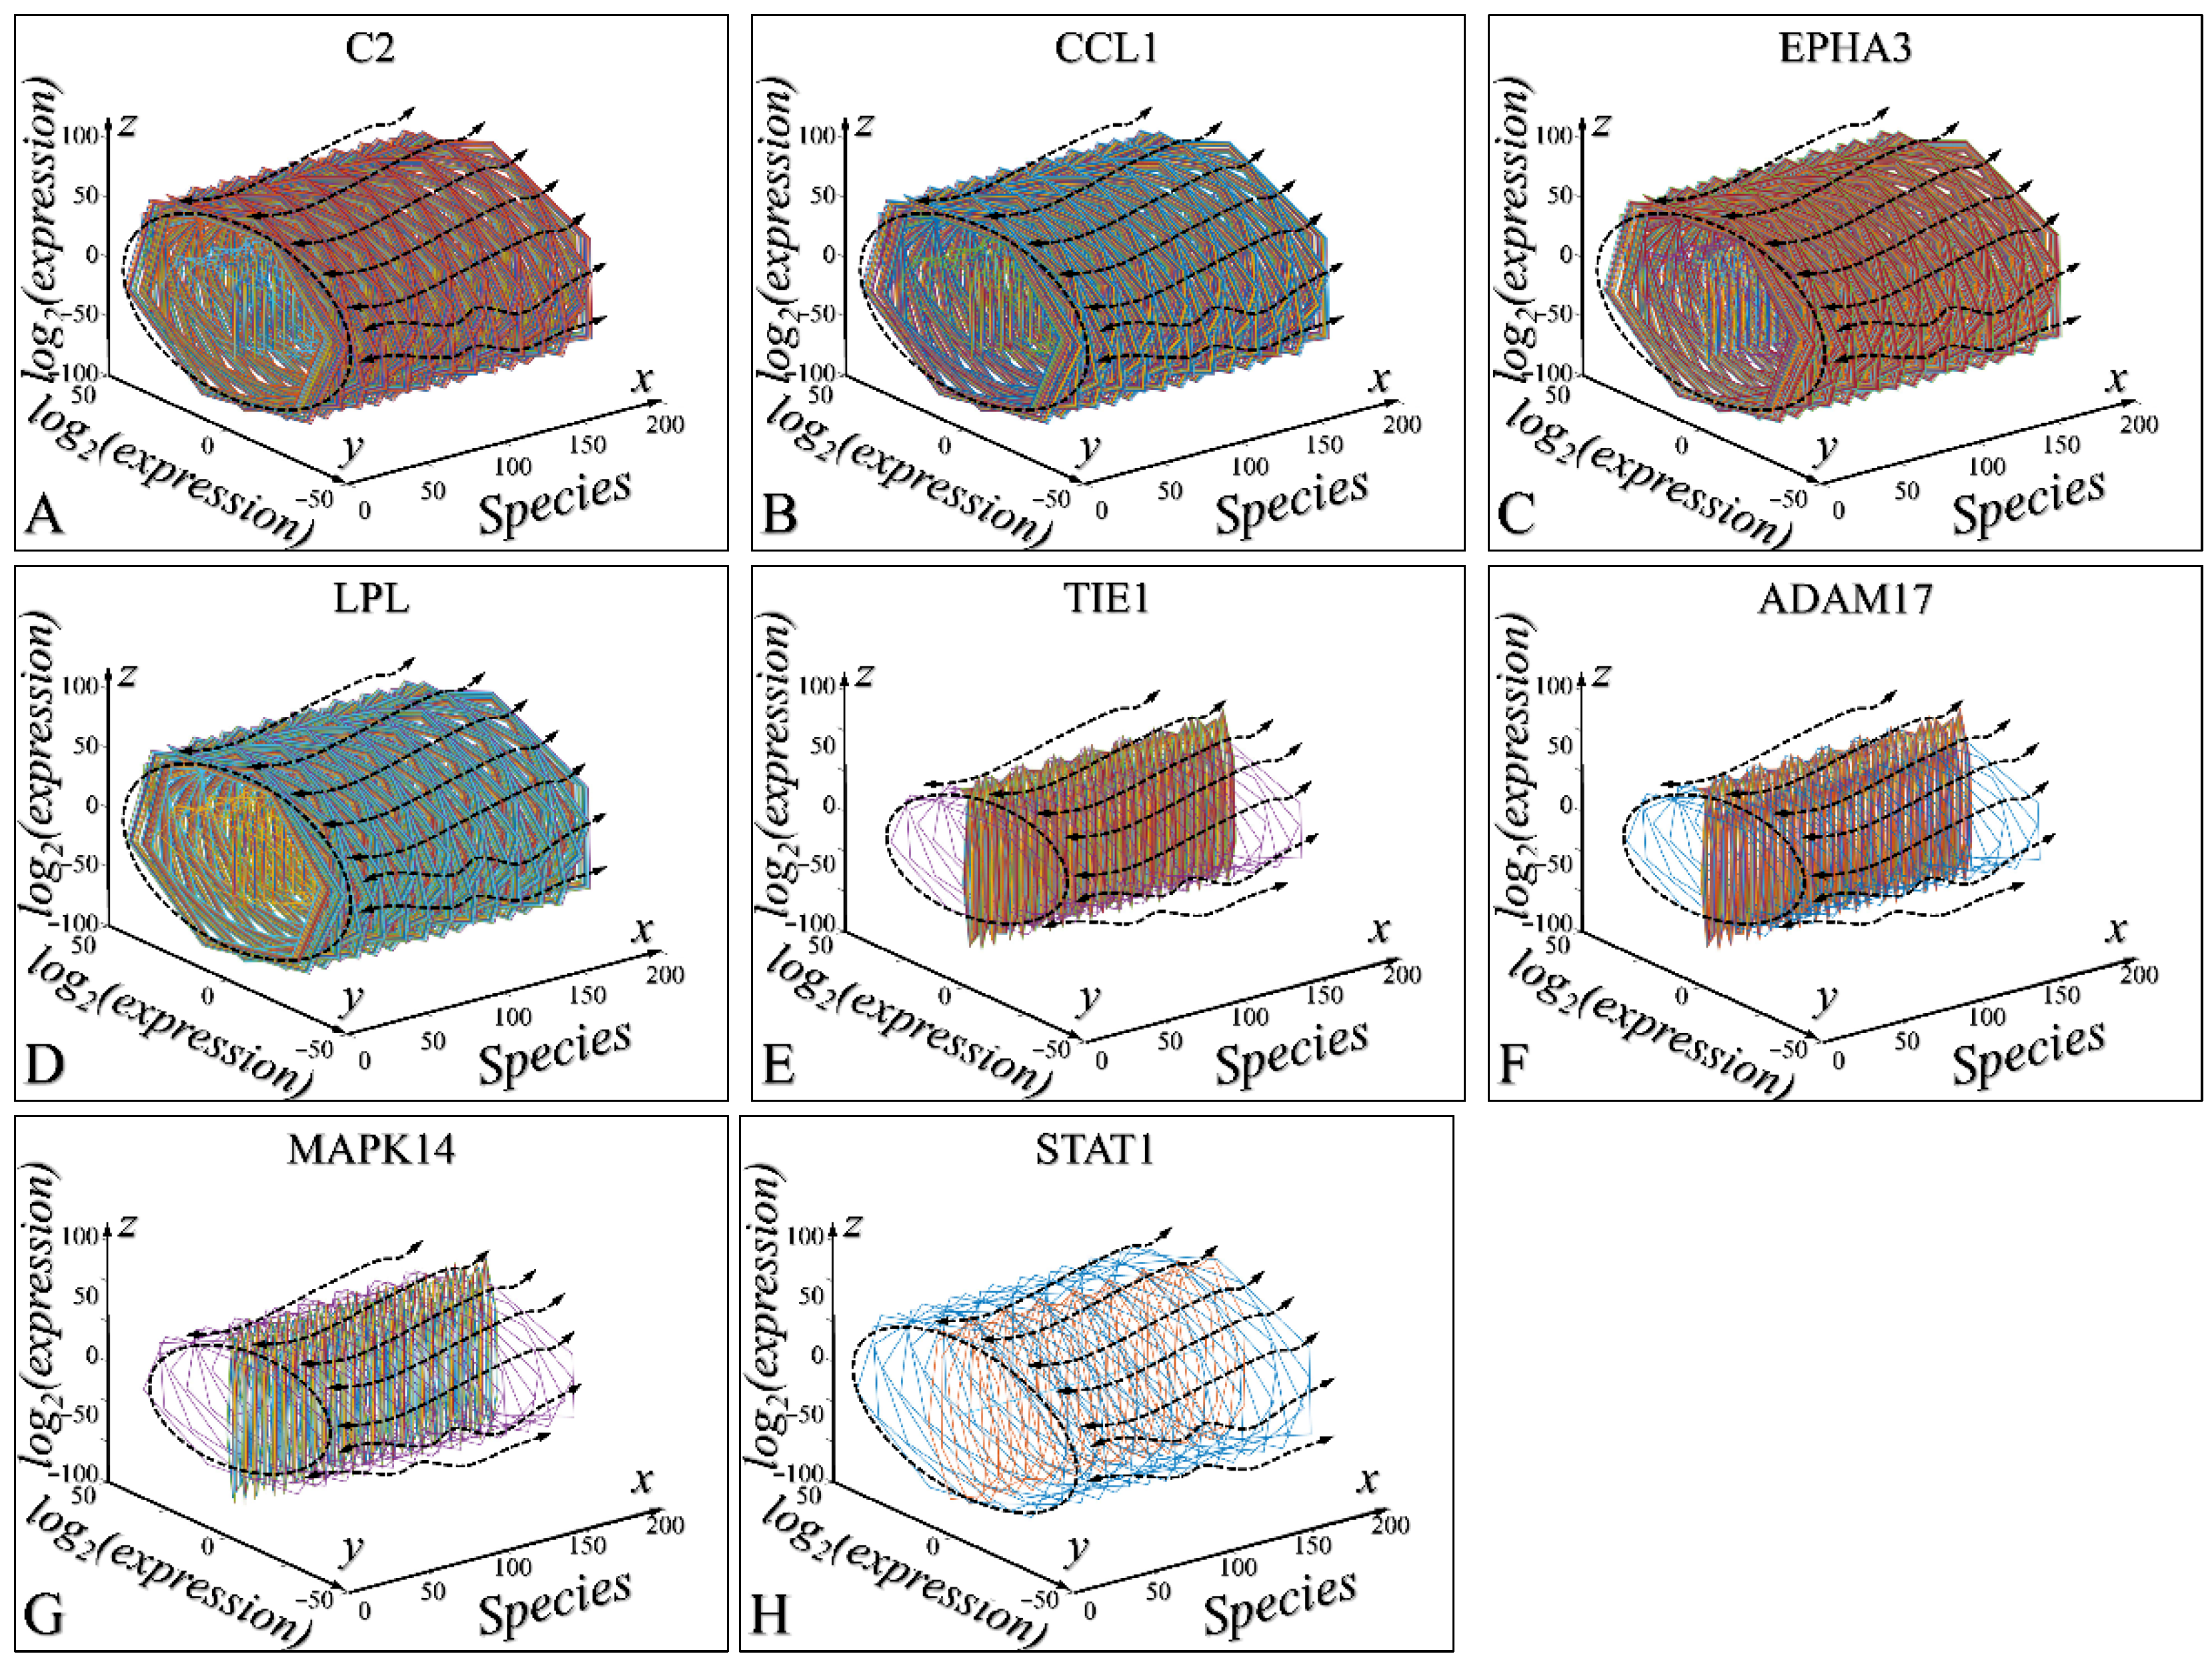
The result of the simulation is presented in Figure 6. The observed behavior of species with respect to time (Figure 4B) manifested a quasi-helical structure, which closely resembled the experimental result (Figure 6). Modelling of these molecules (C2, CCL1, EPHA3, LPL, TIE1, ADAM17, MAPK14 and STAT1 (Figure 6)) showed that the regressed helical structure resembled the experimental data iterated in Figure 5.

3.6. Time-Dependent Evolution of the System for All Species

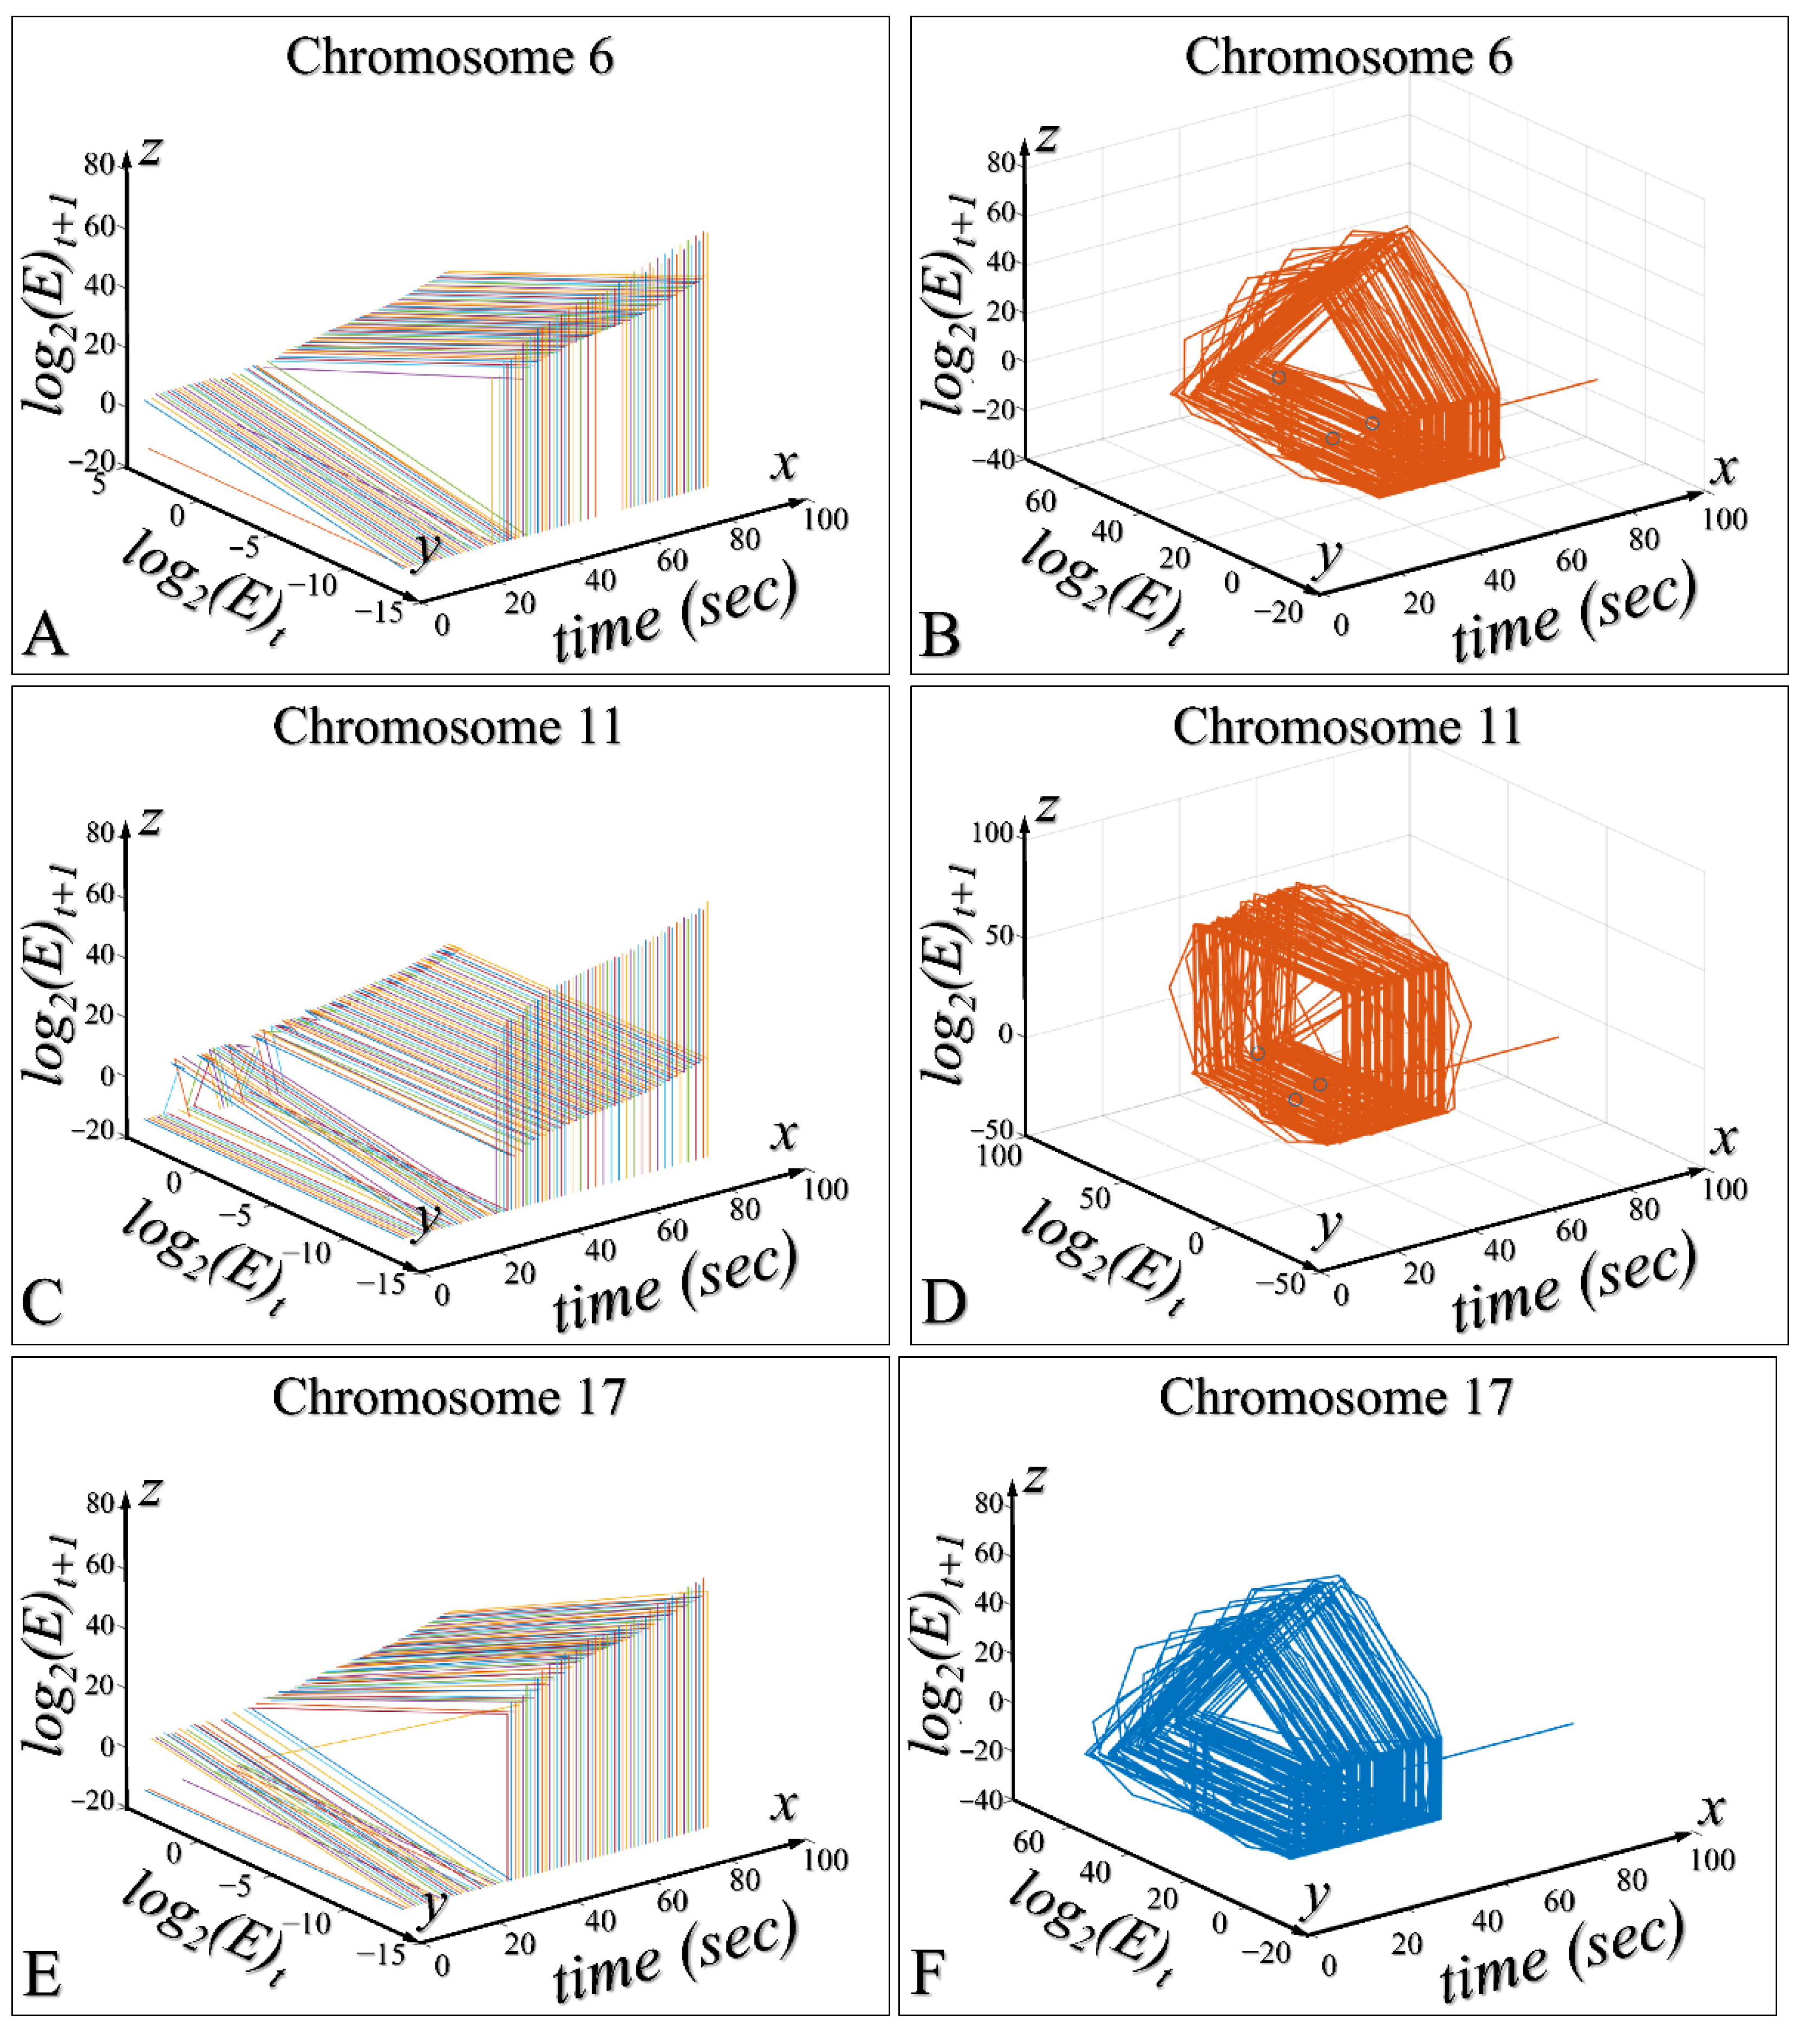
The previous perspective gave us information on how the system evolves with respect to time, but less so on how each species relates to the others. That is, by regressing each species with respect to all others for all time points, information could be gained on the emerging patterns for species pairs. However, expanding our thinking, we could also attempt to study the time evolution of the system from one time point to the next for all species, simultaneously. This type of analysis manifested different dynamics as compared to the previous one. In this case, the dynamics were very different compared to our previous observations. Modelling all species at the same time did not manifest any obvious patterns, yet when separating the species with respect to their chromosomal location, we observed patterns of expression. In particular, three-dimensional (3D) representation of all species at time t vs. all species at time t + 1 with respect to time for chromosomes 6 (Figure 7A,B), 11 (Figure 7C,D) and 17 (Figure 7E,F) manifested a pattern of expression, which we were able to model using similar helical functions as in the previous regressions.

4. Discussion

This work used high-throughput transcriptomics, bioinformatics, and systems biology approaches in order to develop a new methodological approach for microarray data analysis, using the CCRF-CEM (ALL) and TE-671 (RMS) cell lines as models. In particular, our approach focused on identifying patterns of co-regulation with respect to time and the model’s species. This was all performed by keeping in mind that the investigated species included the common molecules that potentially participate in cellular metabolism. The detection of similarities between different cancer (sub)types could be of great interest for therapeutic purposes [31]. To the best of our knowledge, this is the first time that such a comparison has been attempted between two distinct cell lines and cancer types in general.
We selected CCRF-CEM and TE-671 as representative models of childhood T-cell leukemia and rhabdomyosarcoma, respectively. These cell lines have been well characterized in the prior literature and offer experimentally tractable systems with clearly defined transcriptomic profiles. Both cancers originate from progenitor cells that have failed to fully differentiate—lymphoblasts in the case of ALL and mesenchymal precursors in RMS—and share dysregulation in proliferation and survival pathways. This similarity in developmental arrest and oncogenic features supports the rationale for comparing their gene expression landscapes.
Rhabdomyosarcoma is a rare childhood tumor, and its biology is not well understood. The rhabdomyosarcoma cells are derived from mesenchymal cells that have failed to properly differentiate to myocytes or skeletal muscle. Leukemia, on the other hand, and more specifically ALL, originates from the lymphoblast, which is also known to use embryonal mechanisms for its differentiation and progression. Thus, as previously reported [9], two different cell lines of a common embryological, mesodermic origin could have common metabolic or even progression mechanics. Therefore, we focused mainly on the similarities between the two cell types and tried to find a methodological approach to better understand their common metabolic and progression expression properties. In other words, we hypothesized that common developmental origin could impose common tumor dynamics. A previous report studied the expressional profile of seven RMS cell lines possessing the PAX3-FKHR fusion gene, along with other cell lines of different tumor types [32]. In addition, the role of MAPK14 and the MAPK pathway has been previously reported in RMS biology [28,33], as well as that of TIE1 [23], ADAM17 [25] and STAT1 [34,35,36].
The majority of the research on cancer therapy is focused on adult tissue and derives conclusions from data gathered from adult patients. Increasing evidence from clinical trials of promising anticancer drugs points to the need for a better understanding concerning the networks of the intracellular signaling pathways. The exclusive targeting of cellular receptors might work well with one type of cancer, but could fail with another one. The effectiveness of interference aimed at signal mediators has already been demonstrated in tissue cultures [37,38], xenograft models [39,40] and clinical trials of patients [41,42]. However, there is a need to understand the basic mechanisms of the intracellular signals. In cell culture studies, the combination of anticancer drugs may yield effects that cannot always be beneficial to the patient. To understand the physiology of a cancer cell, it is essential to study the interactions of key mechanisms of response to drugs.
In this sense, experimenting with cell line models can be both applicable to the clinic and as well as being feasible from an economic point of view. Of course, there are several disadvantages, such as the fact that cell lines do not totally resemble the pathogenesis or cellular systems, or phenotype as presented in vivo. However, a very important factor that we have to mention has to do with the ethical part of experimentation, where cell lines outreach all other study models.
Several previous reports have investigated the topic of systems simulations to address the function of multiple molecules in their entirety [43,44]. Very few studies have addressed the question of data analytics, based on other approaches than machine learning or statistics. A previous report investigated the use of linear geometry and bicluster analysis for the investigation of microarray expression data [45]. Additionally, a recent report used geometrical and vectoral approaches to unravel expression patterns in Wilms tumors [46].
Our use of geometric modeling—including polar transformations and helical regressions—aims to capture the non-linear, oscillatory, and potentially periodic behaviors in gene expression regulation. While traditional 2D or linear models reduce gene expression to a simple up/down snapshot, biological systems are inherently dynamic. Concentrations of mRNAs and proteins rise and fall based on feedback loops, threshold effects, and time-dependent regulation.
By transforming our simulated data into polar or 3D representations, we can visualize these dynamics not as isolated events but as continuous trajectories or repeating patterns. For example, helical structures may reflect autoregulatory loops or circadian-like behaviors, while turbulent patterns may indicate stochastic or chaotic regulation. These patterns are biologically plausible, as many transcription factors (e.g., STAT1) are known to undergo cyclic activation and deactivation.
This approach provides a topological lens to view gene expression—capturing the shape and evolution of expression patterns rather than merely their magnitude or direction. While preliminary, our findings suggest that such geometric descriptors may help uncover underlying co-regulation or synchronization in cancer networks, which may otherwise be missed by conventional methods.
The downside of this approach is that it is still very difficult to interpret gene or protein expression data in their entirety, due to the immense complexity of the cellular and biological physiology. The fact that we are still not able to find predictable patterns is a hindrance to understanding tumor biology better. Therefore, our methodological approach is a primary effort towards this direction, namely to comprehend biological data and predict phenomena in a complete set of data.

5. Conclusions

In the present work, we investigate the common expressional profile of two cell lines: the T-cell acute lymphoblastic leukemia cell line CCRF-CEM and the rhabdomyosarcoma cell line TE-671. Cells have been studied with microarrays in order to find common characteristics and differences between the two cell lines. Although microarray analysis is mainly concerned with differences between two different states, our study focuses on the genes that share common expression profiles. Both cell lines have stopped differentiating, which complicates the study of early mechanisms underlying oncogenesis both in vitro and in vivo. We have, therefore, developed a new methodology for the analysis of systems data, utilizing geometrical approaches for their interpretation. Our approach had both limitations as well as advantages. There are two basic limitations; the first concerns the dataset’s size, which was small, but this brings us to the second limitation, which concerns computation capacity. The calculations performed required immense amounts of memory, as well as computation force. In some cases, it took several hours for our computers to perform the calculations for the respective shapes. Thus, in order to gain more insight, we have started collecting larger datasets, and use more powerful computers (e.g., rented time in mainframes). On the upside of things, our approach had the idea of increasing complexity rather than reducing dimensionality and finding similarities. We have attempted to capture the “shape” of gene expression (or “species” as in the present case) in its entirety. The main idea behind this was our theory that gene expression takes place in a specific, quantized, marginal manner (i.e., it can take certain, yet unknown, values), which probably repeats itself.
Most gene expression studies employ dimensionality reduction techniques like PCA, clustering or co-expression network analysis to simplify the data landscape. While effective for broad classification, these methods often obscure fine-grained dynamic behaviors and assume linear separability. Our method instead increases complexity by modeling the full expression landscape and exploring its geometric topology.
We propose that gene expression does not merely vary in intensity, but may follow structured trajectories governed by intrinsic cellular dynamics. This perspective may offer a complementary and deeper understanding of transcriptomic regulation, particularly in heterogeneous or developmentally complex cancers such as ALL and RMS.
Unlike conventional approaches such as principal component analysis (PCA), clustering, or co-expression networks—which emphasize dimensionality reduction—our geometric modeling approach preserves the full complexity of expression data. This allows us to explore the topological structure of gene expression space and identify emergent patterns such as oscillations, helices, and turbulence. These dynamic structures may reflect deeper, biologically relevant coordination mechanisms between genes, offering a novel perspective on cancer cell regulation that complements traditional analyses.

Supplementary Materials

The following supporting information can be downloaded at https://www.mdpi.com/article/10.3390/biomedinformatics5030045/s1: Supplementary Figure S1: Time-dependent iteration of the simulated species. Examples include extracellular CCL11 (a), membrane CDK5 (b), nucleolar CDK5 (c), membrane FLT3 (d), membrane TYR (e), cytoplasmatic TYR (f), Golgi TYR (g) and nucleolar USP1 (h); Figure S2: Polar transformation of time-series data. All species, namely extracellular CCL11 (a), membrane CDK5 (b), membrane FLT3 (c), membrane TYR (d), cytoplasmatic TYR (e), nucleolar CDK5 (f), nucleolar USO1 (g) and Golgi TYR (h) manifested quasi-turbulent dynamics; Table S1: List of genes and GO terms.

Author Contributions

Conceptualization, G.I.L.; methodology, C.T., I.V., A.Z. and G.I.L.; software, C.T., I.V. and G.I.L.; validation, A.Z. and G.I.L.; formal analysis, A.Z. and G.I.L.; investigation, C.T., A.Z. and G.I.L.; resources, G.I.L.; data curation, C.T. and G.I.L.; writing—original draft preparation, C.T., I.V., A.Z. and G.I.L.; writing—review and editing, A.Z. and G.I.L.; visualization, G.I.L.; supervision, G.I.L.; project administration, G.I.L.; funding acquisition, G.I.L. All authors have read and agreed to the published version of the manuscript.

Funding

This research received no external funding.

Institutional Review Board Statement

Not applicable.

Informed Consent Statement

Not applicable.

Data Availability Statement

Raw data can be found online in the Gene Expression Omnibus (GEO) database with accession number GSE34522.

Conflicts of Interest

The authors declare no conflicts of interest.

References

  1. Onciu, M. Acute lymphoblastic leukemia. Hematol. Oncol. Clin. N. Am. 2009, 23, 655–674. [Google Scholar] [CrossRef] [PubMed]
  2. Skapek, S.X.; Ferrari, A.; Gupta, A.A.; Lupo, P.J.; Butler, E.; Shipley, J.; Barr, F.G.; Hawkins, D.S. Rhabdomyosarcoma. Nat. Rev. Dis. Primers 2019, 5, 1. [Google Scholar] [CrossRef] [PubMed]
  3. Dagher, R.; Helman, L. Rhabdomyosarcoma: An overview. Oncologist 1999, 4, 34–44. [Google Scholar] [CrossRef] [PubMed]
  4. Dasgupta, R.; Fuchs, J.; Rodeberg, D. Rhabdomyosarcoma. Semin. Pediatr. Surg. 2016, 25, 276–283. [Google Scholar] [CrossRef]
  5. Pui, C.H.; Relling, M.V.; Downing, J.R. Acute lymphoblastic leukemia. N. Engl. J. Med. 2004, 350, 1535–1548. [Google Scholar] [CrossRef]
  6. Miranda, L.; Wolf, J.; Pichuantes, S.; Duke, R.; Franzusoff, A. Isolation of the human pc6 gene encoding the putative host protease for hiv-1 gp160 processing in cd4+ t lymphocytes. Proc. Natl. Acad. Sci. USA 1996, 93, 7695–7700. [Google Scholar] [CrossRef]
  7. Naujokat, C.; Sezer, O.; Zinke, H.; Leclere, A.; Hauptmann, S.; Possinger, K. Proteasome inhibitors induced caspase-dependent apoptosis and accumulation of p21waf1/cip1 in human immature leukemic cells. Eur. J. Haematol. 2000, 65, 221–236. [Google Scholar] [CrossRef]
  8. Foley, G.E.; Lazarus, H.; Farber, S.; Uzman, B.G.; Boone, B.A.; McCarthy, R.E. Continuous culture of human lymphoblasts from peripheral blood of a child with acute leukemia. Cancer 1965, 18, 522–529. [Google Scholar] [CrossRef]
  9. Lambrou, G.I.; Zaravinos, A.; Adamaki, M.; Spandidos, D.A.; Tzortzatou-Stathopoulou, F.; Vlachopoulos, S. Pathway simulations in common oncogenic drivers of leukemic and rhabdomyosarcoma cells: A systems biology approach. Int. J. Oncol. 2012, 40, 1365–1390. [Google Scholar] [CrossRef]
  10. McAllister, R.M.; Isaacs, H.; Rongey, R.; Peer, M.; Au, W.; Soukup, S.W.; Gardner, M.B. Establishment of a human medulloblastoma cell line. Int. J. Cancer 1977, 20, 206–212. [Google Scholar] [CrossRef]
  11. Friedman, H.S.; Bigner, S.H.; McComb, R.D.; Schold, S.C., Jr.; Pasternak, J.F.; Groothuis, D.R.; Bigner, D.D. A model for human medulloblastoma. Growth, morphology, and chromosomal analysis in vitro and in athymic mice. J. Neuropathol. Exp. Neurol. 1983, 42, 485–503. [Google Scholar] [CrossRef]
  12. McAllister, R.M.; Melnyk, J.; Finkelstein, J.Z.; Adams, E.C., Jr.; Gardner, M.B. Cultivation in vitro of cells derived from a human rhabdomyosarcoma. Cancer 1969, 24, 520–526. [Google Scholar] [CrossRef]
  13. Yeung, C.M.; An, B.S.; Cheng, C.K.; Chow, B.K.; Leung, P.C. Expression and transcriptional regulation of the gnrh receptor gene in human neuronal cells. Mol. Hum. Reprod. 2005, 11, 837–842. [Google Scholar] [CrossRef]
  14. Chu, E.S.; Wong, T.K.; Yow, C.M. Photodynamic effect in medulloblastoma: Downregulation of matrix metalloproteinases and human telomerase reverse transcriptase expressions. Photochem. Photobiol. Sci. 2008, 7, 76–83. [Google Scholar] [CrossRef]
  15. Sifakis, E.G.; Prentza, A.; Koutsouris, D.; Chatziioannou, A.A. Evaluating the effect of various background correction methods regarding noise reduction, in two-channel microarray data. Comput. Biol. Med. 2012, 42, 19–29. [Google Scholar] [CrossRef] [PubMed]
  16. Tselios, C.; Zaravinos, A.; Tsartsalis, A.N.; Tagka, A.; Kotoulas, A.; Geronikolou, S.A.; Braoudaki, M.; Lambrou, G.I. Systems approaches in the common metabolomics in acute lymphoblastic leukemia and rhabdomyosarcoma cells: A computational approach. Adv. Exp. Med. Biol. 2021, 1338, 55–66. [Google Scholar]
  17. Elizarraras, J.M.; Liao, Y.; Shi, Z.; Zhu, Q.; Pico, A.R.; Zhang, B. Webgestalt 2024: Faster gene set analysis and new support for metabolomics and multi-omics. Nucleic Acids Res. 2024, 52, W415–W421. [Google Scholar] [CrossRef] [PubMed]
  18. Liao, Y.; Wang, J.; Jaehnig, E.J.; Shi, Z.; Zhang, B. Webgestalt 2019: Gene set analysis toolkit with revamped uis and apis. Nucleic Acids Res. 2019, 47, W199–W205. [Google Scholar] [CrossRef]
  19. Wang, J.; Duncan, D.; Shi, Z.; Zhang, B. Web-based gene set analysis toolkit (webgestalt): Update 2013. Nucleic Acids Res. 2013, 41, W77–W83. [Google Scholar] [CrossRef]
  20. Wang, J.; Vasaikar, S.; Shi, Z.; Greer, M.; Zhang, B. Webgestalt 2017: A more comprehensive, powerful, flexible and interactive gene set enrichment analysis toolkit. Nucleic Acids Res. 2017, 45, W130–W137. [Google Scholar] [CrossRef]
  21. Zhang, B.; Kirov, S.; Snoddy, J. Webgestalt: An integrated system for exploring gene sets in various biological contexts. Nucleic Acids Res. 2005, 33, W741–W748. [Google Scholar] [CrossRef]
  22. Yang, P.; Chen, N.; Jia, J.H.; Gao, X.J.; Li, S.H.; Cai, J.; Wang, Z. Tie-1: A potential target for anti-angiogenesis therapy. J. Huazhong Univ. Sci. Technol. 2015, 35, 615–622. [Google Scholar] [CrossRef]
  23. Teicher, B.A. Searching for molecular targets in sarcoma. Biochem. Pharmacol. 2012, 84, 1–10. [Google Scholar] [CrossRef]
  24. Le, Q.; Castro, S.; Tang, T.; Loeb, A.M.; Hylkema, T.; McKay, C.N.; Perkins, L.; Srivastava, S.; Call, L.; Smith, J.; et al. Therapeutic targeting of mesothelin with chimeric antigen receptor t cells in acute myeloid leukemia. Clin. Cancer Res. 2021, 27, 5718–5730. [Google Scholar] [CrossRef] [PubMed]
  25. Xing, Z.; Wei, L.; Jiang, X.; Conroy, J.; Glenn, S.; Bshara, W.; Yu, T.; Pao, A.; Tanaka, S.; Kawai, A.; et al. Analysis of mutations in primary and metastatic synovial sarcoma. Oncotarget 2018, 9, 36878–36888. [Google Scholar] [CrossRef] [PubMed]
  26. Chen, D.; Huang, J.; Xiao, S.; Cheng, G.; Liu, Y.; Zhao, T.; Chen, C.; Yi, Y.; Peng, Y.; Cao, J. Synthesis, anti-leukemia activity, and molecular docking of novel 3,16-androstenedione derivatives. Steroids 2023, 199, 109290. [Google Scholar] [CrossRef] [PubMed]
  27. Yao, Y.; Li, X.; Yang, X.; Mou, H.; Wei, L. Indirubin, an active component of indigo naturalis, exhibits inhibitory effects on leukemia cells via targeting hsp90aa1 and pi3k/akt pathway. Anti-Cancer Agents Med. Chem. 2024, 24, 718–727. [Google Scholar] [CrossRef]
  28. Perdiguero, E.; Ruiz-Bonilla, V.; Serrano, A.L.; Muñoz-Cánoves, P. Genetic deficiency of p38alpha reveals its critical role in myoblast cell cycle exit: The p38alpha-jnk connection. Cell Cycle 2007, 6, 1298–1303. [Google Scholar] [CrossRef]
  29. Cho, H.J.; Smith, J.; Switzer, C.H.; Louka, E.; Charles, R.L.; Prysyazhna, O.; Schroder, E.; Fernandez-Caggiano, M.; de Jesus, D.S.; Eminaga, S.; et al. Sfx-01 is therapeutic against myeloproliferative disorders caused by activating mutations in shp2. EMBO Mol. Med. 2025, 17, 2115–2136. [Google Scholar] [CrossRef]
  30. Liu, A.; Liu, Y.; Xu, Z.; Yu, W.; Wang, H.; Li, C.; Lin, J. Novel small molecule, xzh-5, inhibits constitutive and interleukin-6-induced stat3 phosphorylation in human rhabdomyosarcoma cells. Cancer Sci. 2011, 102, 1381–1387. [Google Scholar] [CrossRef]
  31. Blandford, M.C.; Barr, F.G.; Lynch, J.C.; Randall, R.L.; Qualman, S.J.; Keller, C. Rhabdomyosarcomas utilize developmental, myogenic growth factors for disease advantage: A report from the children’s oncology group. Pediatr Blood Cancer 2006, 46, 329–338. [Google Scholar] [CrossRef]
  32. Khan, J.; Simon, R.; Bittner, M.; Chen, Y.; Leighton, S.B.; Pohida, T.; Smith, P.D.; Jiang, Y.; Gooden, G.C.; Trent, J.M.; et al. Gene expression profiling of alveolar rhabdomyosarcoma with cdna microarrays. Cancer Res. 1998, 58, 5009–5013. [Google Scholar]
  33. Shi, W.; Hou, X.; Li, X.; Peng, H.; Shi, M.; Jiang, Q.; Liu, X.; Ji, Y.; Yao, Y.; He, C.; et al. Differential gene expressions of the mapk signaling pathway in enterovirus 71-infected rhabdomyosarcoma cells. Braz. J. Infect. Dis. Off. Publ. Braz. Soc. Infect. Dis. 2013, 17, 410–417. [Google Scholar] [CrossRef]
  34. Bott, S.R.; Arya, M.; Kirby, R.S.; Williamson, M. P21waf1/cip1 gene is inactivated in metastatic prostatic cancer cell lines by promoter methylation. Prostate Cancer Prostatic Dis. 2005, 8, 321–326. [Google Scholar] [CrossRef] [PubMed]
  35. Chen, B.; He, L.; Savell, V.H.; Jenkins, J.J.; Parham, D.M. Inhibition of the interferon-gamma/signal transducers and activators of transcription (stat) pathway by hypermethylation at a stat-binding site in the p21waf1 promoter region. Cancer Res. 2000, 60, 3290–3298. [Google Scholar] [PubMed]
  36. Illa, I.; Gallardo, E.; Gimeno, R.; Serrano, C.; Ferrer, I.; Juárez, C. Signal transducer and activator of transcription 1 in human muscle: Implications in inflammatory myopathies. Am. J. Pathol. 1997, 151, 81–88. [Google Scholar] [PubMed]
  37. Kim, J.Y.; Park, H.K.; Yoon, J.S.; Kim, S.J.; Kim, E.S.; Song, S.H.; Choi, J.H.; Kim, B.K.; Park, B.B.; Lee, Y.Y. Molecular mechanisms of cellular proliferation in acute myelogenous leukemia by leptin. Oncol. Rep. 2010, 23, 1369–1374. [Google Scholar] [CrossRef]
  38. Pillozzi, S.; Masselli, M.; De Lorenzo, E.; Accordi, B.; Cilia, E.; Crociani, O.; Amedei, A.; Veltroni, M.; D’Amico, M.; Basso, G.; et al. Chemotherapy resistance in acute lymphoblastic leukemia requires herg1 channels and is overcome by herg1 blockers. Blood 2011, 117, 902–914. [Google Scholar] [CrossRef]
  39. Wang, J.; Wakeman, T.P.; Lathia, J.D.; Hjelmeland, A.B.; Wang, X.F.; White, R.R.; Rich, J.N.; Sullenger, B.A. Notch promotes radioresistance of glioma stem cells. Stem Cells 2010, 28, 17–28. [Google Scholar] [CrossRef]
  40. Wysoczynski, M.; Shin, D.M.; Kucia, M.; Ratajczak, M.Z. Selective upregulation of interleukin-8 by human rhabdomyosarcomas in response to hypoxia: Therapeutic implications. Int. J. Cancer 2010, 126, 371–381. [Google Scholar] [CrossRef]
  41. Karp, J.E.; Kaufmann, S.H.; Adjei, A.A.; Lancet, J.E.; Wright, J.J.; End, D.W. Current status of clinical trials of farnesyltransferase inhibitors. Curr. Opin. Oncol. 2001, 13, 470–476. [Google Scholar] [CrossRef]
  42. Fathi, A.T.; Grant, S.; Karp, J.E. Exploiting cellular pathways to develop new treatment strategies for aml. Cancer Treat. Rev. 2010, 36, 142–150. [Google Scholar] [CrossRef]
  43. Suwanwela, J.; Farber, C.R.; Haung, B.L.; Song, B.; Pan, C.; Lyons, K.M.; Lusis, A.J. Systems genetics analysis of mouse chondrocyte differentiation. J. Bone Miner. Res. Off. J. Am. Soc. Bone Miner. Res. 2011, 26, 747–760. [Google Scholar] [CrossRef]
  44. Kusnezow, W.; Syagailo, Y.V.; Rüffer, S.; Baudenstiel, N.; Gauer, C.; Hoheisel, J.D.; Wild, D.; Goychuk, I. Optimal design of microarray immunoassays to compensate for kinetic limitations: Theory and experiment. Mol. Cell. Proteom. 2006, 5, 1681–1696. [Google Scholar] [CrossRef]
  45. Gan, X.; Liew, A.W.; Yan, H. Discovering biclusters in gene expression data based on high-dimensional linear geometries. BMC Bioinform. 2008, 9, 209. [Google Scholar] [CrossRef]
  46. Trink, A.; Kanter, I.; Pode-Shakked, N.; Urbach, A.; Dekel, B.; Kalisky, T. Geometry of gene expression space of wilms’ tumors from human patients. Neoplasia 2018, 20, 871–881. [Google Scholar] [CrossRef]
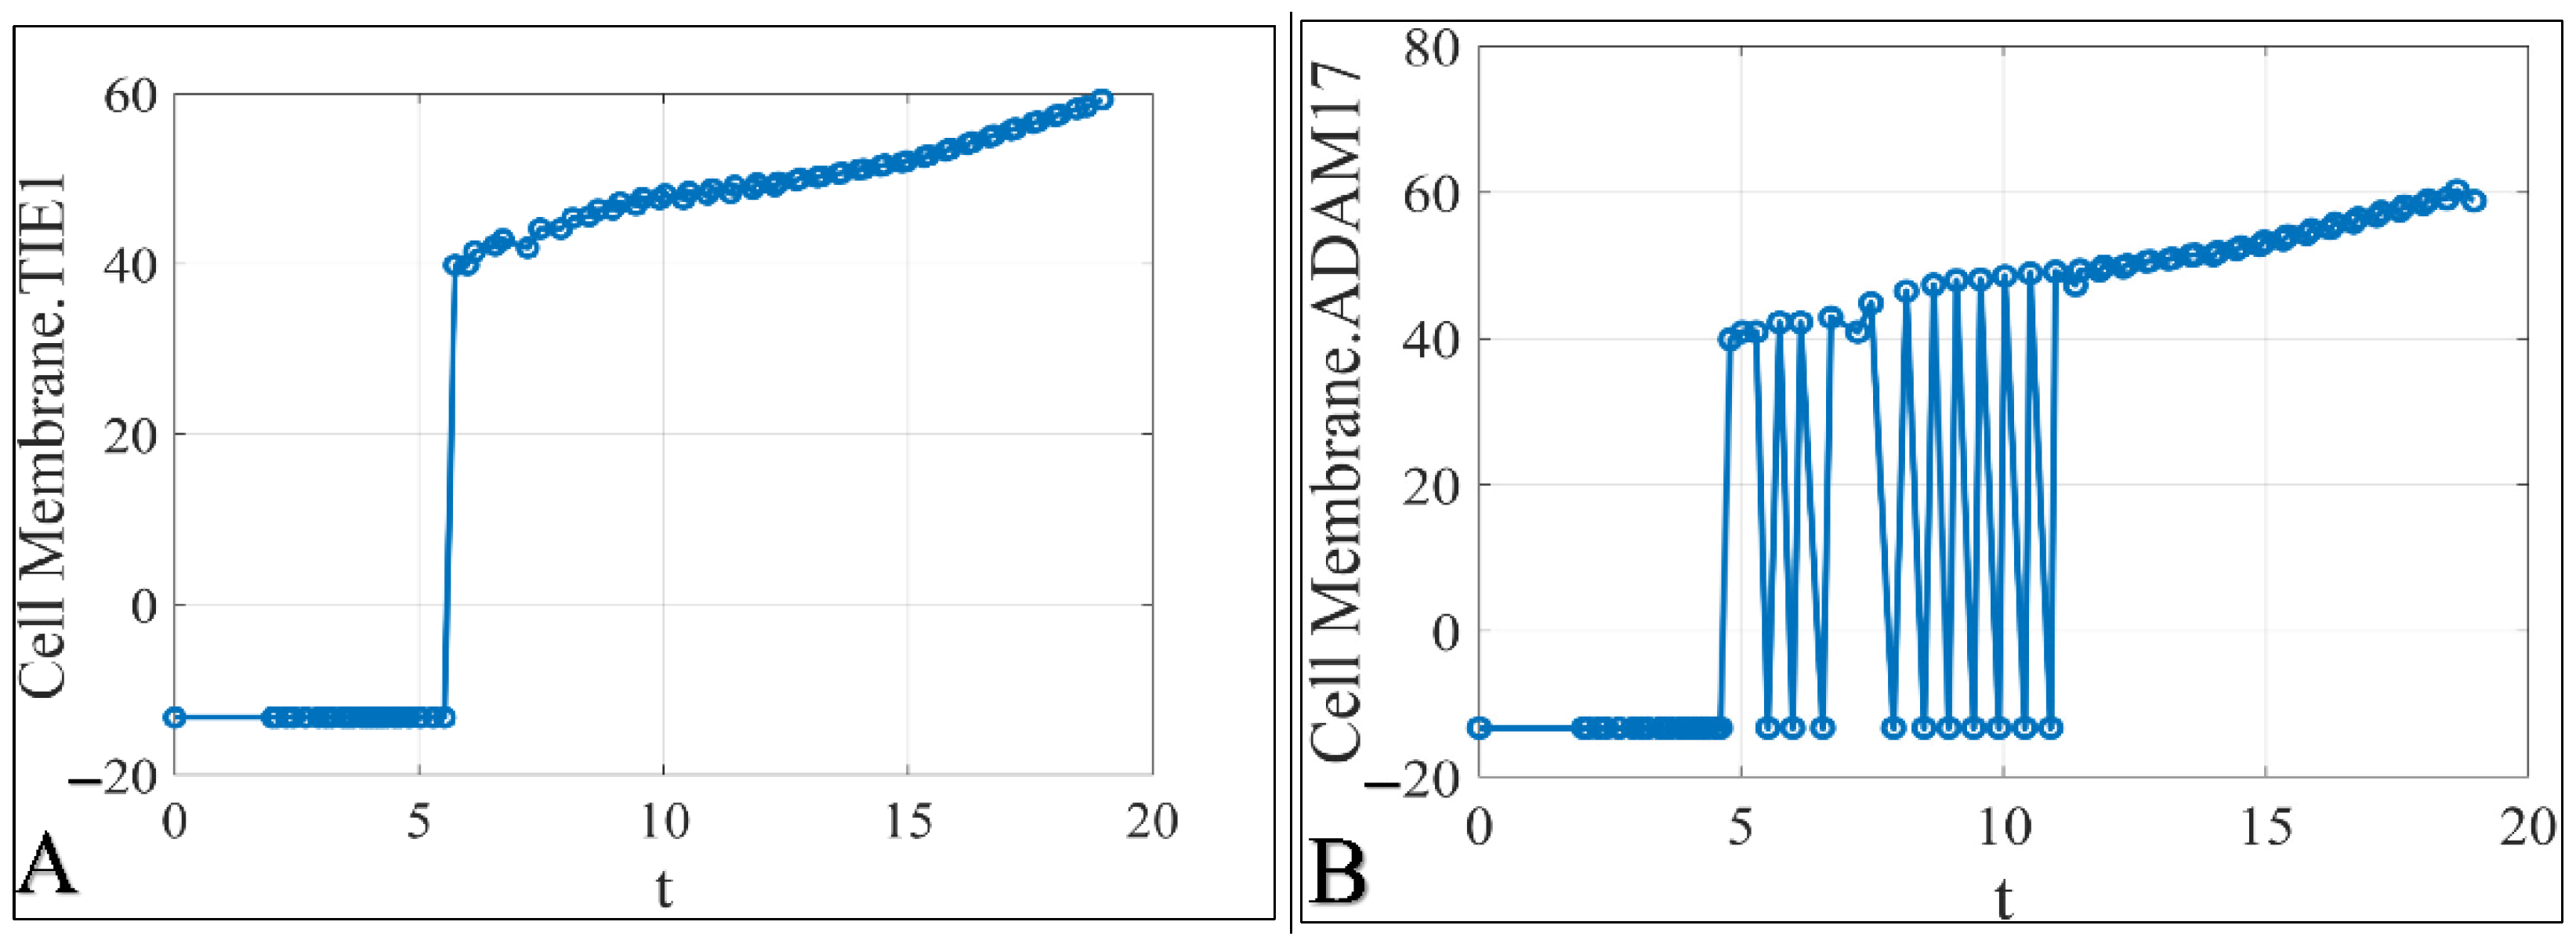
Figure 1. Time-dependent iteration of the simulated species. Examples include TIE1 (A), ADAM17 (B), MAPK14 (C) and STAT1 (D). TIE1 manifested logistic-like behavior, while ADAM17, MAPK14 and STAT1 manifested an oscillatory pattern. The x-axis indicates simulation time (sec); the y-axis shows the simulated molecule’s (“species”) expression levels (in simulated pmol) and the cellular compartment. These species exhibit logistic or oscillatory dynamics, characteristic of co-regulated biological processes.
Biomedinformatics 05 00045 g001aBiomedinformatics 05 00045 g001b
Figure 2. Three-dimensional regression of simulated species: TIE1, ADAM17, MAPK14 and STAT1 in all possible combinations; in particular, the regressions of TIE1, ADAM17 and MAPK14 (A), TIE1, ADAM17 and STAT1 (B) and ADAM17, MAPK14 and STAT1 (C) are presented. The x-, y- and z-axes represent log2-transformed expression levels of the species across the simulation time. This visualization is time-independent and reveals potential co-regulatory trajectories among genes.
Biomedinformatics 05 00045 g002
Figure 3. Polar transformation of time-series data for TIE1 (A), ADAM17 (B), MAPK14 (C) and STAT1 (D). The x-axis depicts the calculated θ angle (angular representation of expression–time dynamics); the y-axis shows the identity of each simulated molecule (“species”) with the corresponding radius (r), derived from the Cartesian coordinates of time and expression (molecule level in simulated pmol). These transformed plots exhibit quasi-turbulent dynamics, suggesting complex co-regulation. Please recall that the transformation of Cartesian to polar coordinates takes place through a transformation where r = x 2 + y 2 and θ = tan 1 y x , where x and y are the actual Cartesian coordinates to be transformed (in the present case, time (t) and expression levels).
Biomedinformatics 05 00045 g003
Figure 4. All simulated species iterated in a 3D graph with respect to time and expression levels (A), and all the polar-transformed Cartesian and time-series data are presented, manifesting a “turbulent”-like structure (B). The x-axis depicts the time of simulation, the y-axis depicts the entirety of all molecules (“species”) and the z-axis depicts the log2-transformed molecules’ levels (A). Similarly, for (B), the diagram presents the transformed Cartesian coordinates as presented in (A). The x-axis depicts the calculated θ angle, the y-axis depicts the entirety of all molecules (“species”) and the z-axis depicts the calculated r value.
Biomedinformatics 05 00045 g004
Figure 5. Polar-transformed Cartesian coordinates with respect to chromosomal species location. Chromosomes represented include chromosome 1 (A), chromosome 2 (B), chromosome 3 (C), chromosome 4 (D), chromosome 5 (E), chromosome 6 (F), chromosome 7 (G), chromosome 8 (H), chromosome 10 (I), chromosome 11 (J), chromosome 12 (K), chromosome 15 (L), chromosome 16 (M), chromosome 19 (N) and chromosome X (O). Species were modelled with respect to their chromosomal location in order to search for patterns in species subsets. The dashed arrows indicate the trajectory of the complete system, whereas the arrows indicate a reversible direction due to the fact that we do not know the sequence in which each species manifests its trajectory. For all subfigures, the diagrams present the transformed Cartesian coordinates for molecules (“species”), with respect to the chromosomes they are known to be expressed from. Thus, as in the previous figures, the x-axis depicts the calculated θ angle, the y-axis depicts the entirety of all molecules (“species”) and the z-axis depicts the calculated r value.
Biomedinformatics 05 00045 g005aBiomedinformatics 05 00045 g005b
Figure 6. Helix-modelled data with respect to time of individual species vs. the entirety of all other species. Each species is regressed with all others using the log2 expression of the simulated species. In the present figure, the following molecules are represented: C2 (A), CCL1 (B), EPHA3 (C), LPL (D), TIE1 (E), ADAM17 (F), MAPK14 (G) and STAT1 (H). For all subfigures, the x-axis depicts the log2-transformed expression of all molecules (“species”), the y-axis depicts the entirety of all molecules (“species”) and the z-axis depicts the log2-transformed molecule levels, i.e., the expression levels of a single molecule as it is described on each subfigure’s title.
Biomedinformatics 05 00045 g006
Figure 7. Helix-modelled data with respect to chromosome-dependent species, time and expression levels. In the present regression, we modelled the evolution of the complete system; that is how all species evolved simultaneously from one time point to the next. Although modelling of all species did not manifest predictable patterns, when accounting for the chromosomal location, we observed a pattern of expression, which could be modelled with helical-like functions. This behavior was observed for species derived from chromosome 6 (A,B), chromosome 11 (C,D) and chromosome 17 (E,F) (legend: (E)t: expression levels at time t, (E)t+1: expression levels at time t + 1). For all subfigures, the x-axis depicts the time of simulation, the y-axis depicts the entirety of all molecules (“species”) and the z-axis depicts the log2-transformed molecule’s levels, i.e., the expression levels of a single molecule as it is described on each subfigure’s title. For all subfigures, the x-axis depicts the log2-transformed expression of all molecules (“species”) at simulation time t, the y-axis depicts time t and the z-axis depicts the log2-transformed molecules’ levels at simulation time t + 1.
Biomedinformatics 05 00045 g007
Disclaimer/Publisher’s Note: The statements, opinions and data contained in all publications are solely those of the individual author(s) and contributor(s) and not of MDPI and/or the editor(s). MDPI and/or the editor(s) disclaim responsibility for any injury to people or property resulting from any ideas, methods, instructions or products referred to in the content.