1. Introduction
Prostate cancer is the second leading cause of cancer-related death and one of the most commonly diagnosed cancers for men in the United States [
1,
2]. Disease trajectory shows considerable variation across individuals. It is often asymptomatic in early stages and remains indolent for some patients, while for others it behaves aggressively. There is also heterogeneity in the cancer’s change from indolent to aggressive, with some patients experiencing a quick progression at diagnosis, and others progressing suddenly at different points over time [
3,
4,
5].
Progression of prostate cancer is defined by the disease stage and/or response to prior treatment. Patients with localized disease typically receive definitive treatment such as radical prostatectomy or radiation therapy, after which approximately half of patients will experience disease progression [
6,
7]. Rising prostate-specific antigen (PSA) levels indicate further progression and inform the decision to initiate treatment of androgen deprivation therapy (ADT). After beginning ADT, patients have a median of 19 months before PSA levels again begin to rise, a phenomenon known as castration resistance [
8]. This stage—non-metastatic, castration-resistant prostate cancer (nmCRPC)—is defined differently by varying bodies of experts, but by all definitions involves “castrate” levels of testosterone (<50 ng/mL), a notable rise or rises in the PSA level, and no evidence of metastatic disease on imaging [
9,
10,
11]. Despite being crucial to treatment decisions, there is no consistency in how PSA values are tracked over time, with heterogeneity in when measurements are taken and how key metrics like the PSA doubling time (PSADT) are calculated [
4]. Research examining nmCRPC treatment practices and outcomes in the Veterans Health Administration (VHA) suggests that providers often do not calculate PSADT, and that patients are often not started on newer treatments, even when their PSADT meets the criteria for high risk [
12].
Patients with nmCRPC experience progression-free survival for an average of 25–30 months prior to developing metastatic disease, and 33% of nmCRPC patients progress to bone metastasis within 2 years [
13]. A PSADT less than 10 months has been shown to be a clinically significant threshold for identifying patients at the time of nmCRPC with faster progression to metastasis or death [
14,
15]. Clinical trials have demonstrated an improvement in clinical outcomes when patients with a PSADT ≤ 10 months are treated with more aggressive treatments such as enzalutamide, apalutamide, darolutamide, and others [
16,
17,
18,
19]. Patients with less aggressive disease are often maintained on ADT.
Not all patients have the same level of data available for their PSA values over time, and with different formulations for calculating PSADT based on available PSA data [
4], the implementation of clinical decision-making based on PSADT ≤ 10 months in real-world settings fails to reflect the knowledge gleaned from clinical trials. Furthermore, decisions to escalate treatment are subject to a variety of factors often not captured in clinical trials, such as advanced age or other demographics [
20]. It is thus crucial to identify individual patient risk among the general population beyond those patients represented in clinical trials and academic medical centers.
Artificial intelligence approaches, such as deep learning (DL), have been proposed as the next frontier in supporting clinical decision-making in medicine [
21]. Compared to traditional statistical analysis, survival analysis using artificial intelligence allows for more effective use of longitudinal data, requires no a priori assumptions regarding the model, and can leverage high-dimensional data such as radiology and pathology reports. The feasibility of applying DL has been previously explored in prostate cancer, specifically in the diagnosis of disease using radiographic imaging [
22], biopsy information [
23], stratification of patient risk based on 3-dimensional prostate gland structures [
24], contouring of targets for radiation therapy [
25], prediction of aggressive disease from molecular features [
26], and prediction of survival after different radiotherapy treatments [
27]. No studies have attempted to stratify patient risk at the decision-making stage of nmCRPC using longitudinal yet commonly obtained data that are available through the routine care and treatment of patients.
2. Materials and Methods
This study is approved under IRB# 00129914. The analysis was conducted in AWS VA Enterprise Cloud Prospect. The cohort study follows the Strengthening Reporting of Observational Studies in Epidemiology (STROBE) reporting guidelines.
We created a DL model capable of providing treatment recommendations based on sequential disease-based data. Treatment recommendations were based on model predictions of individual benefits of switching to more aggressive treatments than ADT, thereby providing critical information to nmCRPC patients and their providers for making treatment decisions.
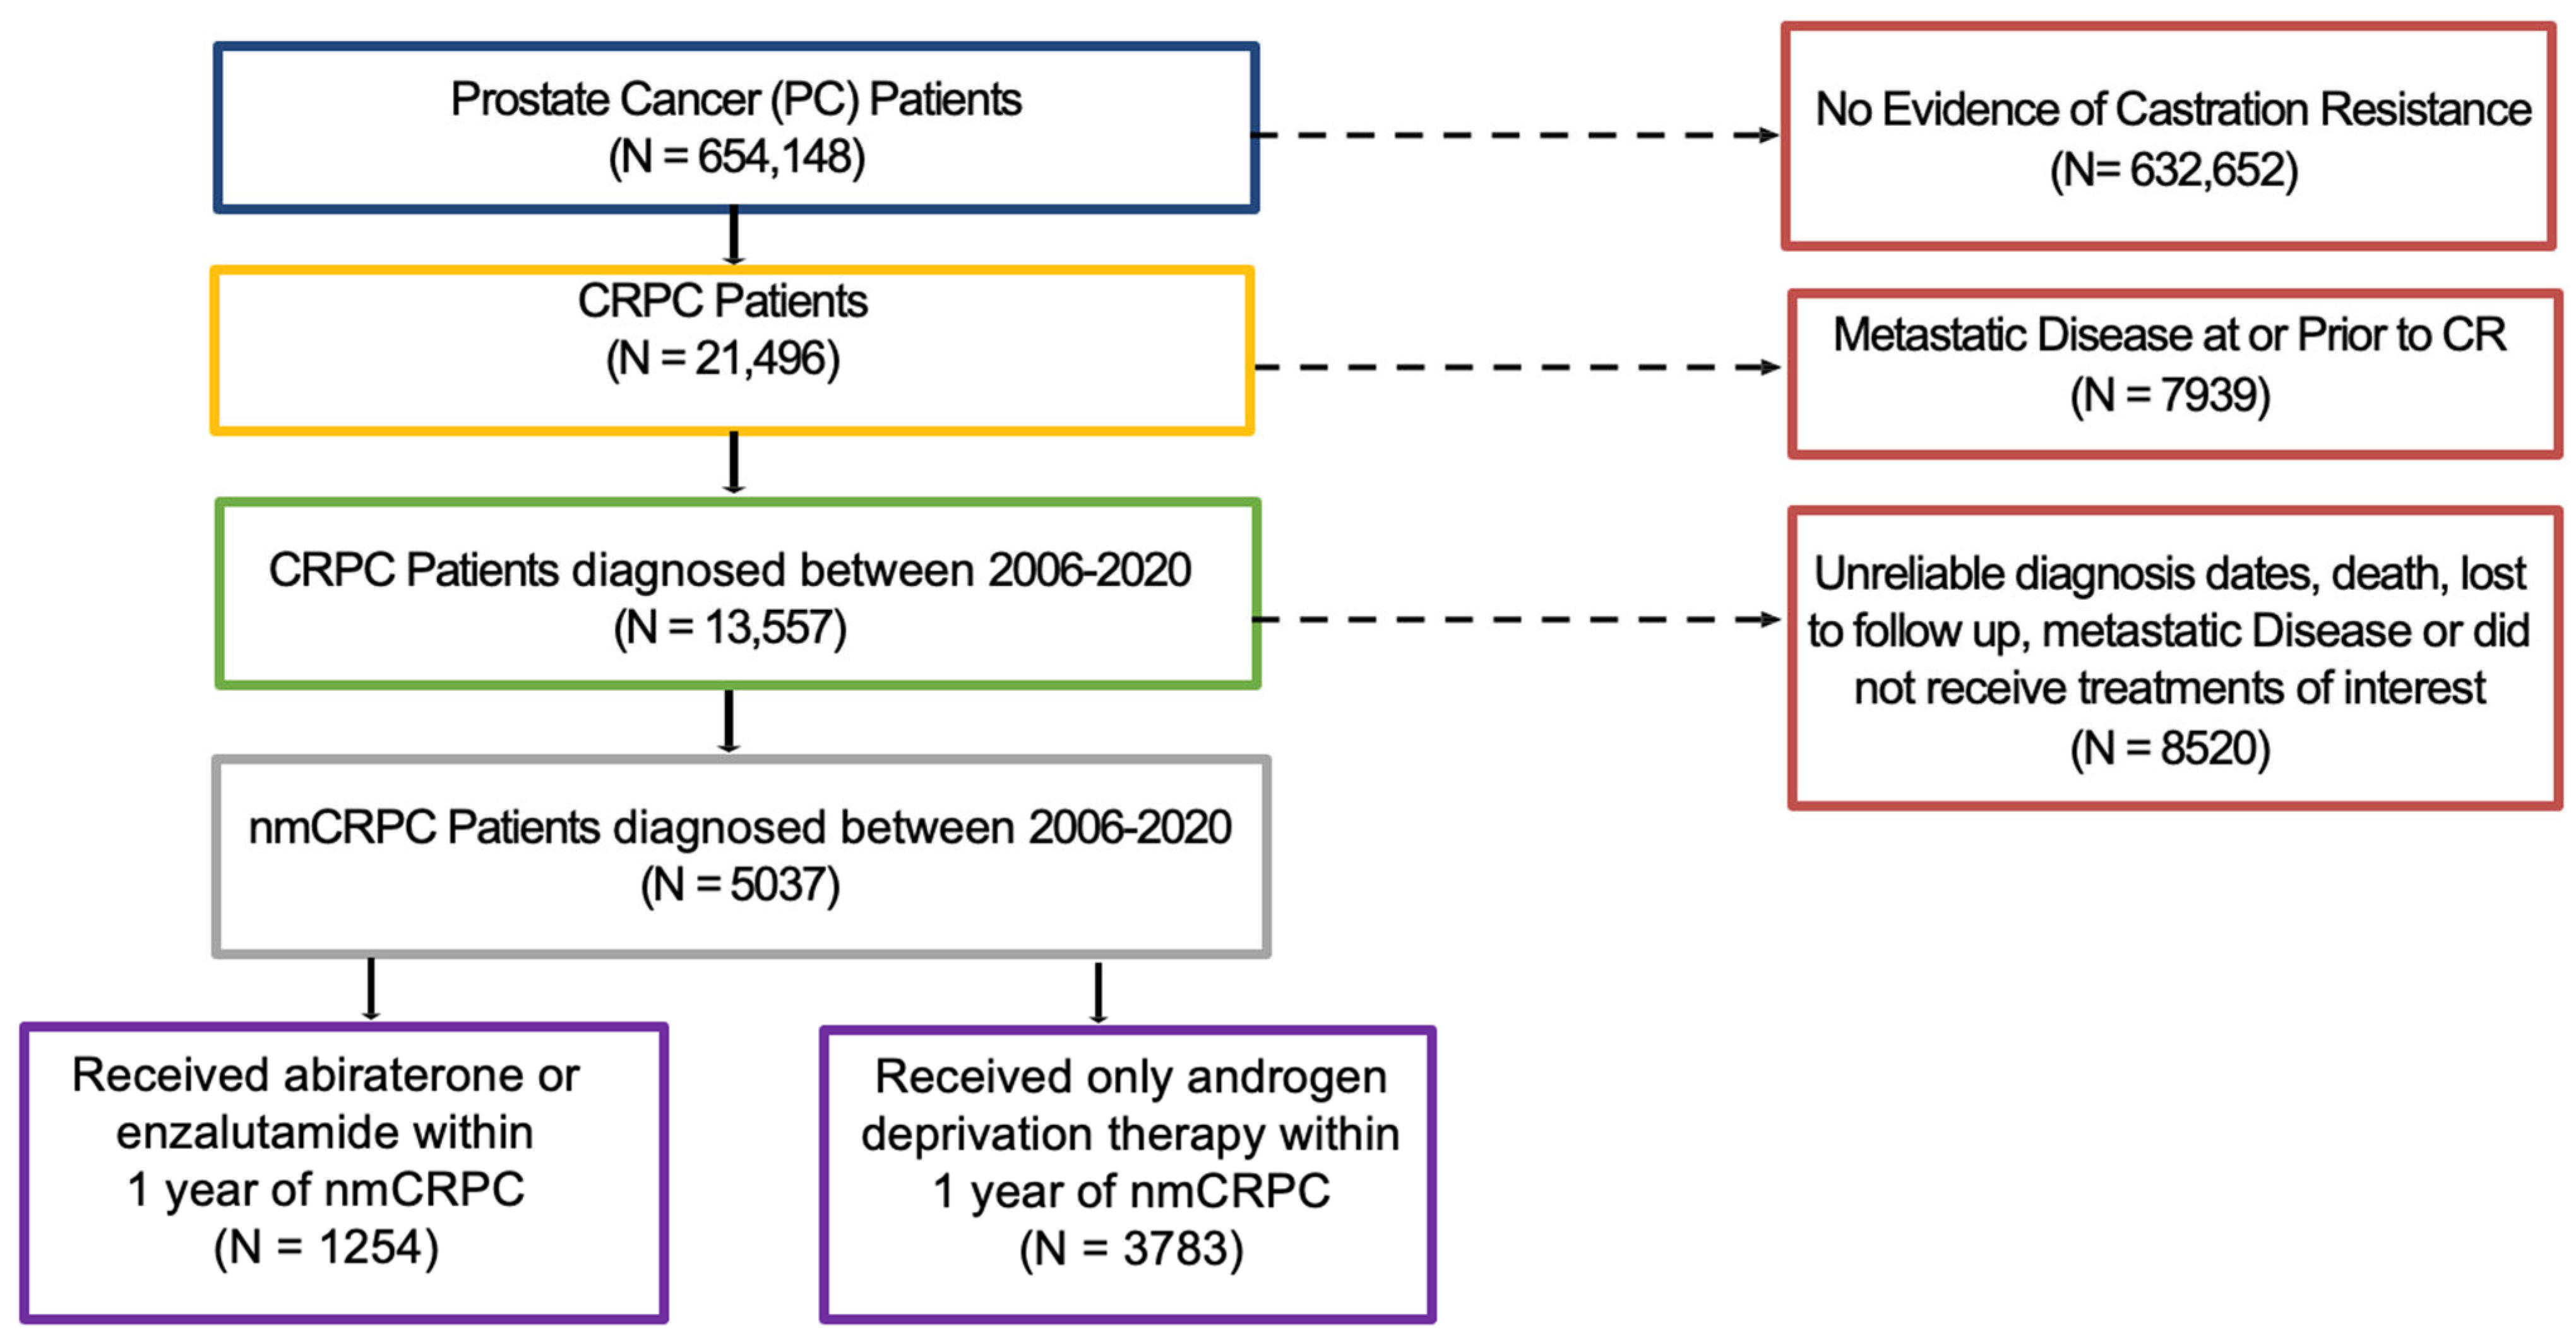
Using data from the VHA and pharmacy dispensation records from Veteran Affairs Corporate Data Warehouse, we identified a nationwide cohort of 13,557 patients diagnosed with prostate cancer from 1 January 2006, through 31 December 2019, who later developed nmCRPC. One year after the start of nmCRPC was selected as the landmark time, and patients who developed metastatic disease or died within that 1-year period were excluded.
Figure 1 provides the patient cohort flow diagram.
Features for time to event, or progression-free survival (PFS), included age at nmCRPC date, body mass index (BMI), Gleason score, ethnicity, time from prostate cancer diagnosis to nmCRPC, Charlson comorbidity index (CCI) 6 months prior to nmCRPC date, treatment history, and PSA values. Details about feature processing and handling of missing data are provided in
Appendix A.
Data were split into 10 folds for a 10-fold cross-validation, with each fold randomly sampled without replacement and stratified by the treatments patients received over time to ensure that the treatment distribution over time within each fold reflected the original dataset. This split enabled balanced treatment distributions among the training, testing, and validation sets. For each cross-validation iteration, eight folds were used for training, one fold for testing and one fold for validation. This process resulted in 10 validation sets that covered the entirety of the dataset. We evaluated the performance of the model by averaging its performance across these sets.
Our outcome of interest was time to metastatic disease or death from the landmark date of one year post-nmCRPC. Two prediction models were separately trained based on two data cohorts, respectively, defined as patients exclusively treated with ADT and patients treated with abiraterone (abi) or enzalutamide (enza). Each cohort was split into training, testing, and validation sets. For patients who received ADT, the individual event probabilities were obtained by combining the predicted event probabilities for the validation set. Their counterfactual event probabilities (i.e., probability of experiencing the event if they had received abi or enza treatment) were obtained by fitting them into the trained prediction model with the abi or enza cohort 10 times and averaging the predicted probabilities.
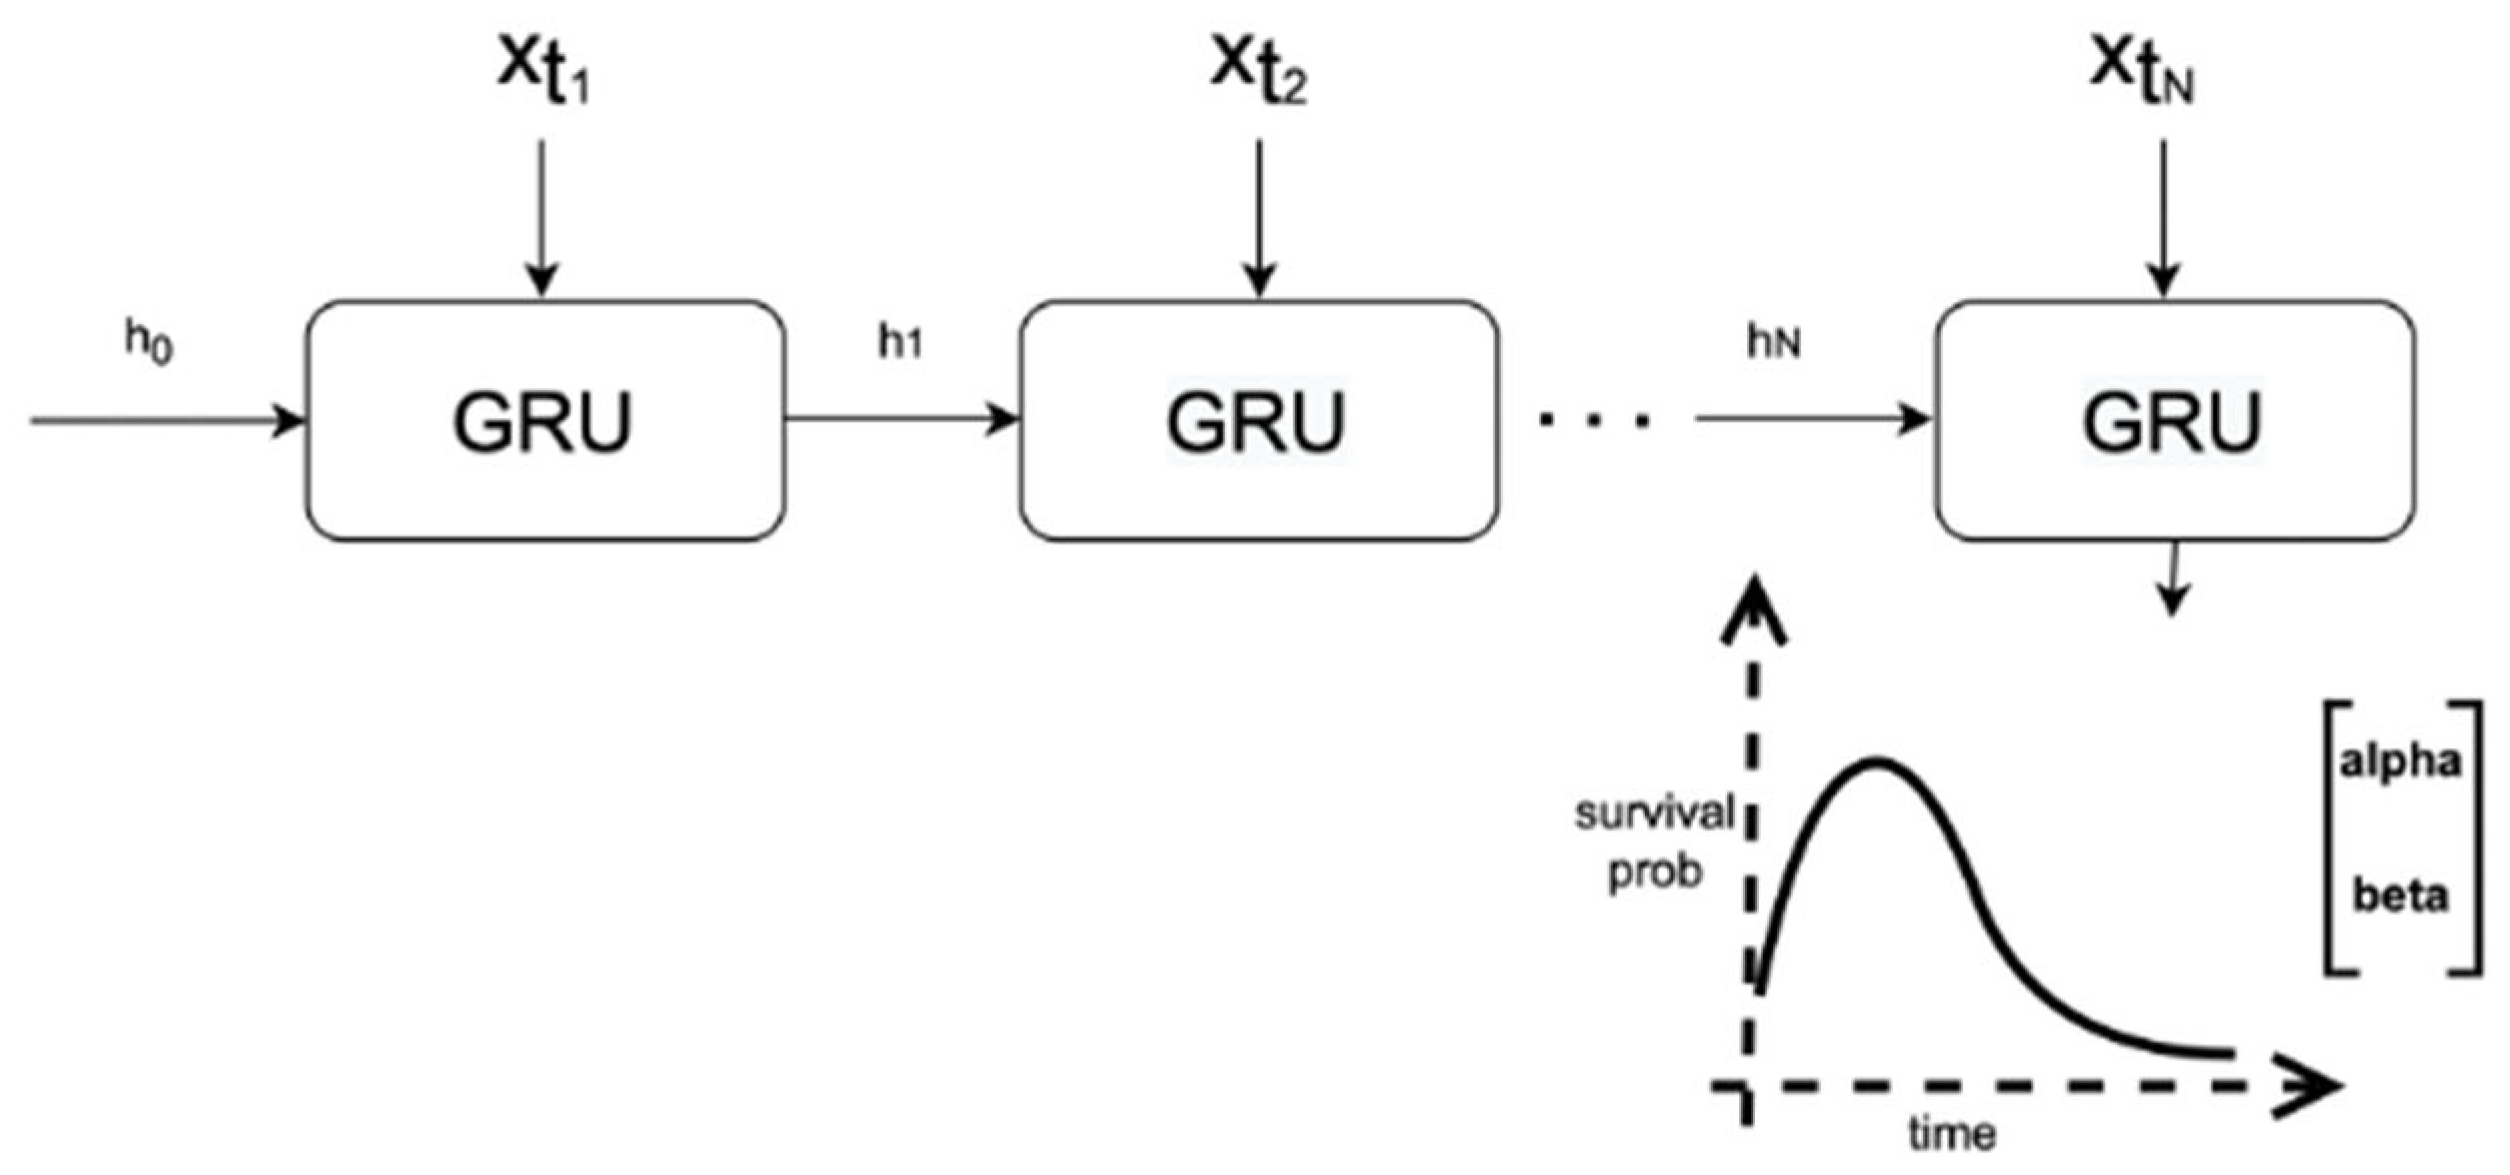
The deep learning architecture used for our predictive models and treatment recommendation model was the Weibull Time to Event Recurrent Neural Network (WTTE-RNN) model [
28], a prediction model initially created for web churn using a DL survival analysis approach. Time to the next event is assumed to follow a Weibull distribution, and a recurrent neural network (RNN) model outputs the distribution scale and shape parameters.
Figure 2 shows how the model made predictions using our data. We implemented WTTE-RNN using a gated recurrent unit (GRU) as the RNN. Further details concerning model architecture and hyperparameters used can be found in
Appendix B.
Model performance was evaluated by the area under the receiver operating characteristic curve (AUROC) and calibration plots. We based our clinical benefit analysis on Mehltretter et al. [
29], adapting their approach to fit a survival analysis scenario. Two years post-nmCRPC was chosen as the milestone time point for our event-free survival evaluation.
We compared the predicted event rate under the hypothetical case wherein all patients were assigned the model-recommended treatment (model-recommended treatment event rate) with the predicted event rate under the observed case where patients were treated with ADT (true event rate). We predicted the event rate under every possible treatment for each patient and took the treatment with the highest PFS probability as the model-recommended treatment per patient. To obtain the model-recommended treatment event rate, the data for each patient were adjusted to reflect their model-recommended treatment and then the model predicted the event rate using these adjusted data. We then found the difference between the mean event rate for the true data and the mean model-recommended treatment event rate. As an additional comparison, we plotted the Kaplan–Meier survival curves for the model-recommended treatment–adjusted data versus the true data.
We also compared the PFS among patients who happened to have received the model-recommended treatment, and the PFS among patients whose true treatments differed from the model-recommended treatment. This approach allowed a comparison of the actual event rate between the group that was concordant with model recommendations by chance and the group that was discordant with model recommendations by chance. Analysis of non-hypothetical cases allowed for better measurement of the DL survival model’s ability to correctly identify patients who were assigned ADT but could have benefitted from the receipt of abi or enza. We only included patients from the ADT cohort for this analysis.
A similar analysis was conducted based on the PSADT ≤ 10 months treatment recommendation rule. A binary indicator was created based on PSADT, with 1 representing patients identified as risky (i.e., needing more aggressive treatment) with PSADT ≤ 10 months, and 0 representing patients identified as not risky (i.e., not requiring treatment beyond ADT) with PSADT > 10 months. However, 57.4% of patients were missing PSADT. Missingness in PSADT is common and often indicative of a better underlying condition as it likely was not necessary to measure PSA as frequently for such patients. We compared 3 different approaches for handling missingness in PSADT: a complete case analysis; encoding the binary indicator arising from PSADT as 0 for patients with missing values; and imputing missing values of PSADT using the MissForest package [
30]. Patients with a PSADT binary indicator of 1 who were given new treatments, as well as patients who stayed on ADT and had a PSADT binary indicator of 0, were counted as concordant. Patients who were not given new treatments in response to a PSADT indicator of 1 were counted as discordant. We compared the 2-year milestone event rate differences between these concordant and discordant groups for each of the 3 methods for handling missingness of PSADT. Results from comparing event rates in those concordant or discordant with PSADT-based treatment recommendations were compared with results from the DL survival model event rates in those concordant or discordant with model-recommended treatments.
3. Results
Our final cohort consisted of 5037 patients with nmCRPC. Among these, 1254 patients received abi or enza, and 3783 exclusively received ADT within one year of nmCRPC. The median number of records per patient for individuals who received ADT only versus abi/enza within one year of nmCRPC was 9 (IQR: 5–14) versus 21 (IQR: 13–31), respectively, with maximum records of 57 and 82, respectively.
There were 2153 patients (42.7%) who experienced at least one event (i.e., death or metastasis) during the observation period. Of patients who experienced an event, 731 (14.5%) developed metastatic disease and 1842 (36.6%) died during the observation period. The median follow-up time was 2.5 years (interquartile range [IQR]: 1.5–4.3 years). Baseline characteristics of the study cohort are summarized in
Table 1. There was a high degree of missingness for the Gleason score. Details around how missing values were filled in are in
Appendix A.
The average AUROC for the model trained on the abi/enza cohort at the 2-year milestone was 0.738 (standard deviation [SD]: 0.057), and the average AUROC for the model trained on the ADT cohort at the 2-year milestone was 0.693 (SD: 0.02). We determined variable importance by excluding one variable at a time from the model and comparing each resulting AUROC against the AUROC of the model with all variables included. In these comparisons, the larger the drop in AUROC, the more important the variable. We ran the analysis 100 times and took the average variable importance of each variable, which are displayed in
Figure 3. The prediction target for calculating importance was death or metastasis within 2 years of nmCRPC. Treatment was identified as the most important variable, followed by the PSA and BMI for the abi/enza cohort. The treatment feature reflects patients’ treatment history, including the duration of ADT prior to receiving abi/enza, as well as other treatments administered. No information around treatments collected after the time of nmCRPC was included. For the ADT cohort, age was the most important variable, followed by CCI and PSA.
At 2 years, the model recommended that 3254 (86.0%) of 3783 patients stay on ADT for the maximum benefit, and 529 patients (14.0%) would derive a greater benefit from switching to a more aggressive treatment. Patient characteristics of the group recommended to stay on ADT and of those recommended to take abi/enza are detailed in
Appendix C.
Within the ADT cohort, the difference between the rate of PFS at the 2-year milestone based on true data versus the data adjusted to reflect model treatment recommendations was 0.1, with a PFS rate of 0.703 for the unadjusted data and a PFS rate of 0.803 for the adjusted data.
The rate of PFS at 2 years among patients concordant with model treatment recommendations, i.e., patients given ADT for whom the model recommended ADT, was 0.74. The rate of PFS at 2 years among patients discordant with model treatment recommendations was 0.50. We observed a significant absolute PFS rate improvement of 0.24 (95% CI: 0.23–0.24), a relative reduction of 47.32%, and an odds ratio of 0.36. The hazard ratio for those whose treatments were concordant versus discordant with the model recommendation was 0.44 (95% CI: 0.39–0.50).
The complete case analysis for adherence to PSADT-based treatment recommendations had a PFS rate at the 2-year milestone of 0.73 among concordant patients and a PFS rate of 0.58 among discordant patients. The absolute improvement was 0.15 (95% CI: 0.08–0.19), a relative improvement of 35.38%, and an odds ratio of 0.52. The hazard ratio for those whose treatment was concordant versus discordant with the PSADT-recommended treatment was 0.69 (95% CI: 0.58–0.82).
In
Table 2, we report results for patients concordant/discordant with model-recommended treatments versus patients concordant/discordant with PSADT-based treatment recommendations. The rate improvements and hazard ratios for those whose treatments were concordant/discordant with model-recommended treatments are significantly higher than those concordant/discordant with PSADT-based recommended treatments both in the complete case analysis and using imputed PSADT. Interestingly, imputing the binary indicator arising from a PSADT with 0 yielded better results than using imputed values from MissForest to create the binary indicator.
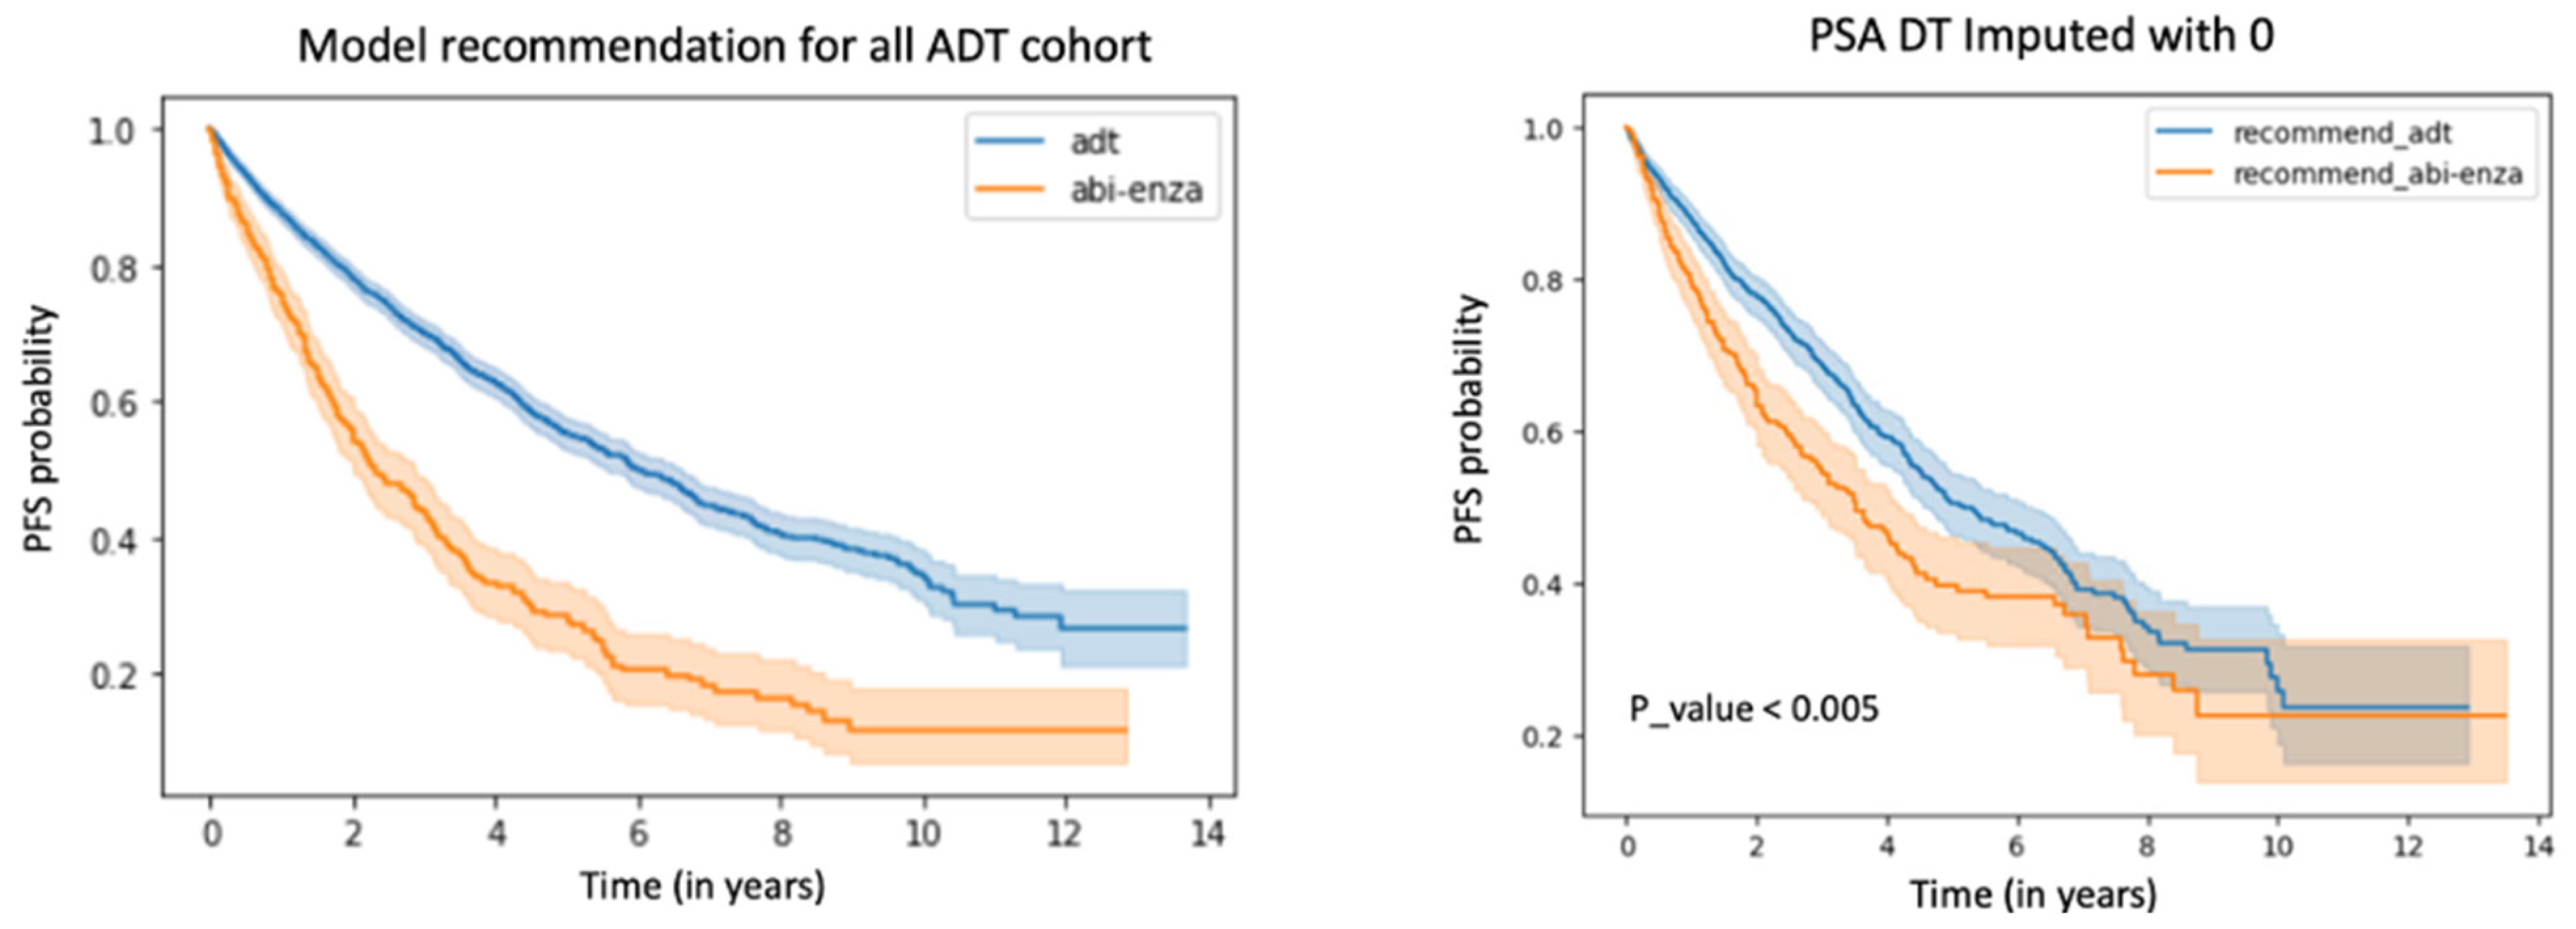
We also compared differences in concordant/discordant patients according to model-recommended treatments versus PSADT-based recommendations by plotting Kaplan–Meier survival curves, as shown in
Figure 4. Discordant patients demonstrated worse survival outcomes under both paradigms. Further details comparing PSADT with the DL model are in
Appendix D.
4. Discussion
We used DL to create a personalized medicine model that can identify patients with nmCRPC who would likely benefit from switching from ADT to abi or enza. We demonstrated that our model can recommend treatment and potentially improve patient outcomes using a few commonly available and easily extractable clinical features, allowing for easy clinical implementation and interpretation.
The current clinical standard for treatment recommendations is based on PSADT. However, the PSA is not always well measured across patients, and it can be difficult for conventional algorithms to accurately capture how the PSA changes over time and in response to treatment [
4]. We aimed to incorporate change in the PSA, alongside treatment, as time-series inputs used to predict individual patients’ outcomes under different treatments received after nmCRPC prognosis, thereby yielding personalized treatment recommendations. We were able to make individualized predictions and recommendations, demonstrating the average potential clinical benefits at a group level as well as examining group differences. We were able to obtain a significantly greater PFS based on concordance with the DL model recommendations compared to concordance with recommendations based on PSADT. Through this thorough investigation of potential clinical benefit, we sought to facilitate an understanding of DL prediction and increase clinician trust in the prognostic products resulting from DL methods.
We adapted the approach applied in Mehltretter et al. [
29] to a survival analysis setting using time-series EHR data. We applied WTTE-RNN, a model that has been used effectively in prognosis prediction for breast cancer patients [
31] and predicting equipment failure [
32]. To our knowledge, ours is the first study to apply this model in prostate cancer. WTTE-RNN can automatically process time-series information, eliminating the need to perform manual feature engineering. In addition, this method provides a fuller picture, capturing more patient-level characteristics than PSADT. The model also offers flexibility in use, since the time-dependent hazards are obtained from Weibull shape and scale parameters; it can provide predictions to an infinite time domain without an increasing number of neuron units that could lead to model overfitting.
As seen in
Table 1, there are significant differences in key characteristics like BMI, Gleason score, and PSADT between the ADT cohort versus the abi/enza cohort. Such differences highlight the importance of restricting the analysis of potential benefits from following treatment recommendations based on the DL model to just the ADT cohort.
A limitation of this study is the observational nature of our dataset; patients who received different treatments may have other fundamental differences. Our analysis of potential clinical benefit did not control for potential confounding. While it is suggestive of benefits arising from more aggressive treatments for specific individuals based on deep learning recommendations, it does not definitively prove the existence of clinically significant benefits.
In clinical practice, most patients are treated with ADT after their nmCRPC date. Previous work has found that 60.6% of patients with nmCRPC are treated with ADT in VHA hospitals [
12]. Those who are given more aggressive treatments, such as second-generation antiandrogens, are typically patients with severe disease and a less favorable prognosis. This limits possible inferences from our model, and we therefore chose to examine only patients receiving ADT, who likely form a more homogenous cohort.
We have laid critical groundwork for future use of a treatment recommendation model as a tool in a clinical context. An important next step for clinical adoption is further improving the AUROC of the model. Currently the model achieves an AUROC around 0.7, whereas clinicians would require a higher level of accuracy. Incorporating more data features could potentially boost model performance. Future work includes adding more temporal features to the DL model, such as more lab results, clinical visit notes, related ICD codes, etc. With more features available, more investigations could be performed to determine the relative contributions of each set of predictor variables in predicting patient outcomes, as well as increasing model performance. After adding more features, validating the model using an external dataset would be the next step in translating this tool into clinical practice to inform treatment decisions for patients with nmCRPC. Additional steps needed before implementing this model in clinical practice in the general US population would include prospective validation studies using both VHA and non-VHA cohorts, as well as explorations of how clinicians could most effectively and efficiently operationalize the model within a shared decision framework.
Author Contributions
Conceptualization, C.L., J.B., Z.B. and A.S.H.; Data curation, V.P. and R.M.; Formal analysis, C.L.; Methodology, C.L.; Supervision, Z.B. and A.S.H.; Writing—original draft, C.L. and J.B.; Writing—review and editing, C.L., J.B., C.Y. and M.S. All authors have read and agreed to the published version of the manuscript.
Funding
This research received no external funding.
Institutional Review Board Statement
This study is approved under IRB #00129914.
Informed Consent Statement
Not applicable.
Data Availability Statement
Data include protected health information and are not available. Detailed information on model tuning and implementation is available upon request.
Acknowledgments
We would like to thank Siamack Ayandeh for the creation of the analytics study mart environment and the Veterans Health Administration Office of Research and Development for funding cloud credits.
Conflicts of Interest
The authors declare no conflicts of interest.
Abbreviations
The following abbreviations are used in this manuscript:
| abi | abiraterone |
| ADT | androgen deprivation therapy |
| AUROC | area under the receiving operating characteristic |
| BMI | body mass index |
| CCI | Charlson comorbidity index |
| CI | confidence interval |
| DL | deep learning |
| EHR | electronic heath records |
| enza | enzalutamide |
| IQR | interquartile range |
| nmCRPC | non-metastatic castration resistant prostate cancer |
| PC | prostate cancer |
| PFS | progression free survival |
| PSA | prostate specific antigen |
| PSADT | prostate specific antigen doubling time |
| RNN | recurrent neural network |
| SD | standard deviation |
| VHA | Veterans Health Administration |
| WTTE-RNN | Weibull time to event recurrent neural network |
References
- Bray, F.; Laversanne, M.; Sung, H.; Ferlay, J.; Siegel, R.L.; Soerjomataram, I.; Jemal, A. Global cancer statistics 2022: GLOBOCAN estimates of incidence and mortality worldwide for 36 cancers in 185 countries. CA Cancer J. Clin. 2024, 74, 229–263. [Google Scholar] [CrossRef]
- Siegel, R.L.; Giaquinto, A.N.; Jemal, A. Cancer statistics, 2024. CA Cancer J. Clin. 2024, 74, 12–49. [Google Scholar] [CrossRef]
- Spratt, D.E.; Zumsteg, Z.S.; Feng, F.Y.; Tomlins, S.A. Translational and clinical implications of the genetic landscape of prostate cancer. Nat. Rev. Clin. Oncol. 2016, 13, 597–610. [Google Scholar] [CrossRef] [PubMed]
- Rosinha, A.; Rabaca, C.; Calais, F.; Pinto, J.M.; Barreira, J.V.; Fernandes, R.; Ramos, R.; Fialho, A.C.; Palma dos Reis, J. Improving the identification of high-risk non-metastatic castration-resistant prostate cancer patients in clinical practice. Front. Oncol. 2024, 13, 1266369. [Google Scholar] [CrossRef] [PubMed]
- Ziaran, S.; Varchulova Novakova, Z.; Bohmer, D.; Danisovic, L. Biomarkers for determination prostate cancer: Implication for diagnosis and prognosis. Neoplasma 2015, 62, 683–691. [Google Scholar] [CrossRef] [PubMed]
- Amling, C.L.; Bergstralh, E.J.; Blute, M.L.; Slezak, J.M.; Zincke, H. Defining prostate specific antigen progression after radical prostatectomy: What is the most appropriate cut point? J. Urol. 2001, 165, 1146–1151. [Google Scholar] [CrossRef]
- Lee, W.R.; Hanks, G.E.; Hanlon, A. Increasing prostate-specific antigen profile following definitive radiation therapy for localized prostate cancer: Clinical observations. J. Clin. Oncol. 1997, 15, 230–238. [Google Scholar] [CrossRef]
- Sharifi, N.; Dahut, W.L.; Steinberg, S.M.; Figg, W.D.; Tarassoff, C.; Arlen, P.; Gulley, J.L. A retrospective study of the time to clinical endpoints for advanced prostate cancer. BJU Int. 2005, 96, 985–989. [Google Scholar] [CrossRef]
- Lowrance, W.T.; Murad, M.H.; Oh, W.K.; Jarrard, D.F.; Resnick, M.J.; Cookson, M.S. Castration-resistant prostate cancer: AUA guideline amendment 2018. J. Urol. 2018, 200, 1264–1272. [Google Scholar] [CrossRef]
- Scher, H.I.; Morris, M.J.; Stadler, W.M.; Higano, C.; Basch, E.; Fizazi, K.; Antonarakis, E.S.; Beer, T.M.; Carducci, M.A.; Chi, K.N.; et al. Trial design and objectives for castration-resistant prostate cancer: Updated recommendations from the Prostate Cancer Clinical Trials Working Group 3. J. Clin. Oncol. 2016, 34, 1402–1418. [Google Scholar] [CrossRef]
- Halwani, A.S.; Rasmussen, K.M.; Patil, V.; Li, C.C.; Yong, C.M.; Burningham, Z.; Gupta, S.; Narayanan, S.; Lin, S.-W.; Carroll, S.; et al. Real-world practice patterns in veterans with metastatic castration-resistant prostate cancer. In Urologic Oncology: Seminars and Original Investigations; Elsevier: Amsterdam, The Netherlands, 2020; pp. 1.e1–1.e10. [Google Scholar]
- Halwani, A.S.; Patil, V.; Morreall, D.; Li, C.; Yong, C.; Appukkutan, S.; Partridge, J.; Jhaveri, J.; Rasmussen, K.M. Real-world treatment patterns among veterans with nonmetastatic castration-resistant prostate cancer (nmCRPC). J. Clin. Oncol. 2022, 40, e17042. [Google Scholar] [CrossRef]
- Smith, M.R.; Kabbinavar, F.; Saad, F.; Hussain, A.; Gittelman, M.C.; Bilhartz, D.L.; Wynne, C.; Murray, R.; Zinner, N.R.; Schulman, C.; et al. Natural history of rising serum prostate-specific antigen in men with castrate nonmetastatic prostate cancer. J. Clin. Oncol. 2005, 23, 2918–2925. [Google Scholar] [CrossRef] [PubMed]
- Arnold, P.; Penaloza-Ramos, M.C.; Adedokun, L.; Rees, S.; Lockhat, M.; Spary, L.; Watkins, A.; Gnanapragasam, V.; Crabb, S.J. Clinical characteristics and outcomes for patients with non-metastatic castration-resistant prostate cancer. Sci. Rep. 2021, 11, 22151. [Google Scholar] [CrossRef] [PubMed]
- Smith, M.R.; Saad, F.; Oudard, S.; Shore, N.; Fizazi, K.; Sieber, P.; Tombal, B.; Damiao, R.; Marx, G.; Miller, K.; et al. Denosumab and bone metastasis–free survival in men with nonmetastatic castration-resistant prostate cancer: Exploratory analyses by baseline prostate-specific antigen doubling time. J. Clin. Oncol. 2013, 31, 3800–3806. [Google Scholar] [CrossRef] [PubMed]
- Hussain, M.; Fizazi, K.; Saad, F.; Rathenborg, P.; Shore, N.; Ferreira, U.; Ivashchenko, P.; Demirhan, E.; Modelska, K.; Phung, D.; et al. Enzalutamide in men with nonmetastatic, castration-resistant prostate cancer. N. Engl. J. Med. 2018, 378, 2465–2474. [Google Scholar] [CrossRef]
- Smith, M.R.; Saad, F.; Chowdhury, S.; Oudard, S.; Hadaschik, B.A.; Graff, J.N.; Olmos, D.; Mainwaring, P.N.; Lee, J.Y.; Uemura, H.; et al. Apalutamide treatment and metastasis-free survival in prostate cancer. N. Engl. J. Med. 2018, 378, 1408–1418. [Google Scholar] [CrossRef]
- Fizazi, K.; Shore, N.; Tammela, T.L.; Ulys, A.; Vjaters, E.; Polyakov, S.; Jievaltas, M.; Luz, M.; Alekseev, B.; Kuss, I.; et al. Darolutamide in nonmetastatic, castration-resistant prostate cancer. N. Engl. J. Med. 2019, 380, 1235–1246. [Google Scholar] [CrossRef]
- Fizazi, K.; Shore, N.D.; Tammela, T.; Ulys, A.; Vjaters, E.; Polyakov, S.; Jievaltas, M.; Luz, M.; Alekseev, B.; Kuss, I.; et al. Overall survival (OS) results of phase III ARAMIS study of darolutamide (DARO) added to androgen deprivation therapy (ADT) for nonmetastatic castration-resistant prostate cancer (nmCRPC). J. Clin. Oncol. 2020, 38, 5514. [Google Scholar] [CrossRef]
- Saad, F.; Bogemann, M.; Suzuki, K.; Shore, N. Treatment of nonmetastatic castration-resistant prostate cancer: Focus on second-generation androgen receptor inhibitors. Prostate Cancer Prostatic Dis. 2021, 24, 323–334. [Google Scholar] [CrossRef]
- Giordano, C.; Brennan, M.; Mohamed, B.; Rashidi, P.; Modave, F.; Tighe, P. Accessing artificial intelligence for clinical decision-making. Front. Digit. Health 2021, 3, 645232. [Google Scholar] [CrossRef]
- Campanella, G.; Hanna, M.G.; Geneslaw, L.; Miraflor, A.; Werneck Krauss Silva, V.; Busam, K.J.; Brogi, E.; Reuter, V.E.; Klimstra, D.S.; Fuchs, T.J. Clinical-grade computational pathology using weakly supervised deep learning on whole slide images. Nat. Med. 2019, 25, 1301–1309. [Google Scholar] [CrossRef]
- Bulten, W.; Pinckaers, H.; van Boven, H.; Vink, R.; de Bel, T.; van Ginneken, B.; van der Laak, J.; de Kaa, C.H.-V.; Litjens, G. Automated gleason grading of prostate biopsies using deep learning. arXiv 2019, arXiv:1907.07980. [Google Scholar] [CrossRef]
- Xie, W.; Reder, N.P.; Koyuncu, C.; Leo, P.; Hawley, S.; Huang, H.; Mao, C.; Postupna, N.; Kang, S.; Serafin, R.; et al. Prostate cancer risk stratification via nondestructive 3D pathology with deep learning–assisted gland analysis. Cancer Res. 2022, 82, 334–345. [Google Scholar] [CrossRef]
- Almeida, G.; Tavares, J.M.R. Deep learning in radiation oncology treatment planning for prostate cancer: A systematic review. J. Med. Syst. 2020, 44, 179. [Google Scholar] [CrossRef] [PubMed]
- Elmarakeby, H.A.; Hwang, J.; Arafeh, R.; Crowdis, J.; Gang, S.; Liu, D.; AlDubayan, S.H.; Salari, K.; Kregel, S.; Richter, C.; et al. Biologically informed deep neural network for prostate cancer discovery. Nature 2021, 598, 348–352. [Google Scholar] [CrossRef] [PubMed]
- Hu, L.; Ji, J.; Li, F. Estimating heterogeneous survival treatment effect in observational data using machine learning. Stat. Med. 2021, 40, 4691–4713. [Google Scholar] [CrossRef] [PubMed]
- Martinsson, E. WTTE-RNN: Weibull Time to Event Recurrent Neural Network a Model for Sequential Prediction of Time-to-Event in the Case of Discrete or Continuous Censored Data, Recurrent Events or Time-Varying Covariates. Master’s Thesis, University of Gothenburg, Goteborg, Sweden, 2017. [Google Scholar]
- Mehltretter, J.; Fratila, R.; Benrimoh, D.; Kapelner, A.; Perlman, K.; Snook, E.; Israel, S.; Miresco, M.; Turecki, G. Differential treatment benefit prediction for treatment selection in depression: A deep learning analysis of STAR*D and CO-MED data. bioRxiv 2019, 4, 679779. [Google Scholar] [CrossRef]
- Stekhoven, D.J.; Bühlmann, P. MissForest—Non-parametric missing value imputation for mixed-type data. Bioinformatics 2012, 28, 112–118. [Google Scholar] [CrossRef]
- Kim, J.-Y.; Lee, Y.S.; Yu, J.; Park, Y.; Lee, S.K.; Lee, M.; Lee, J.E.; Kim, S.W.; Nam, S.J.; Park, Y.H.; et al. Deep learning-based prediction model for breast cancer recurrence using adjuvant breast cancer cohort in tertiary cancer center registry. Front. Oncol. 2021, 11, 596364. [Google Scholar] [CrossRef]
- Li, W.; Cai, J.; Li, H.; Yu, F.; Ding, P. Estimation of Equipment Remaining Useful Life based on WTEE-RNN Method. In Proceedings of the 2022 2nd International Conference on Computational Modeling, Simulation and Data Analysis (CMSDA), Zhuhai, China, 2–4 December 2022; pp. 130–134. [Google Scholar]
| Disclaimer/Publisher’s Note: The statements, opinions and data contained in all publications are solely those of the individual author(s) and contributor(s) and not of MDPI and/or the editor(s). MDPI and/or the editor(s) disclaim responsibility for any injury to people or property resulting from any ideas, methods, instructions or products referred to in the content. |
© 2025 by the authors. Licensee MDPI, Basel, Switzerland. This article is an open access article distributed under the terms and conditions of the Creative Commons Attribution (CC BY) license (https://creativecommons.org/licenses/by/4.0/).


 ,
, 