Article

A Network Analysis Approach to Detect and Differentiate Usher Syndrome Types Using miRNA Expression Profiles: A Pilot Study

Molecular Diagnostic Research Laboratory, Center for Sensory Neuroscience, Boys Town National Research Hospital, Omaha, NE 68010, USA
*
Author to whom correspondence should be addressed.
BioMedInformatics 2024, 4(4), 2271-2286; https://doi.org/10.3390/biomedinformatics4040122
Submission received: 11 October 2024 / Revised: 15 November 2024 / Accepted: 22 November 2024 / Published: 26 November 2024

Abstract

Background: Usher syndrome (USH) is a rare genetic disorder that affects both hearing and vision. It presents in three clinical types—USH1, USH2, and USH3—with varying onset, severity, and disease progression. Existing diagnostics primarily rely on genetic profiling to identify variants in USH genes; however, accurate detection before symptom onset remains a challenge. MicroRNAs (miRNAs), which regulate gene expression, have been identified as potential biomarkers for disease. The aim of this study is to develop a data-driven system for the identification of USH using miRNA expression profiles. Methods: We collected microarray miRNA-expression data from 17 samples, representing four patient-derived USH cell lines and a non-USH control. Supervised feature selection was utilized to identify key miRNAs that differentiate USH cell lines from the non-USH control. Subsequently, a network model was constructed by measuring pairwise correlations based on these identified features. Results: The proposed system effectively distinguished between control and USH samples, demonstrating high accuracy. Additionally, the model could differentiate between the three USH types, reflecting its potential and sensitivity beyond the primary identification of affected subjects. Conclusions: This approach can be used to detect USH and differentiate between USH subtypes, suggesting its potential as a future base model for the identification of Usher syndrome.

1. Introduction

Usher syndrome is an inherited autosomal recessive disorder that profoundly affects sensory functions, leading to hearing loss, vision impairment, and vestibular dysfunction. It is the most common cause of combined deafness and blindness, affecting approximately 4 to 17 per 100,000 individuals in the United States, with a notable impact on children [1]. USH is classified into three distinct clinical types, USH1, USH2, and USH3, each characterized by varying onset ages and symptom severity [2]. Variants in genes MYO7A, USH1C, CDH23, PCDH15, USH1G, and USH1K are known to be responsible for USH1. Variants in genes USH2A, ADGRV1 (also known as GPR98), and WHRN (also known as DFNB31) can cause USH2. USH3 is caused by variants in the CLRN1 and HARS1 genes [3]. USH poses significant challenges to communication and mobility, underscoring the need for accurate detection to improve intervention strategies [3].
Usher syndrome is diagnosed by performing hearing, balance, and vision examinations and confirming those findings by genetic testing. Genetic assays are designed to identify variants in genes associated with Usher syndrome [2,3]. While genetic testing is specific and reliable, it typically occurs only after clinical symptoms become evident, which limits the potential for early intervention. Recently, microRNA (miRNA) expression profiles have emerged as promising biomarkers for detecting genetic disorders, including Usher syndrome [4,5]. miRNAs are small non-coding RNA molecules that regulate gene expression and have been shown to exhibit distinct expression patterns in patients with USH, making them valuable for detection [6].
The data-driven detection of Usher syndrome using miRNA expression profiles offers the potential for efficient detection compared to traditional methods. By leveraging high-throughput miRNA profiling, this system can provide rapid, non-invasive screening for at-risk individuals, enabling early intervention and improved disease management. Recent studies have identified several microRNAs as potential biomarkers for USH, providing new insights into the molecular mechanisms underlying the disorder [7]. For instance, miR-96 has been linked to USH, as dysregulation of miR-96 can lead to progressive hearing loss by disrupting hair cell function in the inner ear and rod formation in the retina [8]. Similarly, miR-183 and miR-182, which are part of the same miRNA cluster as miR-96, have been found to play crucial roles in the regulation of gene expression in sensory cells, including those involved in hearing and vision [9]. Altered expression of these miRNAs has been observed in patients with Usher syndrome, suggesting that they may serve as early biomarkers for the disorder [7,10]. Additionally, miR-29b and miR-183 have been associated with retinal degeneration, a key feature of Usher syndrome, further supporting their potential utility in detection efforts [10,11]. These findings highlight the promise of miRNA profiling in identifying Usher syndrome at an earlier stage, which could lead to better clinical outcomes through timely intervention [12]. Furthermore, this approach could surpass the limitations of conventional genetic testing by facilitating broader and more timely screenings.
In this study, we applied a methodology that involves extracting miRNA expression data from 17 samples, obtained from one non-USH control cell line and four USH cell lines which include all three clinical types of USH. We then utilized supervised feature selection to identify key miRNAs that differentiate between non-USH control cells and USH cells. A network model was constructed by computing pairwise correlations of these features, where each sample is represented as a node and the strength of their correlations as edges. This data-driven network, built from miRNA expression profiles, enables clear visualization of sample connections and interrelationships. Our network-analysis-based data-driven system demonstrated accurate classification of control samples versus USH samples and effectively distinguished between clinical types of the disorder. This innovative approach, achieved with a relatively small sample size, has the potential to advance detection methods and lay the groundwork for future model development.
Graph-based analyses in USH studies have been limited, primarily focusing on protein–protein interaction networks to uncover molecular mechanisms of the disease [13,14,15]. These studies examine variants in proteins associated with various USH types and genotypes, exploring how these variants disrupt protein interactions to enhance our understanding of USH etiology. In contrast, this study aims to leverage miRNA expression as a predictor of disease state, emphasizing its potential utility in USH diagnostics. To our knowledge, this is one of the first applications of data-driven network modeling using miRNA expression data in Usher syndrome research. The rest of the manuscript is organized as follows: Section 2 outlines the methodology, Section 3 elaborates on the results, Section 4 discusses the findings, and Section 5 concludes the study.

2. Materials and Methods

The methodology for Usher detection is shown in Figure 1.

2.1. miRNA Profiling

Human B-lymphocyte cell lines used in this study, D3739 (USH-1D), D3741 (USH-1B), D2880 (USH-3A), and a non-USH control cell line, were established at the Boys Town National Research Hospital as previously described [7]. The USH type 2A (USH2A) B-lymphocyte cell line was procured from the Coriell Institute (Catalog ID: GM09053, Camden, NJ, USA). These cell lines were cultured in RPMI 1640 medium, supplemented with 20% fetal bovine serum (FBS) and 50 µg/mL of gentamicin. Cultures were maintained in 100 × 20 mm tissue culture plates in a humidified atmosphere containing 5% CO2, at 37 °C.
MicroRNA profiles were generated and described in detail by Tom et al. [7]. Briefly, 4 Usher B-lymphocyte cell lines with 4 different genotypes representing the three classical Usher types (Usher type 1, Usher type 2, and Usher type 3) and 1 healthy control B-lymphocyte cell line were used to generate the dataset. Usher type 1 had two distinct genotypes, Usher-1B (MY07A variant), and Usher-1D (CDH23 variant). Usher type 2 had one genotype representative (Usher-2A), with a USH2A variant, while Usher type 3 also had one genotype representative (Usher-3A) with a CLRN1 variant. Total RNA was extracted from cell lines using QIAzol® reagent, (cat. #79306, QIAGEN inc. Germantown, Maryland, USA), followed by purification using the miRNeasy Tissue/Cells Advanced Micro Kit (cat. #217684) protocol as per the manufacturer’s instructions (QIAGEN Sciences Inc., Germantown, MD, USA), and miRNA profiling was performed on all extractions using NanoString© Human v3 miRNA assay (cat. #CSO-MIR3-12, Bruker corp, Billerica, Maryland, USA), performed on the nCounter Pro analysis system (NanoString Technology, Seattle, WA, USA). Usher-1D had 3 technical replicates, Usher-1B had 2 technical replicates, and Usher-2A, Usher-3A, and healthy control lines all had 4 technical replicates each (N = 17). Raw NanoString miRNA microarray data underwent quality control and normalization using the NanoString quality control dashboard (NACHO version 2.0.0) package in R [13,16]. Housekeeping miRNAs were predicted using NACHO’s “housekeeping predict = TRUE” function, selecting the top five housekeeping miRNA candidates directly from the NanoString microarray [13]. miRNA count data were normalized relative to internal positive, negative, and housekeeping predictions using a geometric mean normalization method = “GEO”. The resulting normalized count table was used for downstream analysis.

2.1.1. miRNA Gene Target Prediction

To investigate the biological significance of the miRNAs selected from the model, affinity to gene target binding sites was estimated using TargetScanHuman version 8.0 [17]. Gene targets with cumulative weighted context scores (CWCS) less than −0.5 (i.e., strong gene suppression) were kept for gene ontology enrichment analysis and metabolic pathway analysis [17]. TargetScan (version 8.0) predicted 4179 genes with binding sites complementary to the 6 miRNAs from the model. Of these, 342 gene sites were strongly suppressed (CWCS < −0.5) and used for further analysis.

2.1.2. Gene Ontology Enrichment and Pathway Analysis

The R package ‘clusterProfiler’ was used to identify gene ontologies (GOs) and pathways that might be influenced by miRNAs from the model [18]. For gene ontology enrichment analysis, the ‘enrichGO()’ function was used with a p-value cutoff of 0.05 and a minimum gene set size of 5 [18]. Pathways affected by miRNAs were predicted using the ‘enrichr()’ function against the Reactome pathway database [18,19]. The significance of pathway enrichment was determined at an adjusted p-value threshold of 0.05.

2.2. Preprocessing and Feature Selection

To prepare the data for analysis, we first applied Min-Max scaling to normalize the miRNA expression levels, ensuring that all features were on a consistent scale. This normalization step is crucial for improving the performance and interpretability of subsequent machine learning models. For feature selection, we employed multiple techniques to identify the most important miRNA features. These methods included Random Forest, Lasso, Recursive Feature Elimination (RFE), and SelectKBest. Random Forest was used as a tree-based ensemble method that ranks features according to their importance in predicting outcomes [20]. Lasso Regression applied L1 regularization to select features by shrinking less important coefficients to zero [21]. Recursive Feature Elimination (RFE) iteratively removed the least important features to build a model with the remaining subset [22]. Finally, SelectKBest utilized statistical tests to select the top k features based on their individual significance [23]. Each technique generated a ranked list of the top 10 features based on its specific selection criteria. To enhance the robustness of our selection, we identified miRNA features that appeared in at least two of the top 10 lists across the different methods. As a result, six miRNA features were consistently identified, appearing at least twice across all the techniques. These top six features were then selected for further analysis and used in constructing the network model.

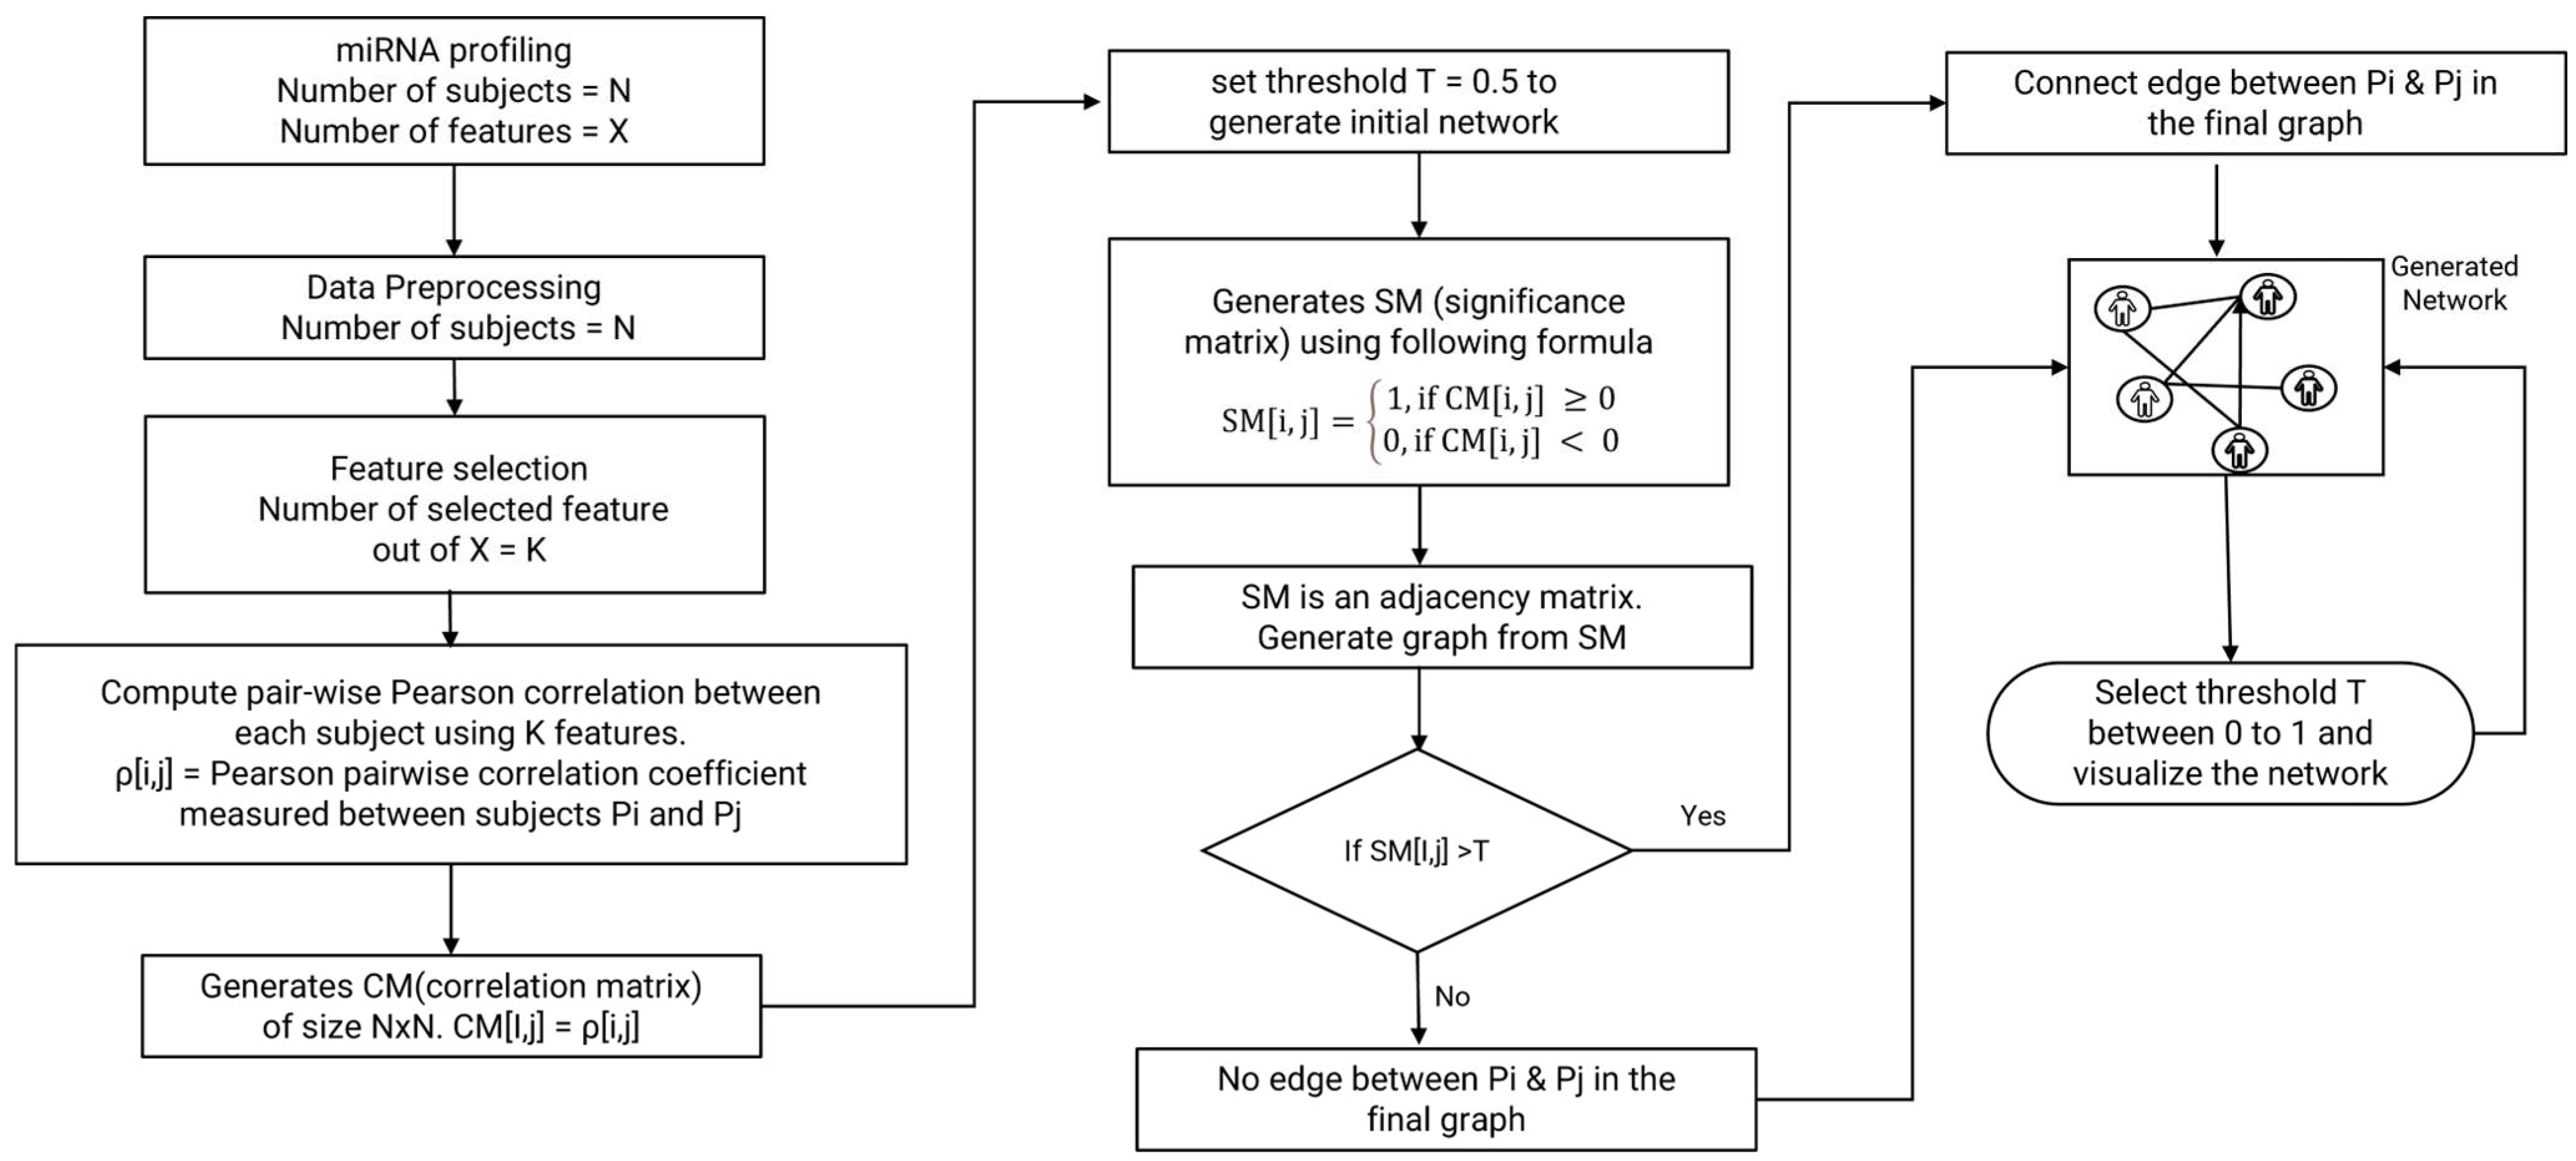
2.3. Network Modeling

The process of constructing a network graph from miRNA profiles involves representing each participant as a node, with edges representing significant correlations between their miRNA expression patterns. The goal is to visually capture the relationships between participants, allowing for a detailed analysis of patterns across both Usher syndrome patient cell lines and control subjects. Below is a technical overview of the network construction process.

2.3.1. Preliminaries

The methodology for constructing the correlation network is based on the following assumptions.
  • Let N denote the total number of subjects in the study. For this case, N = 17 subjects (4 controls and 13 Usher syndrome patient cell lines).
  • Let K represent the number of selected miRNA features utilized to construct the correlation network. In this analysis, we identified K = 6 key miRNA features.
  • Let Pi and Pj represent two randomly selected individual subjects from the population of N. The indices i and j satisfy the condition 1 ≤ (i, j) ≤ N, ensuring valid subject pairs.
  • Let ρ[i,j] correspond to the Pearson pairwise correlation coefficient between subjects Pi and Pj using their miRNA expression profiles. The Correlation Matrix (CM) stores these correlation coefficients for all subject pairs. Thus, CM[i, j] represents ρ[i, j].
  • Let T represent the threshold for the minimum correlation strength required to establish an edge between two nodes.
  • The Significance Matrix (SM) is derived from the Correlation Matrix by applying the threshold T. It serves as the adjacency matrix for the graph.

2.3.2. Network Construction Procedure

  • Compute Pairwise Pearson Correlation
For each pair of subjects Pi and Pj (where i, j ∈ {1, 2, …, N}), the Pearson correlation coefficient ρ[i, j] is calculated based on the 6 selected miRNA features. The Pearson correlation formula is given by the following equation:
r = X i X ¯ Y i Y ¯   ( X i X ¯ 2 )   Y i Y ¯ 2 )  
where r is the correlation coefficient, X and Y are the miRNA expression levels for subjects Pi and Pj at feature space k, and X ¯ and Y ¯ are the mean miRNA expression levels across all features for each subject.
  • Generate Correlation Matrix (CM)
The correlation coefficients ρ[i, j] are stored in the Correlation Matrix CM, which is an N × N symmetric matrix:
C M i , j = ρ i , j , i , j 1 , 2 , , N
  • Set Threshold (T) for Correlation Strength
A predefined threshold T is selected to determine the minimum correlation strength required to establish an edge in the graph. The threshold is adjustable using a widget, allowing the user to explore different network structures based on varying correlation strengths. Typically, a threshold T > 0.5 is considered significant.
  • Generate Significance Matrix (SM)
The Significance Matrix (SM) is derived from the Correlation Matrix (CM) using the threshold T and the following equation:
S M [ i , j ] = 1 ,   i f   C M [ i , j ]   0 0 ,   i f   C M [ i , j ] < 0
Here, SM[i, j] = 1 indicates a significant correlation between subjects Pi and Pj, and 0 otherwise.
  • Generate Network Graph
The final step involves constructing the network graph based on the values in the Significance Matrix (SM). Each subject Pi is represented as a node, and an edge is created between nodes Pi and Pj if SM[i, j] = 1. The graph is thus defined by the adjacency matrix SM, where nodes are connected if their pairwise correlation exceeds the threshold T. The network graph visually represents the relationships between subjects based on their miRNA expression similarities.
  • Network Analysis
By adjusting the threshold T, different graph structures can be explored, revealing varying levels of subject connectivity. A higher threshold results in fewer edges, representing only the most strongly correlated subjects, while a lower threshold increases the graph’s density by including weaker correlations. This graph provides valuable insights into the relationships among the subjects, particularly between controls and Usher syndrome patient cell lines. Strong clusters in the graph may indicate subgroups of subjects with similar miRNA expression patterns, potentially uncovering distinct molecular signatures associated with Usher syndrome. The dynamic thresholding approach enables an in-depth exploration of the correlation structure, facilitating further analysis of the underlying biological processes captured by miRNA expression in both Usher syndrome patient cell lines and controls.

3. Results

This section presents results from feature selection, network analysis, analysis of miRNA expression profiles, and Gene Ontology Enrichment and Metabolic Pathway analyses.

3.1. Feature Selection

The data-driven Usher syndrome detection system was developed using microRNA (miRNA) expression profiles to identify key features and assess interrelationships between subjects. Following preprocessing, supervised feature selection techniques, such as Random Forest Feature Importance, LASSO, Recursive Feature Elimination (RFE), and SelectKBest, were applied. Table 1 shows the top 10 features selected by each feature selection algorithm. Then, we chose miRNAs that appear at least two times. These techniques led to the identification of six key miRNAs that were most significant in distinguishing control samples from patient cell lines with different subtypes of Usher syndrome (miR-20a-5p + miR-20b-5p, miR-92a-3p, miR-16-5p, miR-183-5p, miR-106a-5p + miR-17-5p, and miR-23a-3p).

3.2. Network Analysis

Using six selected features in the feature selection step, a network was constructed by measuring the pairwise Pearson correlation between each pair of participants based on their miRNA expression profiles. Each sample was represented as a node, and an edge between any two nodes indicated a correlation above a defined threshold. The edge weight corresponded to the strength of correlation between the miRNA expression profiles of the two samples. In this undirected network, subjects with a stronger correlation (above a specified threshold) were more closely associated. Figure 2, Figure 3 and Figure 4 illustrate three networks constructed at different correlation thresholds. These networks demonstrate how the population of subjects, including controls and patient cell lines with varying Usher syndrome subtypes, are interconnected at increasing levels of correlation strength. The threshold values range from 0 to 1, where a minimum threshold of 0 represents weaker relationships between populations, and a maximum threshold of 1 indicates stronger relationships. The gradual increase in threshold helps reveal intricate relationships between the subjects. The network analysis effectively highlights how varying correlation thresholds can be used to unravel different levels of subject similarity and dissimilarity within the dataset.
  • Network at Lower Threshold of 0.50 (Figure 2): At a lower correlation threshold, the network shows a clear separation between control subjects and Usher syndrome patient cell lines. Control subjects are grouped into a distinct cluster, while Usher patients form another interconnected cluster. This separation suggests that the control group exhibits a different miRNA expression profile compared to the Usher syndrome patient cell lines. Furthermore, at this lower threshold, Usher patient cell lines are not differentiable from one another, suggesting that while control and Usher subjects can be detected, the subtypes of Usher syndrome remain indistinguishable.
  • Network at Intermediate Threshold of 0.79 (Figure 3): As the correlation threshold increases, the network begins to reveal more specific relationships within the Usher syndrome group. Notably, Usher type 1D subjects are separated into a distinct cluster, suggesting that their miRNA expression profiles are less like other Usher subtypes at this correlation strength. The control group remains isolated from the patient clusters, reinforcing the separation between healthy individuals and those with Usher syndrome.
  • Network at Higher Threshold of 0.88 (Figure 4): At the highest correlation threshold, the network shows even finer granularity in the relationships between subjects. Usher type 1B samples now form a separate cluster, distinct from both the Usher type 1D cluster and other Usher subtypes. This suggests that at higher thresholds, the system can differentiate between subtypes of Usher syndrome based on subtle variations in miRNA expression. The control group continues to form its own separate cluster, reinforcing its distinct expression profile. In contrast, Usher type 2A and type 3A subjects remain strongly connected even at higher thresholds, suggesting that their similar miRNA profiles render them indistinguishable from one another.

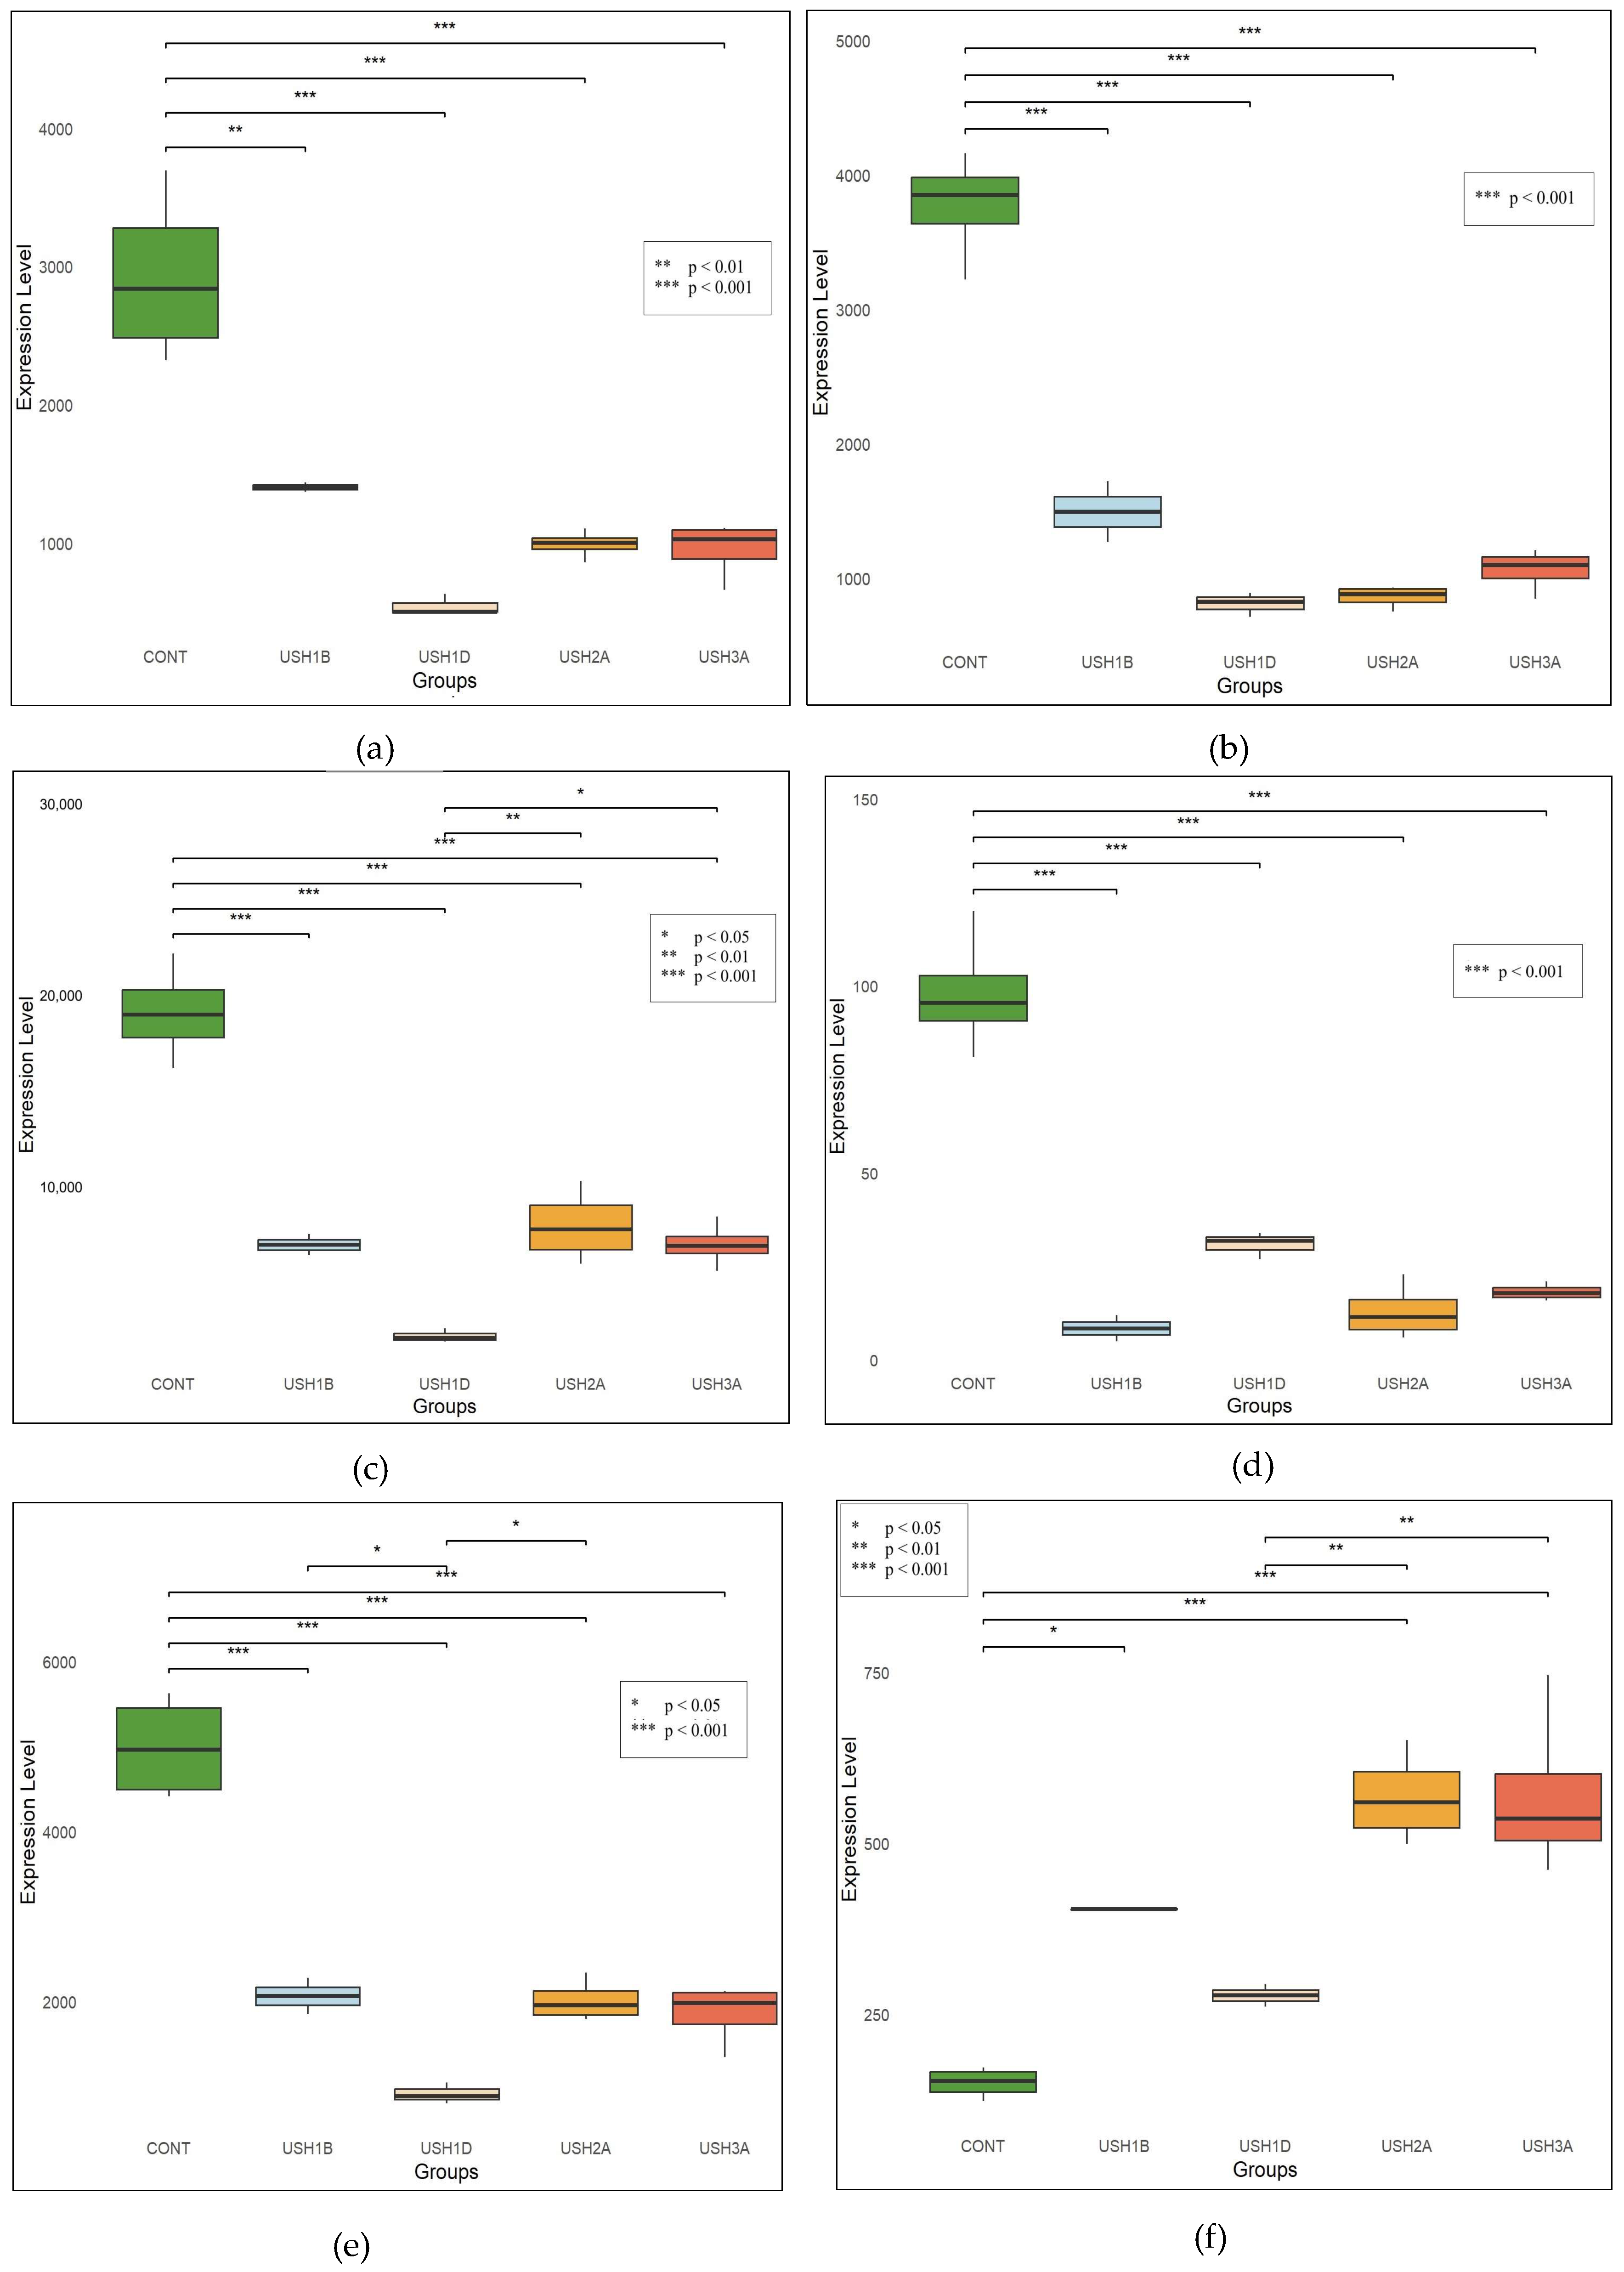
3.3. miRNA Expression Profiles

Figure 5 displays the top six miRNAs identified through supervised feature selection, highlighting their expression patterns in healthy individuals compared to Usher syndrome patient cell lines and among different Usher subtypes. The differential expression patterns are as follows:
  • Overall Trends
The expression levels of all identified miRNAs significantly differ between control and Usher syndrome patient cell lines. Specifically, the miRNAs miR-20a-5p + miR-20b-5p, miR-92a-3p, miR-16-5p, miR-183-5p, and miR-106a-5p + miR-17-5p are notably downregulated in Usher syndrome patient cell lines compared to controls. Conversely, the miRNA miR-23a-3p is significantly upregulated in the Usher cohort.
  • Type-Specific Patterns
The miRNA profiles reveal distinct patterns that can be associated with specific Usher syndrome subtypes:
      o
USH2A and USH3A
It can be observed that there is no significant difference in six miRNAs between USH2A and USH3A patient cell lines. Consequently, individuals from both categories are strongly interconnected within the network, irrespective of the increasing threshold. This lack of distinction suggests that USH2A and USH3A share similar miRNA expression profiles, making it challenging to differentiate between the two groups. The strong connectivity underscores the need for further investigation to understand the underlying molecular mechanisms that contribute to their comparable profiles.
      o
USH1B vs. USH1D
There is a significant upregulation of miRNA levels in USH1B compared to USH1D, except for miR-183-5P, which is downregulated in USH1B. This indicates notable differences in miRNA profiles between these two subtypes.
  • Control vs. Usher Syndrome
The control subjects are distinctly separated from Usher patient cell lines, underscoring the efficacy of the selected miRNAs as biomarkers for distinguishing between healthy individuals and those with Usher syndrome. The clear differentiation between controls and Usher syndrome patient cell lines, as well as among Usher subtypes, supports the potential of these miRNAs in detection and subtype classification.

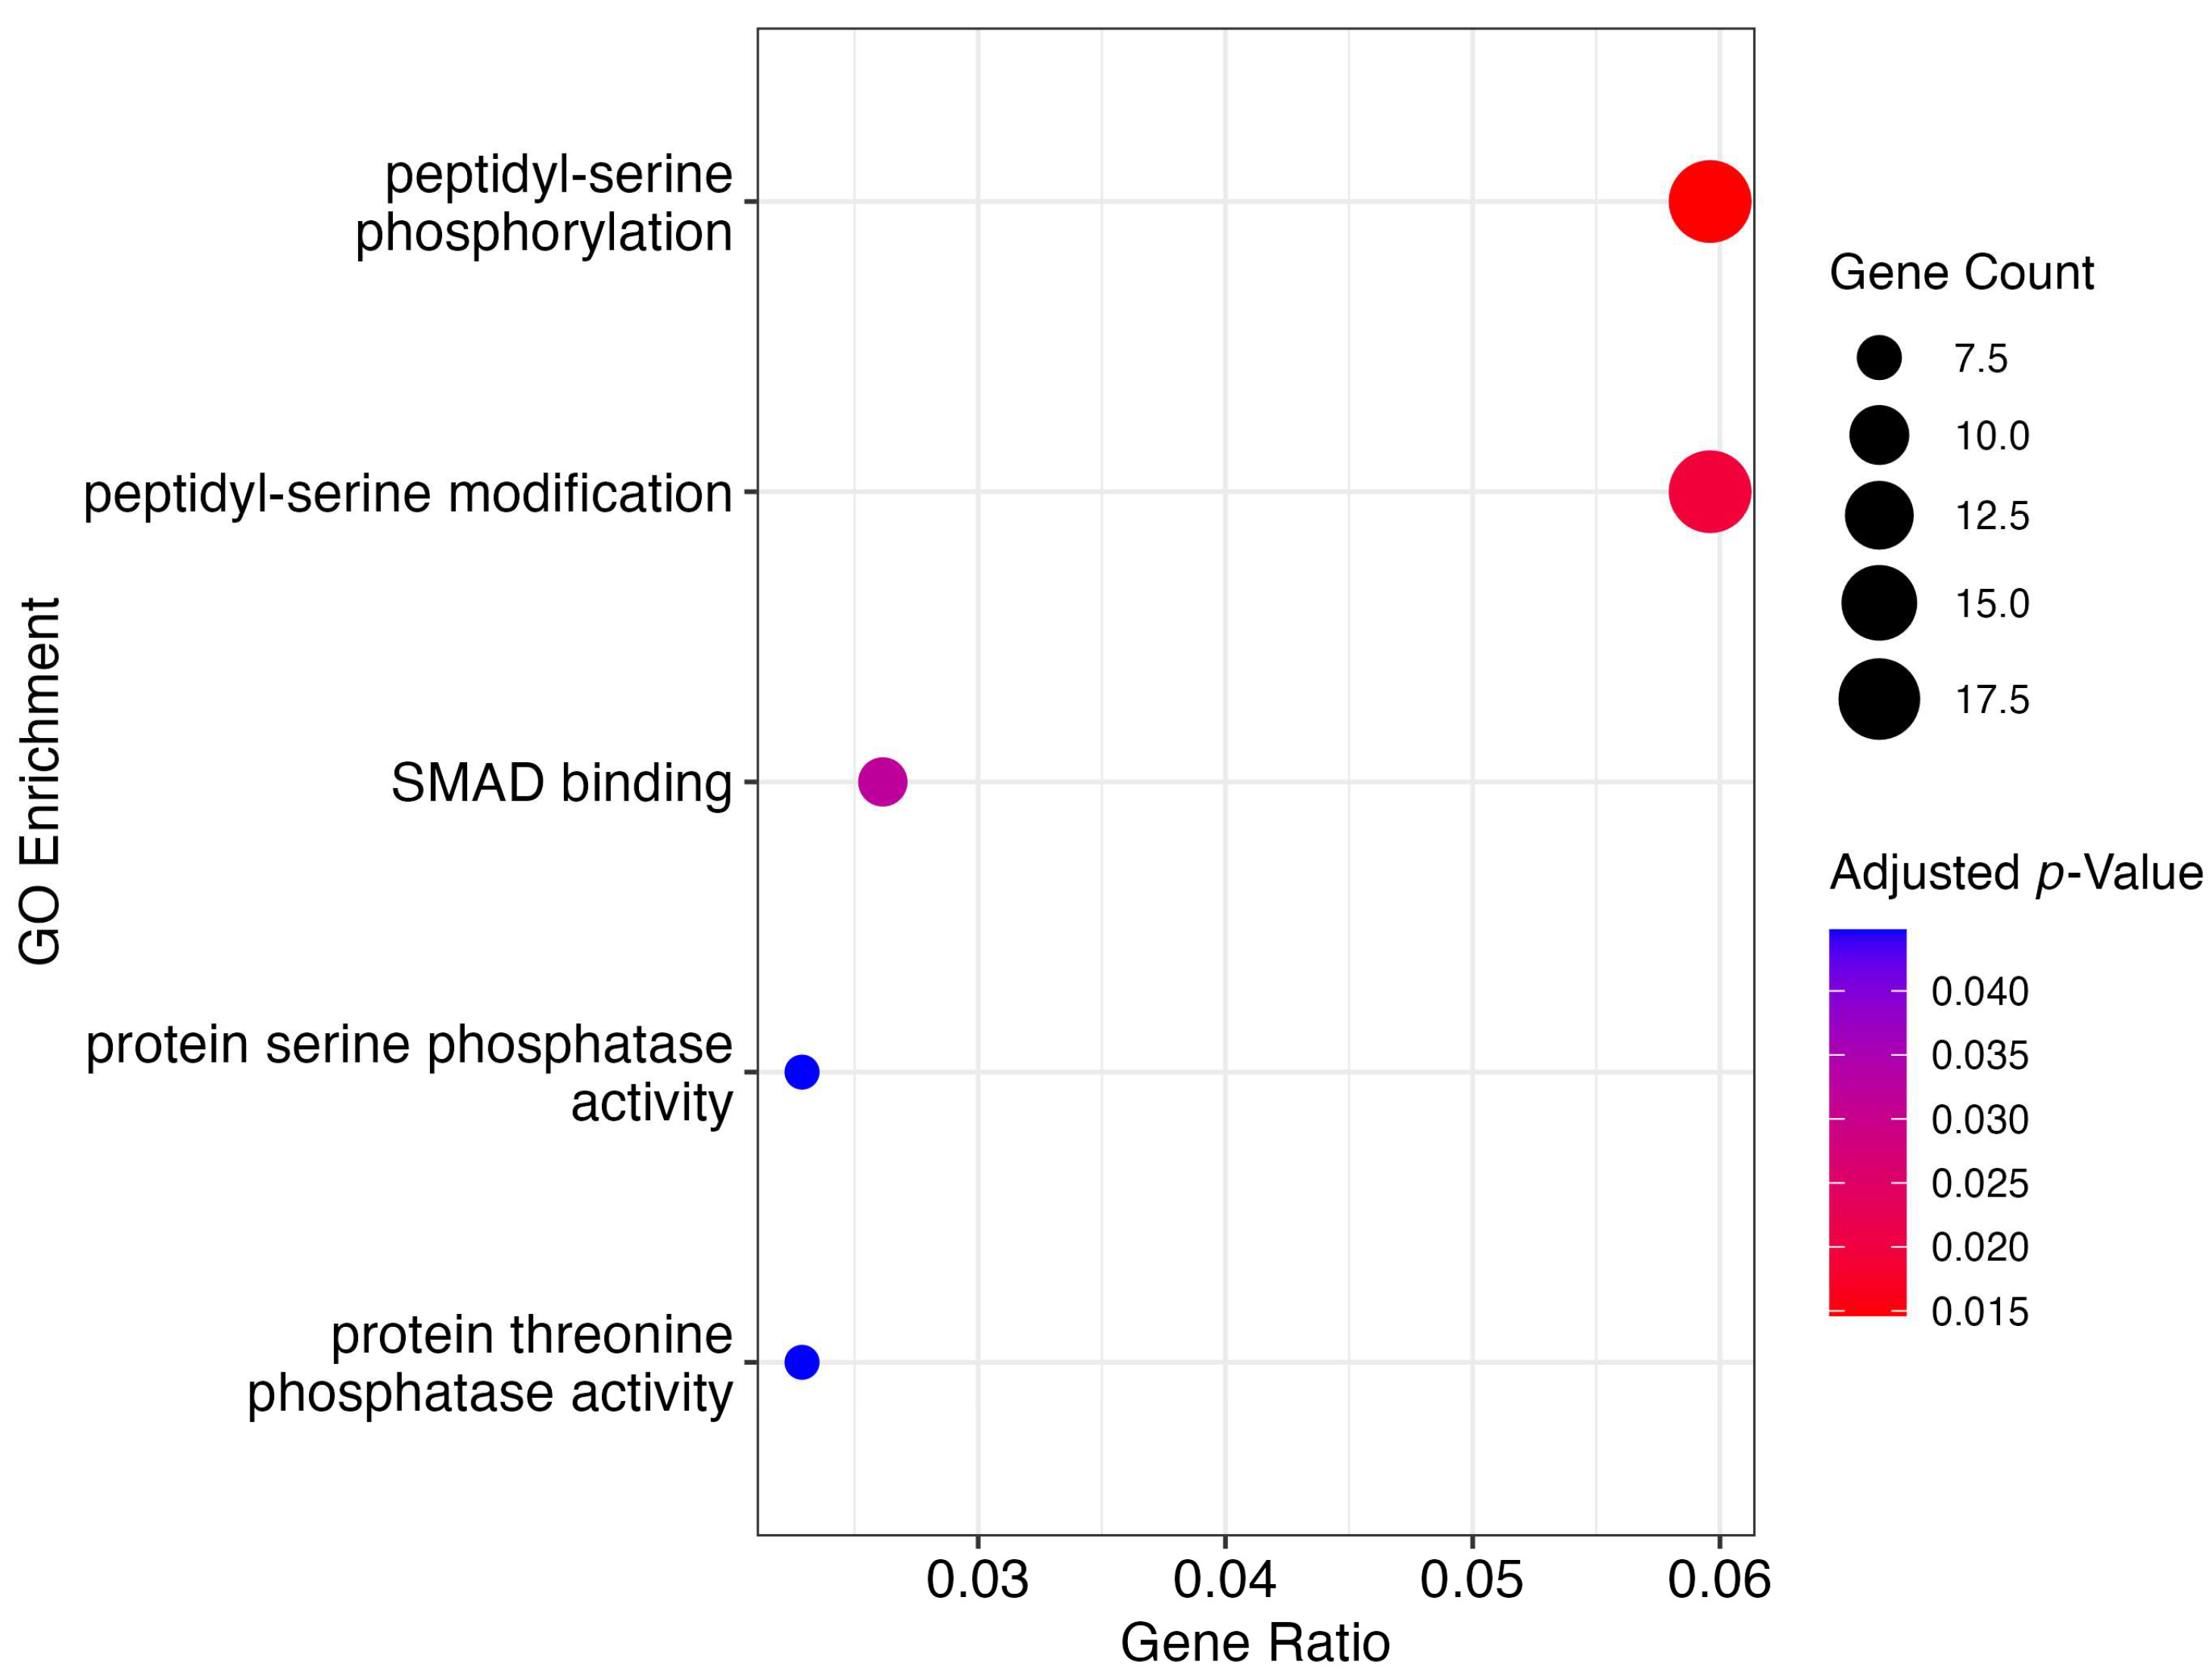
3.4. Gene Ontology Enrichment and Metabolic Pathway Analyses

The 342 unique genes predicted to be targeted and suppressed by network miRNAs resulted in 5 GOs that were flagged as being affected (Figure 6). Two linked biological processes, peptidyl-serine phosphorylation and modification, had the highest number of genes (18) predicted to be suppressed by the miRNAs of interest. Three molecular function ontologies were also identified, albeit with lower numbers of affected genes within groups, SMAD binding (eight), protein serine phosphatase activity (seven), and protein threonine phosphatase activity (seven) (Figure 6).
Pathway analysis with the Reactome pathway database identified five pathways that might be influenced by the dysregulation of our top six miRNAs: Signal transduction (72/2465 genes), MASTL pathway, MAPK pathway, and signaling by WNT in cancer (Table 2). It is important to note that five of the six miRNAs, apart from miR-23a-3p, were all downregulated in Usher cell lines, so the genes within the GOs and pathways are likely to not be inhibited, as compared to the control cell line.

4. Discussion

This study introduces a novel approach for distinguishing between Usher syndrome patient cell lines and healthy individuals through network analysis of microRNA (miRNA) expression profiles. Given the rarity of Usher syndrome and the associated challenges in obtaining large sample sizes, traditional machine learning methods are often impractical. This study circumvents these limitations by employing graph networks, which offer a promising alternative for analyzing rare disorders with small sample sizes. The network analysis presented in this study reveals how varying correlation thresholds can uncover different levels of subject similarity and dissimilarity. By constructing undirected graphs based on pairwise Pearson correlations of miRNA profiles, we visualized the connections between subjects at different thresholds. The analysis highlighted that higher correlation thresholds lead to more stringent connections, which can reveal finer details of the relationships among subjects. For example, at a lower threshold, broader connections among all subjects are observed, while at higher thresholds, more distinct clusters emerge, allowing for clearer differentiation between Usher syndrome subtypes and healthy controls.
This threshold-dependent network structure is crucial for understanding the molecular relationships within the dataset. It enables a detailed examination of how strongly two subjects are associated and helps in identifying subtle differences between subtypes of Usher syndrome. Such granularity is often not achievable with traditional statistical methods alone, highlighting the advantage of network-based approaches in this context. One significant advantage of this network-based approach is its ability to reveal complex relationships among subjects that might not be apparent through other methods. For instance, in scenarios where subjects are connected at varying strengths, the tool can assist clinicians and researchers in interpreting these connections. For example, if a subject with Usher syndrome (S3) is connected to control subjects (S1 and S2) at a higher strength than to other Usher patients (S4), this could indicate a potential misclassification or a progressive shift towards a control-like profile. This capability allows for nuanced analysis and interpretation of individual cases, enhancing the utility of the tool in both clinical and research settings.
Investigation into the role that dysregulated miRNAs play in disease is also worthwhile. For example, of the six miRNAs that served as the top features, three (miR-106a-5p + miR-17-5p, miR-92a-3p, and miR-20a-5p + miR20b-5p) are members of the miR-17/92 family, which is known to regulate genes involved in cell proliferation, development, and differentiation in neural stem/progenitor cells and regulatory T cells [24,25]. It is also well established that miR-183-5p plays a role in regulating genes associated with inner ear hair cell formation, but the gene targets involved in this process remain largely not understood [26]. miR-23a-3p plays an active role in B-lymphocyte development [27], and all cell lines from this study are B-lymphocytes. miR-16-5p has been shown to suppress the expression of CCND1, CCND3, CCNE1, and CDK6, regulating the cell growth cycle in A549 cells [28]. All six of the miRNAs identified in this study have interesting biological implications that warrant further investigation.
This is supported further by the results of the GO and pathway analysis which identified cell signaling regulation as gene targets for the six miRNAs from the model. Specifically, peptidyl-serine phosphorylation is crucial for activating or inactivating many proteins, especially in signaling pathways that govern cell growth, differentiation, and apoptosis. This phosphorylation is often part of larger kinase cascades, such as the MAPK pathway, which plays a central role in transmitting extracellular signals to the nucleus, impacting gene expression related to cell fate decisions. SMAD binding proteins, often regulated by serine phosphorylation, are part of the transforming growth factor (TGFB) signaling pathway (Figure 6 and Table 1). These pathways are pivotal in controlling cell proliferation, differentiation, and apoptosis, especially during embryonic development and tissue homeostasis. Both MAPK and TGFB fall under the umbrella of “Signal Transduction” from the Reactome pathway analysis (Table 1). Three of the six miRNAs that are useful in predicting Usher cell lines are part of the same cluster, miR-106a-5p + miR-17-5p, miR-20a-5p + miR-20b-5p, and miR-92a-3p. Interestingly, a study by Li et al. in 2012 found that this cluster of miRNAs regulates the transforming growth factor beta (TGFB) pathway in palatal mesenchymal cells (PMCs), which are essential for craniofacial development (including the development of the inner ear) [29]. Their results showed that miR-17-92 blocked the effects of TGFB1, which normally slows cell growth and increases collagen production in PMCs by reducing the levels of TGFBR2, SMAD2, and SMAD4 proteins [29]. miRNAs from our network analysis also are predicted to influence several genes involved in SMAD binding, which was a top GO. It is our hypothesis that the miRNAs identified from this network analysis could be modulating genes in these serine-related pathways to fine-tune cellular responses during developmental processes. For instance, miRNAs targeting protein serine/threonine phosphatases or kinases might control the phosphorylation states of key developmental regulators, thus impacting processes like cell cycle progression, differentiation, or apoptosis. However, this correlation as it would pertain to inner ear hair cell development needs to be validated experimentally, not only with bioinformatic prediction as demonstrated here.

5. Limitations and Future Work

This study has certain limitations, including a small sample size, which restricts the generalizability of the findings and the robustness of the network analysis. The feature selection methods used may not capture all relevant biological information, and the sensitivity to correlation thresholds can impact network interpretations. Additionally, the undirected graph model assumes symmetric relationships, which may not fully represent the complexity of biological interactions. Future research should focus on acquiring larger datasets to enhance model validity, exploring alternative feature selection techniques, and optimizing correlation thresholds. The innovative approach demonstrated in this study lays the groundwork for future research. The ability to distinguish between Usher syndrome subtypes with a small sample size suggests that this model can be extended to larger cohorts as more data become available. Furthermore, refining the model and incorporating additional features or advanced graph analysis techniques could further enhance its diagnostic capabilities and utility in clinical practice.

6. Conclusions

The network analysis conducted in this study demonstrates the ability of varying correlation thresholds to uncover different levels of similarity and dissimilarity among subjects within the dataset. This approach effectively distinguishes between healthy individuals and those with Usher syndrome, as well as differentiates among the syndrome’s subtypes. The identified miRNAs play a crucial role in distinguishing between Usher syndrome subtypes, underscoring their potential as biomarkers for distinguishing between Usher cell lines and controls. By integrating network analysis with miRNA expression profiles, this study offers a comprehensive view of the interrelationships among subjects and the distinct molecular signatures associated with Usher syndrome. These findings not only affirm the robustness of the system but also its potential to enhance detection and subtype classification. The novelty of this study lies in the development of a model using a small sample size, which serves as a foundation for future models with larger cohorts. Furthermore, this system holds promise as an assessment tool for clinicians, allowing them to diagnose the disorder more effectively or adjust the resolution to visualize the placement of new patient samples within the overall population.

Author Contributions

Conceptualization, R.M.F. and R.K.T.; methodology, R.K.T. and W.A.T.; software, R.K.T.; validation, R.K.T. and W.A.T.; formal analysis, R.K.T. and W.A.T.; investigation, C.J., A.O. and D.S.C.; data curation, W.A.T. and R.K.T.; writing—original draft preparation, R.K.T.; writing—review and editing, R.M.F., W.A.T., G.K., D.S.C. and A.O.; visualization, R.K.T.; supervision, R.M.F.; project administration, R.M.F., funding acquisition, R.M.F. All authors have read and agreed to the published version of the manuscript.

Funding

This research was funded by a grant from the Ryan Foundation to MRF.

Institutional Review Board Statement

This study was conducted in accordance with the Declaration of Helsinki and approved by the Institutional Review Board of Boys Town National Research Hospital, Omaha NE, USA (IRB protocol number: # 20-14-XP; approval date: 28 September 2020).

Informed Consent Statement

Informed consent was obtained from all subjects involved in the study.

Data Availability Statement

The datasets generated and analyzed during the current study are available from the corresponding author upon reasonable request. Additionally, the code used for analysis is also available upon request.

Acknowledgments

We wish to thank Jennifer Bushing, Genomics Core Facility, University of Nebraska Medical Center, Omaha, NE, USA, for her technical assistance in NanoString miRNA microarray experiments. The UNMC Genomics Core Facility receives partial support from the National Institute for General Medical Science (NIGMS) INBRE-P20GM103427-19, as well as the National Cancer Institute and The Fred & Pamela Buffett Cancer Center Support Grant—P30CA036727. This publication’s contents are the sole responsibility of the authors and do not necessarily represent the official views of the NIH or NIGMS.

Conflicts of Interest

The authors declare no conflicts of interest.

References

  1. Boughman, J.A.; Vernon, M.; Shaver, K.A. Usher syndrome: Definition and estimate of prevalence from two high-risk populations. J. Chronic Dis. 1983, 36, 595–603. [Google Scholar] [CrossRef] [PubMed]
  2. Delmaghani, S.; El-Amraoui, A. The genetic and phenotypic landscapes of Usher syndrome: From disease mechanisms to a new classification. Hum. Genet. 2022, 141, 709–735. [Google Scholar] [CrossRef] [PubMed]
  3. Dammeyer, J. Development and characteristics of children with Usher syndrome and CHARGE syndrome. Int. J. Pediatr. Otorhinolaryngol. 2012, 76, 1292–1296. [Google Scholar] [CrossRef]
  4. Andersen, G.B.; Tost, J. Circulating miRNAs as biomarkers in cancer. In Tumor Liquid Biopsies; Springer: Berlin/Heidelberg, Germany, 2020; pp. 277–298. [Google Scholar]
  5. Seyhan, A.A. Circulating microRNAs as potential biomarkers in pancreatic cancer—Advances and challenges. Int. J. Mol. Sci. 2023, 24, 13340. [Google Scholar] [CrossRef] [PubMed]
  6. Liang, Y.; Ridzon, D.; Wong, L.; Chen, C. Characterization of microRNA expression profiles in normal human tissues. BMC Genom. 2007, 8, 166. [Google Scholar] [CrossRef]
  7. Tom, W.A.; Chandel, D.S.; Jiang, C.; Krzyzanowski, G.; Fernando, N.; Olou, A.; Fernando, M.R. Fernando N, Olou A, Fernando MR. Genotype characterization and miRNA expression profiling in Usher syndrome cell lines. Int. J. Mol. Sci. 2024, 25, 9993. [Google Scholar] [CrossRef]
  8. Lewis, M.A.; Quint, E.; Glazier, A.M.; Fuchs, H.; De Angelis, M.H.; Langford, C.; van Dongen, S.; Abreu-Goodger, C.; Piipari, M.; Redshaw, N.; et al. An ENU-induced mutation of miR-96 associated with progressive hearing loss in mice. Nat. Genet. 2009, 41, 614–618. [Google Scholar] [CrossRef]
  9. Weston, M.D.; Pierce, M.L.; Rocha-Sanchez, S.; Beisel, K.W.; Soukup, G.A. MicroRNA gene expression in the mouse inner ear. Brain Res. 2006, 1111, 95–104. [Google Scholar] [CrossRef] [PubMed]
  10. Zhao, Y.; Jaber, V.; Percy, M.E.; Lukiw, W.J. A microRNA cluster (let-7c, miRNA-99a, miRNA-125b, miRNA-155, and miRNA-802) encoded at chr21q21.1-chr21q21.3 and the phenotypic diversity of Down’s syndrome (DS; trisomy 21). J. Nat. Sci. 2017, 3, e466. [Google Scholar]
  11. Mun, S.-K.; Chae, H.; Piao, X.-Y.; Lee, H.-J.; Kim, Y.-K.; Oh, S.-H.; Chang, M. MicroRNAs related to cognitive impairment after hearing loss. Clin. Exp. Otorhinolaryngol. 2021, 14, 76–81. [Google Scholar] [CrossRef]
  12. Pierce, M.L.; Weston, M.D.; Fritzsch, B.; Gabel, H.W.; Ruvkun, G.; Soukup, G.A. MicroRNA-183 family conservation and ciliated neurosensory organ expression. Evol. Dev. 2008, 10, 106–113. [Google Scholar] [CrossRef]
  13. Canouil, M.; Bouland, G.A.; Bonnefond, A.; Froguel, P.; ’t Hart, L.M.; Slieker, R.C. NACHO: An R package for quality control of NanoString nCounter data. Bioinformatics 2020, 36, 970–971. [Google Scholar] [CrossRef] [PubMed]
  14. Chance, M.R.; Chang, J.; Liu, S.; Gokulrangan, G.; Chen, D.H.-C.; Lindsay, A.; Geng, R.; Zheng, Q.Y.; Alagramam, K. Proteomics, bioinformatics and targeted gene expression analysis reveals up-regulation of cochlin and identifies other potential biomarkers in the mouse model for deafness in Usher syndrome type 1F. Hum. Mol. Genet. 2010, 19, 1515–1527. [Google Scholar] [CrossRef] [PubMed]
  15. Linnert, J.; Knapp, B.; Güler, B.E.; Boldt, K.; Ueffing, M.; Wolfrum, U. Usher syndrome proteins ADGRV1 (USH2C) and CIB2 (USH1J) interact and share a common interactome containing TRiC/CCT-BBS chaperonins. Front. Cell Dev. Biol. 2023, 11, 1199069. [Google Scholar] [CrossRef]
  16. Giorgi, F.M.; Ceraolo, C.; Mercatelli, D. The R language: An engine for bioinformatics and data science. Life 2022, 12, 648. [Google Scholar] [CrossRef]
  17. McGeary, S.E.; Lin, K.S.; Shi, C.Y.; Pham, T.M.; Bisaria, N.; Kelley, G.M.; Bartel, D.P. The biochemical basis of microRNA targeting efficacy. Science 2019, 366, eaav1741. [Google Scholar] [CrossRef] [PubMed]
  18. Wu, T.; Hu, E.; Xu, S.; Chen, M.; Guo, P.; Dai, Z.; Feng, T.; Zhou, L.; Tang, W.; Zhan, L.; et al. clusterProfiler 4.0: A universal enrichment tool for interpreting omics data. Innovation 2021, 2, 100141. [Google Scholar] [CrossRef] [PubMed]
  19. Jassal, B.; Matthews, L.; Viteri, G.; Gong, C.; Lorente, P.; Fabregat, A.; Sidiropoulos, K.; Cook, J.; Gillespie, M.; Haw, R.; et al. The reactome pathway knowledgebase. Nucleic Acids Res. 2020, 48, D498–D503. [Google Scholar] [CrossRef]
  20. Rogers, J.; Gunn, S. Identifying feature relevance using a random forest. In International Statistical and Optimization Perspectives Workshop: Subspace, Latent Structure and Feature Selection; Springer: Berlin/Heidelberg, Germany, 2005; pp. 173–184. [Google Scholar]
  21. Fonti, V.; Belitser, E. Feature selection using lasso. VU Amst. Res. Pap. Bus. Anal. 2017, 30, 1–25. [Google Scholar]
  22. Sachdeva, R.K.; Bathla, P.; Rani, P.; Kukreja, V.; Ahuja, R. Systematic method for breast cancer classification using RFE feature selection. In Proceedings of the 2nd International Conference on Advance Computing and Innovative Technologies in Engineering (ICACITE), Greater Noida, India, 28–29 April 2022; IEEE: Piscataway, NJ, USA; pp. 1673–1676. [Google Scholar]
  23. Das, S. Filters, wrappers and a boosting-based hybrid for feature selection. In Proceedings of the 18th International Conference on Machine Learning (ICML), Williamstown, MA, USA, 28 June–1 July 2001; Volume 1, p. 74. [Google Scholar]
  24. Kunze-Schumacher, H.; Krueger, A. The Role of MicroRNAs in Development and Function of Regulatory T Cells–Lessons for a Better Understanding of MicroRNA Biology. Front. Immunol. 2020, 11, 2185. [Google Scholar] [CrossRef]
  25. Xia, X.; Wang, Y.; Zheng, J.C. The microRNA-17~92 family as a key regulator of neurogenesis and potential regenerative therapeutics of neurological disorders. Stem Cell Rev. Rep. 2022, 18, 401–411. [Google Scholar] [CrossRef] [PubMed]
  26. Mahmoodian-Sani, M.-R.; Mehri-Ghahfarrokhi, A. The potential of miR-183 family expression in inner ear for regeneration, treatment, diagnosis and prognosis of hearing loss. J. Otol. 2017, 12, 55–61. [Google Scholar] [CrossRef] [PubMed]
  27. Kong, K.Y.; Owens, K.S.; Rogers, J.H.; Mullenix, J.; Velu, C.S.; Grimes, H.L.; Dahl, R. MIR-23A microRNA cluster inhibits B-cell development. Exp. Hematol. 2010, 38, 629–640. [Google Scholar] [CrossRef] [PubMed]
  28. Liu, Q.; Fu, H.; Sun, F.; Zhang, H.; Tie, Y.; Zhu, J.; Xing, R.; Sun, Z.; Zheng, X. miR-16 family induces cell cycle arrest by regulating multiple cell cycle genes. Nucleic Acids Res. 2008, 36, 5391–5404. [Google Scholar] [CrossRef]
  29. Li, L.; Shi, J.; Zhu, G.; Shi, B. MiR-17–92 cluster regulates cell proliferation and collagen synthesis by targeting TGFB pathway in mouse palatal mesenchymal cells. J. Cell. Biochem. 2012, 113, 1235–1244. [Google Scholar] [CrossRef]
Figure 1. Overview of networking methodology.
Biomedinformatics 04 00122 g001
Figure 2. Network visualization at a threshold of 0.5.
Biomedinformatics 04 00122 g002
Figure 3. Network visualization at threshold 0.79.
Biomedinformatics 04 00122 g003
Figure 4. Network visualization at threshold 0.88.
Biomedinformatics 04 00122 g004
Figure 5. Box plots with statistical significance for top 6 miRNAs identified in feature selection: (a) miR-20a-5p + miR-20b-5p; (b) miR-92a-a3p; (c) miR-16-5p; (d) miR-183-5p; (e) miR-106a-5p + miR-17-5p; (f) miR-23a-3p.
Biomedinformatics 04 00122 g005
Figure 6. Significant gene ontologies predicted to be affected by model miRNAs. The y-axis depicts the 5 ontologies, and the x-axis shows the ratio of significant genes to the total number of genes in the ontology. Dots correspond to the genes affected by miRNAs, with the size of the dot correlating to the number of genes affected in the ontology (minimum 7, maximum 18).
Biomedinformatics 04 00122 g006
Table 1. Table depicting the top 10 miRNAs selected by 4 feature selection algorithms. miRNAs that are in bold appeared at least twice in the entire table.
Random ForestLassoRFESelectKBest
hsa-miR-769-5phsa-miR-212-3phsa-miR-106a-5p + hsa-miR-17-5phsa-miR-106a-5p +hsa-miR-17-5p
hsa-miR-23a-3phsa-miR-107hsa-miR-142-3phsa-miR-129-2-3p
hsa-miR-183-5phsa-miR-15a-5phsa-miR-146a-5phsa-miR-16-5p
hsa-miR-20a-5p+hsa-miR-20b-5phsa-miR-132-3phsa-miR-155-5phsa-miR-183-5p
hsa-let-7e-5phsa-let-7a-5phsa-miR-16-5phsa-miR-194-5p
hsa-miR-299-3phsa-let-7d-5phsa-miR-19b-3phsa-miR-20a-5p+hsa-miR-20b-5p
hsa-miR-28-3phsa-miR-146b-5phsa-miR-29a-3phsa-miR-296-5p
hsa-miR-1244hsa-miR-23a-3phsa-miR-29b-3phsa-miR-484
hsa-miR-3934-5phsa-miR-18a-5phsa-miR-4454 + hsa-miR-7975hsa-miR-92a-3p
hsa-miR-363-3phsa-let-7b-5phsa-miR-92a-3phsa-miR-96-5p
Table 2. Table depicting the top 5 pathways containing significant miRNA target genes using the Reactome pathway database. Significance was assigned at an adjusted (BH) p-value ≤ 0.05.
PathwayOverlapp-ValueAdjusted p-ValueOdds RatioCombined ScoreGenes
Signal Transduction R-HSA-16258272/24653.13 × 10−60.002378261.9239448424.3828992CHRM2; ITGB1; TFRC; HTR2A; HTR4; CRKL; AKAP12; FGF7; SPRED1;
DUSP10; CCND1; MYB; AKT3; TAGAP; PDK4; PDE4B; PROK2; RSPO3; ZNF367; SH3GL2; TGIF1; DUSP5; PRKCI; DUSP2; CNOT6L; TGIF2; FBXW7; OMG; AXIN2; RHOC; VRK3; TGFBR2; DYNC1LI2; CCNE1; PKP4; PFN2; AMER1; GNAI3; PSEN2; DERL2; ARL2; ADRB1; PTHLH; MYL12B; ARHGAP12; PPP2CA; PPP2CB; ARHGAP20; CCL7; GNG5; MKNK1; SHOC2; CCL1; RHPN2; E2F5; USP25; TCF7L2; CBX4; WNT3A; WNT7A; GNG12; VEGFA; SMAD7; APLN; BAMBI; VAPB; PDE7A; CENPQ; RAB9B; CDC42SE2; CDK5R1; PTPN3
MASTL Facilitates Mitotic Progression R-HSA-24659104/101.63 × 10−50.0061722738.7613412427.403609PPP2CA; PPP2CB; MASTL; ARPP19
Negative Regulation Of MAPK Pathway R-HSA-56752216/416.49 × 10−50.0164284110.011734796.5344737PPP2CA; PPP2CB; DUSP5; DUSP2; DUSP10; PTPN3
Cyclin D Associated Events In G1 R-HSA-692316/470.000142270.026995498.5439895575.6808883PPP2CA; PPP2CB; CCND2; CCND1; CCNE1; E2F5
Signaling By WNT In Cancer R-HSA-47912755/330.000227330.0345093310.401653287.2604006AMER1; PPP2CA; PPP2CB; TCF7L2; WNT3A
Disclaimer/Publisher’s Note: The statements, opinions and data contained in all publications are solely those of the individual author(s) and contributor(s) and not of MDPI and/or the editor(s). MDPI and/or the editor(s) disclaim responsibility for any injury to people or property resulting from any ideas, methods, instructions or products referred to in the content.

