Article

A Smartphone-Based Algorithm for L Test Subtask Segmentation

by
Alexis L. McCreath Frangakis
1,*,
Edward D. Lemaire
1,2 and
Natalie Baddour
1,*
1
Department of Mechanical Engineering, Faculty of Engineering, University of Ottawa, Ottawa, ON K1N 6N5, Canada
2
Faculty of Medicine, University of Ottawa, Ottawa, ON K1H 8M2, Canada
*
Authors to whom correspondence should be addressed.
BioMedInformatics 2024, 4(2), 1262-1274; https://doi.org/10.3390/biomedinformatics4020069
Submission received: 11 March 2024 / Revised: 5 April 2024 / Accepted: 8 May 2024 / Published: 10 May 2024
(This article belongs to the Special Issue Editor's Choices Series for Methods in Biomedical Informatics Section)

Abstract

:
Background: Subtask segmentation can provide useful information from clinical tests, allowing clinicians to better assess a patient’s mobility status. A new smartphone-based algorithm was developed to segment the L Test of functional mobility into stand-up, sit-down, and turn subtasks. Methods: Twenty-one able-bodied participants each completed five L Test trials, with a smartphone attached to their posterior pelvis. The smartphone used a custom-designed application that collected linear acceleration, gyroscope, and magnetometer data, which were then put into a threshold-based algorithm for subtask segmentation. Results: The algorithm produced good results (>97% accuracy, >98% specificity, >74% sensitivity) for all subtasks. Conclusions: These results were a substantial improvement compared with previously published results for the L Test, as well as similar functional mobility tests. This smartphone-based approach is an accessible method for providing useful metrics from the L Test that can lead to better clinical decision-making.

1. Introduction

Functional mobility tests are used in rehabilitation to monitor patient progress and assess their ability to move and ambulate safely [1]. Common functional mobility tests include the timed up-and-go test (TUG) and L Test of functional mobility (L Test) [1]. Although similar in movement, Deathe and Miller [1] reported advantages of the L Test over the TUG, emphasizing that the L Test includes turns in both directions, increases the distance walked, and decreases the ceiling effect often associated with TUG [1].
The L Test begins with the person sitting in a chair. The person then stands up and walks forward three meters to a marker, turns 90°, walks seven meters to a second marker, turns 180°, walks back to the first marker, turns 90°, walks back to the chair, turns 180°, and sits down [1] (Figure 1). Each movement is referred to as a subtask (i.e., stand-up, walk, turn, sit-down). Individual assessment of these subtasks has been useful in predictive recovery measures [2]. For example, fall risk has been correlated with stand-up and sit-down task durations, as well as 180° turns [2]. However, current data collection methods are limited to a clinician’s stopwatch to measure total test time [3]; hence, the opportunity to gain extra information is lost. Additionally, clinicians do not have the time to calculate subtask timing from a secondary data collection source within a typical clinical environment. Hence, automating the segmentation and postprocessing of these tests should enable clinicians to obtain and use subtask information within clinical encounters for decision-making, thereby creating a more effective clinical experience.
A variety of data collection methods have been proposed for subtask segmentation. These include 2D video recordings, wearable sensors, and ambient sensors [3]. These approaches can also decrease manual error and variance between clinicians compared to using a stopwatch [3]. Wearable sensors are one of the best options due to their accessibility, minimal space requirements, and affordability [3]. An inertial measurement unit (IMU) is an inexpensive and accessible type of wearable sensor that can measure parameters such as acceleration, angular velocity, and turn angle. Figure 2 shows a physical representation of these parameters, which follow the same labeling convention as [4]: anteroposterior acceleration (APa), angular velocity (APω), and rotation (APR); mediolateral acceleration (MLa), angular velocity (MLω), and rotation (MLR); and vertical acceleration (Va), angular velocity (Vω), and rotation (VR). Additionally, the azimuth signal provides the horizontal angle from true north.
TUG subtask segmentation using IMU sensors is a valid approach [2,3,4,5,6,7,8,9,10,11,12,13,14,15,16,17,18,19,20,21,22,23,24,25,26,27], and can be completed using smartphone sensor data [16,18,25]. A smartphone approach does not require additional equipment and has good statistical agreement with movement analysis devices [28]. It was noted that prior smartphone-based studies did not have a primary aim to test the algorithms themselves but rather aimed to establish the validity of using a smartphone IMU for subtask segmentation.
To date, there is no validated approach for segmenting the L Test. In this paper, we report research to develop and evaluate an approach for fully segmenting the stand-up, sit-down, and turn subtasks of the L Test using data acquired from a single pelvis-worn smartphone. Preliminary results were presented in a conference paper [29]. A successful segmentation approach will provide additional movement information for the clinician while requiring equivalent time to complete an L Test trial, accommodating clinical appointment duration. Appropriate subtask segmentation will also enable further analysis and research with AI-based modeling (i.e., fall risk, movement quality, etc.).

2. Materials and Methods

2.1. Participants

Data were collected from a convenience sample of 6 male and 15 female able-bodied participants, between the ages of 19 and 68 (average age: 36 ± 19 years). Exclusion criteria included individuals with cognitive issues that affected their ability to follow instructions. Participants provided informed consent prior to participating. The study was approved by the University of Ottawa’s Office of Research Ethics and Integrity (H-09-22-8351). Participant characteristics are shown in Table 1.

2.2. Data Collection

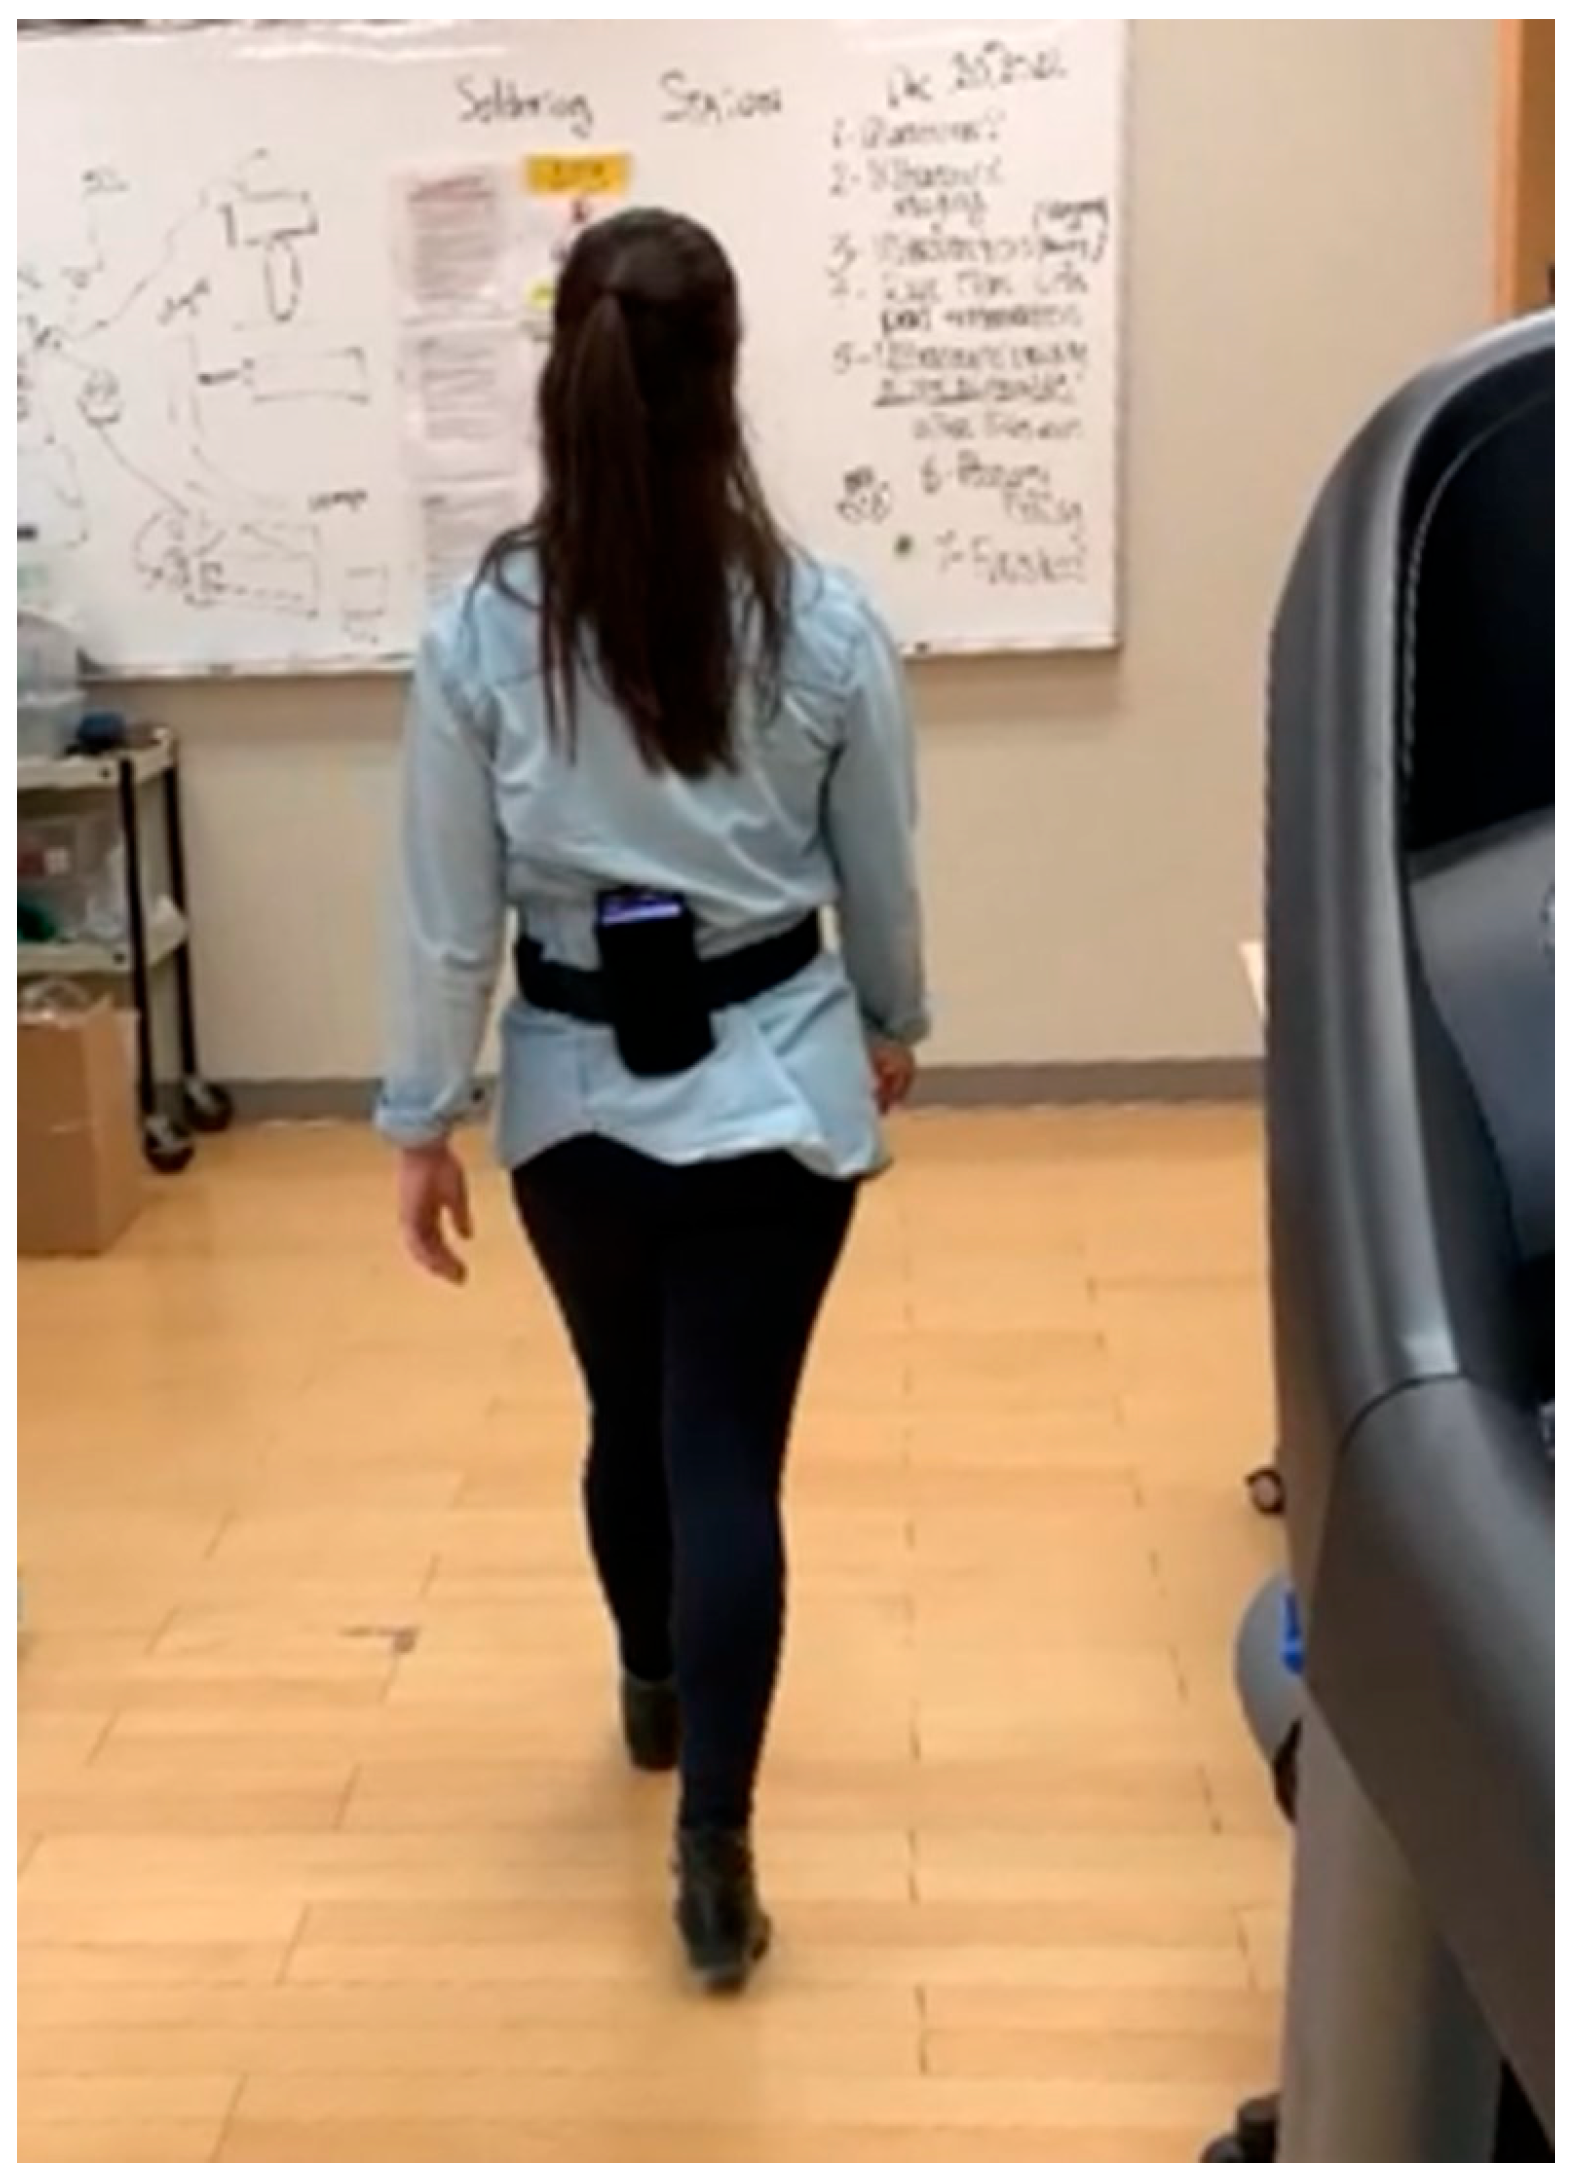
A custom belt was fastened around the waist of each participant, which held a Samsung Galaxy S10+ smartphone in a posterior pocket (Figure 3). This posterior-pelvis position was chosen for its approximation of center of mass, as well as its demonstrated efficacity in other algorithms [30]. A custom app written by our group [31] recorded IMU data at 60 Hz; including, raw and linear accelerations in the mediolateral, anteroposterior, and vertical directions; rotation angle in the mediolateral, anteroposterior, and vertical direction; azimuth angle; and angular velocity in the mediolateral, anteroposterior, and vertical directions. Participants were instructed to complete the L Test at a walking speed that was fast but safe according to their own capabilities. Five trials were completed for each participant. The app provided an auditory cue to indicate that it had begun recording. Participants were then informed that they could begin the first trial. Once each trial was completed, the participant was given an opportunity to rest before beginning the next trial.

2.3. Ground Truth

An Apple iPhone XR was used to video-record participants at 30 Hz while they completed the tests. Ground truth times of events of interest were determined from the video using Kinovea [32]. The beginning of the stand-up task was defined as the beginning of trunk flexion and the end corresponded to maximal trunk extension, whether this occurred before or after the first step. Turn initiation was the beginning of pelvis rotation and turn completion was the end of this rotation. The beginning of the sit-down subtask was defined as the beginning of trunk flexion and the end was the end of trunk extension. Timestamps of three foot strikes from the first walkway were also recorded, and then used to align the ground truth times with the inertial data, since foot strikes provided clear acceleration peaks.

2.4. Preprocessing

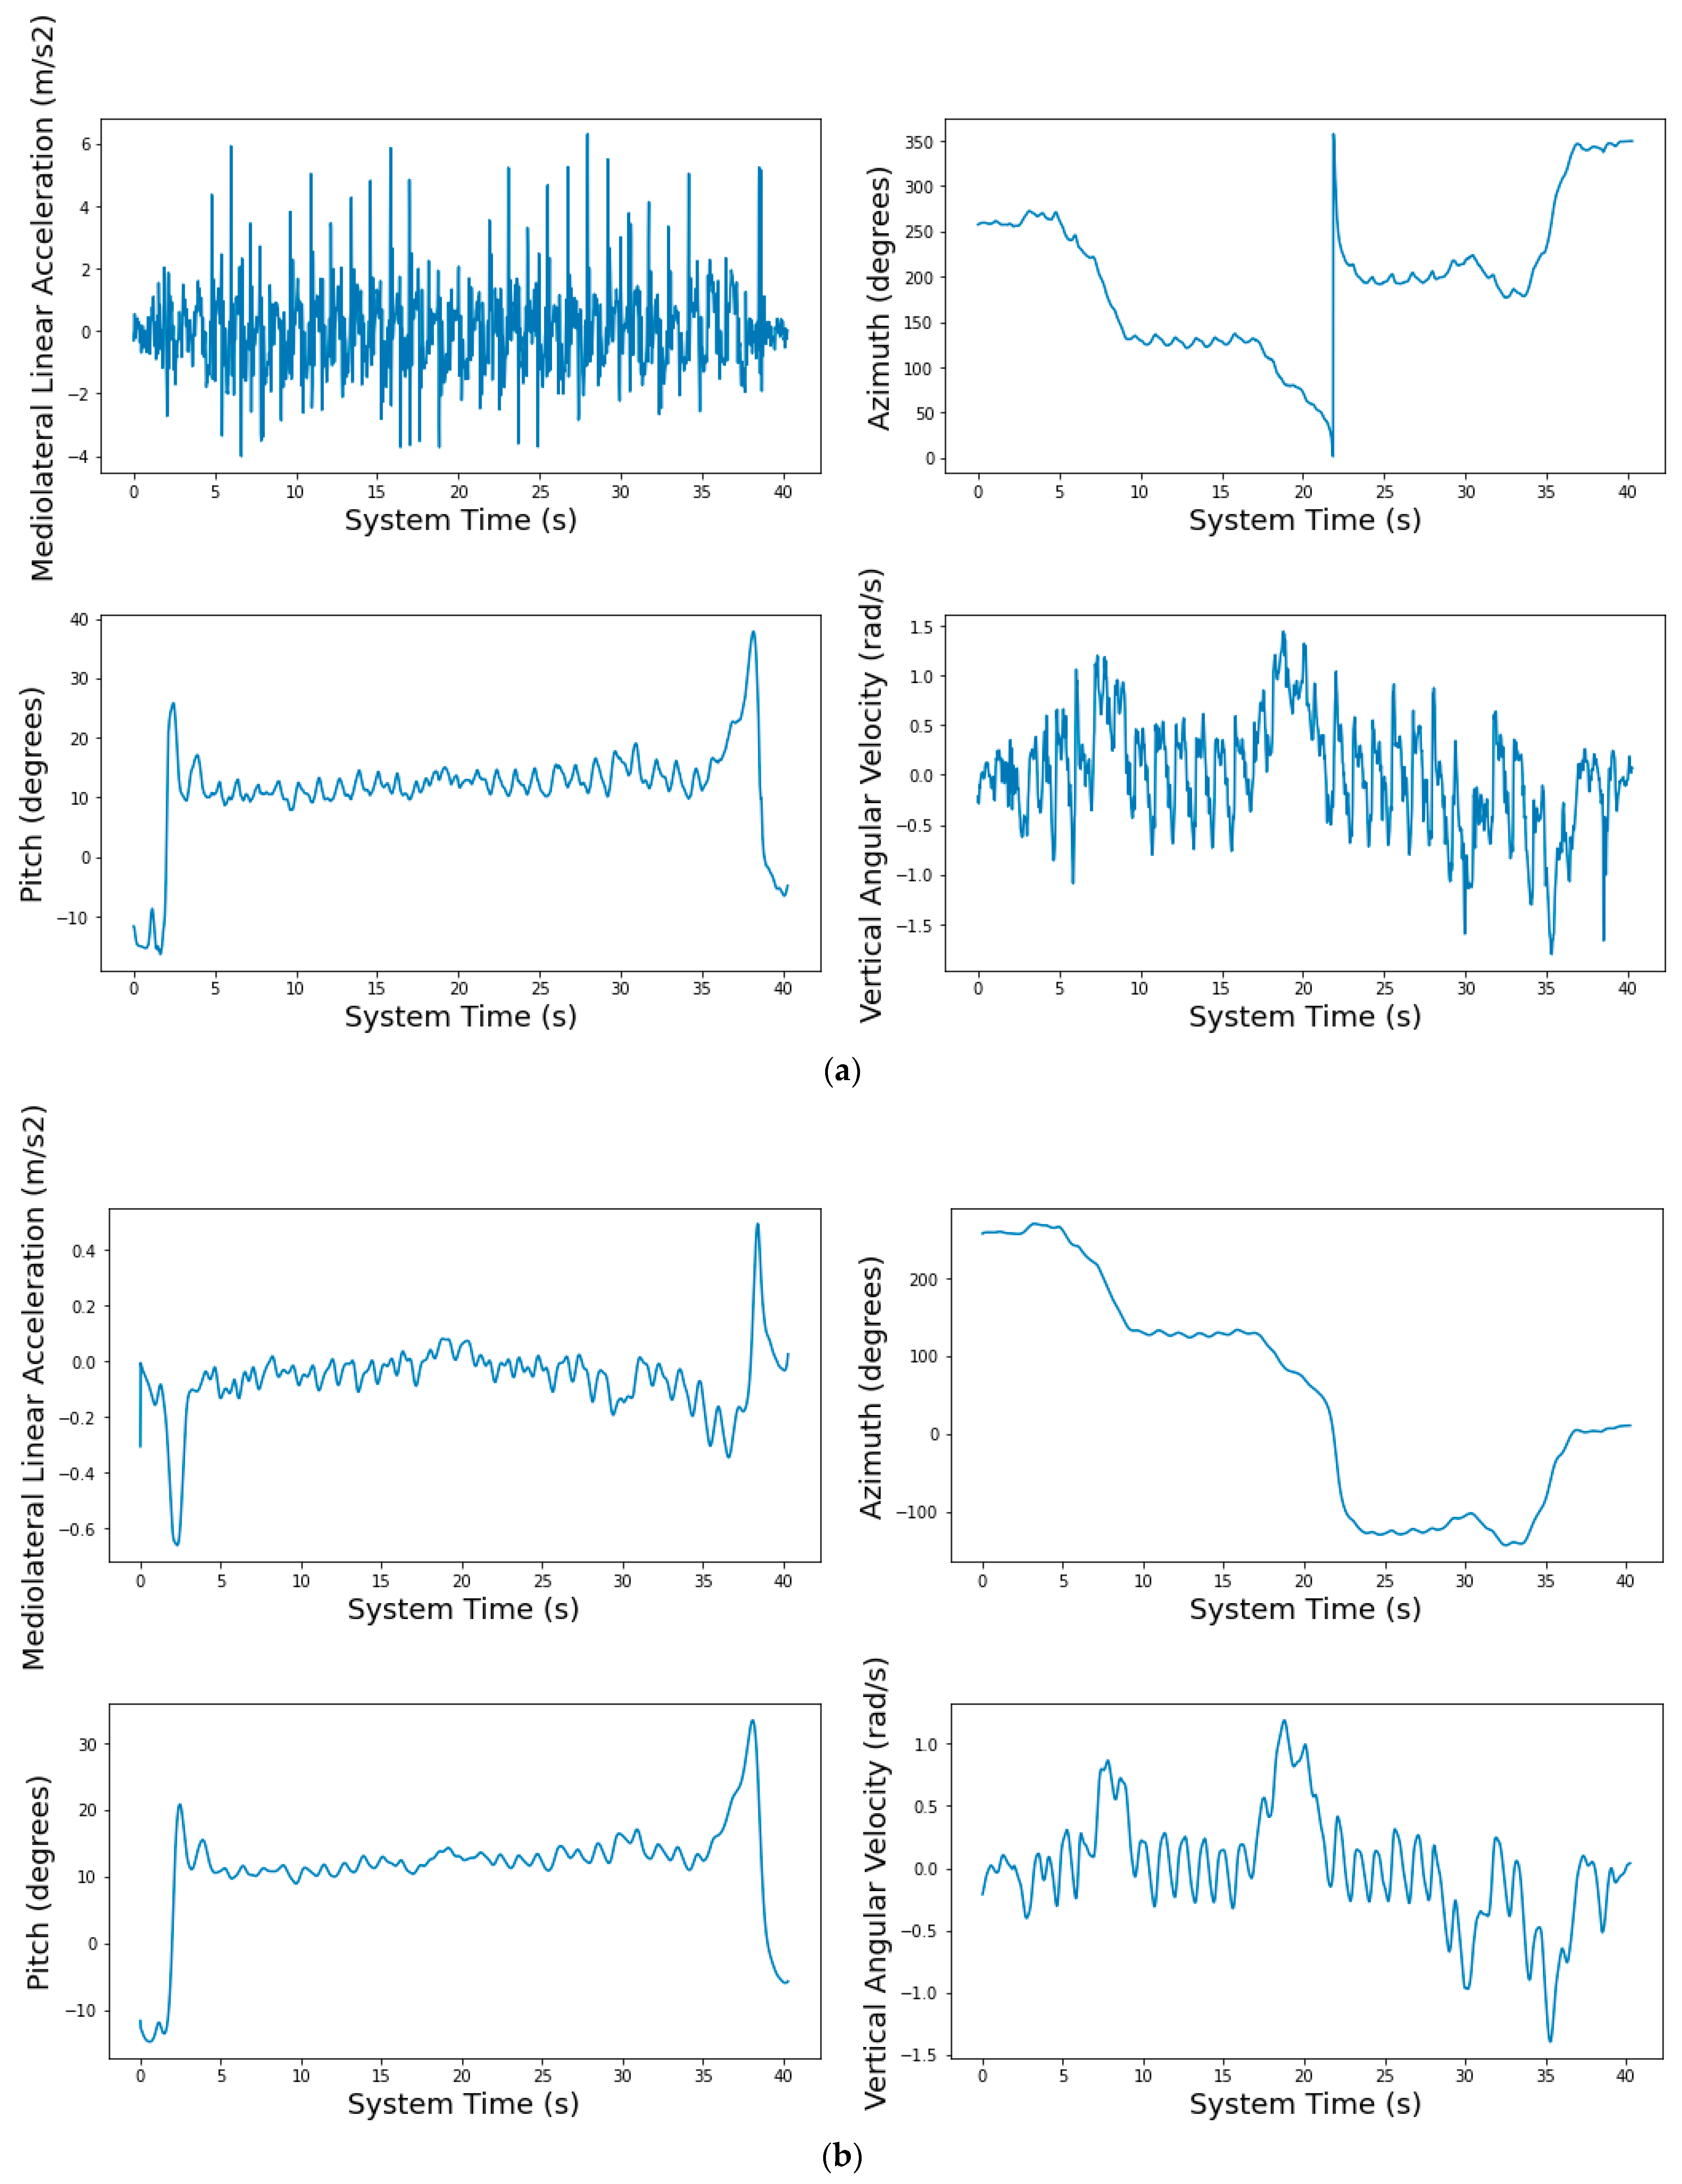
Raw data were imported into a custom-built Python program. The algorithm corrected jumps in the azimuth signal that occurred when a participant turned past 360° or 0° [30]. A threshold technique identified changes in azimuth magnitude greater than 10° between data points and, if true, added or subtracted this magnitude change from the signal [30]. An example of these jumps can be seen in the azimuth plot in Figure 4a. Acceleration and angular velocity data were filtered using a fourth-order zero-lag Butterworth low pass filter with a 4 Hz cut-off frequency [30], a commonly used approach for filtering data for segmentation [4,20,30].

2.5. Algorithm

2.5.1. Algorithm Overview

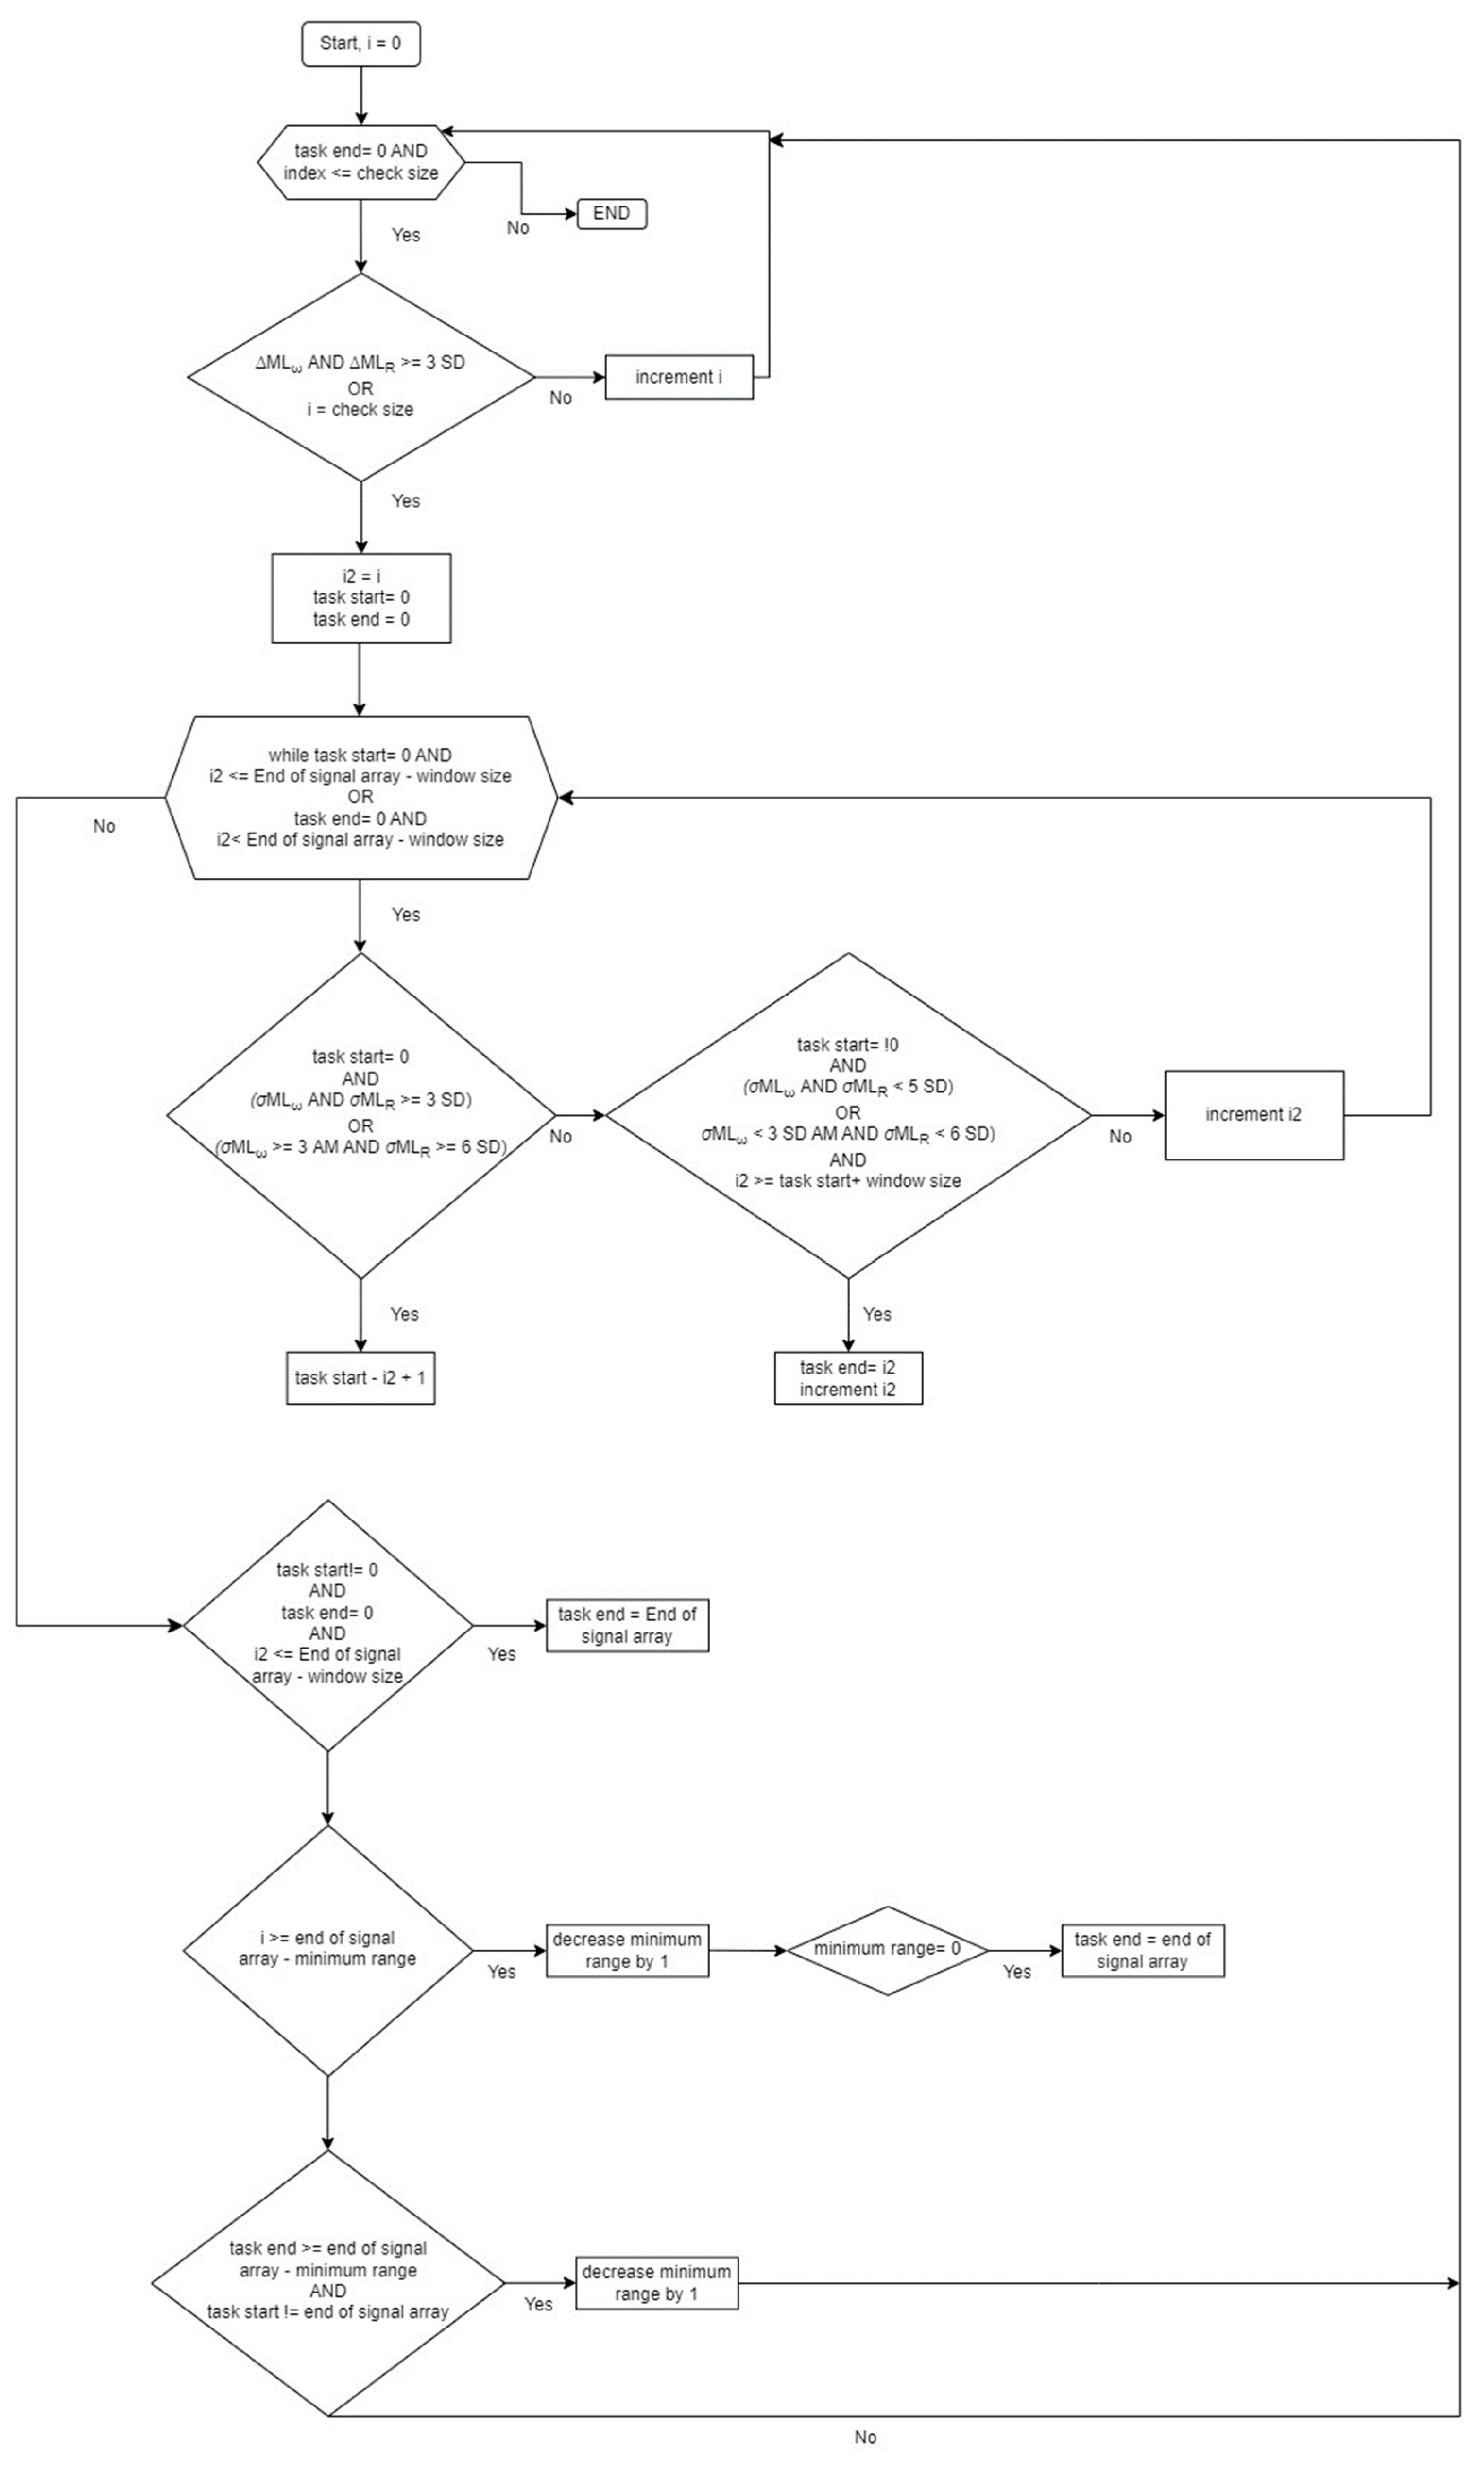
The algorithm classified stand-up, first 90° turn, first 180° turn, second 90° turn, second 180° turn, and sit-down task. Each subtask was found using the algorithm described in Section 2.5.3. After a subtask was found, data up to the end of the identified subtask were removed and the classifier resumed classifying subsequent tasks. The only exception was the last 180° turn and the sit-down task, since these two tasks happen simultaneously for some participants.

2.5.2. Threshold Selection

When completing tasks within the L Test, participants maintained a relatively consistent torso posture during straight walking, but more torso motion during standing-up, turning, and sitting-down. Therefore, a threshold approach was adopted to differentiate between walking and these other subtasks. To calculate these thresholds, four steps (two strides) from the initial seven-meter walking section were segmented for each participant. A 0.33 s sliding window (20 data points at 60 Hz, overlapping, and advancing by one data point within the given range) was used to calculate both standard deviation (SD) and magnitude change within each window, for medial–lateral angular velocity and medial–lateral rotation angle, for each participant. The mean of these values across all participants was then calculated to provide a final mean and standard deviation for these signals while walking. The thresholds for stand-up and sit-down were set to the mean plus a required number of standard deviations, depending on the signal and subtask (Section 2.5.3). Turning thresholds were initially gathered from [30] and updated to provide sufficient values for 90° turns.
The 0.33 s sliding window was chosen as an appropriate window size for subtasks, since for healthy individuals, the average step takes about 0.47 to 0.59 s during moderate-to-vigorous walking [33] and a 0.33 s window was found to give sufficient time to observe signals for a subtask without missing a change in magnitude or standard deviation. If the window was too small, insufficient changes in the signals for proper classification may occur for people who walked slowly. If the window was too large, data from a previous stride may interfere with the classification of the current task.

2.5.3. Subtask Identification

A sliding window approach was used to identify the beginning and end of each subtask. Pseudocode depicting the sliding window approach for the stand-up task is in Appendix A. To determine the beginning of the subtask, two steps were required. First, a sliding window (length of 0.33 s, overlapping, advancing by one data point) with signals relevant to the subtask was used to determine if a magnitude threshold was crossed. If the window moves beyond the search area (i.e., each subtask has specific start and end search times, Table 2) without the threshold being crossed, then the threshold was decreased by 10% and the sliding window repeated the search from the beginning of the search area. Secondly, the window continued forward from the location of the magnitude threshold crossing but using a standard deviation threshold. The subtask beginning was set to the end of the window where the standard deviation threshold was crossed.
The end of each subtask was identified by moving from the subtask beginning until the standard deviation crossed the threshold again. If the window could not identify a location where the standard deviation passed the threshold, the threshold was increased by 10% and the sliding window repeated the search from the subtask beginning. The direction of search for the sit-down subtask was reversed to minimize the movement effects during the 180° turn that occurs before sitting down. Sliding window and subtask identification parameters are listed in Table 2.
Additionally, some participants had a slower trunk angular velocity but greater range; therefore, MLω did not pass the threshold during stand-up and sit-down subtasks. For these cases, lower thresholds were introduced for MLω and higher thresholds for MLR. This is shown in Table 2.

3. Results

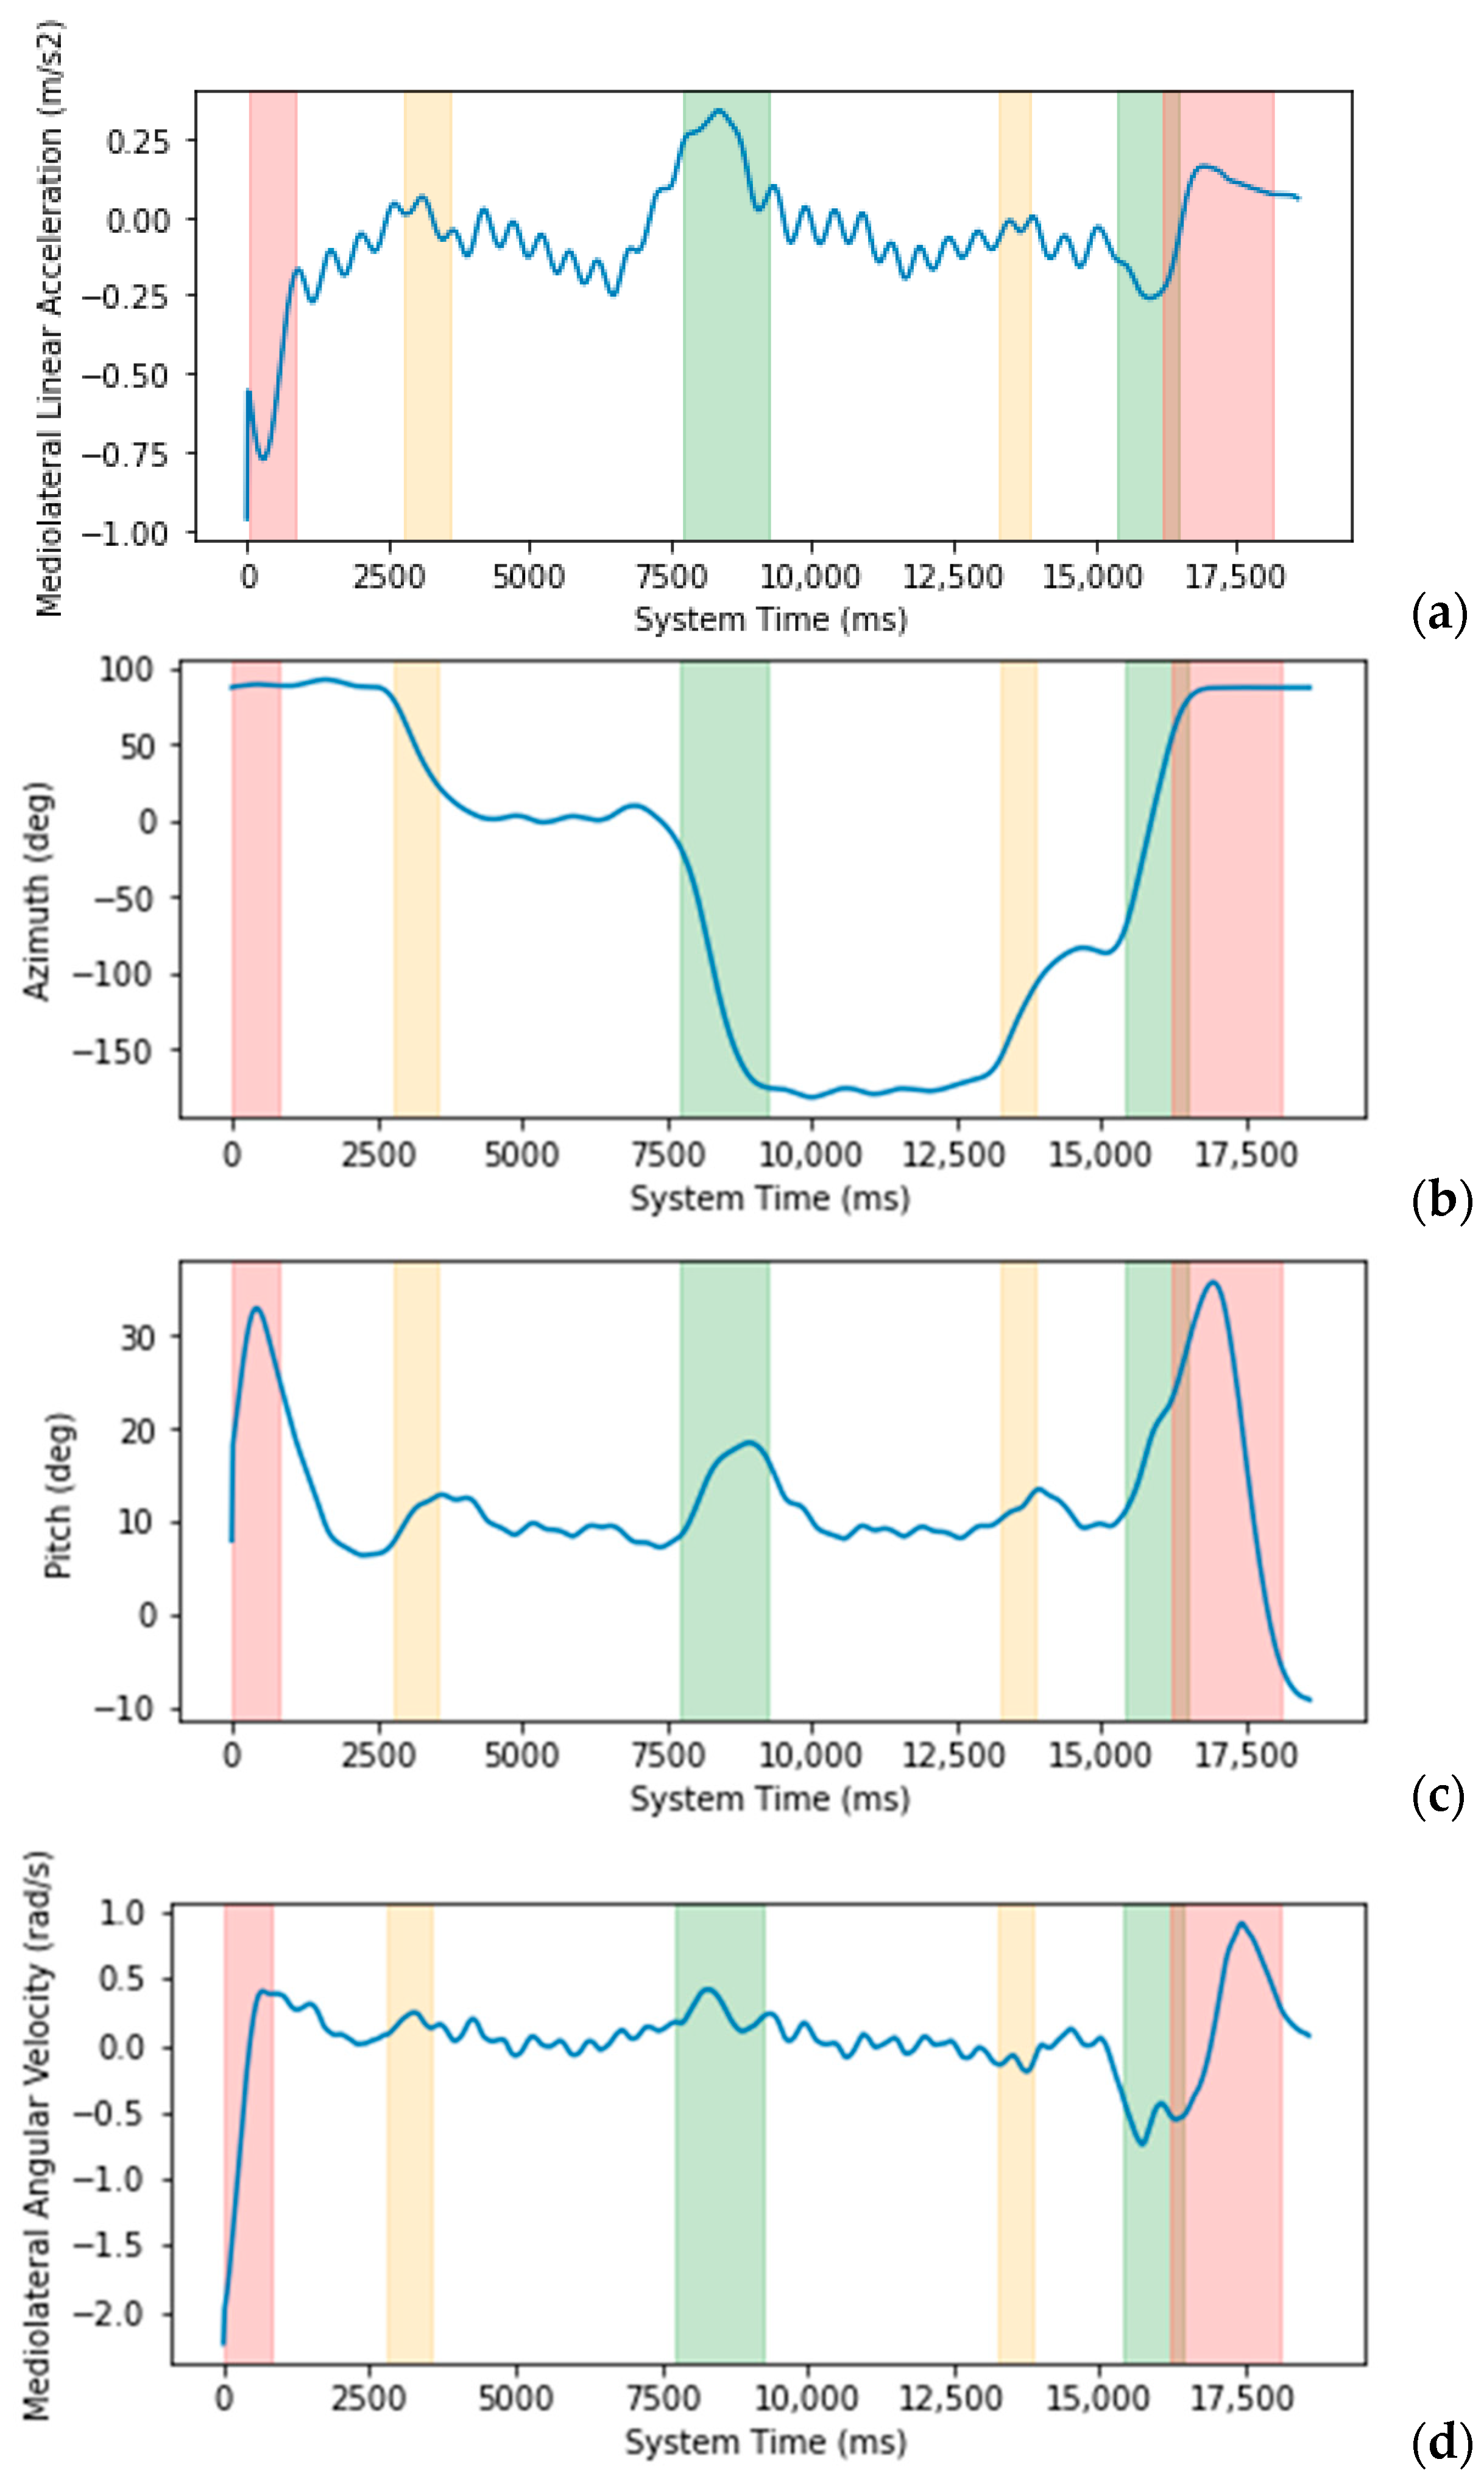
A total of 105 trials with 21 participants were classified by the algorithm. Figure 5 shows an example of the output of one trial. Table 3 shows ground truth and algorithm-identified means and standard deviations of subtasks for each participant. Table 4 shows the accuracy, specificity, and sensitivity for stand-up, sit-down, and turning subtask classification. The performance metrics were calculated using Python’s SciKitLearn library, with a 0.06 s (2 video frames) error allowance.

4. Discussion

The new threshold-based algorithm for segmenting the L Test provided excellent outcomes, demonstrating that the proposed smartphone-based approach can provide viable subtask segmentation. All accuracy and specificity results were very high for all subtasks, with over 97.1%. These results demonstrate that the algorithm can correctly identify the tasks for almost all data windows. Sensitivity, or the true positive rate, had lower results for all subtasks; however, for most tasks, the algorithm was able to correctly identify the exact timestamps that the subtasks had taken place.
The sit-down subtask had lower metrics, notably sensitivity, than the other tasks, most likely due to some participants beginning to drop their head and round their shoulders to look down at the chair before and during the turn before sitting, which may have caused the algorithm to occasionally detect some pelvis flexion and thus misclassify this movement as the start of the sit-down task. As previously mentioned in Section 2.5.2, some of this misclassification was addressed using a higher threshold for this part of the algorithm. Additionally, at the end of the turn, participants would often fidget or fall into the chair, causing them to move a bit after they finished the task. For the stand-up task, participants were more commonly completely still, not introducing variable movements into the signal and therefore having a clear distinction between the beginning and end of the task. Reversing the array (as mentioned in Table 2) minimized the effect of variable movements on sit-down task initiation identification.
The algorithm had lower performance results with participants who took longer to fully extend their torso during the stand-up task. Similarly, those who took longer turns also tended to have lower subtask identification metrics than those with shorter turn duration. Currently, the thresholds used are global thresholds based on all participants. These outliers were therefore not well labeled by the global thresholds. Future studies could investigate participant-specific thresholds, tuned to their linear walking data. This would allow the algorithm to be directly applied to different patient populations while still ensuring sufficient performance.
The current approach improved upon the results from our preliminary study [29]. The results in [29] achieved 97.9% accuracy, 98.5% specificity, and 86.1% sensitivity for stand-up; 94.6% accuracy, 96.2% specificity, and 72.1% sensitivity for sit-down; and 90.2% accuracy, 95.7% sensitivity, and 70.5% specificity for all turns [29]. The most substantial improvements occurred in sensitivity of the stand-up and turning tasks. The stand-up task obtained an increase in sensitivity of 6.2%, with the turns obtaining increases ranging from 3.8% to 11.6% [29].
A study by Abdollah V. et al. [13] produced good results for stand-up and sit-down tasks in the single-sensor TUG test; however, turns were not segmented. With a single tri-axial accelerometer mounted on a participant’s head, they obtained 95% accuracy, 100% specificity, and 90% sensitivity during the stand-up task, and 98% accuracy, 100% specificity, and 98% sensitivity with the sit-down task, using a rule-based threshold algorithm [13]. Our results surpassed these accuracy measurements and were within 1.4% of the specificity outcomes. The current algorithm also surpassed the stand-up subtask sensitivity by 7.4%, but fell short by 19.7% for the sit-down subtask. Pew C. et al. [26] also published algorithms for segmenting some parts of the L Test, which included results for walking and turning subtasks. They used a variety of machine learning algorithms, with the highest accuracy for turning being 96% with support vector machines (SVMs) [26]. The current algorithm surpasses this for all turns.
A 0.07 s error allowance is lower than the commonly used L Test approach of using a stopwatch, which has been reported to have a measurement error of 0.2 s. Yahalom et al. [25] discussed that the measurement error using a stopwatch is estimated to be the same for both stop and start times. However, with a stopwatch, this can vary between clinicians. Additionally, a human-controlled approach can also be subjective and introduce further variability in components such as when the clinician begins or ends recording (for example, before or after the patient leans back in the chair during the sit-down task), and can also be affected by distractions [25]. Therefore, even with error allowances, a more objective method of measuring these subtasks should provide more consistent measurements.

Limitations and Future Work

One limitation for the study is that the algorithm was only tested on able-bodied individuals. Future work should include validation with people who have mobility deficits since biomechanical signals can differ from able-bodied participants [34]. Additionally, creating a database of L Test segment timings could help clinicians interpret outcomes from data segmentation. The implementation of this algorithm into a smartphone app could provide clinicians with these data in an efficient manner. Further signal analysis during the L Test could also provide clinicians with additional details, and assist in future evaluations of fall risk [35].

5. Conclusions

A novel method of subtask segmentation was developed and successfully evaluated for the L Test. When compared to published segmentation results for TUG, the performance metrics of the proposed algorithm generally surpassed previous outcomes, with >97% accuracy, >98% specificity, >74% sensitivity, and >79% precision for all subtasks. The smartphone-based approach was chosen due to its accessibility and ease of use, so that the outcomes could be seamlessly integrated into a clinical setting. This technology should allow for precise and useful metrics from functional mobility tests such as the L Test and provide a basis for future AI-based outcome measures.

Author Contributions

Conceptualization, A.L.M.F., N.B. and E.D.L.; methodology, A.L.M.F.; software, A.L.M.F.; validation, A.L.M.F.; formal analysis, A.L.M.F.; investigation, A.L.M.F.; data curation, A.L.M.F.; writing—original draft preparation, A.L.M.F.; writing—review and editing, A.L.M.F., N.B. and E.D.L.; visualization, A.L.M.F.; supervision, N.B. and E.D.L.; project administration, N.B. and E.D.L.; funding acquisition, N.B. and E.D.L. All authors have read and agreed to the published version of the manuscript.

Funding

This research was funded by NSERC CREATE-READi and NSERC Discovery, grant number RGPIN-2019-04106.

Institutional Review Board Statement

This study was conducted in accordance with the Declaration of Helsinki, and approved by the University of Ottawa’s Office of Research Ethics and Integrity (H-09-22-8351) on 6 October 2022.

Informed Consent Statement

Informed consent was obtained from all subjects involved in the study. Written informed consent has been obtained from the patients to publish this paper.

Data Availability Statement

No new data were created or analyzed in this study. Data sharing is not applicable to this article.

Conflicts of Interest

The authors declare no conflicts of interest.

Appendix A

This appendix contains pseudocode for the stand-up subtask segmentation algorithm.
Figure A1. Pseudocode for the stand-up subtask. Here, i represents the starting index in the data array for the window; i2 represents the starting index in the data array for the window once the first set of thresholds have been crossed. SD is the standard deviation of the signal under investigation within a given window. MLω is mediolateral angular velocity and MLR is mediolateral rotation.
Biomedinformatics 04 00069 g0a1

References

  1. Deathe, A.B.; Miller, W.C. The L Test of Functional Mobility: Measurement Properties of a Modified Version of the Timed “Up & Go” Test Designed for People with Lower-Limb Amputations. Phys. Ther. 2005, 85, 626–635. [Google Scholar] [CrossRef] [PubMed]
  2. Nguyen, H.P.; Ayachi, F.; Lavigne-Pelletier, C.; Blamoutier, M.; Rahimi, F.; Boissy, P.; Jog, M.; Duval, C. Auto detection and segmentation of physical activities during a Timed-Up-and-Go (TUG) task in healthy older adults using multiple inertial sensors. J. Neuroeng. Rehabil. 2015, 12, 36. [Google Scholar] [CrossRef] [PubMed]
  3. Hsieh, C.-Y.; Huang, H.-Y.; Liu, K.-C.; Chen, K.-H.; Hsu, S.J.; Chan, C.-T. Automatic Subtask Segmentation Approach of the Timed Up and Go Test for Mobility Assessment System Using Wearable Sensors; IEEE: New York, NY, USA, 2019. [Google Scholar] [CrossRef]
  4. McCreath Frangakis, A.L.; Lemaire, E.D.; Baddour, N. Subtask Segmentation Methods of the Timed Up and Go Test and L Test Using Inertial Measurement Units—A Scoping Review. Information 2023, 14, 127. [Google Scholar] [CrossRef]
  5. Weiss, A.; Herman, T.; Plotnik, M.; Brozgol, M.; Maidan, I.; Giladi, N.; Gurevich, T.; Hausdorff, J.M. Can an accelerometer enhance the utility of the Timed Up & Go Test when evaluating patients with Parkinson’s disease? Med. Eng. Phys. 2010, 32, 119–125. [Google Scholar] [CrossRef]
  6. Matey-Sanz, M.; González-Pérez, A.; Casteleyn, S.; Granell, C. Instrumented Timed Up and Go Test Using Inertial Sensors from Consumer Wearable Devices. In Artificial Intelligence in Medicine; Michalowski, M., Abidi, S.S.R., Abidi, S., Eds.; Springer International Publishing: Berlin/Heidelberg, Germany, 2022; pp. 144–154. [Google Scholar] [CrossRef]
  7. De Luca, V.; Muaremi, A.; Giggins, O.M.; Walsh, L.; Clay, I. Towards fully instrumented and automated assessment of motor function tests. In Proceedings of the 2018 IEEE EMBS International Conference on Biomedical & Health Informatics (BHI), Las Vegas, NV, USA, 4–7 March 2018; pp. 83–87. [Google Scholar] [CrossRef]
  8. Hellmers, S.; Izadpanah, B.; Dasenbrock, L.; Diekmann, R.; Bauer, J.M.; Hein, A.; Fudickar, S. Towards an Automated Unsupervised Mobility Assessment for Older People Based on Inertial TUG Measurements. Sensors 2018, 18, 3310. [Google Scholar] [CrossRef] [PubMed]
  9. Vervoort, D.; Vuillerme, N.; Kosse, N.; Hortobágyi, T.; Lamoth, C.J.C. Multivariate Analyses and Classification of Inertial Sensor Data to Identify Aging Effects on the Timed-Up-and-Go Test. PLoS ONE 2016, 11, e0155984. [Google Scholar] [CrossRef]
  10. Miller Koop, M.; Ozinga, S.J.; Rosenfeldt, A.B.; Alberts, J.L. Quantifying turning behavior and gait in Parkinson’s disease using mobile technology. IBRO Rep. 2018, 5, 10–16. [Google Scholar] [CrossRef] [PubMed]
  11. Jallon, P.; Dupre, B.; Antonakios, M. A graph based method for timed up & go test qualification using inertial sensors. In Proceedings of the 2011 IEEE International Conference on Acoustics, Speech and Signal Processing (ICASSP), Prague, Czech Republic, 22–27 May 2011; pp. 689–692. [Google Scholar] [CrossRef]
  12. Hsieh, C.-Y.; Huang, H.-Y.; Liu, K.-C.; Chen, K.-H.; Hsu, S.J.-P.; Chan, C.-T. Subtask Segmentation of Timed Up and Go Test for Mobility Assessment of Perioperative Total Knee Arthroplasty. Sensors 2020, 20, 6302. [Google Scholar] [CrossRef]
  13. Abdollah, V.; Dief, T.N.; Ralston, J.; Ho, C.; Rouhani, H. Investigating the validity of a single tri-axial accelerometer mounted on the head for monitoring the activities of daily living and the timed-up and go test. Gait Posture 2021, 90, 137–140. [Google Scholar] [CrossRef]
  14. Ortega-Bastidas, P.; Aqueveque, P.; Gómez, B.; Saavedra, F.; Cano-de-la-Cuerda, R. Use of a Single Wireless IMU for the Segmentation and Automatic Analysis of Activities Performed in the 3-m Timed Up & Go Test. Sensors 2019, 19, 1647. [Google Scholar] [CrossRef]
  15. Zakaria, N.A.; Kuwae, Y.; Tamura, T.; Minato, K.; Kanaya, S. Quantitative analysis of fall risk using TUG test. Comput. Methods Biomech. Biomed. Eng. 2013, 18, 426–437. [Google Scholar] [CrossRef] [PubMed]
  16. Silva, J.; Sousa, I. Instrumented timed up and go: Fall risk assessment based on inertial wearable sensors. In Proceedings of the 2016 IEEE International Symposium on Medical Measurements and Applications (MeMeA), Benevento, Italy, 15–18 May 2016; pp. 1–6. [Google Scholar] [CrossRef]
  17. Greene Barry, R.; O’Donovan, A.; Romero-Ortuno, R.; Cogan, L.; Scanaill, C.N.; Kenny, R.A. Quantitative Falls Risk Assessment Using the Timed Up and Go Test. IEEE Trans. Biomed. Eng. 2010, 57, 2918–2926. [Google Scholar] [CrossRef] [PubMed]
  18. Milosevic, M.; Jovanov, E.; Milenković, A. Quantifying Timed-Up-and-Go test: A smartphone implementation. In Proceedings of the 2013 IEEE International Conference on Body Sensor Networks, Cambridge, MA, USA, 6–9 May 2013. [Google Scholar] [CrossRef]
  19. Negrini, S.; Serpelloni, M.; Amici, C.; Gobbo, M.; Silvestro, C.; Buraschi, R.; Borboni, A.; Crovato, D.; Lopomo, N.F. Use of Wearable Inertial Sensor in the Assessment of Timed-Up-and-Go Test: Influence of Device Placement on Temporal Variable Estimation. In Wireless Mobile Communication and Healthcare; Perego, P., Andreoni, G., Rizzo, G., Eds.; Springer International Publishing: Berlin/Heidelberg, Germany, 2017; pp. 310–317. [Google Scholar] [CrossRef]
  20. Beyea, J.; McGibbon, C.A.; Sexton, A.; Noble, J.; O’Connell, C. Convergent Validity of a Wearable Sensor System for Measuring Sub-Task Performance during the Timed Up-and-Go Test. Sensors 2017, 17, 934. [Google Scholar] [CrossRef] [PubMed]
  21. Adame, M.R.; Al-Jawad, A.; Romanovas, M.; Hobert, M.A.; Maetzler, W.; Möller, K.; Manoli, Y. TUG Test Instrumentation for Parkinson’s disease patients using Inertial Sensors and Dynamic Time Warping. Biomed. Eng./Biomed. Tech. 2012, 57, 1071–1074. [Google Scholar] [CrossRef]
  22. Witchel, H.J.; Oberndorfer, C.; Needham, R.; Healy, A.; Westling, C.E.I.; Guppy, J.H.; Bush, J.; Barth, J.; Herberz, C.; Roggen, D.; et al. Thigh-Derived Inertial Sensor Metrics to Assess the Sit-to-Stand and Stand-to-Sit Transitions in the Timed Up and Go (TUG) Task for Quantifying Mobility Impairment in Multiple Sclerosis. Front. Neurol. 2018, 9, 689–695. [Google Scholar] [CrossRef] [PubMed]
  23. Salarian, A.; Horak, F.B.; Zampieri, C.; Carlson-Kuhta, P.; Nutt, J.G.; Aminian, K. iTUG, a sensitive and reliable measure of mobility. IEEE Trans. Neural Syst. Rehabil. Eng. 2010, 18, 303–310. [Google Scholar] [CrossRef] [PubMed]
  24. Higashi, Y.; Yamakoshi, K.; Fujimoto, T.; Sekine, M.; Tamura, T. Quantitative evaluation of movement using the timed up-and-go test. IEEE Eng. Med. Biol. Mag. 2008, 27, 38–46. [Google Scholar] [CrossRef]
  25. Yahalom, G.; Yekutieli, Z.; Israeli-Korn, S.; Elincx-Benizri, S.; Livneh, V.; Fay-Karmon, T.; Rubel, Y.; Tchelet, K.; Zauberman, J.; Hassin-Baer, S. AppTUG-A Smartphone Application of Instrumented ‘Timed Up and Go’ for Neurological Disorders. EC Neurol. 2018, 10, 689–695. [Google Scholar]
  26. Pew, C.; Klute, G.K. Turn Intent Detection for Control of a Lower Limb Prosthesis. IEEE Trans. Biomed. Eng. 2018, 65, 789–796. [Google Scholar] [CrossRef]
  27. Nguyen, H.; Lebel, K.; Boissy, P.; Bogard, S.; Goubault, E.; Duval, C. Auto detection and segmentation of daily living activities during a Timed Up and Go task in people with Parkinson’s disease using multiple inertial sensors. J. Neuroeng. Rehabil. 2017, 14, 26. [Google Scholar] [CrossRef]
  28. Mellone, S.; Tacconi, C.; Chiari, L. Validity of a Smartphone-based instrumented Timed Up and Go. Gait Posture 2012, 36, 163–165. [Google Scholar] [CrossRef] [PubMed]
  29. McCreath Frangakis, A.L.; Lemaire, E.D.; Baddour, N. Subtask Segmentation of the L Test Using Smartphone Inertial Measurement Units. In Proceedings of the 2023 5th International Conference on Bio-engineering for Smart Technologies (BioSMART), Paris, France, 7–9 June 2023; pp. 1–4. [Google Scholar] [CrossRef]
  30. Capela, N.A.; Lemaire, E.D.; Baddour, N. Novel algorithm for a smartphone-based 6-minute walk test application: Algorithm, application development, and evaluation. J. Neuroeng. Rehabil. 2015, 12, 19. [Google Scholar] [CrossRef] [PubMed]
  31. Android Apps on Google Play. Available online: https://play.google.com/store/games?hl=en&gl=US (accessed on 26 March 2024).
  32. Kinovea. Available online: https://www.kinovea.org/ (accessed on 14 September 2023).
  33. Tudor-Locke, C.; Aguiar, E.J.; Han, H.; Ducharme, S.W.; Schuna, J.M.; Barreira, T.V.; Moore, C.C.; Busa, M.A.; Lim, J.; Sirard, J.R.; et al. Walking cadence (steps/min) and intensity in 21–40 year olds: CADENCE-adults. Int. J. Behav. Nutr. Phys. Act. 2019, 16, 8. [Google Scholar] [CrossRef] [PubMed]
  34. Capela, N.; Lemaire, E.; Baddour, N.; Rudolf, M.; Goljar, N.; Burger, H. Evaluation of a smartphone human activity recognition application with able-bodied and stroke participants. J. Neuroeng. Rehabil. 2016, 13, 5. [Google Scholar] [CrossRef]
  35. Juneau, P.; Baddour, N.; Burger, H.; Bavec, A.; Lemaire, E.D. Amputee Fall Risk Classification Using Machine Learning and Smartphone Sensor Data from 2-Minute and 6-Minute Walk Tests. Sensors 2022, 22, 1479. [Google Scholar] [CrossRef]
Figure 1. Route for the L test. The participant can choose the direction for 180° turns.
Biomedinformatics 04 00069 g001
Figure 2. Parametric directions used in inertial data.
Biomedinformatics 04 00069 g002
Figure 3. Participant completing an L Test trial.
Biomedinformatics 04 00069 g003
Figure 4. Example of raw data (a) and preprocessed data (b) collected by the app for mediolateral acceleration, azimuth, pitch, and vertical angular velocity signals.
Biomedinformatics 04 00069 g004
Figure 5. Examples of inertial data for an L Test trial with (a) mediolateral linear acceleration, (b) azimuth, (c) pitch, and (d) mediolateral angular velocity. Red indicates the stand-up and sit-down subtasks, orange indicates the 90° turn subtasks, and green indicates the 180° turn subtasks.
Biomedinformatics 04 00069 g005
Table 1. Participant characteristics.
Age GroupSexNumber of Participants
18–29Male3
Female9
30–39Male0
Female1
40–49Male0
Female0
50–59Male2
Female4
60–69Male1
Female1
Table 2. Subtask identification parameters.
SubtaskSignalBeginning of SearchEnd of SearchDirection of SearchMagnitude Change ThresholdStandard
Deviation Threshold
Stand-UpMLR 1
MLω 2 [2,3,6,7,8,9,11,12,13,14,15,16,17,18,19,20,21,22,23,27]
Start of data arrayEnd of data arrayStart to end of array3 SD above mean 35 SD above mean 3
or
6 SD above mean (MLR) and 3 SD above mean (MLω)
First 90° TurnAzimuth [30]One second after end of stand-upEnd of data arrayStart to end of array35°
First 180° TurnAzimuthOne second after end of first 90° turnEnd of data arrayStart to end of array35°
Second 90° TurnAzimuthOne second after end of first 180° turnEnd of data arrayStart to end of array35°
Second 180° TurnAzimuthOne second after end of second 90° turnEnd of data arrayStart to end of array35°
Sit-DownMLR 1
MLω 2
One second after end of second 90° turnEnd of data arrayEnd to beginning of array3 SD above mean 35 SD above mean 3
or
6 SD above mean (MLR) and 3 SD above mean (MLω)
1 Mediolateral rotation angle; 2 mediolateral angular velocity; 3 standard deviations and means are calculated for respective signals for each subtask (Section 2.5.2).
Table 3. Algorithm and ground truth (GT) mean and standard deviation for subtask durations for all participants.
Participant IDStand-UpGT
Stand-Up
Sit-DownGT
Sit-Down
First 90° TurnGT
First 90° Turn
First 180° TurnGT
First 180° Turn
Second 90° TurnGT
Second 90° Turn
Second 180° TurnGT
Second 180° Turn
LT_0011.08
± 0.12
0.85
± 0.08
0.61
± 0.11
1.23
± 0.44
0.74
± 0.25
0.97
± 0.08
1.04
± 0.14
1.21
± 0.14
0.57
± 0.08
0.75
± 0.07
0.71
± 0.08
0.75
± 0.11
LT_0021.47
± 0.32
0.79
± 0.44
1.54
± 0.33
1.05
± 0.52
0.71
± 0.42
0.63
± 0.34
0.89
± 0.45
1.01
± 0.51
0.53
± 0.07
0.61
± 0.30
0.78
± 0.18
0.49
± 0.35
LT_0031.15
± 0.12
0.69
± 0.11
1.6
± 0.09
1.18
± 0.19
0.57
± 0.10
0.69
± 0.29
0.79
± 0.07
1.02
± 0.16
0.52
± 0.02
0.66
± 0.17
0.68
± 0.08
0.72
± 0.13
LT_0041.03
± 0.07
1.07
± 0.15
1.25
± 0.08
1.20
± 0.09
0.60
± 0.11
0.73
± 0.08
0.94
± 0.09
1.10
± 0.07
0.53
± 0.03
0.66
± 0.11
0.82
0.04
1.01
± 0.06
LT_0051.35
± 0.48
0.85
± 0.32
0.85
± 0.28
0.74
± 0.34
0.55
± 0.02
0.73
± 0.12
0.88
± 0.03
1.08
± 0.08
0.62
± 0.13
0.87
± 0.07
0.91
± 0.13
0.69
± 0.06
LT_0061.16
± 0.10
1.03
± 0.08
0.57
± 0.15
1.19
± 0.10
0.66
± 0.09
0.95
± 0.07
1.19
± 0.11
1.42
± 0.18
0.59
± 0.08
0.81
± 0.14
1.04
± 0.12
1.02
± 0.06
LT_0071.04
± 0.05
0.89
± 0.18
1.25
± 0.29
1.32
± 0.19
0.60
± 0.08
0.78
± 0.16
0.87
± 0.10
0.98
± 0.21
0.59
± 0.08
0.59
± 0.11
0.77
± 0.12
0.85
± 0.12
LT_0081.02
± 0.03
1.06
± 0.12
0.72
± 0.14
1.43
± 0.19
0.53
± 0.04
0.94
± 0.16
1.28
± 0.24
1.41
± 0.13
0.71
± 0.13
0.88
± 0.21
0.84
± 0.17
1.07
± 0.09
LT_0091.26
± 0.15
1.01
± 0.25
1.5
± 0.14
1.19
± 0.14
0.52
± 0.05
0.70
± 0.08
0.82
± 0.10
1.07
± 0.05
0.5
± 0.00
0.78
± 0.16
0.81
± 0.04
0.96
± 0.05
LT_0101.03
± 0.06
0.82
± 0.11
1.16
± 0.43
1.16
± 0.18
0.66
± 0.7
0.84
± 0.09
0.86
± 0.07
1.15
± 0.07
0.64
± 0.07
0.87
± 0.09
0.83
± 0.04
1.09
± 0.09
LT_0111.00
± 0.00
0.91
± 0.07
0.85
± 0.15
1.14
± 0.19
0.75
± 0.12
1.06
± 0.08
0.94
± 0.14
1.51
± 0.20
0.63
± 0.07
0.89
± 0.10
0.97
± 0.12
1.23
± 0.09
LT_0121.08
± 0.09
0.87
± 0.09
0.96
± 0.41
1.31
± 0.20
0.59
± 0.07
0.62
± 0.05
0.93
± 0.10
1.05
± 0.09
0.78
± 0.16
0.81
± 0.10
0.78
± 0.12
1.01
± 0.13
LT_0131.26
± 0.23
0.96
± 0.14
1.55
± 0.38
1.42
± 0.12
0.61
± 0.08
0.74
± 0.12
1.05
± 0.11
1.11
± 0.10
0.73
± 0.11
0.93
± 0.18
0.78
± 0.11
0.90
± 0.08
LT_0141.25
± 0.06
0.78
± 0.06
1.54
± 0.18
1.14
± 0.09
0.6
± 0.12
0.71
± 0.12
0.99
± 0.11
1.11
± 0.05
0.62
± 0.10
0.82
± 0.10
0.95
± 0.15
1.08
± 0.09
LT_0151.24
± 0.14
0.98
± 0.04
1.53
± 0.13
1.43
± 0.24
0.70
± 0.04
0.86
± 0.17
1.05
± 0.18
1.44
± 0.04
0.72
± 0.03
1.12
± 0.04
0.99
± 0.03
1.30
± 0.03
LT_0161.65
± 0.42
1.55
± 0.36
1.48
± 0.36
1.76
± 0.24
0.84
± 0.15
0.93
± 0.10
1.15
± 0.21
1.39
± 0.26
0.90
± 0.19
0.99
± 0.12
1.16
± 0.21
1.47
± 0.27
LT_0171.31
± 0.16
0.91
± 0.12
1.71
± 0.08
1.43
± 0.08
0.74
± 0.06
0.87
± 0.12
1.03
± 0.10
1.26
± 0.04
0.74
± 0.06
0.80
± 0.17
1.03
± 0.10
1.17
± 0.13
LT_0181.12
± 0.10
0.74
± 0.36
1.44
± 0.29
1.07
± 0.53
0.63
± 0.10
0.77
± 0.38
0.71
± 0.36
0.97
± 0.48
0.68
± 0.04
0.88
± 0.43
0.72
± 0.35
1.06
± 0.52
LT_0191.13
± 0.05
0.96
± 0.07
1.48
± 0.33
1.45
± 0.05
0.60
± 0.06
0.80
± 0.07
1.40
± 0.10
1.50
± 0.13
0.71
± 0.09
0.97
± 0.11
0.98
± 0.06
1.29
± 0.10
LT_0201.04
± 0.06
0.88
± 0.05
1.50
± 0.20
1.25
± 0.16
0.50
± 0.00
0.66
± 0.12
1.14
± 0.39
1.47
± 0.23
0.56
± 0.08
0.67
± 0.05
0.65
± 0.03
0.80
± 0.07
LT_0211.05
± 0.05
0.82
± 0.08
0.83
± 0.23
1.08
± 0.07
0.64
± 0.12
0.95
± 0.09
0.95
± 0.11
1.31
± 0.12
0.66
± 0.13
0.88
± 0.15
0.85
± 0.03
0.98
± 0.07
Table 4. Performance metrics for subtasks. Duration difference is the mean absolute difference and standard deviation between the algorithm time and the ground truth time across all participants and trials.
MetricStand-UpSit-DownFirst 90°
Turn
First 180°
Turn
Second 90° TurnSecond 180° Turn
Accuracy (%)98.597.198.798.798.998.8
Specificity (%)98.698.699.899.999.999.8
Sensitivity (%)97.478.374.381.777.182.1
Disclaimer/Publisher’s Note: The statements, opinions and data contained in all publications are solely those of the individual author(s) and contributor(s) and not of MDPI and/or the editor(s). MDPI and/or the editor(s) disclaim responsibility for any injury to people or property resulting from any ideas, methods, instructions or products referred to in the content.