Article

Cancer Classification from Gene Expression Using Ensemble Learning with an Influential Feature Selection Technique

1
Division of Mechanical Science and Technology, Graduate School of Science and Technology, Gunma University, Kiryu 376-8515, Japan
2
Department of Computer Science and Engineering, Khulna University of Engineering and Technology, Khulna 9203, Bangladesh
*
Author to whom correspondence should be addressed.
BioMedInformatics 2024, 4(2), 1275-1288; https://doi.org/10.3390/biomedinformatics4020070
Submission received: 1 March 2024 / Revised: 28 March 2024 / Accepted: 8 May 2024 / Published: 13 May 2024
(This article belongs to the Special Issue Feature Papers in Applied Biomedical Data Science)

Abstract

:
Uncontrolled abnormal cell growth, known as cancer, may lead to tumors, immune system deterioration, and other fatal disability. Early cancer identification makes cancer treatment easier and increases the recovery rate, resulting in less mortality. Gene expression data play a crucial role in cancer classification at an early stage. Accurate cancer classification is a complex and challenging task due to the high-dimensional nature of the gene expression data relative to the small sample size. This research proposes using a dimensionality-reduction technique to address this limitation. Specifically, the mutual information (MI) technique is first utilized to select influential biomarker genes. Next, an ensemble learning model is applied to the reduced dataset using only the most influential features (genes) to develop an effective cancer classification model. The bagging method, where the base classifiers are Multilayer Perceptrons (MLPs), is chosen as an ensemble technique. The proposed cancer classification model, the MI-Bagging method, is applied to several benchmark gene expression datasets containing distinctive cancer classes. The cancer classification accuracy of the proposed model is compared with the relevant existing methods. The experimental results indicate that the proposed model outperforms the existing methods, and it is effective and competent for cancer classification despite the limited size of gene expression data with high dimensionality. The highest accuracy achieved by the proposed method demonstrates that the proposed emerging gene-expression-based cancer classifier has the potential to help in cancer treatment and lead to a higher cancer survival rate in the future.

1. Introduction

Cancer has become one of the deadliest diseases globally, with an estimated 9.7 million deaths out of 20 million new cancer cases in 2022, according to the World Health Organization (WHO) [1]. Cancer results from the unconstrained growth of some anomalous cells, which divide and disperse to other cells, increasing malignant offspring cells. Lung, prostate, colorectal, and stomach cancers are the most common types of cancer that occur in men. Additionally, colorectal, lung, cervical, and breast cancers are the most common types among females. Acute lymphoblastic leukemia and brain tumors are the most common cancers among children, except in Africa [2]. Cancer is prevalent worldwide and affects social life economically, in addition to affecting individuals. Public and government budgets in the health sector are being threatened due to the high cost of medical treatments. Premature deaths reduce the social workforce. Proper cancer identification at an early stage can restrain the death rate and retain human resources at working ages. Manual diagnosis systems may lead to errors due to insufficient relevant resources. DNA microarray-based gene expression profiling can be a promising technique for detecting cancer at an early stage. Early cancer detection raises the chance of survival, reducing personal, societal, and economic costs.
The gene expression datasets in the literature typically have a small number of samples. In contrast, the number of genes (the dimension of the features) per sample is significantly large, causing an overfitting concern in the respective machine learning model as it may perform worse on the test data after training. Therefore, the gene selection technique must be applied to the gene expression datasets [3]. AbdElNabi et al. [4] also mentioned the overfitting problem caused by the high dimensionality of genes compared to the instance size. Therefore, the gain of information was employed to reduce the number of irrelevant genes and eliminate the high dimensionality problem. Dimensionality reduction is also applicable for reducing computing time, constructing a robust model, and increasing the model’s prediction quality [5].
This paper introduces an effective cancer classification method based on a machine learning technique using high-dimensional gene expression data that can be suitable for precise cancer detection and contribute to reducing the above-mentioned impacts on society and individuals. Specifically, an ensemble learning technique using feature dimensionality reduction in gene expression data is utilized for precise classification. To cope with the high dimensionality of genes in the limited training data, which may influence the accuracy of any machine learning model, the mutual information (MI) algorithm is used to select the most significant genes instead of using all of them. With the chosen influential genes, an ensemble technique comprising the bagging method, where base classifiers are Multilayer Perceptrons (MLPs), is applied, and performance metrics for various datasets are evaluated and compared.

1.1. Literature Review and Problem Statement

Cancer is one of the most severe diseases leading to death worldwide. Approximately 1 in 5 people have cancer at some point in their lives, and 1 in 9 men and 1 in 12 women pass away from cancer [1]. It is found that approximately 17.6% of women, as well as 26.3% of men, develop cancer before the age of 75 years old in Japan [6]. A total of 380,500 cancer deaths were projected in 2022, of which 219,300 were male and 161,200 were female in Japan, respectively [7]. Figure 1 represents the cancer death statistics of males and females in Japan in 2021 based on the types of cancer.
The recovery of a person depends on how early the disease is detected. Early detection lessens the chances of death. Additionally, cancer treatment at the initial stage is much simpler than in its outbursts. The traditional investigation includes the physical investigation of the infected parts. Such physical medical investigations threaten the health of the examiner with infection, radiation, and so on. The results of ultrasonography depend on the quality of the images, which several factors can impact. On the contrary, gene expression data collected from DNA microarrays can effectively solve these issues [4].
Several techniques for cancer classification using gene expression have been investigated in recent years. Gene selection and accuracy prediction on chosen genes were two crucial criteria utilized by Salem et al. [8] for the performance evaluation of their suggested approach. Information gain was employed for feature selection, followed by a genetic algorithm for feature reduction and Genetic Programming for categorizing cancer types. Seven cancer gene expression datasets were considered to verify the suggested framework. The Modified K-Nearest Neighbor approach described in [9] was trained on derived features via information gain using microarray data. Yeganeh et al. [10] examined the problem of ovarian cancer with selected genes. They experimented with five machine learning models, named Random Forest (RF), Generalized Linear Model (GLM), K-Nearest Neighbor (KNN), Support Vector Machine (SVM), and Decision Tree (CART). The Random Forest classifier outperformed the other classifiers with 89% accuracy.
Dey et al. [11] classified leukemia cancer into acute myeloid leukemia (AML) and acute lymphocytic leukemia (ALL). Principal component analysis (PCA) was used for dimension reduction, and XGBoost, Random Forest, and Artificial Neural Networks (ANNs) were implemented next. XGBoost and ANN became the victorious classifiers, obtaining the same accuracy of 92.3%. Akhand et al. [12] used minimum Redundancy Maximum Relevance (mRMR) as a feature selection technique and then employed ANN on four benchmark datasets for cancer classification. Souza et al. [5] attempted to compare and contrast two reduction methods—attribute selection and principal component analysis—to provide the most comprehensive comparison while analyzing gene expression datasets.
Data collected from the Mendeley data repository were analyzed for five different types of cancer in [13]. They showed the implementation of eight deep-learning models for cancer classification. CNN obtained the best outcomes among them all. Another finding was that a 70–30 split produced the best classifier performance. Erkal et al. [14] selected 137 prominent features out of 7129 genes and then used several machine learning classifiers. The Multilayer Perceptron performed the best, acquiring an accuracy of 97.61%, while the J48 method had the lowest accuracy at 73% for multi-class brain cancer classification. Almutairi et al. [15] classified breast cancer using three datasets—the WBCD, WDBC, and WPBC datasets—collected from the UCI repository. Each dataset consisted of two classes: benign or cancer. The gorilla troop optimization (GTO) method was applied as a feature selection technique. The classification was performed using Deep Q-learning (DQL), which is based on deep reinforcement learning, and the anticipated result was explained using LIME. Their proposed model achieved >98.50% accuracy for each of the datasets.
Mallick et al. [16] designed a five-layer DNN model to classify acute lymphocyte leukemia (ALL) and acute myelocytic leukemia (AML). They compared their model with other traditional machine learning models: SVM, KNN, and Naive Bayes. Notably, they managed to gain 98.2% accuracy, 97.9% specificity, and 96.59% sensitivity, which was better than the compared model’s performance. Joshi et al. [17] applied a deep learning approach to classify brain tumors with the help of gene expression data. An accuracy of 98.7% was obtained through the introduction of PSCS with deep learning.
In the above research, the developed models showed promising results in cancer detection using advanced non-contact-based examination techniques using various machine learning approaches. However, there are still opportunities to improve the classification by taking accuracy to the maximum level. Accurate cancer identification is expected to reduce mortality and personal, societal, and economic costs. Therefore, this study proposes a more effective cancer classification method using a machine learning model for cancer detection with higher accuracy. In the proposed method, an ensemble learning technique through dimensionality reduction using only selected gene expression data is utilized for precise classification after selecting the influential genes using the mutual information (MI) algorithm.

1.2. Contributions

The following are the key contributions of this work:
  • We have reduced the feature dimension from the gene expression dataset and retrieved the most significant and relevant features used for cancer classification by applying the mutual information (MI) algorithm.
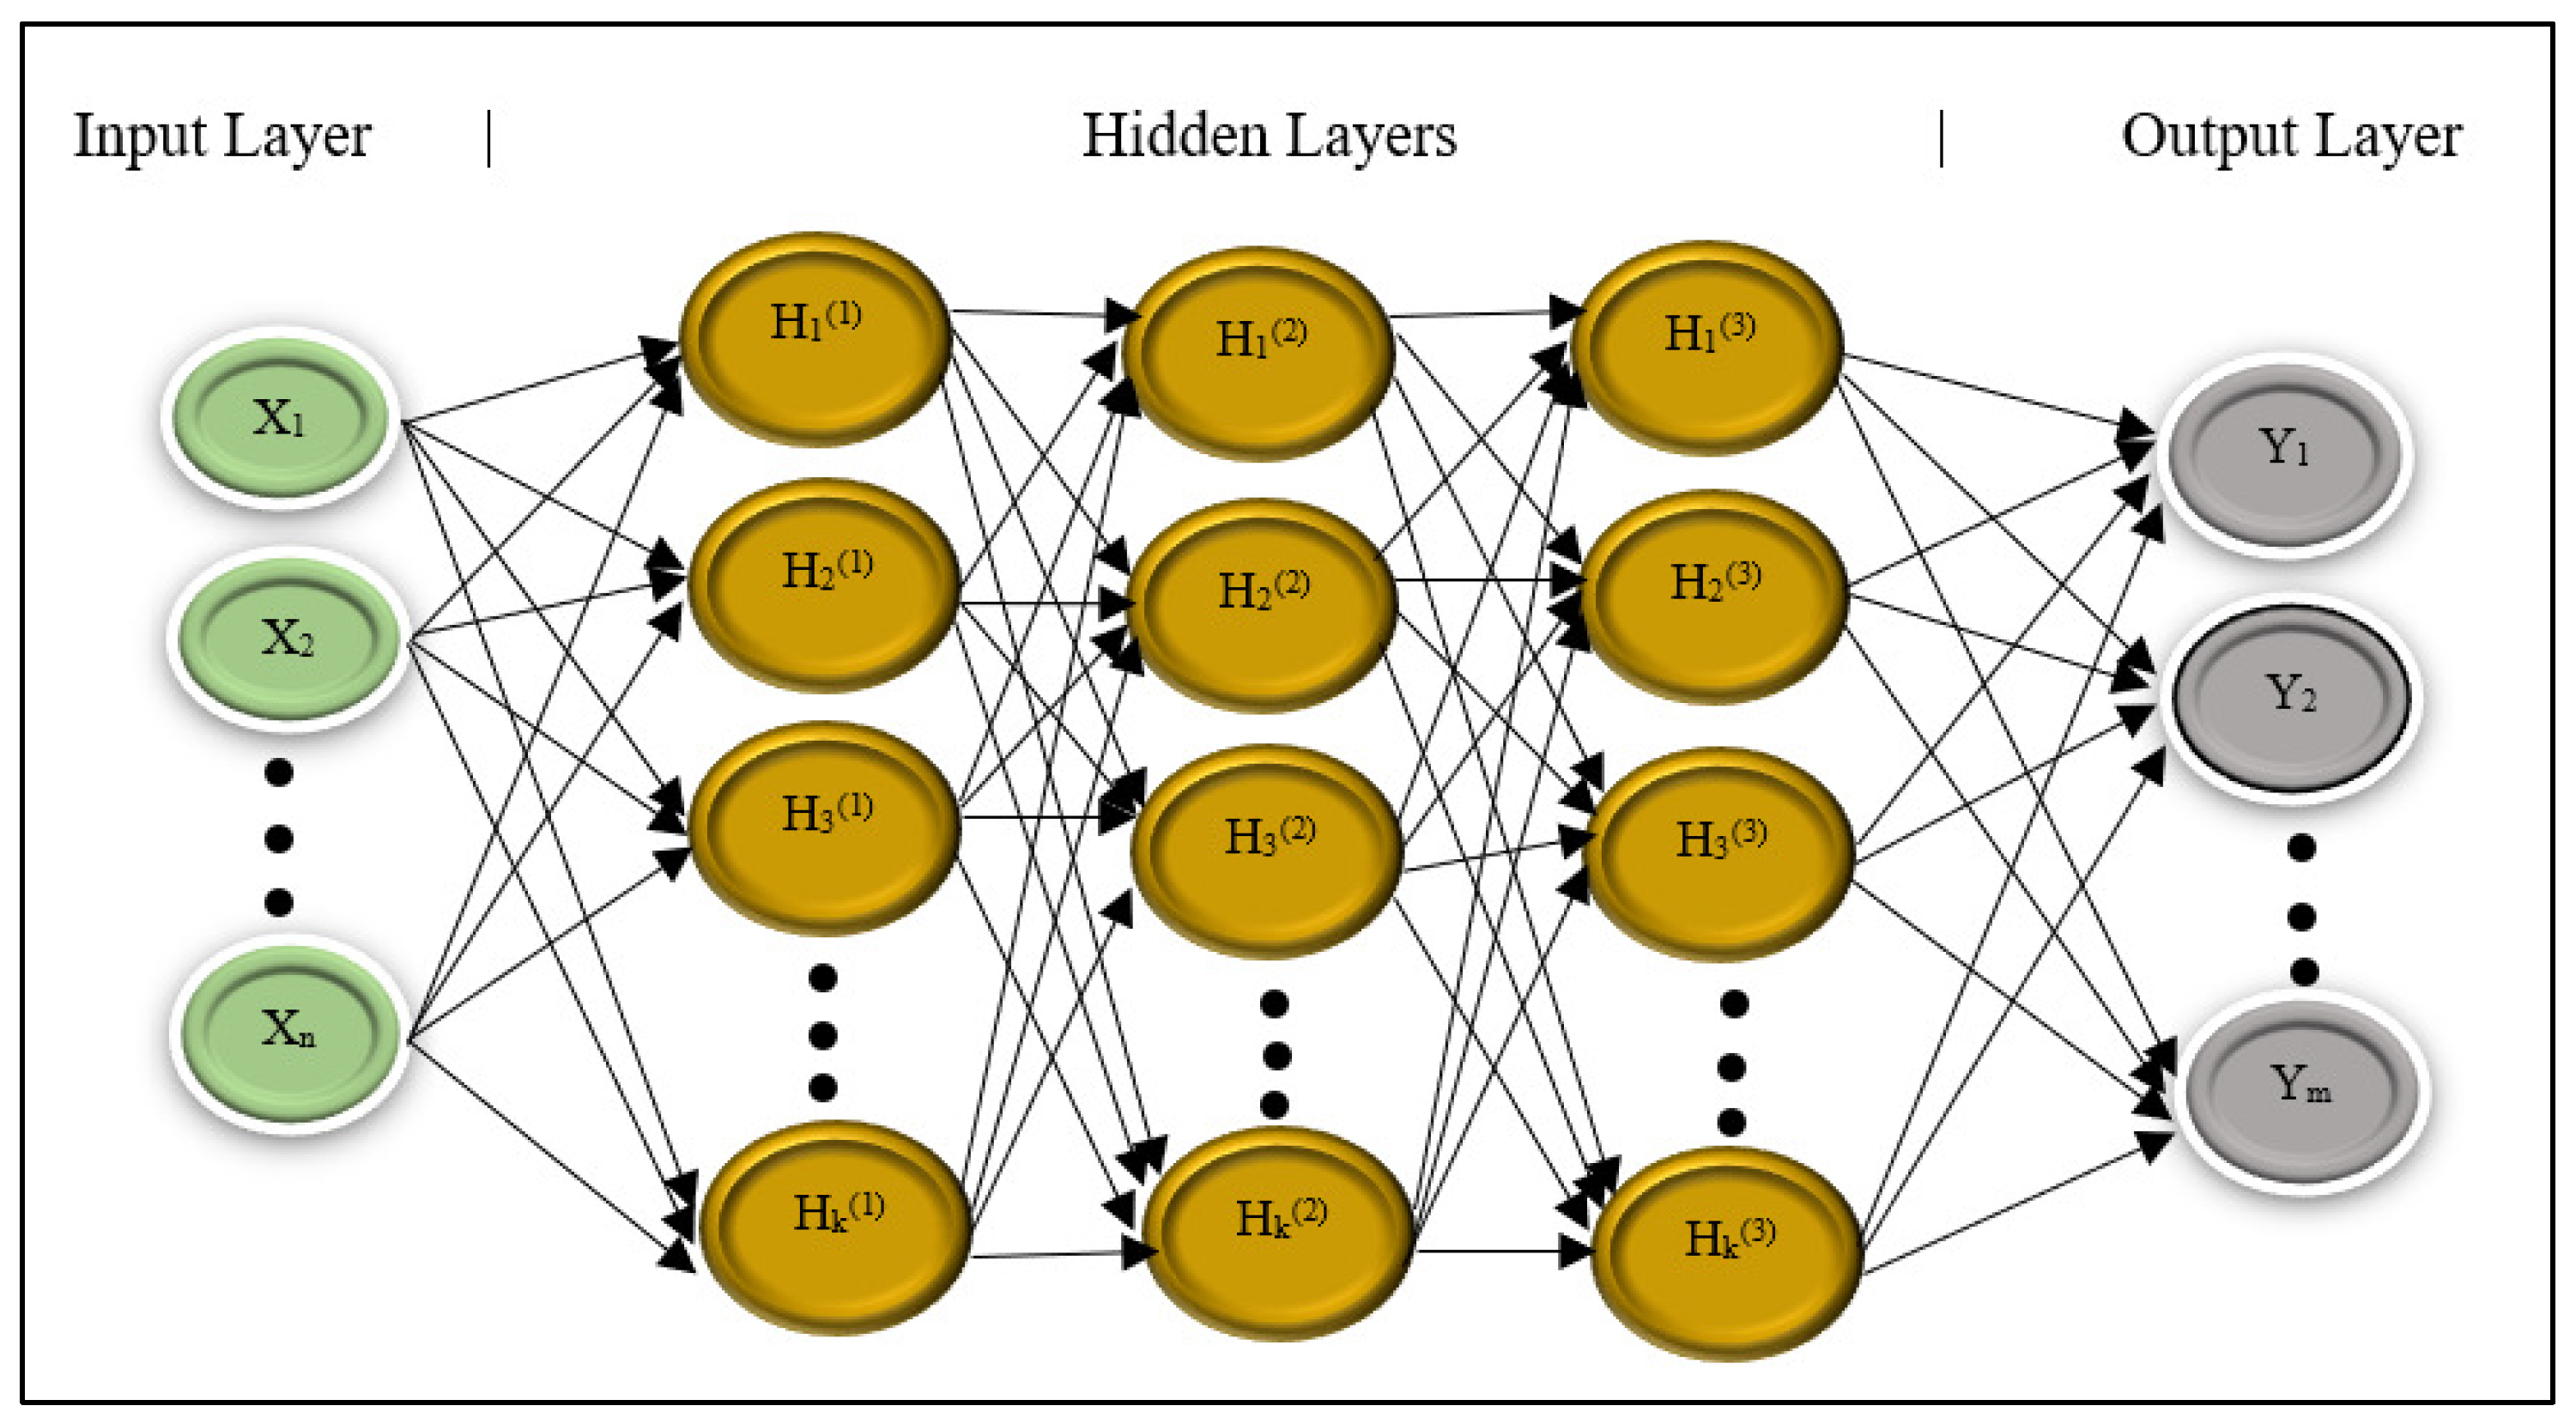
  • We have applied the bagging method as an ensemble technique, where a Multilayer Perceptron (MLP) is used as the base learner. The MLP is implemented with three hidden layers, where the input and output layer nodes are chosen to match the selected features and the number of cancer classes, respectively.
  • We have assessed the efficacy of our proposed model, MI-Bagging, which achieves higher accuracy for each of the five benchmark gene expression datasets to classify cancers of various types.
The rest of the paper is structured as follows. Section 2 explains the system architecture and describes the feature selection technique and applied classifier. The experimental settings are discussed in Section 3, while Section 4 presents the detailed performance evaluation of the proposed model by providing a comparison with other existing works, followed by a discussion. Finally, the paper is concluded in Section 5.

2. Materials and Methods

The primary steps for developing the suggested MI-Bagging method for cancer classification using gene expression are dataset collection, data pre-processing, gene selection by MI, and finally, classification with bagging, where the base classifier is selected as MLP. Figure 2 depicts the processing steps of the suggested MI-Bagging method, and each step is briefly described next.

2.1. Data Collection

Five benchmark datasets (DSs) were collected for diverse cancer classifications. The leukemia cancer dataset (DS 1) and brain cancer dataset (DS 2) were collected from the studies [18,19], respectively. A dataset (DS 3) including five types of cancer and a dataset (DS 4) including eleven types of cancer, were derived from [20,21], respectively. The last dataset (DS 5), representing ovarian cancer GSE8841, was obtained from [22]. The DS 1 dataset comprises two classes of leukemia cancer: acute lymphoblastic leukemia (ALL) and acute myeloid leukemia (AML). The DS 2 dataset is the brain cancer dataset consisting of five classes—ependymoma, glioblastoma, medulloblastoma, pilocytic astrocytoma, and normal (i.e., no cancer)—where the first four are malignant brain tumors. The DS 3 dataset represents the following five cancer types: breast invasive carcinoma (BRCA), kidney renal clear cell carcinoma (KIRC), lung adenocarcinoma (LUAD), prostate adenocarcinoma (PRAD), and colon adenocarcinoma (COAD). The DS 4 dataset has eleven cancer types represented as numerical values. The DS 5 dataset represents four types of ovarian cancers: serous, mucinous, endometrioid, and clear cell. Each of the datasets (DS 1 to DS 5) consists of thousands of features (genes) relative to a small sample size, which is depicted in Table 1.
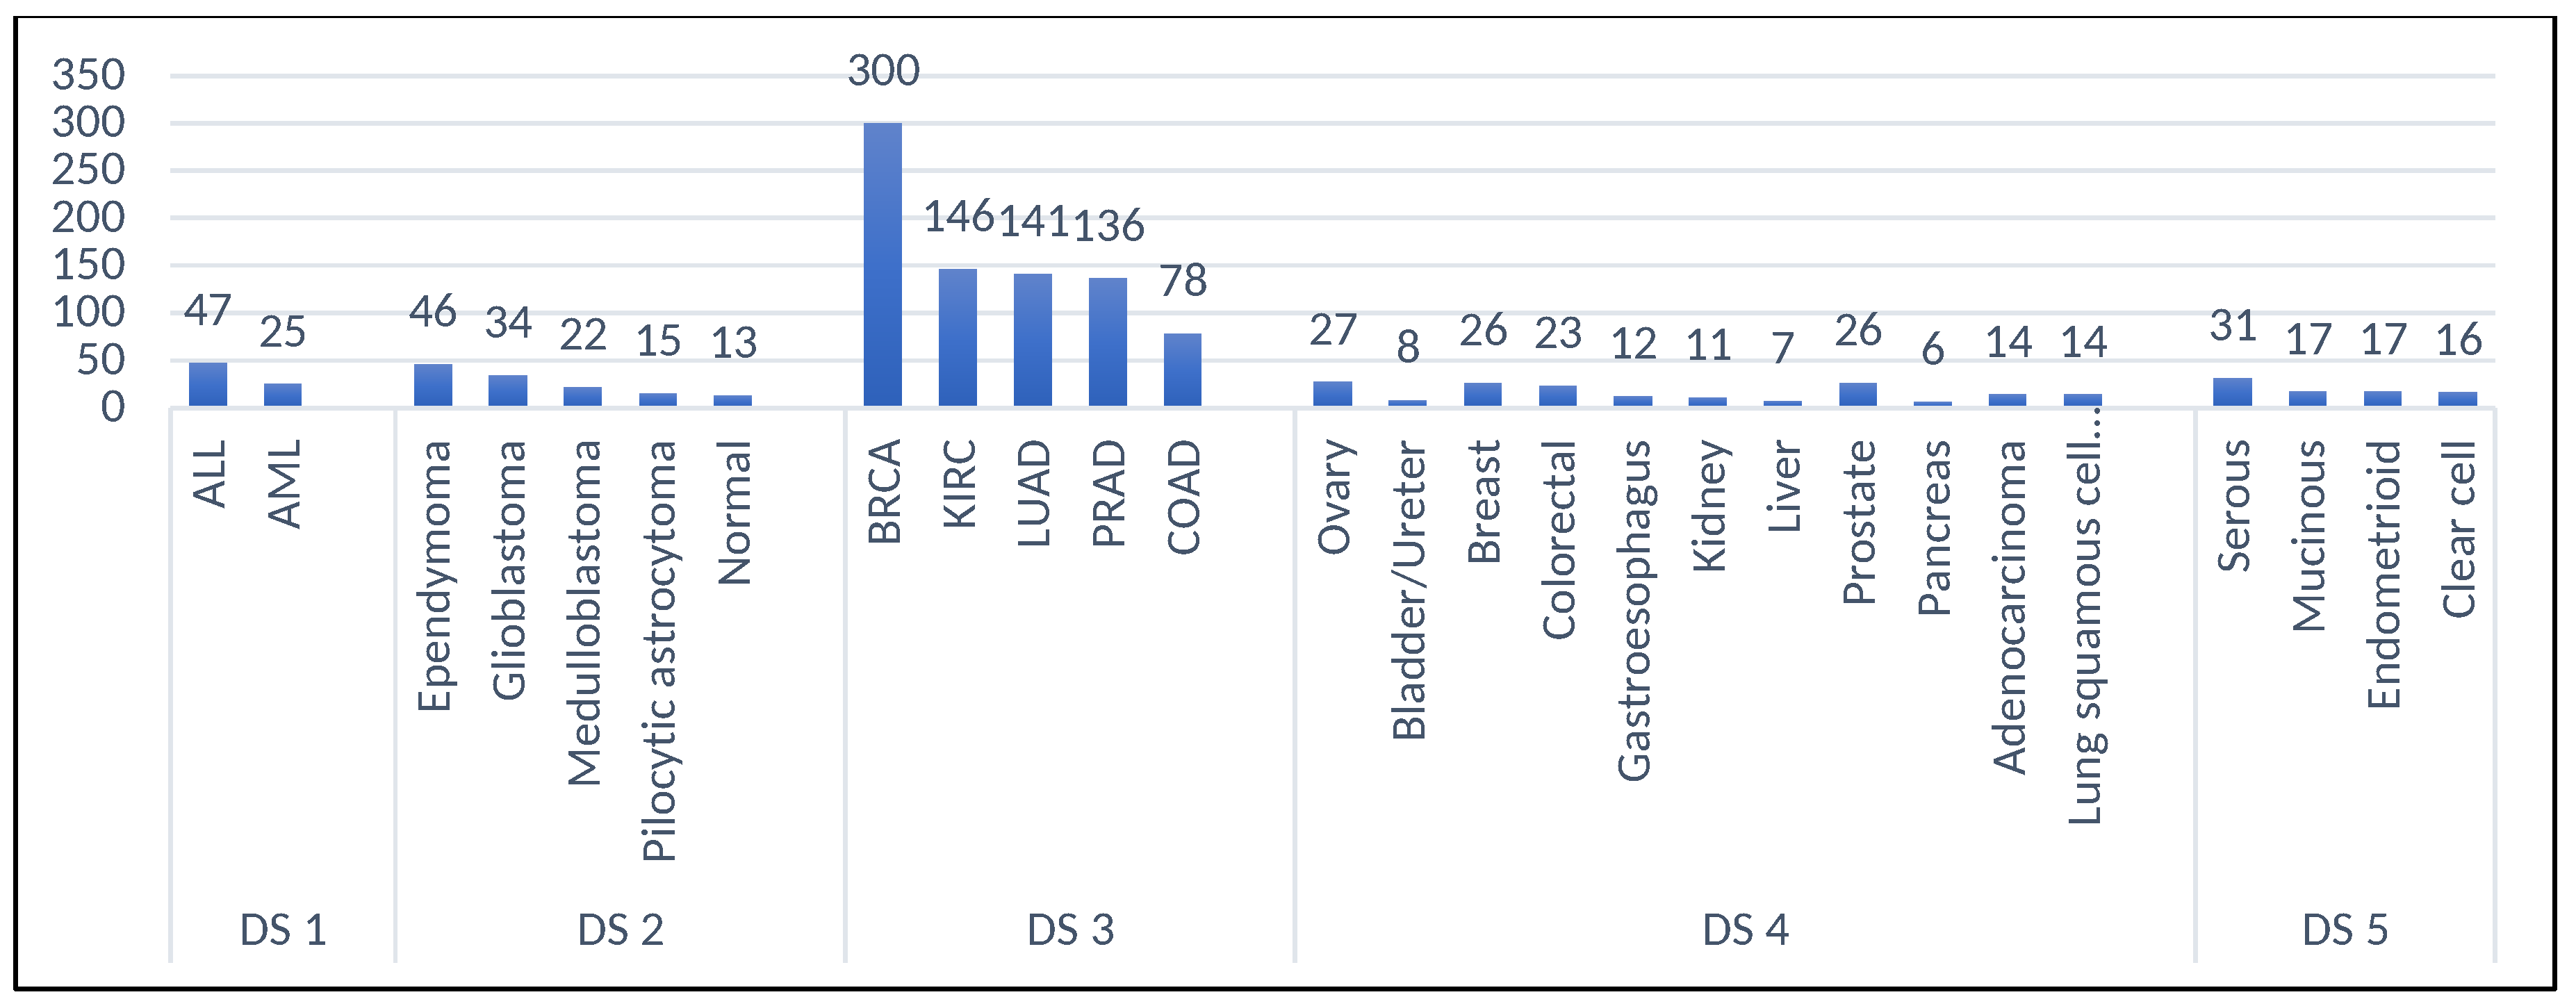
Every dataset has several class labels, with diverse sample sizes for each class. To better understand these datasets, comparative details of the sample and class sizes are provided in Figure 3. The cancer type BRCA in DS 3 has as many as 300 samples, whereas there are only 6 samples of Pancreas cancer in DS 4. Such huge variations depict the challenge of developing an effective cancer classifier.

2.2. Data Preprocessing

The selected datasets need to be processed suitably first before feeding them to a machine learning model. In the preprocessing stage, several typical steps are followed, as depicted in Figure 4, which are also briefly described here. As the missing values in a dataset can cause bias or unexpected results, it is necessary to check for missing values in these datasets and take appropriate measures. Several techniques can handle missing values in the corresponding dataset, including removing rows or columns with missing values, replacing missing values with mean, median, or mode, imputing missing values with KNN Imputer, and imputing missing values with Iterative Imputer. We have found no missing data in these well-prepared datasets, and such a data-missing handling issue is kept beyond the scope of this current study. Next, an oversampling technique for the minority class, called the Synthetic Minority Over-sampling TEchnique (SMOTE), is employed to generate respective synthetic samples. It is ensured that the number of samples in the minor classes equals the number of samples in the major class after this operation. Note that oversampling is employed here to overcome the problem of inadequate data samples. Therefore, classification with SMOTE operation is expected to give better results than classification without SMOTE operation. After the SMOTE operation is performed, the resulting classes and respective samples of the datasets are represented in Table 2. After that, we encode target labels with values from 0 to n 1 classes for each dataset, where n is the number of categories in the respective datasets. For convenience in employing machine learning to extract information, categorical variables are altered into numerical form via label encoding.
The pre-processed data is split into two parts with an 80–20 ratio for training the model and evaluation. Both the training and testing data are finally normalized on a scale between 0 and 1 as follows:
X norm = X X min X max X min
where X norm is the normalized feature value of the original value X with maximum and minimum values of X max and X min , respectively.

2.3. Feature Selection

DNA microarrays, which measure gene expression levels in aberrant and healthy tissues, can be used to track an organism’s gene activity. Technically, fluorescence intensity (fluorescently labeled cDNA molecules), the reflection of the expression or activity levels of the associated gene, is measured using microarrays. Gene expression profiles, which show simultaneous changes in the expression of numerous genes, can be created using the information gathered from microarrays [23]. The quantitative measure of a gene’s activity in a particular cell or tissue is known as its gene expression value, also called a feature in the context of a machine learning classifier model. However, a microarray gene expression profile usually has thousands of genes; i.e., all are measured in each sample and stored in the respective datasets. The gene expression dataset has a small number of samples compared to thousands of genes or features. However, some genes might be irrelevant concerning cancer classification and can be filtered out effectively before training a machine learning model. The mutual information (MI) technique has been employed in the proposed method to determine the significant features or genes, particularly in this study. The MI algorithm provides a non-negative value determining the mutual dependence between a pair of variables. A value of zero indicates that two variables are independent of each other. In the context of cancer classification, it measures how much a feature contributes to correctly predicting the target label. Higher mutual information between independent and dependent variables means the target label has a higher mutual dependence over that feature. The mutual information between two random variables, X and Y, is stated as follows:
I ( X ; Y ) = H ( X ) H ( X | Y )
where I ( X ; Y ) indicates the mutual information between X and Y, and H ( X ) and H ( X | Y ) are the entropy for X and the conditional entropy for X with given Y, respectively.
The MI technique ranks the features according to their relevance to the outcome. From the given rank of the F features of a dataset, the most significant K number of user-defined genes is selected. Figure 5 illustrates that from the ranked features 1 to F, only 1 to K , ( K < F ) features are taken for N samples of the dataset. Note that the selected genes are identical for training and testing sets.
The feature selection may be sensitive to input parameterization. Hence, the dependence between a feature and target class is determined through the feature score using MI. A high feature score indicates that the corresponding feature is highly correlated with the output class. Feature scores for individual features are calculated through MI and sorted in descending order. A minimum number of features with relatively higher feature scores are selected as prominent features to achieve the best accuracy through the trial and error method. Since there are thousands of features for each dataset, we have not included their individual scores in the paper for brevity.

2.4. Ensemble Classifier

Any machine learning model can be a weak classifier (i.e., it misclassifies data at a high rate) unless it can be trained well using a balanced dataset with large sample sizes with highly correlated features. Since the cancer datasets are small, often noisy, and usually lack such perfect sample–feature correlation attributes and have small sizes, employing an ensemble classifying technique is necessary to reduce a weak classifier’s false classification rates by assembling several base classifiers. Specifically, the pivotal concept is to estimate the category of the same test sample using multiple base classifiers and combine the different estimations to make a robust classifier. This study employs a bootstrap aggregation technique called bagging as an ensemble technique that can effectively reduce the variance within a noisy dataset. Multilayer Perceptron (MLP) is selected as the base classifier for this technique. MLP is an example of a feedforward artificial neural network comprising several layers of artificial neurons, or perceptrons. An input layer, one or more hidden layers, and an output layer make up the typical architecture of MLP. The value of nodes in a hidden layer can be tuned according to the requirements. Multiple MLP models are trained independently on bootstrap samples, and the voting strategy combines their predictions to determine the final prediction of the classification task. The steps in the entire classifier with bagging are depicted in Figure 6 and described further:
1.
Bootstrapping: Bootstrapping samples are created by row sampling with replacement. Hence, a bootstrap sample can choose the same instance multiple times. Specifically, ten bootstrap samples are created at this stage.
2.
Parallel Training: The created bootstrap samples are then trained independently in parallel using the base MLP classifier. Here, MLP consists of an input layer, three hidden layers, and an output layer. The sizes of the input and output layers are fixed based on the target datasets, i.e., the feature number and class number, respectively. The basic structure of MLP is shown in Figure 7.
3.
Voting: The target class is predicted from every weak learner, MLP. Then, hard voting, also referred to as majority voting, is applied. It counts the class that obtains the most votes.
Although we have developed a single model, MI-Bagging, we train and test it for each dataset individually. Therefore, there is no chance of overlapping features for different datasets.

3. Experimental Setup

The proposed cancer classification model is implemented in the Anaconda platform, using Python 3.11.5, along with several libraries, including pandas, numpy, seaborn, and scikit. Different K genes are chosen for datasets DS 1 to DS 5 using the trial and error method. Ten bootstrap samples are created in the bagging method. Hence, ten base classifiers constructed with MLP are used here. Each MLP structure consists of three hidden layers, each with 50 neurons, whereas the number of nodes at the input layer is the number of genes selected through MI, and the number of nodes at the output layer is the number of classes in any problem. For example, the DS 1 dataset has 100 genes selected by MI as the most significant genes and has two classes, ALL and AML. Hence, 100 neurons are set at the input layer and two at the output layer. ReLu (Rectified Linear Unit) is used as an activation function, Adam is used as the solver, and 0.001 is selected as the learning parameter. The experiment is accomplished on a PC with Windows 11 Pro and the following system configuration: 13th Gen Intel(R) Core(TM) i7-13700H @ 2.40 GHz, 32 GB of RAM, GeForce RTXTM 4060 GPU.

4. Performance Evaluation

The effectiveness of the proposed cancer classification model has been evaluated on the five diverse cancer datasets, DS 1 to DS 5, as described above, using several performance metrics, such as Accuracy, Precision, Recall, F1-score, and Confusion Matrix, which can be described using four terms: True Positive (TP), True Negative (TN), False Positive (FP), and False Negative (FN). All the performance outcomes for each dataset described henceforth are evaluated on the test data, which are kept separate and not used for training.
To better justify incorporating the MI technique in the proposed model, the proposed ensemble classifier is trained and evaluated using all the available features without considering their significance (i.e., without using the MI technique), as summarized in Table 3. Datasets DS 1 and DS 3 attain high accuracy. The accuracy is not at a very satisfactory level for the other datasets. Notably, in the case of DS 5, which has the smallest data size, the accuracy is below 90%. As the datasets have small samples compared to the features, the classifier is unable to train and test very adequately. Hence, the experiment is conducted by selecting relevant biomarker genes by employing the MI technique.
Next, the proposed model is trained by incorporating the MI technique on the same datasets, and the performance results evaluated on the test data are illustrated in Table 4. Although the same classifier is used, significant performance improvement is realized when feature significance is considered. Remarkably, in cases DS1 to DS 3, 100% accuracy is obtained. In the most challenging case, DS 5, as the number of classes is large, the accuracy increased from 87.5% to 95.83%. Moreover, with 11 cancer categories to be classified for the dataset DS 4, the accuracy is as high as 98.48%.
The cancer classification test performance of the proposed cancer classification model using the ensemble technique is further analyzed by visualizing the respective confusion matrices for each dataset. Specifically, the confusion matrices for all of the genes (without the MI technique) and the selected genes (with the MI technique) of DS 1, DS 2, DS 3, DS 4, and DS 5 are shown in Figure 8 and Figure 9, respectively. For example, dataset DS 3 has five target classes: BRCA, COAD, KIRC, LUAD, and PRAD. Figure 8 represents that 54 BRCA instances are correctly classified as BRCA in dataset DS 3. Again, for 59 COAD instances, 58 are correctly predicted as COAD, and one instance is misclassified as LUAD. Similarly, 69 KIRC instances, 60 LUAD, and 58 PRAD instances are correctly classified. However, all the instances, 54 for BRCA, 59 for COAD, 69 for KIRC, 60 for LUAD, and 58 for PRAD, are correctly classified for DS 3 using the proposed model, MI-Bagging, as shown in Figure 9. Note that these performance outcomes shown in this study are obtained from testing data kept for testing purposes from datasets DS 1 to DS 5.
Comparative analysis may better demonstrate the proposed cancer classifier’s significance. For this purpose, the classifiers proposed in the previous studies on the datasets DS 1, DS 2, DS 3, and DS 4 are investigated along with the accuracy they achieved and compared with the proposed one, as shown in Table 5. In the existing studies for DS 1, DNN was the best classifier (with 98.2% accuracy), exceeding the other four classifiers. In contrast, the proposed MI-Bagging method surpassed all five classifiers and yielded 100% accuracy on DS 1. The same result is found for DS 2, whereas for DS 3, the proposed model obtained 100% accuracy, which is the same in the literature. For DS 4, the proposed model yielded 98.48% accuracy, which is also higher than the existing one. We found no classification work in the literature using machine learning for DS 5, which contains ovarian cancer data. However, it can be concluded that our proposed model, MI-Bagging, shows the best performance in classifying gene expression datasets concerning the existing classifiers based on machine learning.

Discussion

This study proposes an approach to cancer classification from gene expression using ensemble learning with an influential feature selection technique based on the MI algorithm. The bagging ensemble method was also applied to classify gene expression datasets in bioinformatics found in the literature [26]. However, only the ensemble method is insufficient to overcome the learning hurdle imposed by the high dimensionality of features or genes besides the smaller dataset size. MLP is chosen as a classifier because it can find complex non-linear relationships between the inputs and the outputs and is effective for small datasets. Owing to achieving better performance with the selected features, the number of features might depend on the problem’s nature, especially its complexity. In this study, MI-based features are used for the bagging ensemble method. Here, features with relatively higher feature scores from MI are considered prominent in achieving the best accuracy through the trial and error method without considering conserved and variable features.
We have compared the proposed model with some basic classifiers in the literature, as shown in Table 5. Dey et al. [11] applied three simple classifiers, XGBoost, Random Forest, and ANN, after implementing PCA for dimensionality reduction on dataset DS 1. They managed to achieve 80.8% accuracy for Random Forest and 92.3% accuracy for both XGBoost and ANN. Akhand et al. [12] utilized the mRMR technique for feature selection and then applied ANN as the classifier. They gained 97.10% accuracy. Salem et al. [8] applied information gain for feature selection and a genetic algorithm for attribute reduction. After that, Genetic Programming was employed for classification. In this study, we used the mutual information (MI) technique after considering the available techniques for feature selection, resulting in 100% accuracy. The wrapper techniques for feature selection are typically criticized for their high computational demands and reliance on the used classifier. Therefore, if a different classifier is employed for prediction, there is no assurance that the solution would be optimal [27]. Features can be selected utilizing the linear discriminant analysis (LDA) approach, which provides an optimal solution with data where the means of each class are well separated and have a unimodal Gaussian distribution, which is very unlikely for gene expression data. Principal component analysis (PCA), which focuses solely on the covariance of all data, regardless of class, is generally recognized as having nothing to do with discriminative features that are optimal for classification [28]. Although PCA is a useful technique for reducing dimensionality, feature extraction in classification cannot be effectively achieved due to its unsupervised nature [29]. Therefore, the MI technique is the best choice as it assists in determining the relative potential of an attribute as a target predictor, which is proved from the outcomes shown in Table 5.
One limitation of our study is that the developed method, MI-Bagging, has been trained and tested individually for each dataset. This is because a universal cross-gene expression (i.e., with consistent class label annotation) for multiple datasets is currently unavailable. Therefore, creating a universal classifier is impossible since the dimensions, types, and sequences of genes among the datasets are not harmonious. Another limitation is the lack of adaptability of the hidden layers to the dimensions of the samples of the respective dataset. Properly adjusting the number of hidden layers can make the classifier more efficient. Moreover, the number of bootstrap samples can also be varied to check the difference in model performance. The proposed framework, MI-Bagging, can be employed for any similar high-dimensional classification task (beyond the gene-expression-based cancer classification task) by training them appropriately using the respective datasets. To this extent, MI-Bagging can be considered a generalized classifier. With the suitable combination of the MI algorithm with MLP classifiers and bagging ensemble, this study has achieved 100% accuracy for datasets DS 1, DS 2, and DS 3; 98.48% accuracy for dataset DS 4; and 95.83% accuracy for dataset DS 5.

5. Conclusions

Gene expression profiling for early cancer diagnosis is an emerging approach that is expected to contribute to the early identification and treatment of various types of cancers. This paper has proposed the mutual information algorithm for retrieving the most significant biomarker genes and then using the bagging ensemble with MLP classifiers for an effective cancer classifier. The effectiveness of the proposed MI-Bagging model on five diverse cancer datasets is evaluated and compared with the existing machine learning models. The proposed model outperforms others on all the datasets, notably achieving the highest possible accuracy for three datasets.
The existing gene expression datasets are not identical regarding the number of features and cancer classes, causing us to train and test them separately using different MLPs with respective input-output nodes corresponding to the data. Future research should address standardization of the gene expression format and collection techniques for developing a universal classifier with cross-data validation.

Author Contributions

Conceptualization, N.T., M.A.S.K. and M.A.H.A.; methodology, N.T. and M.A.S.K.; software, N.T.; validation, N.T.; formal analysis, N.T. and M.A.S.K.; investigation, N.T. and M.A.S.K.; resources, N.T.; data curation, N.T.; writing—original draft preparation, N.T.; writing—review and editing, M.A.S.K., M.A.H.A. and K.Y.; visualization, N.T.; supervision, M.A.S.K. and K.Y.; project administration, N.T.; funding acquisition, M.A.S.K. All authors have read and agreed to the published version of the manuscript.

Funding

This research received no external funding.

Institutional Review Board Statement

Not applicable.

Informed Consent Statement

Not applicable.

Data Availability Statement

The corresponding author may provide the data used in this study upon request.

Conflicts of Interest

The authors declare no conflicts of interest.

References

  1. Global Cancer Burden Growing, Amidst Mounting Need for Services. Available online: https://www.who.int/news/item/01-02-2024-global-cancer-burden-growing–amidst-mounting-need-for-services (accessed on 19 February 2024).
  2. Cancer. Available online: https://en.wikipedia.org/wiki/Cancer (accessed on 19 February 2024).
  3. Alromema, N.; Syed, A.H.; Khan, T. A hybrid machine learning approach to screen optimal predictors for the classification of primary breast tumors from gene expression microarray data. Diagnostics 2023, 13, 708. [Google Scholar] [CrossRef] [PubMed]
  4. AbdElNabi, M.L.R.; Wajeeh Jasim, M.; El-Bakry, H.M.; Taha, M.H.N.; Khalifa, N.E.M. Breast and colon cancer classification from gene expression profiles using data mining techniques. Symmetry 2020, 12, 408. [Google Scholar] [CrossRef]
  5. De Souza, J.T.; De Francisco, A.C.; De Macedo, D.C. Dimensionality reduction in gene expression data sets. IEEE Access 2019, 7, 61136–61144. [Google Scholar] [CrossRef]
  6. Japan Cancer Survivorship Country Profile. Available online: https://cancersurvivorship.eiu.com/countries/japan/ (accessed on 22 December 2023).
  7. Cancer Statistics in Japan. 2023. Available online: https://ganjoho.jp/public/qa_links/report/statistics/2023_en.html (accessed on 20 February 2024).
  8. Salem, H.; Attiya, G.; El-Fishawy, N. Classification of human cancer diseases by gene expression profiles. Appl. Soft Comput. 2017, 50, 124–134. [Google Scholar] [CrossRef]
  9. Ayyad, S.M.; Saleh, A.I.; Labib, L.M. Gene expression cancer classification using modified K-Nearest Neighbors technique. Biosystems 2019, 176, 41–51. [Google Scholar] [CrossRef] [PubMed]
  10. Yeganeh, P.N.; Mostafavi, M.T. Use of machine learning for diagnosis of cancer in ovarian tissues with a selected mRNA panel. In Proceedings of the 2018 IEEE International Conference on Bioinformatics and Biomedicine (BIBM), San Diego, CA, USA, 3–6 June 2018; pp. 2429–2434. [Google Scholar]
  11. Dey, U.K.; Islam, M.S. Genetic expression analysis to detect type of leukemia using machine learning. In Proceedings of the 2019 1st International Conference on Advances in Science, Engineering and Robotics Technology (ICASERT), Dhaka, Bangladesh, 3–5 May 2019; IEEE: Piscataway, NJ, USA, 2020; pp. 1–6. [Google Scholar]
  12. Akhand, M.A.H.; Miah, M.A.; Kabir, M.H.; Rahman, M.M.H. Cancer Classification from DNA Microarray Data using mRMR and Artificial Neural Network. Int. J. Adv. Comput. Sci. Appl. 2019, 10, 106–111. [Google Scholar] [CrossRef]
  13. Rukhsar, L.; Bangyal, W.H.; Ali Khan, M.S.; Ag Ibrahim, A.A.; Nisar, K.; Rawat, D.B. Analyzing RNA-seq gene expression data using deep learning approaches for cancer classification. Appl. Sci. 2022, 12, 1850. [Google Scholar] [CrossRef]
  14. Erkal, B.; Başak, S.; Çiloğlu, A.; Şener, D.D. Multiclass classification of brain cancer with machine learning algorithms. In Proceedings of the 2020 Medical Technologies Congress (TIPTEKNO), Antalya, Turkey, 19–20 November 2020; IEEE: Piscataway, NJ, USA, 2020; pp. 1–4. [Google Scholar]
  15. Almutairi, S.; Manimurugan, S.; Kim, B.G.; Aborokbah, M.M.; Narmatha, C. Breast cancer classification using Deep Q Learning (DQL) and gorilla troops optimization (GTO). Appl. Soft Comput. 2023, 142, 110292. [Google Scholar] [CrossRef]
  16. Mallick, P.K.; Mohapatra, S.K.; Chae, G.S.; Mohanty, M.N. Convergent learning–based model for leukemia classification from gene expression. Pers. Ubiquitous Comput. 2023, 27, 1103–1110. [Google Scholar] [CrossRef] [PubMed]
  17. Joshi, A.A.; Aziz, R.M. Deep learning approach for brain tumor classification using metaheuristic optimization with gene expression data. Int. J. Imaging Syst. Technol. 2023, 34, e23007. [Google Scholar] [CrossRef]
  18. Leukemia Data. Available online: https://hastie.su.domains/CASI_files/DATA/leukemia.html (accessed on 9 January 2024).
  19. Feltes, B.C.; Chandelier, E.B.; Grisci, B.I.; Dorn, M. CuMiDa: An Extensively Curated Microarray Database for Benchmarking and Testing of Machine Learning Approaches in Cancer Research. J. Comput. Biol. 2019, 26, 376–386. [Google Scholar] [CrossRef] [PubMed]
  20. Srividya-Sundaravadivelu/Cancer-Classification-Using-Machine-Learning. Available online: https://github.com/srividya-sundaravadivelu/Cancer-Classification-Using-Machine-Learning (accessed on 7 January 2024).
  21. Simonorozcoarias/ML_DL_microArrays. Available online: https://github.com/simonorozcoarias/ML_DL_microArrays/blob/master/data11tumors2.csv (accessed on 9 January 2024).
  22. Sayers, E.W.; Bolton, E.E.; Brister, J.R.; Canese, K.; Chan, J.; Comeau, D.C.; Connor, R.; Funk, K.; Kelly, C.; Kim, S.; et al. Database resources of the national center for biotechnology information. Nucleic Acids Res. 2022, 50, D20. [Google Scholar] [CrossRef] [PubMed]
  23. Khalsan, M.; Machado, L.R.; Al-Shamery, E.S.; Ajit, S.; Anthony, K.; Mu, M.; Agyeman, M.O. A survey of machine learning approaches applied to gene expression analysis for cancer prediction. IEEE Access 2022, 10, 27522–27534. [Google Scholar] [CrossRef]
  24. Wei, Y.; Gao, M.; Xiao, J.; Liu, C.; Tian, Y.; He, Y. Research and implementation of cancer gene data classification based on deep learning. J. Softw. Eng. Appl. 2023, 16, 155–169. [Google Scholar] [CrossRef]
  25. Tabares-Soto, R.; Orozco-Arias, S.; Romero-Cano, V.; Bucheli, V.S.; Rodríguez-Sotelo, J.L.; Jiménez-Varón, C.F. A comparative study of machine learning and deep learning algorithms to classify cancer types based on microarray gene expression data. PeerJ Comput. Sci. 2020, 6, e270. [Google Scholar] [CrossRef]
  26. Yang, P.; Hwa Yang, Y.; Zhou, B.B.; Y Zomaya, A. A review of ensemble methods in bioinformatics. Curr. Bioinform. 2010, 5, 296–308. [Google Scholar] [CrossRef]
  27. Lazar, C.; Taminau, J.; Meganck, S.; Steenhoff, D.; Coletta, A.; Molter, C.; de Schaetzen, V.; Duque, R.; Bersini, H.; Nowe, A. A survey on filter techniques for feature selection in gene expression microarray analysis. IEEE/ACM Trans. Comput. Biol. Bioinform. 2012, 9, 1106–1119. [Google Scholar] [CrossRef] [PubMed]
  28. Torkkola, K.; Campbell, W.M. Mutual information in learning feature transformations. In Proceedings of the ICML, San Francisco, CA, USA, 29 June–2 July 2000; Citeseer: Princeton, NJ, USA, 2001; pp. 1015–1022. [Google Scholar]
  29. Shadvar, A. Dimension reduction by mutual information feature extraction. arXiv 2012, arXiv:1207.3394. [Google Scholar] [CrossRef]
Figure 1. Number of cancer deaths of males and females in Japan in 2021 [7].
Biomedinformatics 04 00070 g001
Figure 2. Steps of the proposed methodology for cancer classification.
Biomedinformatics 04 00070 g002
Figure 3. Data distribution of each target class for every dataset.
Biomedinformatics 04 00070 g003
Figure 4. Preprocessing steps involved in producing clean data from raw dataset to boost the reliability and accuracy of the model.
Biomedinformatics 04 00070 g004
Figure 5. An overview of MI-based gene selection method to select influential biomarker genes for any sample n, where n { 1 , 2 , 3 , , N } .
Biomedinformatics 04 00070 g005
Figure 6. Workflow of the bagging approach used as an ensemble classifier comprising bootstrap samples, parallel training of MLP, and majority voting.
Biomedinformatics 04 00070 g006
Figure 7. Structure of Multilayer Perceptron used in bagging method as a base learner consisting of 3 hidden layers.
Biomedinformatics 04 00070 g007
Figure 8. Confusion matrix for all of the genes of each dataset without the use of the MI algorithm.
Biomedinformatics 04 00070 g008
Figure 9. Confusion matrix for each dataset’s selected genes based on the MI-Bagging method.
Biomedinformatics 04 00070 g009
Table 1. Description of the five benchmark datasets used in this study.
DatasetTotal FeaturesTotal SamplesNumber of Classes
DS 17128722
DS 216,3821305
DS 316,3838015
DS 412,53317411
DS 54656814
Table 2. Preprocessed samples per class after the SMOTE Operation of the datasets.
DatasetTotal Samples (after SMOTE Operation)Sample Number per Class
DS 19447
DS 223046
DS 31500300
DS 429727
DS 512431
Table 3. Results of the test set classification as a percentage without the use of the feature selection method.
DatasetsGene Number
(with All Features)
AccuracyPrecisionRecallF1-Score
DS 17128100%100%100%100%
DS 216,38296.36%97.10%95.65%95.87%
DS 316,38399.66%99.67%99.67%99.67%
DS 412,53395.15%97.08%96.67%96.69%
DS 5465687.50%92.00%88.00%88.22%
Table 4. Results of the test set classification as a percentage for selected features with the help of the MI method.
DatasetsGene Number
(with Selected Features)
AccuracyPrecisionRecallF1-Score
DS 1100100%100%100%100%
DS 2500100%100%100%100%
DS 3500100%100%100%100%
DS 4150098.48%98.75%98.33%98.38%
DS 5200095.83%96.57%96.00%95.97%
Table 5. Comparison of our proposed model, MI-Bagging, with some existing works.
DatasetsExisting WorkAccuracy of Our Proposed Model
MethodAccuracy
DS 1mRMR-ANN [12]97.10%100%
PCA-XGBoost [11]92.30%
PCA-ANN [11]92.30%
PCA-Random Forest [11]80.80%
Genetic Programming [8]97.06%
DNN [16]98.20%
DS 2SVM [19]95%100%
DS 3SVM [24]100%100%
NN [24]100%
DS 4CNN [25]94.43%98.48%
Disclaimer/Publisher’s Note: The statements, opinions and data contained in all publications are solely those of the individual author(s) and contributor(s) and not of MDPI and/or the editor(s). MDPI and/or the editor(s) disclaim responsibility for any injury to people or property resulting from any ideas, methods, instructions or products referred to in the content.