Article

The Bioinformatics Identification of Potential Protein Glycosylation Genes Associated with a Glioma Stem Cell Signature

1
Department of Bioactive Molecules, Pharmacology, Gifu Pharmaceutical University, Gifu 501-1196, Japan
2
United Graduate School of Drug Discovery and Medical Information Sciences, Gifu University, Gifu 501-1193, Japan
3
Center for One Medicine Innovative Translational Research (COMIT), Division of Innovative Modality Development, Gifu University, Gifu 501-1193, Japan
*
Author to whom correspondence should be addressed.
These authors contributed equally to this work.
BioMedInformatics 2024, 4(1), 75-88; https://doi.org/10.3390/biomedinformatics4010005
Submission received: 6 November 2023 / Revised: 10 December 2023 / Accepted: 20 December 2023 / Published: 1 January 2024

Abstract

:
Glioma stem cells (GSCs) contribute to the pathogenesis of glioblastoma (GBM), which is the most malignant form of glioma. The implications and underlying mechanisms of protein glycosylation in GSC phenotypes and GBM malignancy are not fully understood. The implication of protein glycosylation and the corresponding candidate genes on the stem cell properties of GSCs and poor clinical outcomes in GBM were investigated, using datasets from the Gene Expression Omnibus, The Cancer Genome Atlas, and the Chinese Glioma Genome Atlas, accompanied by biological validation in vitro. N-linked glycosylation was significantly associated with GSC properties and the prognosis of GBM in the integrated bioinformatics analyses of clinical specimens. N-linked glycosylation was associated with the glioma grade, molecular biomarkers, and molecular subtypes. The expression levels of the asparagine-linked glycosylation (ALG) enzyme family, which is essential for the early steps in the biosynthesis of N-glycans, were prominently associated with GSC properties and poor survival in patients with GBM with high stem-cell properties. Finally, the oxidative phosphorylation pathway was primarily enriched in GSCs with a high expression of the ALG enzyme family. These findings suggest the role of N-linked glycosylation in the regulation of GSC phenotypes and GBM malignancy.

Graphical Abstract

1. Introduction

The World Health Organization defines glioblastoma (GBM) as a grade IV cancer, and GBM is the most malignant form of glioma [1,2]. GBM is one of the most aggressive and fatal types of central nervous system cancer [3]. Isocitrate dehydrogenase (IDH) status is a prognostic biomarker in patients with GBM; IDH mutant GBM has a better prognosis than IDH wild-type GBM [4]. GBM is also classified by the following molecular subtypes: mesenchymal, classical, proneural, and neural [5]. Patients with GBM have a significantly poor prognosis and rarely exhibit long-term survival, despite recent advances in multimodality therapy with a combination of surgical operation, radiation therapy, chemotherapy, and molecular targeted therapy [6]. Glioma stem cells (GSCs) exhibit stem cell-like properties, such as self-renewal capacity, ability to differentiate into non-GSCs, and tumor-propagating potential [7]. GSCs play important roles in several events, such as therapeutic resistance (radioresistance and chemoresistance), rapid recurrence, cancer invasion, and tumor angiogenesis, indicating that targeting GSCs is an effective strategy for improving GBM treatment [8].
Protein glycosylation, a typical posttranslational modification, is a complex and multistep process involving various glycan-modifying enzymes, including glycosyltransferases and glycosidases [9,10]. It regulates a diverse range of fundamental cellular and biological pathways, including protein trafficking, signal transduction, pluripotency, proliferation, differentiation, and survival [11]. The most abundant and commonly occurring types of protein glycosylation include N-linked (asparagine-linked) and O-linked (serine/threonine-linked) glycosylation [12,13]; C-linked glycosylation (C-mannosylation) is a comparatively rare event, and its biological function has not been fully elucidated yet. Although extensive studies have been conducted to reveal the implication of protein glycosylation in the pathogenesis of glioma, limited evidence is available on the role of protein glycosylation alterations in stem-cell properties and the aggressiveness of GSCs and GBM malignancy [14,15,16,17,18,19]. We aimed to investigate the implication of protein glycosylation and the corresponding candidate genes on the stem cell properties of GSCs and poor clinical outcomes in GBM, using integrated bioinformatics analyses, single-cell RNA sequencing (scRNA-seq), and bulk RNA-seq datasets of clinical GBM specimens deposited in the Gene Expression Omnibus (GEO) database with different cohorts, in addition to The Cancer Genome Atlas (TCGA) and Chinese Glioma Genome Atlas (CGGA) databases of patients with glioma, accompanied by in vitro validation.

2. Materials and Methods

2.1. scRNA-seq Data Analysis

We used the gene expression data for patients with GBM (GSE84465) [20], which was downloaded from GEO. The downloaded data was analyzed using the Seurat package (ver. 4.2.1) on the R software (ver. 4.2.1). First, cells with more than 60,000, less than 600 expressed genes, or more than 100,000 counted genes were removed in advance. After performing sctransform normalization, dimensional compression was performed using principal component analysis (PCA) and uniform manifold approximation and projection (UMAP). Clustering was then performed using the Louvain algorithm, followed by identification of each cluster using known marker genes. Copy number variation (CNV) was performed using the inferCNV package (ver. 1.6.0). Wilcoxon’s rank-sum test was performed to identify differentially expressed genes (DEGs) using the presto package (ver. 1.0.0). Single sample gene set enrichment analysis (ssGSEA) was performed using the GSVA package (ver. 1.46.0). We defined the top 10% of neoplastic tumor cells in the ssGSEA score of the “BEIER_GLIOMA_STEM_CELL_UP” gene set as cancer stem cell (CSC)-signaturehigh GBM cells and the rest as CSC-signaturelow GBM cells. Gene sets deposited in the Molecular Signatures Database (MSigDB) (http://www.gsea-msigdb.org/gsea/msigdb/index.jsp) (accesed on 1 December 2022) were used. For “PROTEIN_C_LINKED_GLYCOSYLATION” (https://www.gsea-msigdb.org/gsea/msigdb/human/geneset/GOBP_PROTEIN_C_LINKED_GLYCOSYLATION.html) (accesed on 1 December 2022) and “PROTEIN_DEGLYCOSYLATION” (https://www.gsea-msigdb.org/gsea/msigdb/human/geneset/GOBP_PROTEIN_DEGLYCOSYLATION.html) (accesed on 1 December 2022), 6 and 26 genes listed in the MSigDB were analyzed, respectively. For “PROTEIN_O_LINKED_GLYCOSYLATION_VIA_SERINE” (https://www.gsea-msigdb.org/gsea/msigdb/human/geneset/GOBP_PROTEIN_O_LINKED_GLYCOSYLATION_VIA_SERINE.html) (accesed on 1 December 2022) and “PROTEIN_O_LINKED_GLYCOSYLATION_VIA_THREONINE” (https://www.gsea-msigdb.org/gsea/msigdb/human/geneset/GOBP_PROTEIN_O_LINKED_GLYCOSYLATION_VIA_THREONINE.html) (accesed on 1 December 2022), 10 genes listed in the MSigDB were analyzed for each gene set. Genes that were expressed in more than 10% of cells and those that showed significant changes between the two groups (CSC-signaturehigh and CSC-signaturelow) were identified as DEGs for genes related to the N-linked glycosylation pathway. GSEA was performed using the clusterProfiler package (ver. 4.6.0). The HALLMARK gene set is deposited in the H collection of MSigDB, the GOBP gene set in the C5 collection, and the KEGG gene set in the C2 collection.

2.2. Bulk RNA-seq Data Analysis

We performed gene expression analysis of GBM and non-tumor brain tissues from patients with GBM, using RNA-seq data (GSE33328, GSE48865, GSE59612, GSE62731, and GSE77530) [21,22,23,24,25], which were downloaded from the GEO using the SRA Toolkit (ver. 2.10.4). Quality checks were performed with FastQC (ver. 0.11.8) and processed with Trimomatic (ver. 0.33) to exclude adapter sequences and low-quality bases. Clean reads were quantified at the transcript level against a human reference sequence (GRCh38 release 98) using Salmon (ver. 1.2.0). Conversion to gene expression and visualization were performed using the tximport (ver. 1.24.0) and ggplot2 (ver. 3.4.0) packages on the R software, respectively. Additionally, we analyzed data from the tissues of patients with glioma (e.g., grade, IDH mutation status, and subtype) in TCGA and CGGA. Statistical significance was determined using Wilcoxon’s rank-sum test followed by Bonferroni’s correction. For correlation analysis, we calculated Pearson’s correlation coefficient.

2.3. Survival Analysis

The TCGA and CGGA datasets were obtained from Gliovis [26]. We defined the top 50% of patients with glioma in the ssGSEA score of the “BEIER_GLIOMA_STEM_CELL_UP” gene set as the CSC-signaturehigh group and the rest as the CSC-signaturelow group. Survival analysis was performed using the log-rank test with the survival package, and Kaplan–Meier curves were plotted using survminer (ver. 0.4.9) on the R software.

2.4. Cell Culture

Mouse glioma cell line GL261 was obtained from the National Institutes of Health. These cells were cultured at 37 °C in a 5% CO2 incubator for 4 days and maintained in adherent culture medium containing Dulbecco’s modified Eagle’s medium (DMEM) supplemented with 10% fetal bovine serum. For non-adherent culture, these cells were cultured in neurosphere medium containing DMEM/F12 (FUJIFILM Wako Pure Chemical, Osaka, Japan) supplemented with recombinant human epidermal growth factor at 20 ng/mL (FUJIFILM Wako Pure Chemical), recombinant human basic fibroblast growth factor at 20 ng/mL (FUJIFILM Wako Pure Chemical), B27 supplement without vitamin A (Gibco, Waltham, MA, USA), and GlutaMAX (Gibco).

2.5. RNA Extraction and Real-Time qPCR

Total RNA was extracted from GL261 cells using the FastGene RNA Basic Kit (Nippon Genetics, Japan). Then, the RNA concentration was determined using a NanoDrop One spectrophotometer (Thermo Fisher Scientific, Waltham, MA, USA), and reverse transcription was performed to synthesize cDNA with reverse transcriptase and oligo-dT primer. The real-time PCR was performed on an MX3000P instrument (Agilent Technologies, Waltham, MA, USA), by using specific primers for each gene (Supplementary Table S1) [27]. Expression levels of the genes examined were normalized by using the Actb expression levels as an internal control for each sample [28].

2.6. Statistical Analysis

Wilcoxon’s rank-sum test between the two groups was used to detect DEG, and a permutation test was used for GSEA. Statistical analysis between the three groups was performed using Wilcoxon’s rank-sum test with Bonferroni’s correction. Statistical significance was set at p < 0.05. Significance levels are indicated by asterisks (* p < 0.05, ** p < 0.01, *** p < 0.001).

3. Results

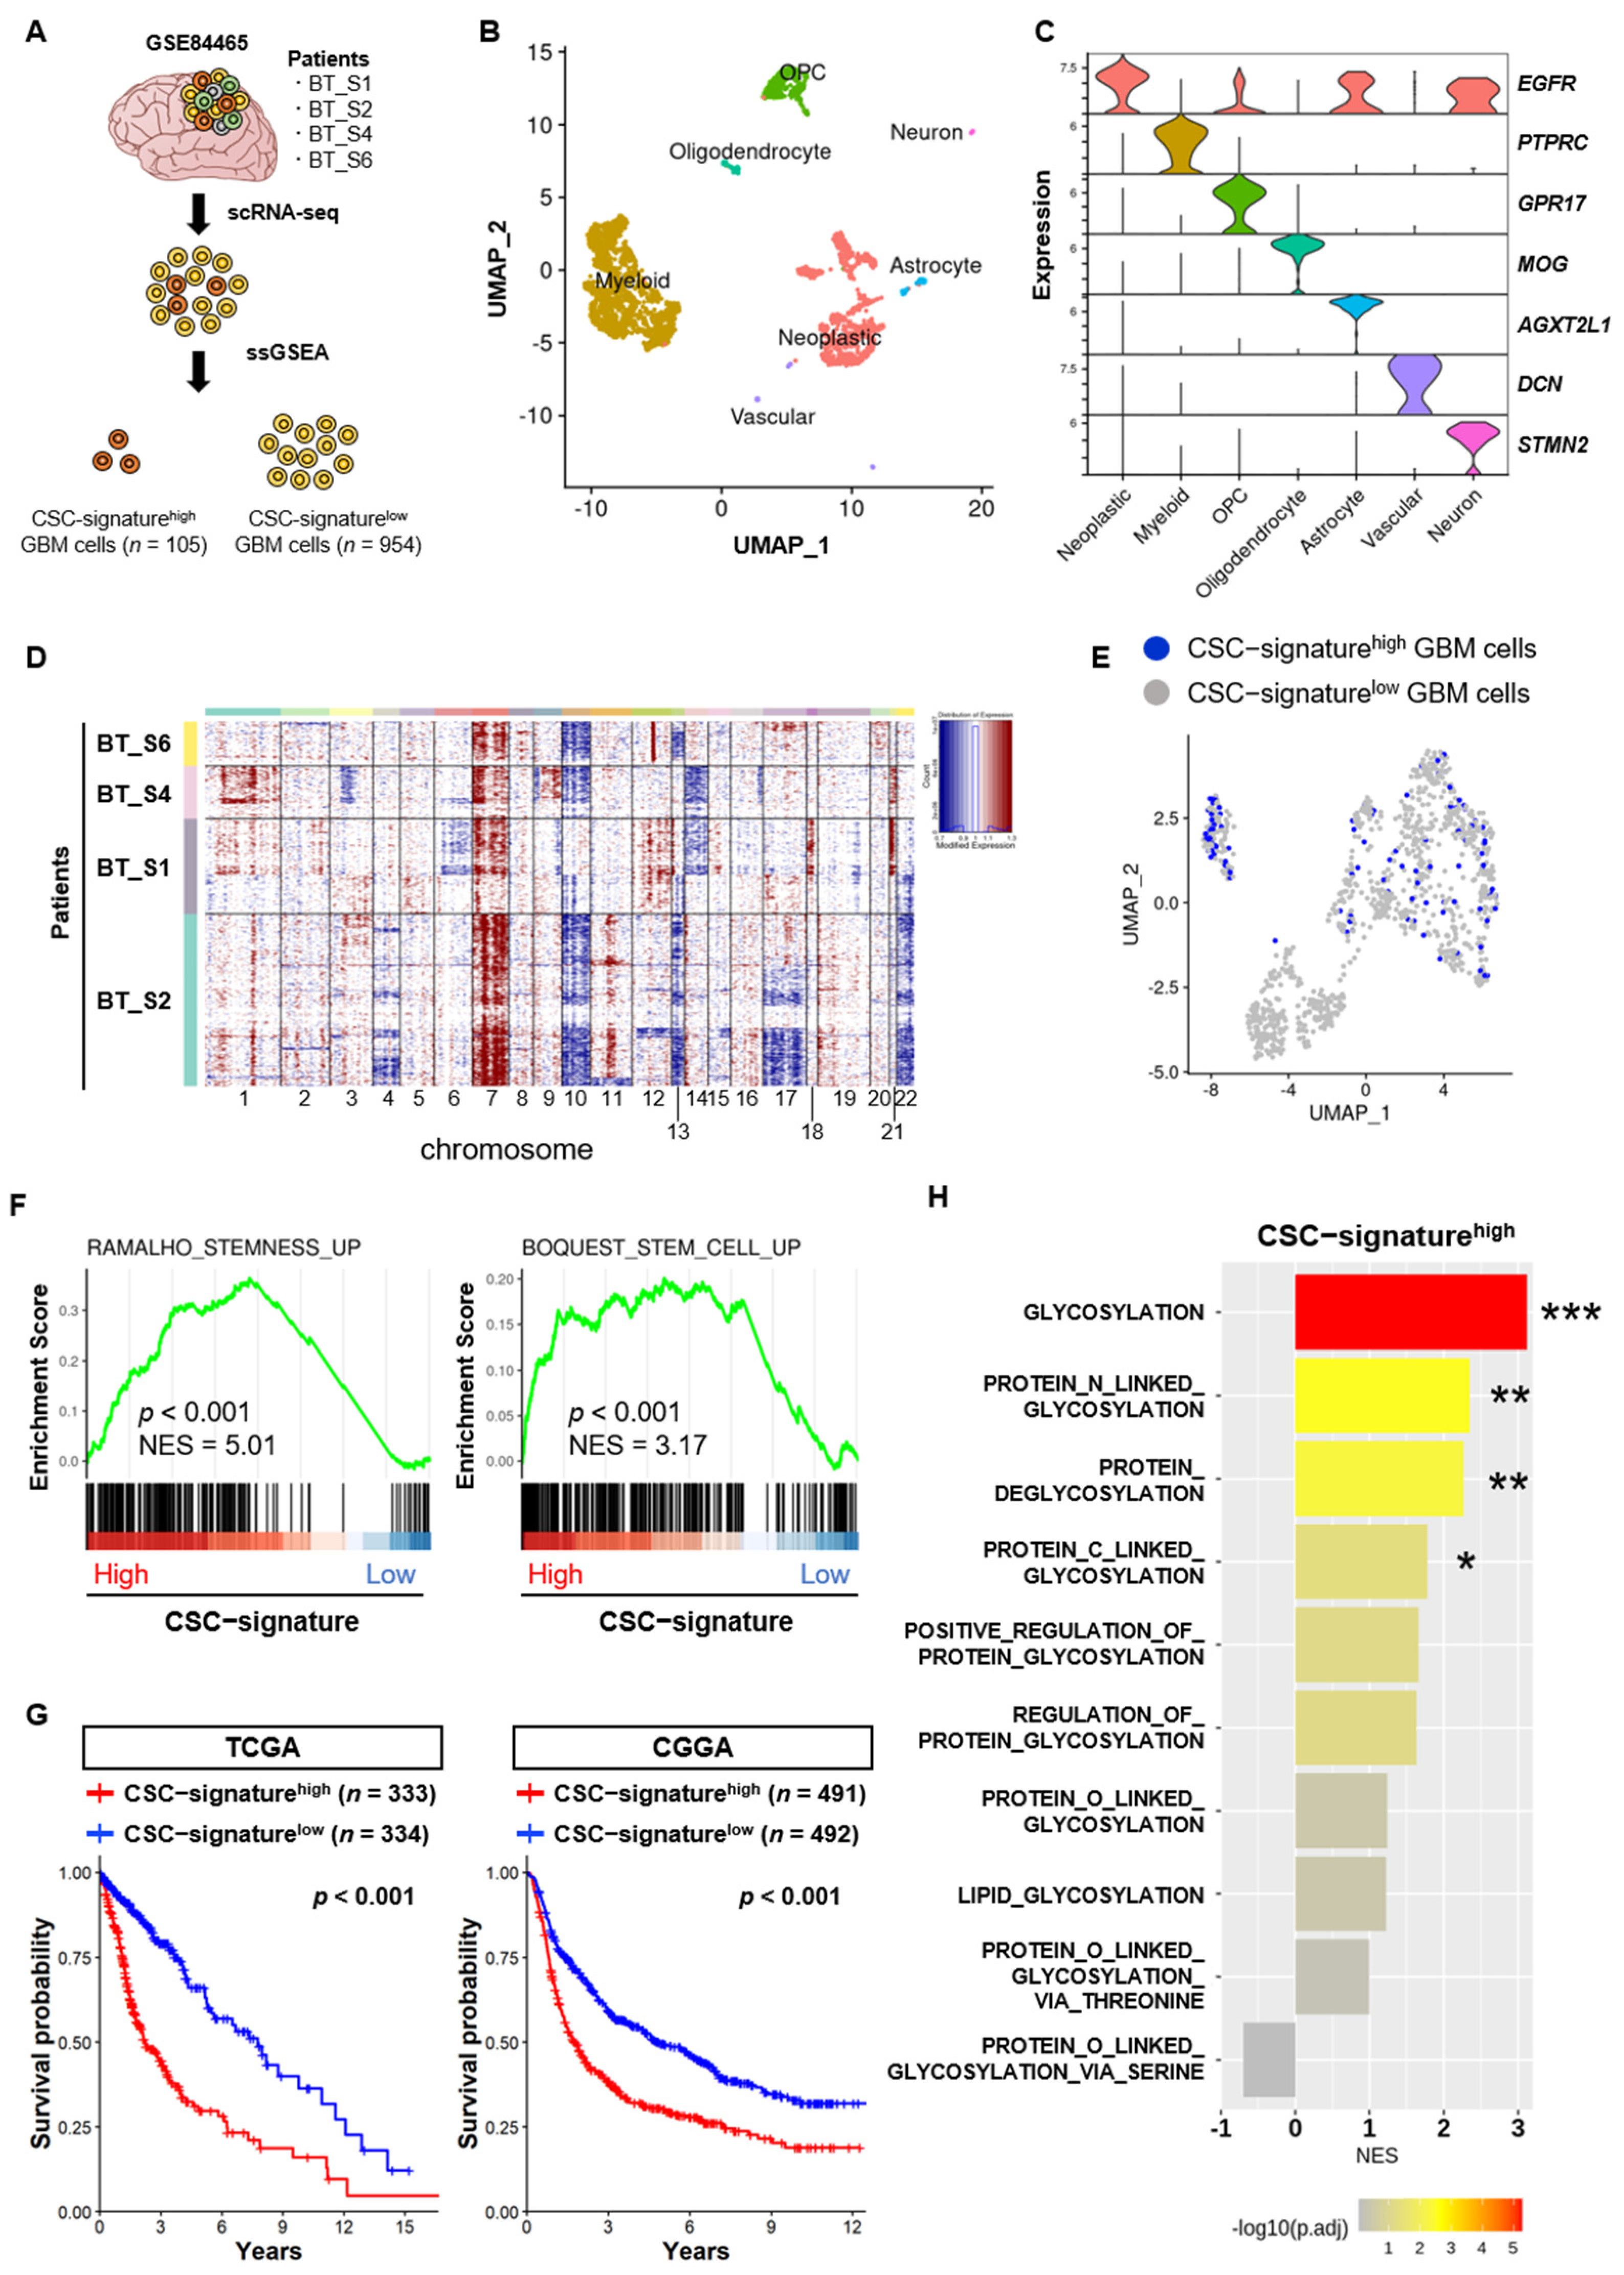
3.1. N- and C-Linked Glycosylation Pathways are Associated with the Stem Cell Properties of GSCs

We first analyzed an scRNA-seq dataset of clinical GBM specimens deposited in the GEO database (GSE84465) to profile the properties of GSCs (Figure 1A). Seven clusters were successfully identified through UMAP analysis based on the genetic profile of the cell (Figure 1B), and canonical markers were used to annotate cell types: neoplastic cells (EGFR+) and normal cells (myeloid [PTPRC+], oligodendrocyte precursor cells [GPR17+], oligodendrocytes [MOG+], astrocytes [AGXT2L1+], vascular cells [DCN+], and neurons [SYMN2+]) (Figure 1C). Subsequently, we distinguished malignant cells from non-malignant cells via CNV inference (Figure 1D).
We further divided neoplastic cells (GBM cell population) into two groups, CSC-signaturehigh GBM and CSC-signaturelow GBM cells, on the basis of the gene set associated with “glioma stem cell” by ssGSEA (Figure 1E). We confirmed the enrichment of both gene sets involved in “stemness” and “stem cell” in CSC-signaturehigh GBM cells by ssGSEA and the shorter overall survival times in the CSC-signaturehigh patient group by Kaplan–Meier survival analysis of the TCGA and CGGA datasets, allowing us to define these cells as the GSC population (Figure 1F,G). Under these experimental conditions, among the gene sets associated with glycosylation, ssGSEA revealed a significant enrichment for gene sets related to the “glycosylation”, “N-linked glycosylation”, “deglycosylation”, and “C-linked glycosylation” in CSC-signaturehigh GBM cells (Figure 1H). In contrast, no significant enrichment was detected in gene sets involved in O-linked glycosylation in CSC-signaturehigh GBM cells (Figure 1H). The difference between N-linked glycosylation and C-linked glycosylation is that in the N-linked glycosylation, glycan is attached to the amino group of asparagine, whereas in the C-linked glycosylation, mannose is attached to the indole of tryptophan [12].
Collectively, these results indicate that the N- and C-linked glycosylation pathways are linked to the stem cell characteristics of GSCs.

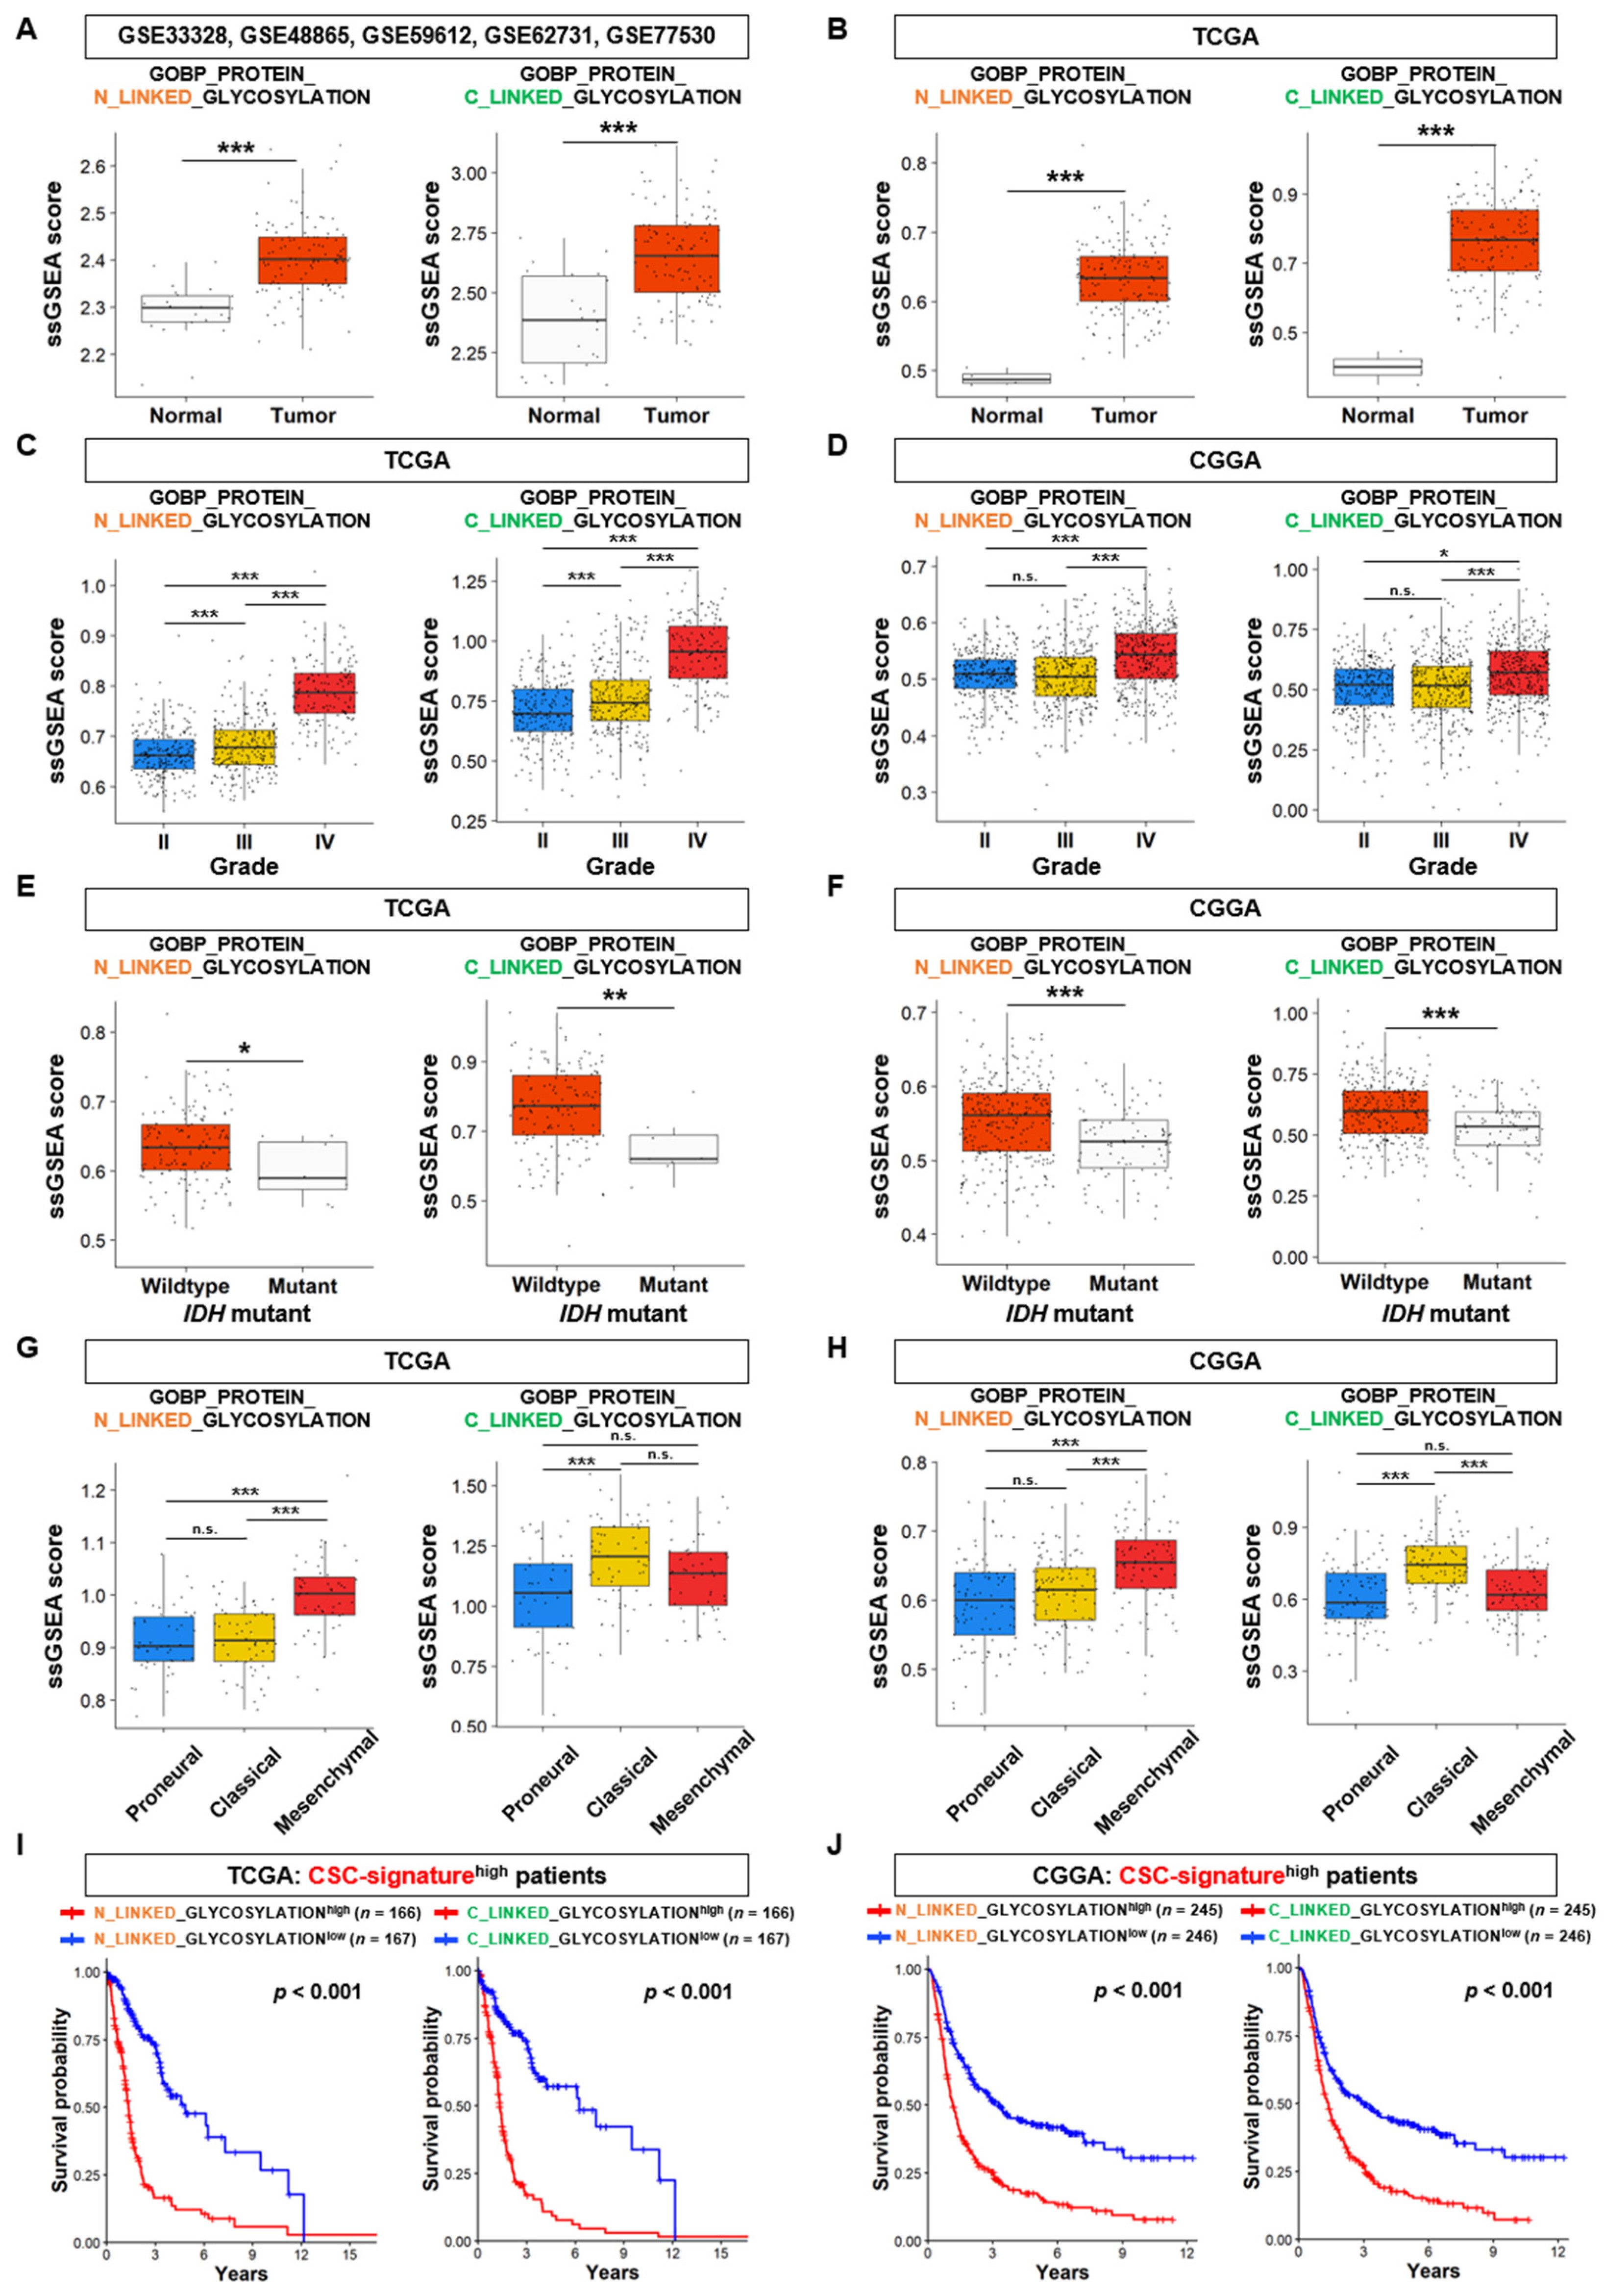
3.2. N-Linked Glycosylation Pathway in GSCs is Linked to the Aggressiveness and Poor Prognosis of GBM

Next, we analyzed five bulk-RNA-seq datasets of 107 patients with GBM (GSE33328, GSE48865, GSE59612, GSE62731, and GSE77530) and observed that gene sets involved in N- and C-linked glycosylation were more significantly upregulated in GBM tissues than in non-tumor brain tissues (Figure 2A). Consistent results were confirmed using the TCGA database (Figure 2B). Moreover, gene sets related to N- and C-linked glycosylation were positively associated with increased glioma grade (grades II, III, and IV) and were more significantly downregulated in patients with GBM harboring IDH mutation compared with that in patients exhibiting wildtype status, on the basis of the data from the TCGA and CGGA databases (Figure 2C–F). Meanwhile, the N-linked glycosylation-related gene set was significantly higher in patients with GBM with the mesenchymal subtype, the most aggressive among the molecular GBM subtypes [5], compared with that in patients with classical and proneural subtypes, according to the data from the TCGA and CGGA databases (Figure 2G,H). However, the expression of the C-linked glycosylation-related gene set was significantly increased in the classical subtype compared with that in the mesenchymal and proneural subtypes (Figure 2G,H).
Next, we assessed whether N- and C-linked glycosylation pathways in patients with glioma with higher stem cell properties were associated with poor prognosis. Kaplan–Meier survival analysis demonstrated that the CSC-signaturehigh patient group with elevated activity of the N-linked glycosylation pathway exhibited significantly shorter overall survival times than that with low glycosylation, according to the TCGA and CGGA databases (Figure 2I,J). We observed the same survival outcomes in patients with elevated activity of the C-linked glycosylation pathway (Figure 2I,J).
Collectively, these results suggest that the N-linked glycosylation pathway in GSCs is associated with malignancy, aggressiveness, and survival outcomes in patients with GBM.

3.3. The Expression Analysis of DEGs Linked to N-Linked Glycosylation Pathway in GSCs

Considering that a novel and valid association was found between N-linked glycosylation and molecular subtypes of GBM, in addition to the glioma grade, molecular biomarkers, and poor prognosis of GBM, we subsequently focused on the N-linked glycosylation pathway.
First, we identified DEGs related to the N-linked glycosylation pathway between CSC-signaturehigh GBM and CSC-signaturelow GBM cells using the scRNA-seq dataset (GSE84465). Thirty-nine DEGs linked to the N-linked glycosylation pathway were screened, including five significantly upregulated genes and one significantly downregulated gene. Among the upregulated genes, asparagine-linked glycosylation 1 (ALG1) and ALG2, essential enzymes for the biosynthesis of N-glycans at early stages [29], were the top two upregulated genes in CSC-signaturehigh GBM cells (Figure 3A). Moreover, the expression levels of ALG6, ALG7, and ALG12 were significantly upregulated in CSC-signaturehigh GBM cells (Figure 3A). In contrast, the expression levels of other genes of the ALG family were not significantly changed in CSC-signaturehigh GBM cells (Supplementary Figure S1A). UDP-glucose glycoprotein glucosyltransferase (UGGT2), which recognizes glycoproteins with minor folding defects [30], was the significantly downregulated gene in CSC-signaturehigh GBM cells (Figure 3A). Because all significantly upregulated genes related to the N-linked glycosylation pathway (ALG1, ALG2, ALG6, ALG7, and ALG12) belonged to the ALG enzyme family, we subsequently focused on the ALG enzyme family.
To confirm the results of our bioinformatic analysis, we next compared the expression levels of the ALG enzyme family between GSCs and differentiated glioma cells. GL261, which is a murine malignant glioma cell line, was cultured in a neurosphere culture condition (for GSCs) or adherent culture condition (for differentiated glioma cells) (Figure 3B). The expression levels of ALG1, ALG2, ALG7, and ALG12, which were found to be upregulated in bioinformatics data, were significantly increased in GL261 cells cultured under the GSC culture condition (Figure 3B), concomitant with higher levels of the stem cell marker, c-KIT (Figure 3C), despite the significant upregulation of ALG9 and ALG13 in the cell culture study, whose expression was not significantly upregulated in bioinformatics data (Supplementary Figure S1A,B). These results indicate the preferential high expression of the ALG enzyme family in GSCs through both bioinformatics analysis and biological validation in vitro.
The expression levels of the ALG enzyme family (ALG1, ALG2, ALG6, ALG7, and ALG12) were significantly more upregulated in GBM tissues compared to that in non-tumor brain tissues, according to analyses of five bulk-RNA-seq datasets and the TCGA database (Figure 3D,E). Moreover, the expression levels of the ALG enzyme family were associated with an increased glioma grade, and were significantly downregulated in patients with GBM harboring the IDH mutant, according to the data from the TCGA and CGGA databases (Figure 3F–I). ALG2 expression level was the highest in the mesenchymal subtype, according to the TCGA and CGGA databases (Figure 3J,K).

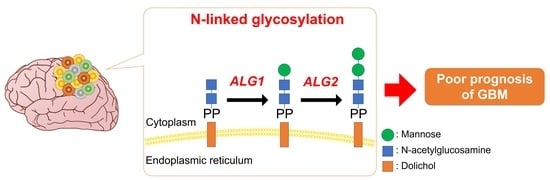
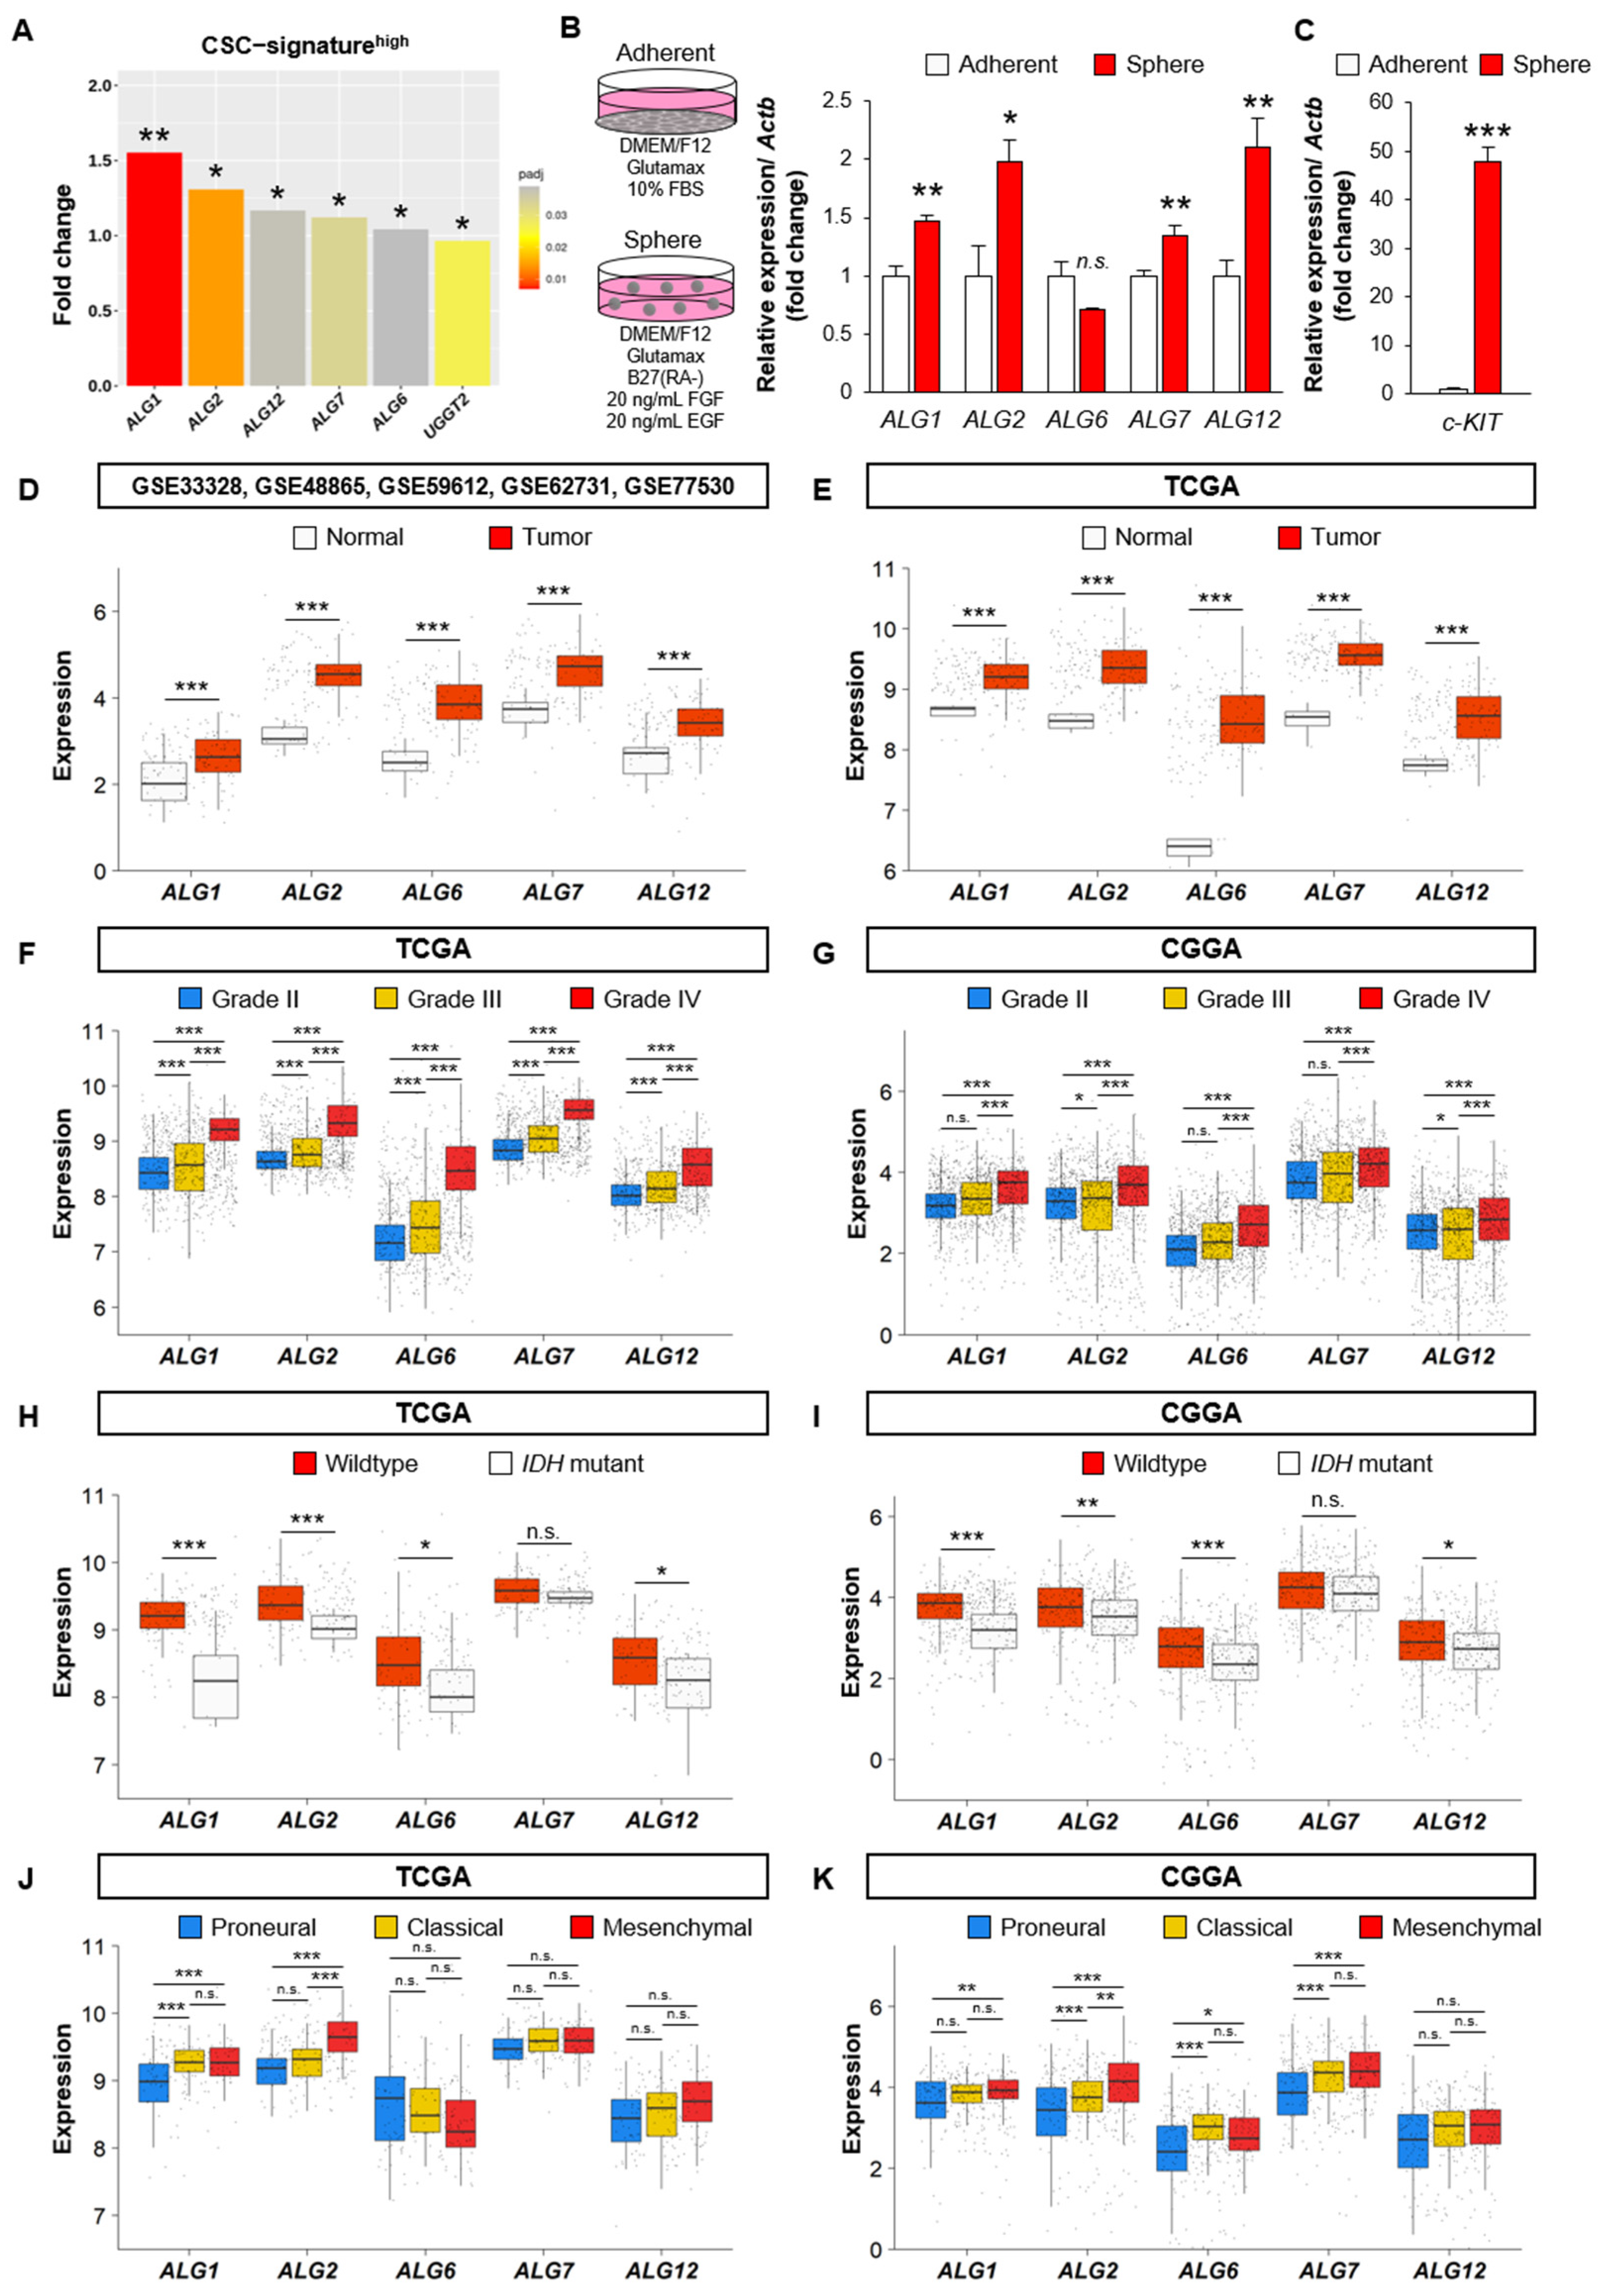
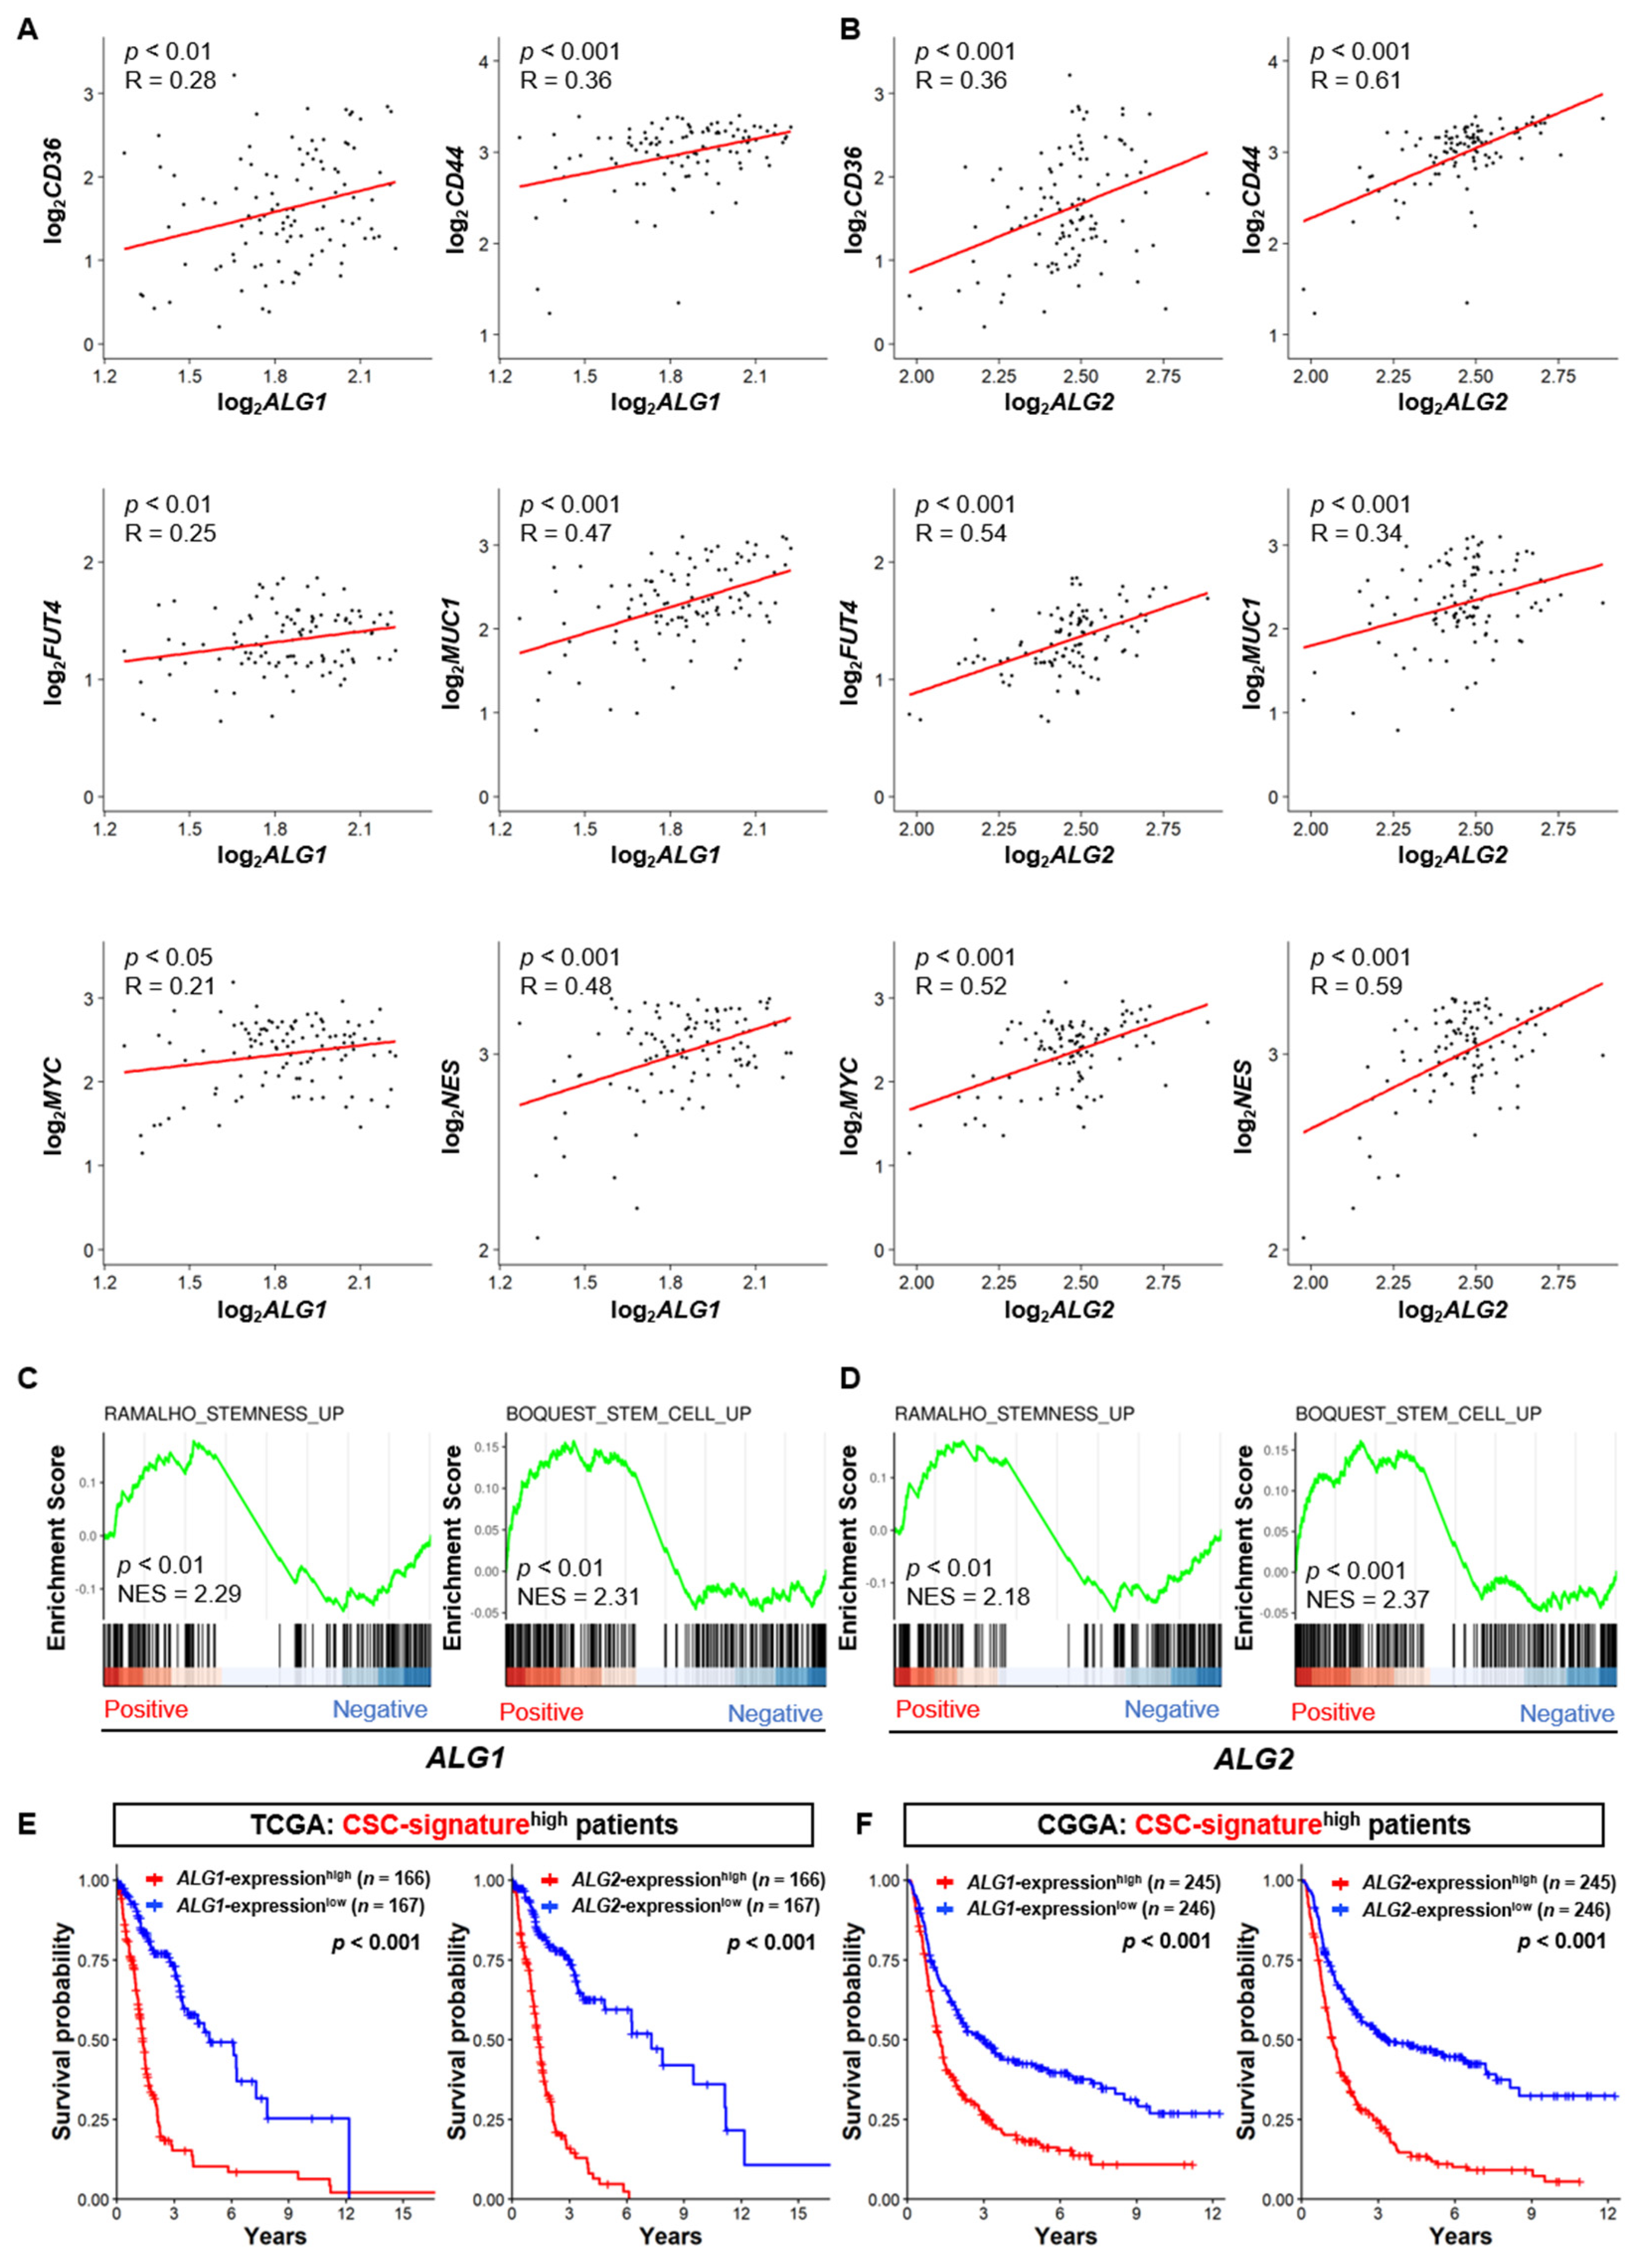
3.4. The Expression of the ALG Enzyme Family is Associated with the Stem Cell Properties of GSCs and Poor Prognosis of GBM

Next, we determined whether the expression levels of the ALG enzyme family were associated with the stem cell properties of GSCs using five bulk-RNA-seq datasets and the scRNA-seq dataset (GSE84465). A correlation analysis between the ALG family and stem cell markers revealed that the expression levels of ALG1, ALG2, ALG6, ALG7, and ALG12 were positively correlated with those of well-known stem cell markers in GSCs, such as CD36, CD44, FUT4, MUC1, MYC and NES, in GBM specimens according to five bulk-RNA-seq datasets of patients with GBM (Figure 4A,B and Supplementary Figure S2A–C) [31,32,33,34,35,36]. In addition, gene sets involved in “stemness” and “stem cell” were significantly enriched in ALG1-, ALG2-, ALG6-, ALG7-, and ALG12-positive CSC-signaturehigh GBM cells, according to the scRNA-seq dataset (Figure 4C,D and Supplementary Figure S2D–F).
Next, we assessed whether the expression levels of ALG1, ALG2, ALG6, ALG7, and ALG12 in patients with glioma with higher stem cell properties were associated with poor prognosis. Kaplan–Meier survival analysis revealed that the high expression levels of ALG1, ALG2, ALG6, ALG7, and ALG12 were significantly associated with poor prognosis in the CSC-signaturehigh patient group, according to the TCGA and CGGA databases (Figure 4E,F and Supplementary Figure S2G,H).
Collectively, these results suggest that the ALG enzyme family in GSCs is prominently associated with the stem cell properties of GSCs and poor survival outcomes in patients with GBM.

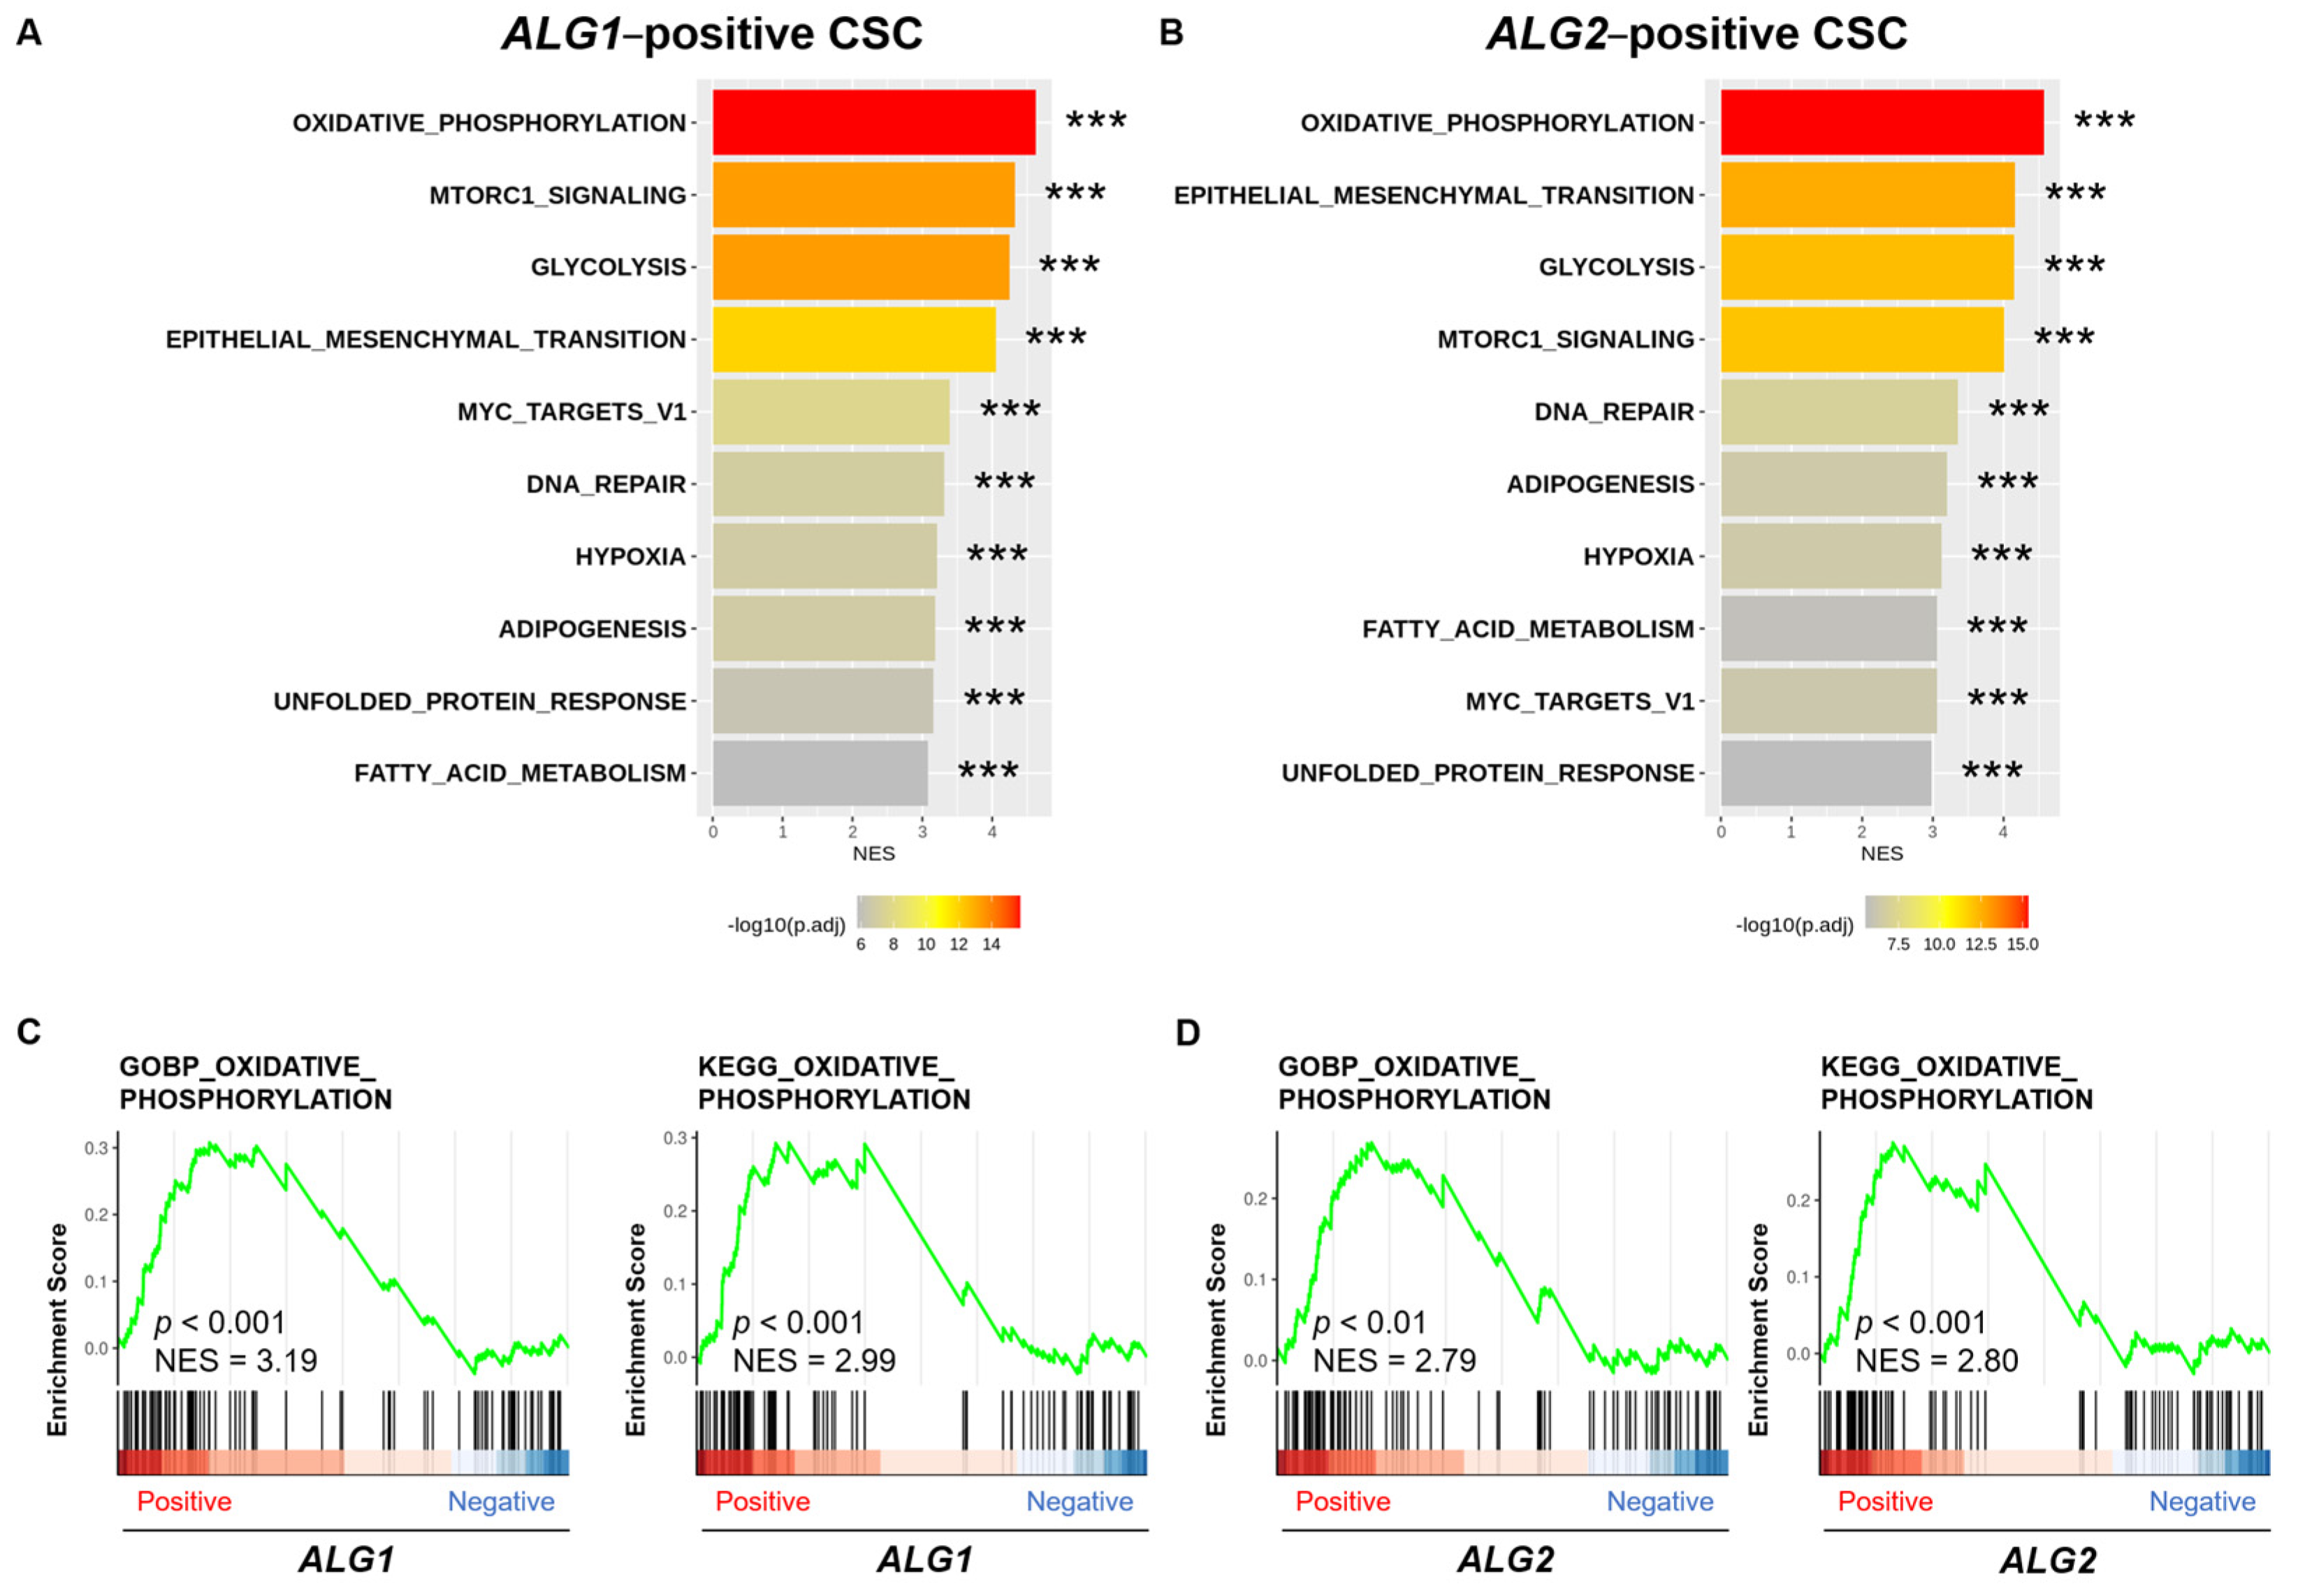
3.5. Oxidative Phosphorylation Pathway Forms a Link Between GSC Properties and the ALG Enzyme Family

We next examined the molecular mechanisms by which the ALG enzyme family is involved in the control of GSC characteristics and GBM phenotypes. GSEA showed that the expression of the gene set involved in the oxidative phosphorylation (OXPHOS) pathway was ranked the highest in ALG1-, ALG2-, ALG6-, and ALG7-expressionpositive CSCs and the third highest in ALG12-expressionpositive CSCs (Figure 5A,B and Supplementary Figure S3A–C). OXPHOS, the major source of adenosine triphosphate (ATP) in several cancer types, regardless of the increased aerobic glycolysis, plays a crucial role in tumorigenesis and tumor progression and addresses the energy demands of CSCs, including GSCs [37,38,39]. Consistently, the enrichment of the OXPHOS pathway in ALG-expressionpositive CSCs was verified by GESA using the GOBP and KEGG gene sets (Figure 5C,D and Supplementary Figure S3D–F).
The mechanistic target of rapamycin (mTORC1), a serine/threonine kinase signaling complex, contributes to the properties of CSCs including GSCs, and it is dysregulated in GBM [40,41,42,43,44]. c-MYC, a well-known stem cell transcription factor, is required for self-renewal and the tumorigenic potential of GSCs [35,45]. The gene sets associated with the mTORC1 and MYC pathways were consistently enriched in all ALG-expressionpositive GSCs (Figure 5A,B and Supplementary Figure S3A–C).
Collectively, these findings raise the possibility that the OXPHOS pathway is implicated in the regulation of GSC characteristics by the ALG enzyme family.

4. Discussion

Posttranslational modifications are frequently altered in GBM and are crucial for modulating the stemness and tumorigenicity of GSCs [46]. Recently, we demonstrated that phosphorylation of the c-Myc axis by CDK8 and the extracellular signal regulated kinase 5/signal transducer and activator of transcription 3 axis by mitogen-activated protein kinase 5 controls the stemness and tumorigenicity of GSCs, contributing to GBM tumorigenesis [47]. Ubiquitination of the transforming growth factor-β receptor/R-Smad axis by Smad ubiquitin regulatory factor 2, an E3 ubiquitin ligase, controls the properties of GSCs and GBM malignancy [48]. Moreover, methylation of the regulator of chromosome condensation 1 by protein arginine methyltransferase 6 regulates the tumorigenicity and radiation response of GSCs [49], while SUMOylation of promyelocytic leukemia protein by small ubiquitin-like modifier 1 regulates GSC maintenance and high malignancy [50]. Among the multiple dysregulated posttranslational modifications driving tumorigenicity, aberrant protein glycosylation is a well-known hallmark of GBM development and progression [14,15,16].
The assembly of N-linked oligosaccharides in eukaryotic cells is initiated by the successive addition of two N-acetylglucosamine, nine mannose, and three glucose molecules to the dolichol phosphate on the endoplasmic reticulum membrane by various glycosyltransferases, before transferring to an asparagine residue of a target protein by oligosaccharyltransferase [51,52,53]. The ALG enzyme family participates in the sequential step of dolichol-linked oligosaccharide biosynthesis [51]. ALG1 (β-1,4-mannosyltransferase) catalyzes the addition of the first β-1,4 mannose to Gn2-dolichol-phosphate [54]. ALG2 (α-1,3 mannosyltransferase) catalyzes the addition of the second and third mannose residues to M1Gn2-dolichol phosphate [55]. ALG7, which is also known as UDP-N-acetylglucosamine-dolichyl-phosphate N-acetylglucosaminephosphotransferase (DPAGT1), catalyzes the initial step of the dolichol-linked oligosaccharide biosynthesis in the N-linked protein glycosylation pathway. ALG12 catalyzes the addition of the eighth mannose residue in an alpha-1,6 linkage onto the dolichol-PP-oligosaccharide precursor. ALG13 and ALG14 constitute the UDP-N-acetylglucosamine transferase, which catalyzes a key step in endoplasmic reticulum N-linked glycosylation. Although ALG mutations cause a rare autosomal-recessive disorder along with serious systemic diseases [56], the role of the ALG enzyme family in GBM development and progression remains unknown. Despite some discrepancies between the data from bioinformatics and that from the in vitro study, the expression of ALG1, ALG2, ALG7 and ALG12 among the ALG enzyme family was significantly and commonly upregulated in both CSC-signaturehigh GBM cells both in the bioinformatics data and in the in vitro data of GL261 cells cultured under the GSC culture condition (Figure 3). Accordingly, it can be speculated that the simultaneous upregulation of ALG7/DPAGT1, ALG1, and ALG2, the initial step enzymes and essential enzymes for the biosynthesis of N-glycans at very early stages, leads to higher substrate production and accelerates glycan synthesis, Further research should be performed to determine the contents of N-glycans in a cell-culture study.
C-linked glycosylation (C-mannosylation) involves the attachment of an α-mannopyranosyl moiety to the indolic C-2 atom of tryptophan. Compared to that of N- and O-glycosylation, the biological significance of C-linked glycosylation has not been fully elucidated. We revealed a significant enrichment for gene sets related to the C-linked glycosylation in CSC-signaturehigh GBM cells (Figure 1), in addition to that for N-linked glycosylation, based on the expression levels of six genes, DPY19L3, DPY19L1, DPY19L2, DPY19L4, DPY19L2P2, and DPM3, concomitant with the association between C-linked glycosylation and the poor prognosis of GBM (Figure 2). These results, therefore, could lead us to determine the contents of C-mannoside in a cell-culture study to further characterize the possible linkage of O-linked glycosylation with GSC phenotypes and GBM malignancy in the future.
In this study, we showed that the OXPHOS pathway was primarily enriched in GSCs with a high expression of the ALG enzyme family (Figure 5). OXPHOS is a major source of ATP in several cancer types; however, aerobic glycolysis contributes to tumorigenesis and tumor progression [37]. Several independent lines have indicated that OXPHOS plays a crucial role in addressing the energy demands of CSCs, including GSCs [38,39]. Notably, GSEA showed that the gene sets involved in the mTORC1 and MYC pathways were enriched in all ALG enzyme family-expressionpositive CSCs (Figure 5 and Supplementary Figure S2). Accordingly, we suggest the possible role of the ALG-OXPHOS axis in the regulation of GSC properties via the N-linked glycosylation pathway, despite the additional molecular pathways that need to be explored.

5. Conclusions

The findings of the current study suggest that the N-linked glycosylation pathway and ALG enzyme family can be linked to the stemness properties of CSCs and GBM malignancy.

Supplementary Materials

The following supporting information can be downloaded at: https://www.mdpi.com/article/10.3390/biomedinformatics4010005/s1. Supplementary Figure S1: The ALG enzyme family is upregulated in GSCs; Supplementary Figure S2. ALG6, 7, and 12 are associated with the stem cell properties of GSCs and poor prognosis of GBM; Supplementary Figure S3. Oxidative phosphorylation pathway forms a link between GSC properties and ALG6, 7, and 12; Table S1: List of primers used for real-time PCR.

Author Contributions

Conceptualization, K.T., K.S., M.Y. and E.H.; Methodology, K.T., K.S. and E.H.; Formal analysis, K.T., K.S., M.Y., A.T., Y.T. and K.F.; Investigation, K.T., K.S., M.Y., A.T., Y.T. and K.F.; writing—original draft preparation, K.T. and E.H.; supervision, E.H.; funding acquisition, E.H. All authors have read and agreed to the published version of the manuscript.

Funding

This research was funded by the Japan Society for the Promotion of Science (20H03407 to E.H.).

Data Availability Statement

The bioinformatics data used in this study are openly available in the Gene Expression Omnibus (https://www.ncbi.nlm.nih.gov/geo/) (accesed on 1 July 2022) and GlioVis (http://gliovis.bioinfo.cnio.es/) (accesed on 17 November 2022) databases.

Acknowledgments

We wish to thank T. Horie (Kanazawa Medical University) for providing technical training in RNA-seq data analysis. Bioinformatic analyses were performed using the super-computing resource provided by the Human Genome Center, Institute of Medical Science, University of Tokyo. The results shown here are in part based upon data generated by the TCGA Research Network: https://www.cancer.gov/tcga (accesed on 17 November 2022).

Conflicts of Interest

E. Hinoi reports grants from the Japan Society for the Promotion of Science during the study. No other disclosures are reported.

References

  1. Louis, D.N.; Perry, A.; Wesseling, P.; Brat, D.J.; Cree, I.A.; Figarella-Branger, D.; Hawkins, C.; Ng, H.K.; Pfister, S.M.; Reifenberger, G.; et al. The 2021 WHO Classification of Tumors of the Central Nervous System: A Summary. Neuro Oncol. 2021, 23, 1231–1251. [Google Scholar] [CrossRef] [PubMed]
  2. Wen, P.Y.; Packer, R.J. The 2021 WHO Classification of Tumors of the Central Nervous System: Clinical Implications. Neuro Oncol. 2021, 23, 1215–1217. [Google Scholar] [CrossRef] [PubMed]
  3. Van Solinge, T.S.; Nieland, L.; Chiocca, E.A.; Broekman, M.L.D. Advances in Local Therapy for Glioblastoma—Taking the Fight to the Tumour. Nat. Rev. Neurol. 2022, 18, 221–236. [Google Scholar] [CrossRef] [PubMed]
  4. Melhem, J.M.; Detsky, J.; Lim-Fat, M.J.; Perry, J.R. Updates in IDH-Wildtype Glioblastoma. Neurotherapeutics 2022, 19, 1705–1723. [Google Scholar] [CrossRef] [PubMed]
  5. Behnan, J.; Finocchiaro, G.; Hanna, G. The Landscape of the Mesenchymal Signature in Brain Tumours. Brain 2019, 142, 847–866. [Google Scholar] [CrossRef] [PubMed]
  6. Sidaway, P. CNS Cancer: Glioblastoma Subtypes Revisited. Nat. Rev. Clin. Oncol. 2017, 14, 587. [Google Scholar] [CrossRef] [PubMed]
  7. Gimple, R.C.; Bhargava, S.; Dixit, D.; Rich, J.N. Glioblastoma Stem Cells: Lessons from the Tumor Hierarchy in a Lethal Cancer. Genes. Dev. 2019, 33, 591–609. [Google Scholar] [CrossRef] [PubMed]
  8. Prager, B.C.; Bhargava, S.; Mahadev, V.; Hubert, C.G.; Rich, J.N. Glioblastoma Stem Cells: Driving Resilience through Chaos. Trends Cancer 2020, 6, 223–235. [Google Scholar] [CrossRef]
  9. Schjoldager, K.T.; Narimatsu, Y.; Joshi, H.J.; Clausen, H. Global View of Human Protein Glycosylation Pathways and Functions. Nat. Rev. Mol. Cell Biol. 2020, 21, 729–749. [Google Scholar] [CrossRef]
  10. Reily, C.; Stewart, T.J.; Renfrow, M.B.; Novak, J. Glycosylation in Health and Disease. Nat. Rev. Nephrol. 2019, 15, 346–366. [Google Scholar] [CrossRef]
  11. Varki, A. Biological Roles of Glycans. Glycobiology 2017, 27, 3–49. [Google Scholar] [CrossRef] [PubMed]
  12. Spiro, R.G. Protein Glycosylation: Nature, Distribution, Enzymatic Formation, and Disease Implications of Glycopeptide Bonds. Glycobiology 2002, 12, 43R–56R. [Google Scholar] [CrossRef] [PubMed]
  13. Breitling, J.; Aebi, M. N-Linked Protein Glycosylation in the Endoplasmic Reticulum. Cold Spring Harb. Perspect. Biol. 2013, 5, a013359. [Google Scholar] [CrossRef] [PubMed]
  14. Veillon, L.; Fakih, C.; Abou-El-Hassan, H.; Kobeissy, F.; Mechref, Y. Glycosylation Changes in Brain Cancer. ACS Chem. Neurosci. 2018, 9, 51–72. [Google Scholar] [CrossRef] [PubMed]
  15. Rosa-Fernandes, L.; Oba-Shinjo, S.M.; Macedo-da-Silva, J.; Marie, S.K.N.; Palmisano, G. Aberrant Protein Glycosylation in Brain Cancers, with Emphasis on Glioblastoma. Adv. Exp. Med. Biol. 2022, 1382, 39–70. [Google Scholar] [CrossRef] [PubMed]
  16. Dusoswa, S.A.; Verhoeff, J.; Abels, E.; Méndez-Huergo, S.P.; Croci, D.O.; Kuijper, L.H.; de Miguel, E.; Wouters, V.M.C.J.; Best, M.G.; Rodriguez, E.; et al. Glioblastomas Exploit Truncated O-Linked Glycans for Local and Distant Immune Modulation via the Macrophage Galactose-Type Lectin. Proc. Natl. Acad. Sci. USA 2020, 117, 3693–3703. [Google Scholar] [CrossRef] [PubMed]
  17. Ilina, E.I.; Cialini, C.; Gerloff, D.L.; Duarte Garcia-Escudero, M.; Jeanty, C.; Thézénas, M.-L.; Lesur, A.; Puard, V.; Bernardin, F.; Moter, A.; et al. Enzymatic Activity of Glycosyltransferase GLT8D1 Promotes Human Glioblastoma Cell Migration. iScience 2022, 25, 103842. [Google Scholar] [CrossRef] [PubMed]
  18. Liu, K.; Jiang, L.; Shi, Y.; Liu, B.; He, Y.; Shen, Q.; Jiang, X.; Nie, Z.; Pu, J.; Yang, C.; et al. Hypoxia-Induced GLT8D1 Promotes Glioma Stem Cell Maintenance by Inhibiting CD133 Degradation through N-Linked Glycosylation. Cell Death Differ. 2022, 29, 1834–1849. [Google Scholar] [CrossRef]
  19. Marhuenda, E.; Fabre, C.; Zhang, C.; Martin-Fernandez, M.; Iskratsch, T.; Saleh, A.; Bauchet, L.; Cambedouzou, J.; Hugnot, J.-P.; Duffau, H.; et al. Glioma Stem Cells Invasive Phenotype at Optimal Stiffness Is Driven by MGAT5 Dependent Mechanosensing. J. Exp. Clin. Cancer Res. 2021, 40, 139. [Google Scholar] [CrossRef]
  20. Darmanis, S.; Sloan, S.A.; Croote, D.; Mignardi, M.; Chernikova, S.; Samghababi, P.; Zhang, Y.; Neff, N.; Kowarsky, M.; Caneda, C.; et al. Single-Cell RNA-Seq Analysis of Infiltrating Neoplastic Cells at the Migrating Front of Human Glioblastoma. Cell Rep. 2017, 21, 1399–1410. [Google Scholar] [CrossRef]
  21. Chen, L.Y.; Wei, K.-C.; Huang, A.C.-Y.; Wang, K.; Huang, C.-Y.; Yi, D.; Tang, C.Y.; Galas, D.J.; Hood, L.E. RNASEQR—A Streamlined and Accurate RNA-Seq Sequence Analysis Program. Nucleic Acids Res. 2012, 40, e42. [Google Scholar] [CrossRef] [PubMed]
  22. Bao, Z.-S.; Chen, H.-M.; Yang, M.-Y.; Zhang, C.-B.; Yu, K.; Ye, W.-L.; Hu, B.-Q.; Yan, W.; Zhang, W.; Akers, J.; et al. RNA-Seq of 272 Gliomas Revealed a Novel, Recurrent PTPRZ1-MET Fusion Transcript in Secondary Glioblastomas. Genome Res. 2014, 24, 1765–1773. [Google Scholar] [CrossRef] [PubMed]
  23. Gill, B.J.; Pisapia, D.J.; Malone, H.R.; Goldstein, H.; Lei, L.; Sonabend, A.; Yun, J.; Samanamud, J.; Sims, J.S.; Banu, M.; et al. MRI-Localized Biopsies Reveal Subtype-Specific Differences in Molecular and Cellular Composition at the Margins of Glioblastoma. Proc. Natl. Acad. Sci. USA 2014, 111, 12550–12555. [Google Scholar] [CrossRef] [PubMed]
  24. Stathias, V.; Pastori, C.; Griffin, T.Z.; Komotar, R.; Clarke, J.; Zhang, M.; Ayad, N.G. Identifying Glioblastoma Gene Networks Based on Hypergeometric Test Analysis. PLoS ONE 2014, 9, e115842. [Google Scholar] [CrossRef] [PubMed]
  25. Gabrusiewicz, K.; Rodriguez, B.; Wei, J.; Hashimoto, Y.; Healy, L.M.; Maiti, S.N.; Thomas, G.; Zhou, S.; Wang, Q.; Elakkad, A.; et al. Glioblastoma-Infiltrated Innate Immune Cells Resemble M0 Macrophage Phenotype. JCI Insight 2016, 1, e85841. [Google Scholar] [CrossRef] [PubMed]
  26. Bowman, R.L.; Wang, Q.; Carro, A.; Verhaak, R.G.W.; Squatrito, M. GlioVis Data Portal for Visualization and Analysis of Brain Tumor Expression Datasets. Neuro Oncol. 2017, 19, 139–141. [Google Scholar] [CrossRef] [PubMed]
  27. Hinoi, E.; Iezaki, T.; Fujita, H.; Watanabe, T.; Odaka, Y.; Ozaki, K.; Yoneda, Y. PI3K/Akt Is Involved in Brown Adipogenesis Mediated by Growth Differentiation Factor-5 in Association with Activation of the Smad Pathway. Biochem. Biophys. Res. Commun. 2014, 450, 255–260. [Google Scholar] [CrossRef] [PubMed]
  28. Nakamura, Y.; Hinoi, E.; Iezaki, T.; Takada, S.; Hashizume, S.; Takahata, Y.; Tsuruta, E.; Takahashi, S.; Yoneda, Y. Repression of Adipogenesis through Promotion of Wnt/β-Catenin Signaling by TIS7 up-Regulated in Adipocytes under Hypoxia. Biochim. Biophys. Acta 2013, 1832, 1117–1128. [Google Scholar] [CrossRef]
  29. Weerapana, E.; Imperiali, B. Asparagine-Linked Protein Glycosylation: From Eukaryotic to Prokaryotic Systems. Glycobiology 2006, 16, 91R–101R. [Google Scholar] [CrossRef]
  30. Takeda, Y.; Seko, A.; Hachisu, M.; Daikoku, S.; Izumi, M.; Koizumi, A.; Fujikawa, K.; Kajihara, Y.; Ito, Y. Both Isoforms of Human UDP-Glucose:Glycoprotein Glucosyltransferase Are Enzymatically Active. Glycobiology 2014, 24, 344–350. [Google Scholar] [CrossRef]
  31. Hale, J.S.; Otvos, B.; Sinyuk, M.; Alvarado, A.G.; Hitomi, M.; Stoltz, K.; Wu, Q.; Flavahan, W.; Levison, B.; Johansen, M.L.; et al. Cancer Stem Cell-Specific Scavenger Receptor CD36 Drives Glioblastoma Progression. Stem Cells 2014, 32, 1746–1758. [Google Scholar] [CrossRef] [PubMed]
  32. Bradshaw, A.; Wickremsekera, A.; Tan, S.T.; Peng, L.; Davis, P.F.; Itinteang, T. Cancer Stem Cell Hierarchy in Glioblastoma Multiforme. Front. Surg. 2016, 3, 21. [Google Scholar] [CrossRef] [PubMed]
  33. Son, M.J.; Woolard, K.; Nam, D.-H.; Lee, J.; Fine, H.A. SSEA-1 Is an Enrichment Marker for Tumor-Initiating Cells in Human Glioblastoma. Cell Stem Cell 2009, 4, 440–452. [Google Scholar] [CrossRef] [PubMed]
  34. Guo, M.; Luo, B.; Pan, M.; Li, M.; Zhao, F.; Dou, J. MUC1 Plays an Essential Role in Tumor Immunity of Colorectal Cancer Stem Cell Vaccine. Int. Immunopharmacol. 2020, 85, 106631. [Google Scholar] [CrossRef] [PubMed]
  35. Wang, J.; Wang, H.; Li, Z.; Wu, Q.; Lathia, J.D.; McLendon, R.E.; Hjelmeland, A.B.; Rich, J.N. C-Myc Is Required for Maintenance of Glioma Cancer Stem Cells. PLoS ONE 2008, 3, e3769. [Google Scholar] [CrossRef] [PubMed]
  36. Jin, X.; Jin, X.; Jung, J.-E.; Beck, S.; Kim, H. Cell Surface Nestin Is a Biomarker for Glioma Stem Cells. Biochem. Biophys. Res. Commun. 2013, 433, 496–501. [Google Scholar] [CrossRef] [PubMed]
  37. DeBerardinis, R.J.; Chandel, N.S. Fundamentals of Cancer Metabolism. Sci. Adv. 2016, 2, e1600200. [Google Scholar] [CrossRef] [PubMed]
  38. Kaur, J.; Bhattacharyya, S. Cancer Stem Cells: Metabolic Characterization for Targeted Cancer Therapy. Front. Oncol. 2021, 11, 756888. [Google Scholar] [CrossRef]
  39. Sighel, D.; Notarangelo, M.; Aibara, S.; Re, A.; Ricci, G.; Guida, M.; Soldano, A.; Adami, V.; Ambrosini, C.; Broso, F.; et al. Inhibition of Mitochondrial Translation Suppresses Glioblastoma Stem Cell Growth. Cell Rep. 2021, 35, 109024. [Google Scholar] [CrossRef]
  40. Hay, N. The Akt-mTOR Tango and Its Relevance to Cancer. Cancer Cell 2005, 8, 179–183. [Google Scholar] [CrossRef]
  41. Francipane, M.G.; Lagasse, E. Therapeutic Potential of mTOR Inhibitors for Targeting Cancer Stem Cells. Br. J. Clin. Pharmacol. 2016, 82, 1180–1188. [Google Scholar] [CrossRef] [PubMed]
  42. Mecca, C.; Giambanco, I.; Donato, R.; Arcuri, C. Targeting mTOR in Glioblastoma: Rationale and Preclinical/Clinical Evidence. Dis. Markers 2018, 2018, 9230479. [Google Scholar] [CrossRef] [PubMed]
  43. Sandoval, J.A.; Tomilov, A.; Datta, S.; Allen, S.; O’Donnell, R.; Sears, T.; Woolard, K.; Kovalskyy, D.; Angelastro, J.M.; Cortopassi, G. Novel mTORC1 Inhibitors Kill Glioblastoma Stem Cells. Pharmaceuticals 2020, 13, 419. [Google Scholar] [CrossRef] [PubMed]
  44. Liu, G.Y.; Sabatini, D.M. mTOR at the Nexus of Nutrition, Growth, Ageing and Disease. Nat. Rev. Mol. Cell Biol. 2020, 21, 183–203. [Google Scholar] [CrossRef] [PubMed]
  45. Zheng, H.; Ying, H.; Yan, H.; Kimmelman, A.C.; Hiller, D.J.; Chen, A.-J.; Perry, S.R.; Tonon, G.; Chu, G.C.; Ding, Z.; et al. Pten and P53 Converge on C-Myc to Control Differentiation, Self-Renewal, and Transformation of Normal and Neoplastic Stem Cells in Glioblastoma. Cold Spring Harb. Symp. Quant. Biol. 2008, 73, 427–437. [Google Scholar] [CrossRef] [PubMed]
  46. Lemjabbar-Alaoui, H.; McKinney, A.; Yang, Y.-W.; Tran, V.M.; Phillips, J.J. Glycosylation Alterations in Lung and Brain Cancer. Adv. Cancer Res. 2015, 126, 305–344. [Google Scholar] [CrossRef] [PubMed]
  47. Fukasawa, K.; Kadota, T.; Horie, T.; Tokumura, K.; Terada, R.; Kitaguchi, Y.; Park, G.; Ochiai, S.; Iwahashi, S.; Okayama, Y.; et al. CDK8 Maintains Stemness and Tumorigenicity of Glioma Stem Cells by Regulating the C-MYC Pathway. Oncogene 2021, 40, 2803–2815. [Google Scholar] [CrossRef]
  48. Hiraiwa, M.; Fukasawa, K.; Iezaki, T.; Sabit, H.; Horie, T.; Tokumura, K.; Iwahashi, S.; Murata, M.; Kobayashi, M.; Suzuki, A.; et al. SMURF2 Phosphorylation at Thr249 Modifies Glioma Stemness and Tumorigenicity by Regulating TGF-β Receptor Stability. Commun. Biol. 2022, 5, 22. [Google Scholar] [CrossRef]
  49. Huang, T.; Yang, Y.; Song, X.; Wan, X.; Wu, B.; Sastry, N.; Horbinski, C.M.; Zeng, C.; Tiek, D.; Goenka, A.; et al. PRMT6 Methylation of RCC1 Regulates Mitosis, Tumorigenicity, and Radiation Response of Glioblastoma Stem Cells. Mol. Cell 2021, 81, 1276–1291.e9. [Google Scholar] [CrossRef]
  50. Zhang, A.; Tao, W.; Zhai, K.; Fang, X.; Huang, Z.; Yu, J.S.; Sloan, A.E.; Rich, J.N.; Zhou, W.; Bao, S. Protein Sumoylation with SUMO1 Promoted by Pin1 in Glioma Stem Cells Augments Glioblastoma Malignancy. Neuro Oncol. 2020, 22, 1809–1821. [Google Scholar] [CrossRef]
  51. Bieberich, E. Synthesis, Processing, and Function of N-glycans in N-glycoproteins. Adv. Neurobiol. 2014, 9, 47–70. [Google Scholar] [CrossRef]
  52. Bieberich, E. Synthesis, Processing, and Function of N-Glycans in N-Glycoproteins. Adv. Neurobiol. 2023, 29, 65–93. [Google Scholar] [CrossRef] [PubMed]
  53. Esmail, S.; Manolson, M.F. Advances in Understanding N-Glycosylation Structure, Function, and Regulation in Health and Disease. Eur. J. Cell Biol. 2021, 100, 151186. [Google Scholar] [CrossRef] [PubMed]
  54. Xu, X.-X.; Li, S.-T.; Wang, N.; Kitajima, T.; Yoko-O, T.; Fujita, M.; Nakanishi, H.; Gao, X.-D. Structural and Functional Analysis of Alg1 Beta-1,4 Mannosyltransferase Reveals the Physiological Importance of Its Membrane Topology. Glycobiology 2018, 28, 741–753. [Google Scholar] [CrossRef] [PubMed]
  55. Li, S.-T.; Wang, N.; Xu, X.-X.; Fujita, M.; Nakanishi, H.; Kitajima, T.; Dean, N.; Gao, X.-D. Alternative Routes for Synthesis of N-Linked Glycans by Alg2 Mannosyltransferase. FASEB J. 2018, 32, 2492–2506. [Google Scholar] [CrossRef] [PubMed]
  56. Ng, B.G.; Shiryaev, S.A.; Rymen, D.; Eklund, E.A.; Raymond, K.; Kircher, M.; Abdenur, J.E.; Alehan, F.; Midro, A.T.; Bamshad, M.J.; et al. ALG1-CDG: Clinical and Molecular Characterization of 39 Unreported Patients. Hum. Mutat. 2016, 37, 653–660. [Google Scholar] [CrossRef] [PubMed]
Figure 1. N- and C-linked glycosylation pathways are enhanced in GSCs. (A) Schematic diagram of scRNA-seq and ssGSEA of GBM cells in GSE84465. (B) Uniform manifold approximation and projection (UMAP) plot of the seven identified clusters in GBM tissue. (C) Violin plot of canonical marker genes in each cell type. (D) Copy number variation (CNV) profile of cells from four patients. Red indicates amplifications, and blue indicates deletions. (E) UMAP plot showing the CSC-signaturehigh GBM (n = 105) and CSC-signaturelow GBM (n = 954) cells. (F) Gene set enrichment analysis (GSEA) plot of stemness (RAMALHO_STEMNESS_UP) and stem cell-related (BOQUEST_STEM_CELL_UP) gene sets in CSC-signaturehigh GBM cells. (G) Kaplan–Meier survival curve for the CSC-signaturehigh patient group (n = 333) and CSC-signaturelow patient group (n = 334) in the TCGA database (left) and the CSC-signaturehigh patient group (n = 491) and CSC-signaturelow patient group (n = 492) in the CGGA database (right). (H) GSEA of glycosylation-related gene sets in Gene Ontology Biological Process (GOBP) (* p < 0.05, ** p < 0.01, *** p < 0.001).
Biomedinformatics 04 00005 g001
Figure 2. N-linked glycosylation pathways are associated with poor prognosis of patients with glioma. (AH) Comparison of ssGSEA scores of N- and C-linked glycosylation pathways. (A) Normal tissues (n = 22) and GBM tissues (n = 107) in GSE33328, GSE48865, GSE59612, GSE62731, and GSE77530 (*** p < 0.001). (B) Normal tissues (n = 4) and GBM tissues (n = 156) in TCGA (*** p < 0.001). (C) Tissues exhibiting each grade of glioma in TCGA (Grade II, n = 226; Grade III, n = 244; Grade IV, n = 150) (*** p < 0.001). (D) Tissues exhibiting each grade of glioma in CGGA (Grade II, n = 291; Grade III, n = 334; Grade IV, n = 388) (* p < 0.05, *** p < 0.001, n.s.: not significant). (E) Wildtype (n = 142) and IDH mutant (n = 8) GBM tissues in TCGA (* p < 0.05, ** p < 0.01). (F) Wildtype (n = 288) and IDH mutant (n = 90) GBM tissues in CGGA (*** p < 0.001). (G) Tissues exhibiting each subtype of glioma in TCGA (Proneural, n = 163; Classical, n = 199; Mesenchymal, n = 166) (*** p < 0.001, n.s.: not significant). (H) Tissues exhibiting each subtype of glioma in CGGA (Proneural, n = 93; Classical, n = 106; Mesenchymal, n = 89) (*** p < 0.001, n.s.: not significant). (I) Kaplan–Meier survival curve for the glycosylation pathwayshigh patient group (n = 166) and glycosylation pathwayslow patient group (n = 167), in the CSC-signaturehigh patient group (n = 333) in the TCGA database. (J) Kaplan–Meier survival curve for the glycosylation pathwayshigh patient group (n = 245) and glycosylation pathwayslow patient group (n = 246), in the CSC-signaturehigh patient group (n = 491) in the CGGA database.
Biomedinformatics 04 00005 g002
Figure 3. The ALG enzyme family is upregulated in GSCs. (A) Differentially expressed genes (DEGs) related to the N-linked glycosylation pathway between CSC-signaturehigh GBM cells (n = 105) and CSC-signaturelow GBM cells (n = 954) (* p < 0.05, ** p < 0.01). (B) mRNA levels of ALG1, ALG2, ALG6, ALG7, and ALG12 in GL261 cells (n = 4) (* p < 0.05, ** p < 0.01, n.s.: not significant). (C) mRNA level of c-KIT in GL261 cells (n = 4) (*** p < 0.001) (DK) Comparison of ALG1, ALG2, ALG6, ALG7, or ALG12 expression. (D) Normal tissues (n = 22) and GBM tissues (n = 107) in GSE33328, GSE48865, GSE59612, GSE62731, and GSE77530 (*** p < 0.001). (E) Normal tissues (n = 4) and GBM tissues (n = 156) in TCGA (*** p < 0.001). (F) Tissues exhibiting each grade of glioma in TCGA (Grade II, n = 226; Grade III, n = 244; Grade IV, n = 150) (*** p < 0.001). (G) Tissues exhibiting each grade of glioma in CGGA (Grade II, n = 291; Grade III, n = 334; Grade IV, n = 388) (* p < 0.05, *** p < 0.001, n.s.: not significant). (H) Wildtype (n = 142) and IDH mutant (n = 8) GBM tissues in TCGA (* p < 0.05, *** p < 0.001, n.s.: not significant). (I) Wildtype (n = 288) and IDH mutant (n = 90) GBM tissues in CGGA (* p < 0.05, ** p < 0.01, *** p < 0.001, n.s.: not significant). (J) Tissues exhibiting each subtype of glioma tissues in TCGA (Proneural, n = 163; Classical, n = 199; Mesenchymal, n = 166) (*** p < 0.001, n.s.: not significant). (K) Tissues exhibiting each subtype of glioma in CGGA (Proneural, n = 93; Classical, n = 106; Mesenchymal, n = 89) (* p < 0.05, ** p < 0.01, *** p < 0.001, n.s.: not significant).
Biomedinformatics 04 00005 g003
Figure 4. ALG1 and 2 are associated with the stem cell properties of GSCs and poor prognosis of GBM. (A,B) Scatter plot of correlation analysis between ALG1 or ALG2 and GSC marker genes in GBM tissues (n = 107) in GSE33328, GSE48865, GSE59612, GSE62731, and GSE77530. (C,D) GSEA plot of stemness- and stem cell-related gene sets in ALG1- or ALG2-positive CSC-signaturehigh GBM cells. (E) Kaplan–Meier survival curve of ALG1- or ALG2-expressionhigh patient group (n = 166) and ALG1- or ALG2-expressionlow patient group (n = 167) in the CSC-signaturehigh patient group (n = 333) in the TCGA database. (F) Kaplan–Meier survival curve for ALG1- or ALG2-expressionhigh patient group (n = 245) and ALG1- or ALG2-expressionlow patient group (n = 246) in the CSC-signaturehigh patient group (n = 491) in the CGGA database.
Biomedinformatics 04 00005 g004
Figure 5. Oxidative phosphorylation pathway forms a link between GSC properties and ALG1 and 2. (A,B) GSEA of the Hallmark gene sets in ALG1- or ALG2-positive CSC-signaturehigh GBM cells (*** p < 0.001). (C,D) GSEA plot of GOBP- and Kyoto Encyclopedia of Genes and Genomes (KEGG)-oxidative phosphorylation pathway gene sets in ALG1- or ALG2-positive CSC-signaturehigh GBM cells.
Biomedinformatics 04 00005 g005
Disclaimer/Publisher’s Note: The statements, opinions and data contained in all publications are solely those of the individual author(s) and contributor(s) and not of MDPI and/or the editor(s). MDPI and/or the editor(s) disclaim responsibility for any injury to people or property resulting from any ideas, methods, instructions or products referred to in the content.

