Abstract
Diffuse large B-cell lymphoma is one of the most frequent mature B-cell hematological neoplasms and non-Hodgkin lymphomas. Despite advances in diagnosis and treatment, clinical evolution is unfavorable in a subset of patients. Using molecular techniques, several pathogenic models have been proposed, including cell-of-origin molecular classification; Hans’ classification and derivates; and the Schmitz, Chapuy, Lacy, Reddy, and Sha models. This study introduced different machine learning techniques and their classification. Later, several machine learning techniques and artificial neural networks were used to predict the DLBCL subtypes with high accuracy (100–95%), including Germinal center B-cell like (GCB), Activated B-cell like (ABC), Molecular high-grade (MHG), and Unclassified (UNC), in the context of the data released by the REMoDL-B trial. In order of accuracy (MHG vs. others), the techniques were XGBoost tree (100%); random trees (99.9%); random forest (99.5%); and C5, Bayesian network, SVM, logistic regression, KNN algorithm, neural networks, LSVM, discriminant analysis, CHAID, C&R tree, tree-AS, Quest, and XGBoost linear (99.4–91.1%). The inputs (predictors) were all the genes of the array and a set of 28 genes related to DLBCL-Burkitt differential expression. In summary, artificial intelligence (AI) is a useful tool for predictive analytics using gene expression data.
1. Introduction
1.1. Introduction to Artificial Intelligence Analysis
Varying kinds and degrees of intelligence occur in people, animals, and some machines. The birth of artificial intelligence (AI) dates back more than half a century. In Alan Turing’s seminal work, Computing Machinery and Intelligence [1], intelligence was defined as the computational part of the ability to achieve goals in the world. Alan Turing introduced the concept of digital computers as opposed to human computers.
A human computer is a person performing mathematical calculations. The term “computer” was used in the early 17th century but it was not until the 19th century that it became a profession. For example, the National Advisory Committee for Aeronautics (NACA) used human computers following World War II in flight research. Digital computers are machines intended to perform operations which could be performed by a human computer, in other words, systems that act like humans [1].
In 2007, John McCarthy from the Computer Science Department of Stanford University defined AI as “the science and engineering of making intelligent machines, especially intelligent computer programs” [2].
AI is a field that combines datasets with computer science to solve problems and to make predictions and classifications. There are two types of AI. Weak (narrow) AI is trained to perform specific tasks. Strong AI includes artificial general intelligence (AGI), which would theoretically be equal to humans including self-consciousness, and artificial super intelligence (ASI), which would surpass the ability of the human brain.
AI includes the subfields of machine learning and deep learning. Classical machine learning is more dependent on human intervention that determines the hierarchy of the features. Common machine learning algorithms are linear and logistic regression, clustering, and decision trees. On the other hand, deep learning does not necessarily require a labeled dataset and comprises neural networks, such as convolutional [3] and recurrent neural networks [4] (CNNs and RNNs, respectively). Generative AI refers to deep learning models that generate statistically probable outputs based on the raw data of images, speech, and other complex data. A well-known example is the Chat Generative Pre-Trained Transformer (ChatGPT).
Recent developments within AI have demonstrated the capability and potential of this technology on several applications including speech recognition, customer service, computer vision, recommendation engines, and automated stock trading.
1.2. Machine Learnig
Machine learning analysis aims to predict the characteristics of unknown data using a dataset of samples. Each sample can have one characteristic, or be multi-dimensional (i.e., multivariate). In general, there are two types of analyses: supervised and unsupervised learning [5,6,7,8,9,10,11].
Supervised learning is characterized by the presence of target variables and a series of predictors. It can be divided into classification and regression methods.
Unsupervised analysis is characterized by a series of cases with several characteristics (variables, inputs, predictors), but without a corresponding target (predicted) variable. The aim of unsupervised analyses is to identify similar groups within the data (clustering), to assess the distribution of the data (density estimation), or to simplify the high-dimensional data into a low-dimensional visualization of two or three dimensions [12].
The classification with examples of types of analysis is shown in Figure 1.

Figure 1.
Machine learning techniques and their classification. Artificial intelligence includes several types of machine learning analysis, including artificial neural networks. Generally, the learning analyses can be classified into supervised (used to classify data and make predictions) and unsupervised (used to understand relationships).
1.3. Types of Data Modeling in Predictive Analytics
AI is revolutionizing the medical field [13]. There are many AI applications in medicine such as disease detection and diagnosis, personalized disease treatment, medical imaging, clinical trials, and drug development. In the medical field, AI is a broad term that includes many types of machine learning analyses and neural networks (deep learning). Each method has certain strengths and is best suited for particular types of problems.
Supervised models use the values of one or more predictors (input fields) to predict the value of one or more predicted variables (target or output field). Some examples of these techniques are decision trees (C&R Tree, QUEST, CHAID, and C5.0 algorithms), regression (linear, logistic, generalized linear, and Cox regression algorithms), neural networks, Support Vector Machines, and Bayesian networks. Supervised models allow us to predict known results.
Association models identify patterns in the data where one or more entities are associated with one or more other entities. The models create rule sets that define these relationships. In this type of analysis, the variables can act as both inputs and targets, and complex patterns can be identified. Apriori, CARMA, and sequence detection are examples.
Segmentation models divide the data into segments or clusters that have similar patterns of input fields (variables). In these analyses, there is no concept of output, and the clustering is performed without prior knowledge about the groups and their characteristics. When clustering the data, there is no correct or incorrect solution. Their value is determined by finding interesting groups. Examples are two-step clusters, K-Means clusters, anomaly detection, and Kohonen networks.
This section classifies the AI methods into three groups: supervised (Table 1), association (Table 2), segmentation (Table 3), and additional techniques (Table 4). A brief description of the different types of analysis is made in the following sections.

Table 1.
Supervised analyses.

Table 2.
Association analyses.

Table 3.
Segmentation analyses.

Table 4.
Additional techniques.
1.3.1. Supervised Analyses
The Bayesian network is a visualization method that shows the variables of a dataset and the probabilistic independencies between them [14].
Classification and Regression (C&R) Tree generates a decision tree that allows us to predict or classify future observations. It can handle datasets with a large number of variables or missing data, and the results have quite a straightforward interpretation [15,16,17,18,19,20,21].
The C5.0 algorithm builds a decision tree (rule set) and predicts one categorical variable [15,16,17,18,19,20,21].
Chi-squared Automatic Interaction Detection (CHAID) identifies optimal splits by building decision trees and applying chi-square statistics. The first examines the crosstabulations between predictors and the outcome and calculates the significance. Unlike the C&R Tree and QUEST, CHAID can generate nonbinary trees (splits of more than two subgroups) [22,23,24].
Cox regression creates time-to-event data predictive models. It is a method for analyzing the effect of several variables on the occurrence of a particular event in time.
Discriminant analysis is a multivariate method that creates a predictive model, which separates groups of observations and calculates the contribution of each variable in the group [25].
The generalized linear (GenLin) model builds an equation that relates the predictors (and covariates) to the predicted variable. It includes several statistical models [26].
The Generalized Linear Mixed Model (GLMM) is an extension of the linear model; it is a flexible decision-tree method for multilevel and longitudinal data [27,28,29].
Nearest-Neighbor Analysis (KNN) classifies cases based on the similarity to other cases. Similar cases are near each other, but dissimilar cases are distant. Therefore, the distance between two cases is a measure of their dissimilarity. This method allows us to recognize patterns of data without requiring any exact match to any recorded pattern or cases [30,31].
Common linear regression is a statistical analysis that fits a straight line [25].
Logistic (nominal) regression is analogous to linear regression but with a categorical target variable (predictor) instead of a numeric one. The target variable can be binomial (two categories) or multinomial (more than two categories) [25].
Linear Support Vector Machine (LSVM) is useful to use with large datasets with many predictive variables. It is similar to SVM but linear and better in handling large amounts of data [32,33].
Neural networks are a simplified type of model that is based on the functional architecture of the nervous system. The process units are arranged into an input layer (predictors), one or more hidden layers, and an output layer (target fields). The network learns through training [34,35,36,37,38,39,40].
Quick, Unbiased, Efficient Statistical Tree (QUEST) is a binary classification method for building decision trees. It is faster than C&R Trees [41,42].
Random trees is a tree-based classification and prediction method that is based on the Classification and Regression Tree (C&R Tree) methodology [5,6,7,43].
The Self-Learning Response Model (SLRM) creates a model that can be continually updated, or re-estimated, as a dataset grows without having to rebuild the model every time using the complete dataset [12].
Spatio-Temporal Prediction (STP) analysis uses data that contain location data, predictors, a time variable, and a predicted variable. It can predict target values at any location [44,45].
Support Vector Machine (SVM) is a solid classification and regression technique that is useful when the database has very large numbers of predictors [46]. It maximizes the accuracy without overfitting the training data [47,48,49,50].
Temporal causal models (TCM) discover key causal relationships in time series data [51].
Tree-AS is a decision tree that can use either a CHAID or exhaustive CHAID analysis, based on crosstabulations between inputs and outcomes [16,17,40].
1.3.2. Association Analyses
Among the several types of association analyses, four types are worth mentioning: Apriori, Association Rules, CARMA, and Sequence (Table 2).
Apriori analysis searches Association Rules in the data, in the form of “if something happens, then there is a consequence”. It uses a sophisticated indexing scheme to process large datasets [52].
Association Rules associate a specific conclusion with a set of conditions. In comparison to standard decision tree algorithms such as the C5.0 and C&R trees, the associations can occur between any of the variables [53,54,55].
CARMA is similar to Apriori analysis but it does not require input (predictors) or target (predicted) fields (variables). Therefore, all variables are set at both [56].
Sequence analysis detects frequent sequences and makes predictions. It discovers patterns in sequential or time-oriented data. The sequences are item sets that form a single transaction [25].
1.3.3. Segmentation Analyses
Anomaly detection is an unsupervised method that identifies outlines in the data, for further analysis [57,58,59,60].
The K-Means method clusters the data into distinct groups that are fixed. It uses unsupervised learning to identify patterns in the input data [61,62,63,64].
Kohonen analysis generates a type of neural network that clusters the dataset into groups [65,66,67,68,69].
TwoStep is a type of cluster analysis. Similar to the K-Means and Kohonen methods, TwoStep does not have a target (predicted) variable. It tries to identify patterns of cases based on the predictors (input fields). The method has two steps. First, a single pass identifies subclusters. Then, the subclusters are merged into larger clusters. This method can handle mixed types of variables as well as large datasets. However, it cannot handle missing data [70,71,72,73].
1.3.4. Additional Analyses
Gaussian Mixture is a probabilistic model that implements the expectation–maximization (EM) algorithm [74] and determines clusters [75,76,77].
GLE analysis creates an equation that relates predictors with the predicted variables. One equation/algorithm is created that can estimate values for new data.
Hierarchical Density-Based Spatial Clustering (HDBSCAN) is an unsupervised method that finds clusters, or dense regions, of a dataset. In this type of unsupervised analysis, there is no target field (output, predicted variable), and the analysis tries to find patterns and clusters within the input variables [78,79,80,81].
Isotonic Regression [82] belongs to the family of regression algorithms [83,84].
Kernel Density Estimation (KDE) utilizes KD Tree or the Ball Tree algorithms for systematic inquiries [15]. It is a mixture of data modeling, unsupervised learning, and feature engineering (i.e., extraction and transformation of variables from raw data). Although KDE can include any number of variables and dimensions, it can result in a loss of performance [85,86,87,88].
The One-Class Support Vector Machine (SVM) is a type of unsupervised analysis. This learning algorithm can be used to identify novelty detection [89]. It is used for anomaly detection analysis that aims to identify unusual cases or unknown patterns in a dataset [90,91,92].
Random Forest is an implementation of a bagging algorithm that has a tree as a model [93]. It is a widely used algorithm of machine learning in which multiple decision trees are used to reach a final single result [94,95,96,97,98,99].
Time series creates and scores time series models. For each variable, an individual time series is created. This type of modeling requires a uniform interval between each measurement. Time series include exponential smoothing, the univariate Autoregressive Integrated Moving Average (ARIMA), or the multivariate ARIMA (or transfer function) [12,25].
Extreme Gradient Boosting (XGBoost) Linear is based on the gradient boosting algorithm, based on a linear model [100], and it is a supervised learning method [101].
Scalable and Flexible Gradient Boosting (XGBoost) Tree creates a sequential ensemble of tree models that work together to improve and determine the final output [101].
PCA/FA are powerful data-reduction analyses that allow us to decrease the complexity of the data. It includes Principal Component Analysis (PCA) and Factor Analysis (FA). PCA finds linear combinations of the predictors that best capture the variance in the entire set of variables, where the components are orthogonal (perpendicular) to each other. PA identifies underlying factors that explain the pattern of correlations within a set of observed fields. Both techniques aim to find a reduced, small number of derived variables that correctly summarize the information of the original set of predictors (fields) [102,103]. While PCA itself is unsupervised, it can be combined with supervised learning methods for tasks such as classification and regression.
1.4. Diffuse Large B-Cell Lymphoma
Diffuse large B-cell lymphoma (DLBCL) is one of the most frequent subtypes of non-Hodgkin lymphoma, representing around 25% of adult cases. It originates from B-lymphocytes of the germinal centers, or from the post-germinal center region. The molecular pathogenesis is complex, heterogeneous, and follows a multistep process [104,105,106,107,108,109,110,111,112]. The best characterized pathogenic changes include BCL6 aberrant expression, TP53 downregulation, BCL2 overexpression, MYC overexpression, immune evasion, abnormal lymphocyte trafficking, and an aberrant somatic hypermutation [113].
The gene expression of DLBCL has been extensively analyzed using gene expression microarray technology and immunohistochemistry. Based on the cell of origin, the cases can be classified into Germinal center B cell-like (GCB) that has a gene expression profile similar to the normal germinal center B cells; Activated B cell-like (ABC) that has a profile like the post-germinal center-activated B cells; and an Unclassified Type III heterogeneous group [104,105,106,107,108,109,110,111,112,113].
As a result of deep sequencing studies, several pathogenic models have been proposed:
- ➀
- Schmitz R. et al. identified four DLBCL subtypes: MCD (characterized by MYD88L265P and CD79B mutations), BN2 (BCL6 fusions and NOTCH2 mutations), N1 (NOTCH1 mutations), and EZB (EZH2 mutations and BCL2 translocations) [114].
- ➁
- Chapuy B. et al. identified five subtypes: a low-risk ABC-DLBCL subtype of extrafollicular/marginal zone origin; two different subtypes of GCB-DLBCLs characterized with different patients’ survival and targetable alterations; and an ABC/GCB-independent subtype with an inactivation of TP53, CDKN2A loss, and genomic instability [115].
- ➂
- Lacy S.E. et al. found six molecular subtypes: MYD88, BCL2, SOCS1/SGK1, TET2/SGK1, NOTCH2, and Unclassified [116].
- ➃
- Reddy A. et al. created a prognostic model with better performance than the conventional methods of the International Prognostic Index (IPI), cell of origin, and rearrangements of MYC and BCL2 [117].
- ➄
- Sha C. et al. defined Molecular high-grade B-cell lymphoma (MHG) using a gene expression-based machine learning classifier [118]. This MHG was applied to a clinical trial that tested the addition of bortezomib (proteasome inhibitor) to the conventional RCHOP therapy. This study found that the MHG group was biologically similar to the high-grade B-cell lymphoma of the Germinal center cell-of-origin subtype (proliferative and centroblasts), and partially with cases of MYC rearrangement [118].
- ➅
- This MHG gene expression profile was defined by genes of Burkitt lymphoma (BL), and conferred a bad prognosis of DLBCL [119]. The classifier was downloaded on github (https://github.com/Sharlene/BDC, accessed on 16 January 2024) and run on R statistical software [119]. Of note, the gene set tested in the classifier comprised 28 genes [119,120].
1.5. Aim of this Study
The aims of this study were to apply machine learning techniques, including artificial neural networks, on the diffuse large B-cell lymphoma REMoDLB dataset (GSE117556) [118] and to reverse engineer the gene expression-based classification into the defined subgroups of Activated B cell-like (ABC),Germinal center B cell-like (GCB), Molecular high-grade (MHG), and Unclassified.
2. Materials and Methods
2.1. Materials
The dataset GSE117556 was downloaded from the NCBI Gene Expression Omnibus webpage. This series of 928 DLBCL patients belonged to the REMoDLB clinical trial. The last update was 15 January 2019; contact name: Dr. Chulin Shar, University of Leeds, School of Mole&Cell Biology, United Kingdom [118].
The gene expression was assessed using the Illumina HumanHT-12 WG-DASL V4.0 R2 expression beadchip (GPL14951), with RNA extracted from formalin-fixed paraffin-embedded tissue samples (FFPET) [118]. Total RNA was extracted from 5 mm paraffin sections using the Ambion RecoverAll kit standard protocol. The standard Illumina hybridization protocol was used, and the arrays were scanned on a BeadArray reader. The data were normalized using lumi package in R [118].
The dataset of this study was a retrospective analysis of whole transcriptome data for 928 DLBCL patients from REMoDLB clinical trial, which identifies a subgroup of Molecular high-grade (MHG) class that presents centroblast-like gene expression, enriched for MYC rearrangement, double-hit (MYC rearrangement accompanied with BCL2 and/or BCL6 rearrangement), and associated with adverse clinical outcome.
Based on the cell-of-origin classification, 255/928 (27.5%) were Activated B-cell-like (ABC), 543/928 (58.5%) were Germinal center B-cell-like (GCB), and 130/928 (14%) were Unclassified (UNC). According to the Sha C. et al. classification of the REMoDLB study [118], 249/928 (26.8%) were ABC, 468/928 (50.4%) were GCB, 83/918 (8.9%) were MHG, and 128/928 (13.8%) were UNC. Correlation between the two classifications showed that the MHG subtype was mainly included in the GCB subtype, but some cases were included into the ABC and UNC subtypes (Table 5).

Table 5.
Correlation between cell-of-origin classifications.
Figure 2 shows the different gene expressions of the relevant markers of MYC, BCL2, BCL6, and CD10 (MME). The MHG group was characterized by a higher expression of MYC, BCL2 (with exception of the pairwise comparison with ABC), BCL6 (with exception of GCB), and CD10 (MME) (all p values < 0.05; pairwise comparisons).
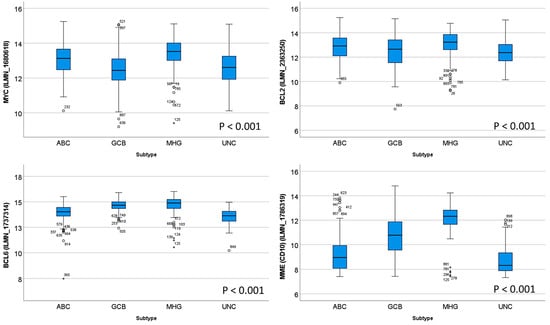
Figure 2.
Different gene expressions of MYC, BCL2, BCL6, and CD10 between subtypes. On the boxplot, the outliers are identified as “out” values (small circle), and “extreme” values (star).
Table 6 shows the clinicopathological characteristics of the REMoDLB study as described by C. Sha et al. [118]. Figure 3 shows the survival of the patients according to the molecular subtypes.

Table 6.
Clinicopathological characteristics of the series.

Figure 3.
Overall survival and progression-free survival according to the molecular subtypes of the REMoDLB study [118].
2.2. Methods
This was a supervised analysis of data classification. In this analysis, the input data (predictors) were the genes of the array, and the output (predicted or target variable) was the DLBCL subtypes as defined by the REMoDLB clinical trial such as Activated B cell-like (ABC), Germinal center B cell-like (GCB), Molecular high-grade (MHG), and Unclassified [118].
In the initial analysis, all genes of the array were used as predictors (inputs), and the results of the most relevant genes for predicting the molecular subtypes were ranked.
The characterization of the molecular profile of diffuse large B-cell lymphoma and Burkitt lymphoma, and the differentially expressed genes between both entities were extensively analyzed [121,122,123,124,125,126,127,128,129,130,131,132,133,134]. In this study, in addition to the whole set of genes of the array, a set of 28 genes were selected based on the previous work by Sandeep S Dave [122] and Chulin Sha [119]. The list of gene probes is shown in Appendix A and in the Discussion section. For example, genes associated with Burkitt lymphoma were SMARCA4, SLC35E3, SSBP2, MME, RGCCC, BMP7, and BACH2, and genes associated with diffuse large B-cell lymphoma were MDFIC, S100A11, BCL2A1, NFKBIA, and FNBP1, among others.
The principal analysis was an artificial neural network. The setup was the following: multilayer perceptron, DLBCL subtype as predicted variable (dependent variable, output), and gene expression as predictors (covariates, input). The covariates were rescaled following the standardized method.
The dataset was divided into 2 partitions. The training set accounted for 70% of the cases and the testing set accounted for 30%. There was no holdout. All 928 cases were valid, and none were excluded. The cases were assigned to each partition randomly. The number of units of the hidden layer was tested and selected. In the hidden layer, the activation function was the hyperbolic tangent. In the output layer, the activation function was softmax, and the error-function was cross-entropy. The type of training was batch, and the scaled conjugate gradient was selected as the optimization algorithm. The training options were initial lambda 0.0000005, initial sigma 0.00005, interval center 0, and interval offset ± 0.5. The synaptic weights were exported into an Excel file, and it is uploaded as Supplementary Table S1.
The network performance was evaluated using the following parameters: model summary, classification results, ROC curve, cumulative gains chart, lift chart, predicted-by-observed chart, and residual-by-predicted chart. The genes were ranked according to their relevance in predicting the DLBCL subtype using the independent variable importance analysis.
Other machine learning techniques were also used in this study, including C5, logistic regression, Bayesian network, discriminant analysis, KNN algorithm, LSVM, random trees, SVM, Tree-AS, XGBoost linear, XGBoost tree, CHAID, Quest, C&R tree, random forest, and neural network. All analyses were performed as previously described [98,99,135,136,137,138].
3. Results
3.1. Prediction of DLBCL Subtypes Using Neural Networks
3.1.1. Prediction Using All Genes of the Array
Using all the genes of the Illumina array, it was possible to predict the DLBCL subtypes with relatively good performance. All the characteristics of the neural network, including the architecture, model summary, classification, and performance with the area under the curve, are shown in Table 7 and Table 8 and Figure 4. Overall, the areas under the curve were above 0.85, with the highest for the MHG subtype (0.904). In the classification table, the best percentage of classification was for the GCB subtype (Table 8).

Table 7.
Neural network characteristics.

Table 8.
Classification of DLBCL subtype using all the genes.
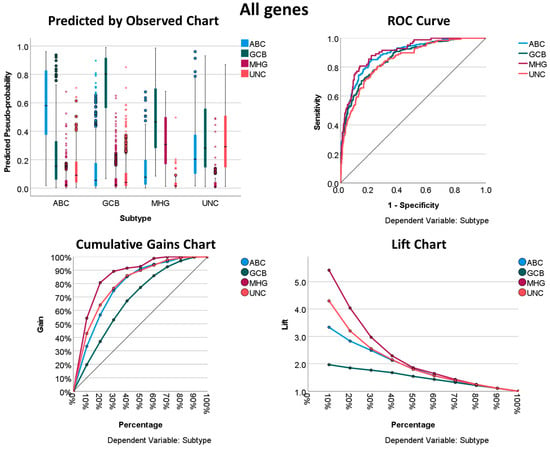
Figure 4.
Neural network performance using all genes of the array to predict the DLBCL subtype. The displayed results show how “good” the model is. The charts displayed are based on the combined training and testing samples. The predicted-by-observed chart data are displayed for each dependent (predicted, output) variable. The receiver operating characteristic (ROC) curve is shown for each categorical dependent variable. The ROC curves are used to compare the performance of the deep learning models. The ROC curve shows the relationship between the true positive rate (sensitivity) and the false positive rate (1-specificity). The area under the curve (AUC) ranges from 0 to 1, and larger AUC values indicate better performance. An AUC of 0.5 indicates no discriminative power. Recall/sensitivity/true positive rate (TPR) = True Positive/(True Positive + False Negative). Specificity = True Negative/(True Negative + False Positive). The cumulative gains chart displays the cumulative gains chart for each categorical dependent variable. The display of one curve for each dependent variable category is the same as that for ROC curves. The lift chart displays a lift chart for each categorical dependent variable. The display of one curve for each dependent variable category is the same as that for ROC curves.
3.1.2. Prediction Using the 28 Genes
Using the 28 genes of the Burkitt lymphoma vs. DLBCL signature, it was possible to predict the DLBCL subtypes with very good performance. All the characteristics of the neural network, including the architecture, model summary, classification, and performance with the area under the curve, are shown in Table 7, Table 8, Table 9 and Table 10 and Figure 5. Overall, the areas under the curve were above 0.93, with the highest for the MHG subtype (0.99). In the classification table, the best percentage of classification was for the MHG subtype (Table 9).

Table 9.
Classification of DLBCL subtype using the 28 genes.

Table 10.
Prediction of DLBCL subtypes using several machine learning techniques.
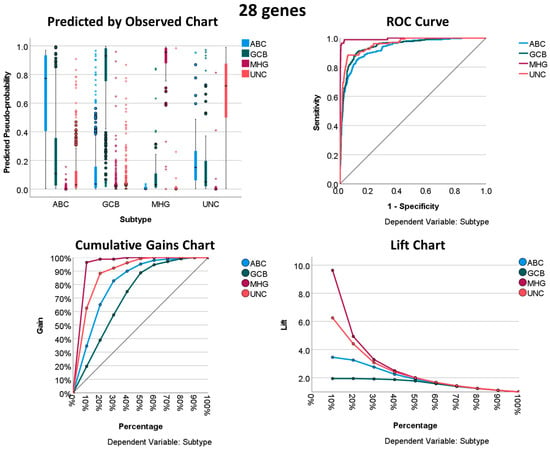
Figure 5.
Neural network performance using the 28 genes to predict the DLBCL subtype.
3.2. Prediction of DLBCL Subtypes Based on the 28 Genes Using Other Machine Learning Techniques
Using the 28 genes of the Burkitt lymphoma vs. DLBCL signature, it was possible to predict the DLBCL subtypes. The overall accuracies for each machine learning technique are shown in Table 10. Overall, the best performances were found using XGBoost tree (99.6% accuracy), random forest (98.9%), C5 (88.0%), and the Bayesian network (86.4%) (Table 8). Interestingly, the overall accuracies were very high (100–95% in most of the tests) when the analysis predicted the MHG subtypes against the other subtypes (Table 10, Figure 6). Figure A1, Figure A2, Figure A3, Figure A4, Figure A5, Figure A6 and Figure A7 in Appendix A and Appendix B show the results of MHG vs. Others for XGBoost tree, the Bayesian network, random forest, C5 tree, neural networks, functional network interaction analysis, and the approach to diagnosing diffuse large B-cell lymphoma, high-grade B-cell lymphomas, and Burkitt lymphoma, respectively, and Appendix B shows the logistic regression results.
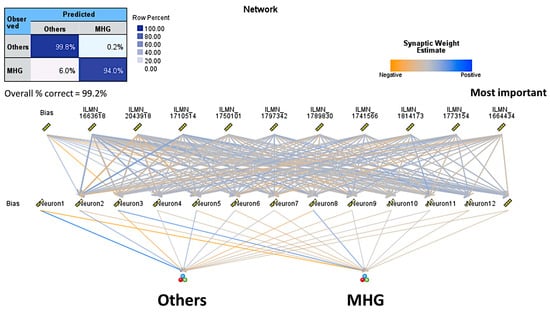
Figure 6.
Neural network architecture and classification table of the analysis of MHG subtype vs. the Others. In this model, the overall accuracy of prediction was 99.25%.
4. Discussion
Diffuse large B-cell lymphoma (DLBCL) is one of the most frequent non-Hodgkin lymphomas and mature B-cell hematological neoplasms. DLBCL belongs to the group of aggressive B-cell lymphomas.
In this group of aggressive lymphomas, there are many subtypes. Among them, it is worth mentioning the following: diffuse large B-cell lymphoma NOS, large B-cell lymphoma with 11q aberration, nodular lymphocyte predominant B-cell lymphoma, primary diffuse large B-cell lymphoma of the testis, HHV-8 and Epstein–Barr virus-negative primary effusion-based lymphoma, Epstein–Barr virus-positive mucocutaneous ulcer, Epstein–Barr virus-positive diffuse large B-cell lymphoma NOS, lymphomatoid granulomatosis, Epstein–Barr virus-positive polymorphic B-cell lymphoproliferative disorder NOS, primary effusion lymphoma and extracavitary primary effusion lymphoma, Burkitt lymphoma, high-grade B-cell lymphoma with MYC and BCL2 rearrangements, high-grade B-cell lymphoma with MYC and BCL6 rearrangements, and mediastinal gray-zone lymphoma [104,109].
From a histological point of view, the distinction between Burkitt lymphoma and diffuse large B-cell lymphoma NOS can be challenging sometimes. In this situation, the use of molecular techniques may be of help.
Several pathogenic models have been created for DLBCL NOS. Sha C. et al. defined Molecular high-grade B-cell lymphoma (MHG) using a gene expression-based machine learning classifier. This MHG was applied to the clinical trial of bortezomib (proteasome inhibitor) to the conventional RCHOP therapy. This study found that the MHG group was biologically similar to the high-grade B-cell lymphoma of the Germinal center cell-of-origin subtype (proliferative signature and centroblasts), and partially with cases of MYC rearrangement with or without BCL2 rearrangement [118,119,120].
This MHG gene expression profile was defined by genes of Burkitt lymphoma (BL) and conferred a bad prognosis of DLBCL. Recent data from the authors seem to support this fact [139,140]. Of note, the gene set tested in the original classifier comprised 28 genes [118,119,120]. The genes were associated with either Burkitt lymphoma or DLBCL NOS. The genes of Burkitt lymphoma were SMARCA4, SLC35E3, SSBP2, MME (CD10), RGCC, BMP7, BACH2, RFC3, DLEU1, TERT, TCF3, ID3, TCL6, LEF1, SUGCT (C7orf10), SOX11, and TUBA1A. The genes associated (overexpressed) with DLBCL NOS were MDFIC, S100A11, BCL2A1, NFKBIA, FNBP1, CTSH, CD40, STAT3, CD44, CFLAR, and BCL3 [118,119,120]. The fact that these genes were differentially expressed between Burkitt lymphoma and DLBCL highlights the importance of these genes in the disease pathogenesis. In future, the Molecular high-grade signature may be relevant for the assessment of the clinical outcome of lymphoma patients. Interestingly, other groups have already investigated the relevance of this signature and added new prognostic markers to the equation [141].
The molecular classification of diffuse large B-cell lymphoma (DLBCL), based on the cell of origin, is ABC, GCB, and Unclassified. The study of Chulin Sha proposed a different stratification, with the addition of the MHG subtype, but how the MHG subtype is defined is not so clear. Recently, Davies AJ et al. [140] published an update to the REMoDL-B clinical trial study with a 5-year follow-up, and they showed that in the MHG group, RB-CHOP had an advantage over R-CHOP treatment in terms of progression-free survival. Therefore, the definition of MHG seems to be clinically important.
The advantage of using a neural network is that in the final model, the network architecture, the weights (parameters), and the bias are known, and based on a sensitivity analysis, the most relevant genes can be highlighted. When using the 28 genes, the percentage of correct predictions was 93.5% in the training set and 83.3% in the testing set. In Section 3.1, many machine learning methods are included and the best overall accuracy was obtained using XGBoost tree (100%) when comparing MHG to the other subtypes. Of note, in this comparison, the neural network had an accuracy of 99.25%, as shown in Table 8 and Figure 4. In summary, the data highlight that the MHG group is related to genes expressed by the Burkitt signature and/or the different signature between Burkitt and DLBCL.
This research used several machine learning techniques including neural networks to reverse engineer the DLBCL subtype classification based on the previous MHG work. Several predictive analytic techniques were successfully used. Therefore, this study showed how powerful the artificial intelligence techniques are. However, AI has to be handled carefully and under precise conditions.
DLBCL is a heterogenous disease and, so far, many gene expression studies have been carried out. In recent years, as a result of combining transcriptomic and deep sequencing studies, several pathogenic models have been proposed: Schmitz R. et al. identified four DLBCL subtypes: MCD, BN2, N1, and EZB [114]. Chapuy B. et al. identified five subtypes [115]. Lacy S.E. et al. found six molecular subtypes: MYD88, BCL2, SOCS1/SGK1, TET2/SGK1, NOTCH2, and Unclassified [116]. Reddy A. et al. created a prognostic model with better performance than the conventional methods of the International Prognostic Index (IPI), cell of origin, and rearrangements of MYC and BCL2 [117]. Sha C. et al. defined Molecular high-grade B-cell lymphoma (MHG) using a gene expression-based machine learning classifier [118]. This study found that the MHG group was biologically similar to the high-grade B-cell lymphoma of the Germinal center cell-of-origin subtype (proliferative and centroblasts), and partially with cases of MYC rearrangement [118]. This MHG gene expression profile was defined by genes of Burkitt lymphoma (BL) and conferred a bad prognosis of DLBCL [119]. The classifier was downloaded on github (https://github.com/Sharlene/BDC, accessed on 16 January 2024) and run on R statistical software [119]. Of note, the gene set tested in the classifier comprised 28 genes [119,120].
There are many markers with prognostic value in DLBCL. Our group has highlighted some such as ENO3 [17,142], PTX3 and CD163 [143], RGS1 [144], CASP8 and TNFAIP8 [99], and AID [145]. All these markers will have to be validated in other series in future. To date, morphological features and the rearrangements of MYC, BCL2, and BCL6 by FISH appear to be the consensus classification criteria (Appendix B Figure A7).
In summary, this study described the most frequent machine learning techniques that can be applied in the medical field. And it showed how machine learning can be successfully applied in this study of hematological neoplasia.
Supplementary Materials
The following supporting information can be downloaded at https://www.mdpi.com/article/10.3390/biomedinformatics4010017/s1, Table S1: Estimates of parameters.
Author Contributions
Conceptualization, J.C.; formal analysis, J.C.; investigation, J.C., Y.Y.K., M.M., S.M., G.R., R.H. and N.N.; resources, N.N. and J.C.; writing—original draft preparation, J.C.; writing—review and editing, J.C. All authors have read and agreed to the published version of the manuscript.
Funding
This research was funded by the Ministry of Education, Culture, Sports, Science and Technology (MEXT), grant numbers KAKEN 23K06454, 15K19061, and 18K15100, and the Tokai University School of Medicine research incentive assistant plan (grant number 2021-B04). Rifat Hamoudi is funded by ASPIRE, the technology program management pillar of Abu Dhabi’s Advanced Technology Research Council (ATRC), via the ASPIRE Precision Medicine Research Institute Abu Dhabi (AS-PIREPMRIAD) award grant number VRI-20-10.
Institutional Review Board Statement
Not applicable.
Informed Consent Statement
Not applicable.
Data Availability Statement
The dataset GSE117556 was downloaded from the NCBI Gene Expression Omnibus webpage. All additional data are available upon request to Joaquim Carreras (joaquim.carreras@tokai-u.jp).
Acknowledgments
We are grateful for the creators of the GSE117556 dataset who publicly shared it to the rest of the scientific community.
Conflicts of Interest
The authors declare no conflicts of interest.
Appendix A
The 28 gene probes used as inputs for the machine learning and neural networks were the following: ILMN_1658143, ILMN_1659943, ILMN_1663618, ILMN_1664434, ILMN_1670695, ILMN_1679185, ILMN_1681641, ILMN_1710514, ILMN_1711608, ILMN_1717366, ILMN_1732296, ILMN_1741566, ILMN_1749521, ILMN_1750101, ILMN_1763011, ILMN_1769229, ILMN_1773154, ILMN_1773459, ILMN_1777439, ILMN_1784860, ILMN_1786319, ILMN_1789830, ILMN_1797342, ILMN_1814173, ILMN_2043918, ILMN_2058468, ILMN_2148819, ILMN_2213136, ILMN_2348788, ILMN_2367818, ILMN_2373119, ILMN_2390853, and ILMN_2401978.
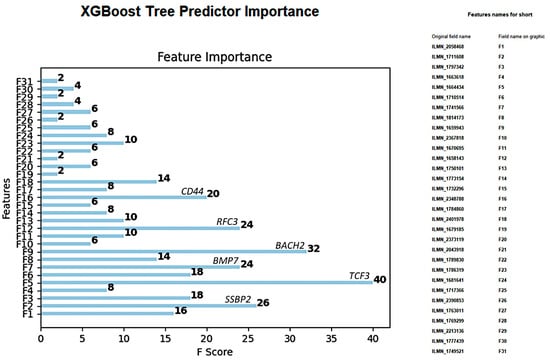
Figure A1.
XGBoost tree predictor importance of the 28 genes in the differentiation of MHG vs. the other subtypes.
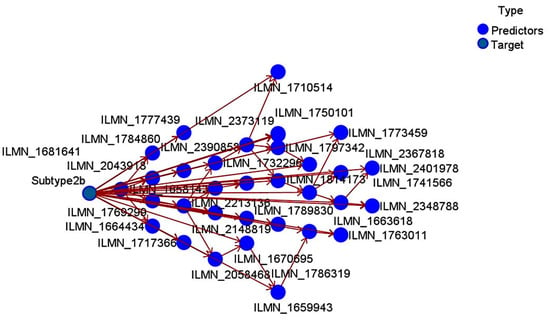
Figure A2.
Bayesian network of the 28 genes in the differentiation of MHG vs. the other subtypes.
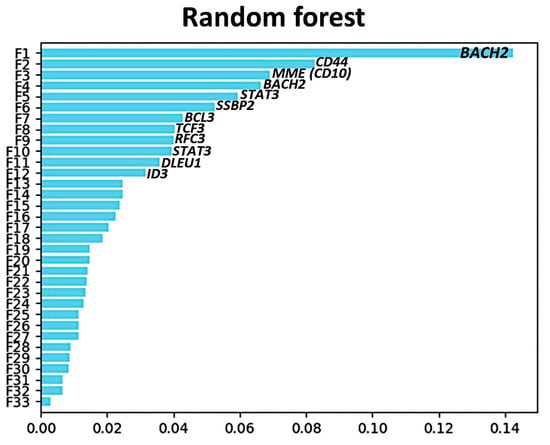
Figure A3.
Random forest predictor importance of the 28 genes in the differentiation of MHG vs. the other subtypes.
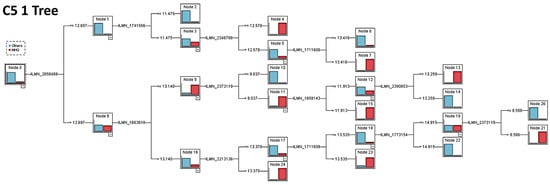
Figure A4.
C5 1 Tree of the 28 genes in the differentiation of MHG vs. the other subtypes.
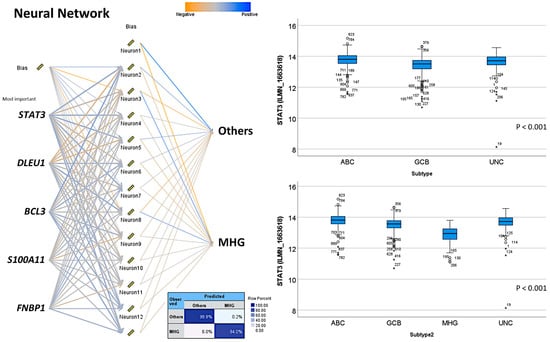
Figure A5.
Neural network of the 28 genes in the differentiation of MHG vs. the other subtypes (top 5 genes shown). On the boxplot, the outliers are identified as “out” values (small circle), and “extreme” values (star).
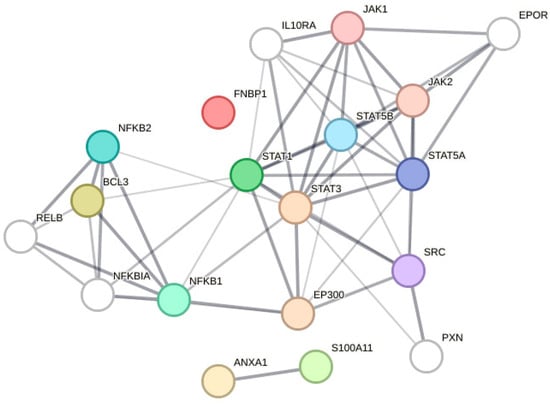
Figure A6.
Functional network association analysis of STA3, DLEU1, BCL3, S100A11, and FNBP1.
Appendix B. Logistic Regression
MHG vs. the other subtypes. Equation for MHG: 2.543 × ILMN_1658143 + 2.02 × ILMN_1659943 + −2.065 × ILMN_1663618 + 3.744 × ILMN_1664434 + 2.785 × ILMN_1670695 + 0.7026 × ILMN_1679185 + 0.3979 × ILMN_1681641 + −10.36 × ILMN_1710514 + 1.591 × ILMN_1711608 + 0.00611 × ILMN_1717366 + 4.074 × ILMN_1732296 + 5.556 × ILMN_1741566 + −1.02 × ILMN_1749521 + −17.06 × ILMN_1750101 + −1.292 × ILMN_1763011 + 3.113 × ILMN_1769299 + −18.76 × ILMN_1773154 + −0.4322 × ILMN_1773459 + 3.067 × ILMN_1777439 + 0.5264 × ILMN_1784860 + 2.364 × ILMN_1786319 + −6.706 × ILMN_1789830 + −7.649 × ILMN_1797342 + 11.0 × ILMN_1814173 + 5.908 × ILMN_2043918 + 1.886 × ILMN_2058468 + 2.979 × ILMN_2148819 + 4.354 × ILMN_2213136 + −1.964 × ILMN_2348788 + 2.109 × ILMN_2367818 + −0.5111 × ILMN_2373119 + −5.342 × ILMN_2390853 + −6.19 × ILMN_2401978 + + 418.9.
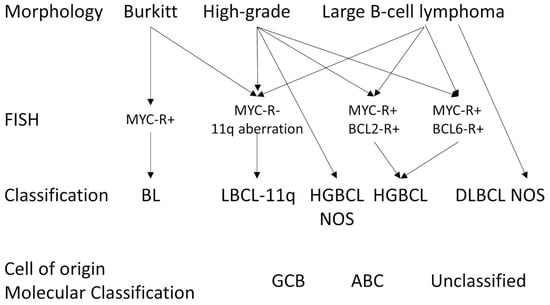
Figure A7.
Approach to diagnosing diffuse large B-cell lymphoma, high-grade B-cell lymphomas, and Burkitt lymphoma. Based on the work of de Leval et al. [105].
References
- Turing, A.M. Computer machinery and intelligence. Mind 1950, 49, 433–460. [Google Scholar] [CrossRef]
- McCarthy, J. John McCarthy’s Home Page. Available online: http://www-formal.stanford.edu/jmc/ (accessed on 20 November 2023).
- Anwar, S.M.; Majid, M.; Qayyum, A.; Awais, M.; Alnowami, M.; Khan, M.K. Medical Image Analysis using Convolutional Neural Networks: A Review. J. Med. Syst. 2018, 42, 226. [Google Scholar] [CrossRef]
- Mao, S.; Sejdic, E. A Review of Recurrent Neural Network-Based Methods in Computational Physiology. IEEE Trans. Neural Netw. Learn. Syst. 2023, 34, 6983–7003. [Google Scholar] [CrossRef]
- Montazeri, M.; Montazeri, M.; Montazeri, M.; Beigzadeh, A. Machine learning models in breast cancer survival prediction. Technol. Health Care 2016, 24, 31–42. [Google Scholar] [CrossRef] [PubMed]
- Rezayi, S.; Niakan Kalhori, S.R.; Saeedi, S. Effectiveness of Artificial Intelligence for Personalized Medicine in Neoplasms: A Systematic Review. BioMed Res. Int. 2022, 2022, 7842566. [Google Scholar] [CrossRef] [PubMed]
- Deist, T.M.; Dankers, F.; Valdes, G.; Wijsman, R.; Hsu, I.C.; Oberije, C.; Lustberg, T.; van Soest, J.; Hoebers, F.; Jochems, A.; et al. Machine learning algorithms for outcome prediction in (chemo)radiotherapy: An empirical comparison of classifiers. Med. Phys. 2018, 45, 3449–3459. [Google Scholar] [CrossRef] [PubMed]
- Poirion, O.B.; Jing, Z.; Chaudhary, K.; Huang, S.; Garmire, L.X. DeepProg: An ensemble of deep-learning and machine-learning models for prognosis prediction using multi-omics data. Genome Med. 2021, 13, 112. [Google Scholar] [CrossRef] [PubMed]
- Lynch, C.M.; Abdollahi, B.; Fuqua, J.D.; de Carlo, A.R.; Bartholomai, J.A.; Balgemann, R.N.; van Berkel, V.H.; Frieboes, H.B. Prediction of lung cancer patient survival via supervised machine learning classification techniques. Int. J. Med. Inform. 2017, 108, 1–8. [Google Scholar] [CrossRef]
- Sultan, A.S.; Elgharib, M.A.; Tavares, T.; Jessri, M.; Basile, J.R. The use of artificial intelligence, machine learning and deep learning in oncologic histopathology. J. Oral Pathol. Med. 2020, 49, 849–856. [Google Scholar] [CrossRef]
- Sidey-Gibbons, J.A.M.; Sidey-Gibbons, C.J. Machine learning in medicine: A practical introduction. BMC Med. Res. Methodol. 2019, 19, 64. [Google Scholar] [CrossRef]
- Pedregosa, F.; Varoquaux, G.; Gramfort, A.; Michel, V.; Thirion, B.; Grisel, O.; Blondel, M.; Prettenhofer, P.; Weiss, R.; Vincent Dubourg, V.; et al. Scikit-learn: Machine Learning in Python. J. Mach. Learn. Res. 2011, 12, 2825–2830. [Google Scholar]
- Hudson, I.L. Data Integration Using Advances in Machine Learning in Drug Discovery and Molecular Biology. Methods Mol. Biol. 2021, 2190, 167–184. [Google Scholar] [CrossRef] [PubMed]
- Sugahara, S.; Aomi, I.; Ueno, M. Bayesian Network Model Averaging Classifiers by Subbagging. Entropy 2022, 24, 743. [Google Scholar] [CrossRef] [PubMed]
- “User Guide”. Kernel Density Estimation (KDE). Web. © 2007–2018, Scikit-Learn Developers. Available online: http://scikit-learn.org/stable/modules/density.html#kernel-density-estimation (accessed on 20 November 2023).
- Carreras, J. Artificial Intelligence Analysis of Ulcerative Colitis Using an Autoimmune Discovery Transcriptomic Panel. Healthcare 2022, 10, 1476. [Google Scholar] [CrossRef]
- Carreras, J.; Roncador, G.; Hamoudi, R. Artificial Intelligence Predicted Overall Survival and Classified Mature B-Cell Neoplasms Based on Immuno-Oncology and Immune Checkpoint Panels. Cancers 2022, 14, 5318. [Google Scholar] [CrossRef]
- Asadi, F.; Salehnasab, C.; Ajori, L. Supervised Algorithms of Machine Learning for the Prediction of Cervical Cancer. J. Biomed. Phys. Eng. 2020, 10, 513–522. [Google Scholar] [CrossRef]
- Jiang, T.; Gradus, J.L.; Rosellini, A.J. Supervised Machine Learning: A Brief Primer. Behav. Ther. 2020, 51, 675–687. [Google Scholar] [CrossRef]
- Pruneski, J.A.; Pareek, A.; Kunze, K.N.; Martin, R.K.; Karlsson, J.; Oeding, J.F.; Kiapour, A.M.; Nwachukwu, B.U.; Williams, R.J., 3rd. Supervised machine learning and associated algorithms: Applications in orthopedic surgery. Knee Surg. Sports Traumatol. Arthrosc. 2023, 31, 1196–1202. [Google Scholar] [CrossRef]
- Uddin, S.; Khan, A.; Hossain, M.E.; Moni, M.A. Comparing different supervised machine learning algorithms for disease prediction. BMC Med. Inform. Decis. Mak. 2019, 19, 281. [Google Scholar] [CrossRef]
- Kobayashi, D.; Takahashi, O.; Arioka, H.; Koga, S.; Fukui, T. A prediction rule for the development of delirium among patients in medical wards: Chi-Square Automatic Interaction Detector (CHAID) decision tree analysis model. Am. J. Geriatr. Psychiatry 2013, 21, 957–962. [Google Scholar] [CrossRef]
- Lee, V.J.; Lye, D.C.; Sun, Y.; Leo, Y.S. Decision tree algorithm in deciding hospitalization for adult patients with dengue haemorrhagic fever in Singapore. Trop. Med. Int. Health 2009, 14, 1154–1159. [Google Scholar] [CrossRef] [PubMed]
- Song, Y.Y.; Lu, Y. Decision tree methods: Applications for classification and prediction. Shanghai Arch. Psychiatry 2015, 27, 130–135. [Google Scholar] [CrossRef] [PubMed]
- Algorithms Guide. IBM SPSS Modeler 18.4. IBM® SPSS® Modeler Is the IBM Corp. Orchard Rd, Armonk, NY 10504, United States. © Copyright IBM Corporation 1994, 2022. Available online: http://www.ibm.com/support (accessed on 16 January 2024).
- Chylinska, J.; Lazarewicz, M.; Rzadkiewicz, M.; Adamus, M.; Jaworski, M.; Haugan, G.; Lillefjel, M.; Espnes, G.A.; Wlodarczyk, D. The role of gender in the active attitude toward treatment and health among older patients in primary health care-self-assessed health status and sociodemographic factors as moderators. BMC Geriatr. 2017, 17, 284. [Google Scholar] [CrossRef] [PubMed]
- Fokkema, M.; Smits, N.; Zeileis, A.; Hothorn, T.; Kelderman, H. Detecting treatment-subgroup interactions in clustered data with generalized linear mixed-effects model trees. Behav. Res. Methods 2018, 50, 2016–2034. [Google Scholar] [CrossRef] [PubMed]
- Fokkema, M.; Edbrooke-Childs, J.; Wolpert, M. Generalized linear mixed-model (GLMM) trees: A flexible decision-tree method for multilevel and longitudinal data. Psychother. Res. 2021, 31, 313–325. [Google Scholar] [CrossRef]
- Chen, H.C.; Wehrly, T.E. Assessing correlation of clustered mixed outcomes from a multivariate generalized linear mixed model. Stat. Med. 2015, 34, 704–720. [Google Scholar] [CrossRef]
- Parry, R.M.; Jones, W.; Stokes, T.H.; Phan, J.H.; Moffitt, R.A.; Fang, H.; Shi, L.; Oberthuer, A.; Fischer, M.; Tong, W.; et al. k-Nearest neighbor models for microarray gene expression analysis and clinical outcome prediction. Pharmacogenom. J. 2010, 10, 292–309. [Google Scholar] [CrossRef]
- Rajaguru, H.; Sannasi Chakravarthy, S.R. Analysis of Decision Tree and K-Nearest Neighbor Algorithm in the Classification of Breast Cancer. Asian Pac. J. Cancer Prev. 2019, 20, 3777–3781. [Google Scholar] [CrossRef]
- Marston, Z.P.D.; Cira, T.M.; Knight, J.F.; Mulla, D.; Alves, T.M.; Hodgson, E.W.; Ribeiro, A.V.; MacRae, I.V.; Koch, R.L. Linear Support Vector Machine Classification of Plant Stress From Soybean Aphid (Hemiptera: Aphididae) Using Hyperspectral Reflectance. J. Econ. Entomol. 2022, 115, 1557–1563. [Google Scholar] [CrossRef]
- Razaque, A.; Ben Haj Frej, M.; Almi’ani, M.; Alotaibi, M.; Alotaibi, B. Improved Support Vector Machine Enabled Radial Basis Function and Linear Variants for Remote Sensing Image Classification. Sensors 2021, 21, 4431. [Google Scholar] [CrossRef]
- Zhang, H.; Luo, Y.B.; Wu, W.; Zhang, L.; Wang, Z.; Dai, Z.; Feng, S.; Cao, H.; Cheng, Q.; Liu, Z. The molecular feature of macrophages in tumor immune microenvironment of glioma patients. Comput. Struct. Biotechnol. J. 2021, 19, 4603–4618. [Google Scholar] [CrossRef] [PubMed]
- O’Neill, M.C.; Song, L. Neural network analysis of lymphoma microarray data: Prognosis and diagnosis near-perfect. BMC Bioinform. 2003, 4, 13. [Google Scholar] [CrossRef]
- Xia, W.; Hu, B.; Li, H.; Shi, W.; Tang, Y.; Yu, Y.; Geng, C.; Wu, Q.; Yang, L.; Yu, Z.; et al. Deep Learning for Automatic Differential Diagnosis of Primary Central Nervous System Lymphoma and Glioblastoma: Multi-Parametric Magnetic Resonance Imaging Based Convolutional Neural Network Model. J. Magn. Reson. Imaging 2021, 54, 880–887. [Google Scholar] [CrossRef] [PubMed]
- Fang, J.; Chen, Z. Evaluation of Short-Term Efficacy of PD-1 Monoclonal Antibody Immunotherapy for Lymphoma by Positron Emission Tomography/Computed Tomography Imaging with Convolutional Neural Network Image Registration Algorithm. Contrast Media Mol. Imaging 2022, 2022, 1388517. [Google Scholar] [CrossRef] [PubMed]
- Hu, H.; Zhao, H.; Zhong, T.; Dong, X.; Wang, L.; Han, P.; Li, Z. Adaptive deep propagation graph neural network for predicting miRNA-disease associations. Brief. Funct. Genom. 2023, 22, 453–462. [Google Scholar] [CrossRef] [PubMed]
- Shen, T.; Wang, H.; Hu, R.; Lv, Y. Developing neural network diagnostic models and potential drugs based on novel identified immune-related biomarkers for celiac disease. Hum. Genom. 2023, 17, 76. [Google Scholar] [CrossRef] [PubMed]
- Carreras, J. Artificial Intelligence Analysis of Celiac Disease Using an Autoimmune Discovery Transcriptomic Panel Highlighted Pathogenic Genes including BTLA. Healthcare 2022, 10, 1550. [Google Scholar] [CrossRef] [PubMed]
- Carreras, J.; Nakamura, N.; Hamoudi, R. Artificial Intelligence Analysis of Gene Expression Predicted the Overall Survival of Mantle Cell Lymphoma and a Large Pan-Cancer Series. Healthcare 2022, 10, 155. [Google Scholar] [CrossRef]
- Carreras, J.; Hiraiwa, S.; Kikuti, Y.Y.; Miyaoka, M.; Tomita, S.; Ikoma, H.; Ito, A.; Kondo, Y.; Roncador, G.; Garcia, J.F.; et al. Artificial Neural Networks Predicted the Overall Survival and Molecular Subtypes of Diffuse Large B-Cell Lymphoma Using a Pancancer Immune-Oncology Panel. Cancers 2021, 13, 6384. [Google Scholar] [CrossRef]
- Cutler, D.R.; Edwards, T.C., Jr.; Beard, K.H.; Cutler, A.; Hess, K.T.; Gibson, J.; Lawler, J.J. Random forests for classification in ecology. Ecology 2007, 88, 2783–2792. [Google Scholar] [CrossRef]
- Lawson, A.; Rotejanaprasert, C. Bayesian Spatio-Temporal Prediction and Counterfactual Generation: An Application in Non-Pharmaceutical Interventions in COVID-19. Viruses 2023, 15, 325. [Google Scholar] [CrossRef] [PubMed]
- Amato, F.; Guignard, F.; Robert, S.; Kanevski, M. A novel framework for spatio-temporal prediction of environmental data using deep learning. Sci. Rep. 2020, 10, 22243. [Google Scholar] [CrossRef] [PubMed]
- Sphinx 6.6.6. Imbalanced-Learn Documentation. Available online: https://imbalanced-learn.org/stable/ (accessed on 20 November 2023).
- Huang, S.; Cai, N.; Pacheco, P.P.; Narrandes, S.; Wang, Y.; Xu, W. Applications of Support Vector Machine (SVM) Learning in Cancer Genomics. Cancer Genom. Proteom. 2018, 15, 41–51. [Google Scholar] [CrossRef]
- Noble, W.S. What is a support vector machine? Nat. Biotechnol. 2006, 24, 1565–1567. [Google Scholar] [CrossRef] [PubMed]
- Moosaei, H.; Ganaie, M.A.; Hladik, M.; Tanveer, M. Inverse free reduced universum twin support vector machine for imbalanced data classification. Neural Netw. 2023, 157, 125–135. [Google Scholar] [CrossRef] [PubMed]
- Elshewey, A.M.; Shams, M.Y.; El-Rashidy, N.; Elhady, A.M.; Shohieb, S.M.; Tarek, Z. Bayesian Optimization with Support Vector Machine Model for Parkinson Disease Classification. Sensors 2023, 23, 2085. [Google Scholar] [CrossRef] [PubMed]
- Riva, A.; Bellazzi, R. Learning temporal probabilistic causal models from longitudinal data. Artif. Intell. Med. 1996, 8, 217–234. [Google Scholar] [CrossRef] [PubMed]
- Guo, X.; Zhao, B.; Chen, T.; Hao, B.; Yang, T.; Xu, H. Multimorbidity in the elderly in China based on the China Health and Retirement Longitudinal Study. PLoS ONE 2021, 16, e0255908. [Google Scholar] [CrossRef]
- Li, Q.; Zhang, Y.; Kang, H.; Xin, Y.; Shi, C. Mining association rules between stroke risk factors based on the Apriori algorithm. Technol. Health Care 2017, 25, 197–205. [Google Scholar] [CrossRef]
- Martinez, A.; Cuesta, M.J.; Peralta, V. Dependence Graphs Based on Association Rules to Explore Delusional Experiences. Multivar. Behav. Res. 2022, 57, 458–477. [Google Scholar] [CrossRef]
- Manolitsis, I.; Feretzakis, G.; Tzelves, L.; Kalles, D.; Loupelis, E.; Katsimperis, S.; Kosmidis, T.; Anastasiou, A.; Koutsouris, D.; Kofopoulou, S.; et al. Using Association Rules in Antimicrobial Resistance in Stone Disease Patients. Stud. Health Technol. Inform. 2022, 295, 462–465. [Google Scholar] [CrossRef] [PubMed]
- Hu, L. Research on English Achievement Analysis Based on Improved CARMA Algorithm. Comput. Intell. Neurosci. 2022, 2022, 8687879. [Google Scholar] [CrossRef] [PubMed]
- Luo, G.; Xie, W.; Gao, R.; Zheng, T.; Chen, L.; Sun, H. Unsupervised anomaly detection in brain MRI: Learning abstract distribution from massive healthy brains. Comput. Biol. Med. 2023, 154, 106610. [Google Scholar] [CrossRef] [PubMed]
- Duong, H.T.; Le, V.T.; Hoang, V.T. Deep Learning-Based Anomaly Detection in Video Surveillance: A Survey. Sensors 2023, 23, 5024. [Google Scholar] [CrossRef] [PubMed]
- Tritscher, J.; Krause, A.; Hotho, A. Feature relevance XAI in anomaly detection: Reviewing approaches and challenges. Front. Artif. Intell. 2023, 6, 1099521. [Google Scholar] [CrossRef]
- Deng, H.; Li, X. Self-supervised Anomaly Detection with Random-shape Pseudo-outliers. In Proceedings of the 2022 44th Annual International Conference of the IEEE Engineering in Medicine & Biology Society (EMBC), Glasgow, UK, 11–15 July 2022. [Google Scholar] [CrossRef]
- Demidenko, E. The next-generation K-means algorithm. Stat. Anal. Data Min. 2018, 11, 153–166. [Google Scholar] [CrossRef] [PubMed]
- McLachlan, G.J.; Bean, R.W.; Ng, S.K. Clustering. Methods Mol. Biol. 2017, 1526, 345–362. [Google Scholar] [CrossRef] [PubMed]
- Krishna, K.; Narasimha Murty, M. Genetic K-means algorithm. IEEE Trans. Syst. Man. Cybern. B Cybern. 1999, 29, 433–439. [Google Scholar] [CrossRef]
- Timmerman, M.E.; Ceulemans, E.; De Roover, K.; Van Leeuwen, K. Subspace K-means clustering. Behav. Res. Methods 2013, 45, 1011–1023. [Google Scholar] [CrossRef]
- Andras, P. Kernel-Kohonen networks. Int. J. Neural Syst. 2002, 12, 117–135. [Google Scholar] [CrossRef]
- Fort, J.C. SOM’s mathematics. Neural Netw. 2006, 19, 812–816. [Google Scholar] [CrossRef] [PubMed]
- Biehl, M.; Hammer, B.; Villmann, T. Prototype-based models in machine learning. Wiley Interdiscip. Rev. Cogn. Sci. 2016, 7, 92–111. [Google Scholar] [CrossRef] [PubMed]
- Miranda, E.; Sune, J. Memristors for Neuromorphic Circuits and Artificial Intelligence Applications. Materials 2020, 13, 938. [Google Scholar] [CrossRef] [PubMed]
- Baskin, I.I. Machine Learning Methods in Computational Toxicology. Methods Mol. Biol. 2018, 1800, 119–139. [Google Scholar] [CrossRef] [PubMed]
- Mahon, C.; Howard, E.; O’Reilly, A.; Dooley, B.; Fitzgerald, A. A cluster analysis of health behaviours and their relationship to mental health difficulties, life satisfaction and functioning in adolescents. Prev. Med. 2022, 164, 107332. [Google Scholar] [CrossRef] [PubMed]
- Kent, P.; Jensen, R.K.; Kongsted, A. A comparison of three clustering methods for finding subgroups in MRI, SMS or clinical data: SPSS TwoStep Cluster analysis, Latent Gold and SNOB. BMC Med. Res. Methodol. 2014, 14, 113. [Google Scholar] [CrossRef] [PubMed]
- Klontzas, M.E.; Volitakis, E.; Aydingoz, U.; Chlapoutakis, K.; Karantanas, A.H. Machine learning identifies factors related to early joint space narrowing in dysplastic and non-dysplastic hips. Eur. Radiol. 2022, 32, 542–550. [Google Scholar] [CrossRef]
- Mirshahi, R.; Naseripour, M.; Shojaei, A.; Heirani, M.; Alemzadeh, S.A.; Moodi, F.; Anvari, P.; Falavarjani, K.G. Differentiating a pachychoroid and healthy choroid using an unsupervised machine learning approach. Sci. Rep. 2022, 12, 16323. [Google Scholar] [CrossRef]
- “User Guide” Gaussian Mixture Modeling Algorithms. Available online: http://scikit-learn.org/stable/modules/mixture.html (accessed on 20 November 2023).
- Xu, J.; Xu, J.; Meng, Y.; Lu, C.; Cai, L.; Zeng, X.; Nussinov, R.; Cheng, F. Graph embedding and Gaussian mixture variational autoencoder network for end-to-end analysis of single-cell RNA sequencing data. Cell Rep. Methods 2023, 3, 100382. [Google Scholar] [CrossRef]
- McCaw, Z.R.; Aschard, H.; Julienne, H. Fitting Gaussian mixture models on incomplete data. BMC Bioinform. 2022, 23, 208. [Google Scholar] [CrossRef]
- Kasa, S.R.; Bhattacharya, S.; Rajan, V. Gaussian mixture copulas for high-dimensional clustering and dependency-based subtyping. Bioinformatics 2020, 36, 621–628. [Google Scholar] [CrossRef] [PubMed]
- Melvin, R.L.; Xiao, J.; Godwin, R.C.; Berenhaut, K.S.; Salsbury, F.R., Jr. Visualizing correlated motion with HDBSCAN clustering. Protein Sci. 2018, 27, 62–75. [Google Scholar] [CrossRef] [PubMed]
- Ye, J.Y.; Yu, C.; Husman, T.; Chen, B.; Trikala, A. Novel strategy for applying hierarchical density-based spatial clustering of applications with noise towards spectroscopic analysis and detection of melanocytic lesions. Melanoma Res. 2021, 31, 526–532. [Google Scholar] [CrossRef] [PubMed]
- Malzer, C.; Baum, M. Constraint-Based Hierarchical Cluster Selection in Automotive Radar Data. Sensors 2021, 21, 3410. [Google Scholar] [CrossRef] [PubMed]
- Chel, S.; Gare, S.; Giri, L. Detection of Specific Templates in Calcium Spiking in HeLa Cells Using Hierarchical DBSCAN: Clustering and Visualization of CellDrug Interaction at Multiple Doses. In Proceedings of the 2020 42nd Annual International Conference of the IEEE Engineering in Medicine & Biology Society (EMBC), Montreal, QC, Canada, 20–24 July 2020. [Google Scholar] [CrossRef]
- Isotonic Regression. Regression—RDD-Based API. Apache Spark. MLlib: Main Guide. Available online: https://spark.apache.org/docs/2.2.0/mllib-isotonic-regression.html (accessed on 20 November 2023).
- Li, W.; Fu, H. Bayesian isotonic regression dose-response model. J. Biopharm. Stat. 2017, 27, 824–833. [Google Scholar] [CrossRef] [PubMed]
- Oh, J.; Park, S.Y.; Lee, S.Y.; Song, J.Y.; Lee, G.Y.; Park, J.H.; Joe, H.B. Determination of the 95% effective dose of remimazolam to achieve loss of consciousness during anesthesia induction in different age groups. Korean J. Anesthesiol. 2022, 75, 510–517. [Google Scholar] [CrossRef] [PubMed]
- Fortmann-Roe, S.; Starfield, R.; Getz, W.M. Contingent kernel density estimation. PLoS ONE 2012, 7, e30549. [Google Scholar] [CrossRef] [PubMed]
- Lindstrom, M.R.; Jung, H.; Larocque, D. Functional Kernel Density Estimation: Point and Fourier Approaches to Time Series Anomaly Detection. Entropy 2020, 22, 1363. [Google Scholar] [CrossRef]
- Yee, J.; Park, T.; Park, M. Identification of the associations between genes and quantitative traits using entropy-based kernel density estimation. Genom. Inform. 2022, 20, e17. [Google Scholar] [CrossRef]
- Pardo, A.; Real, E.; Krishnaswamy, V.; Lopez-Higuera, J.M.; Pogue, B.W.; Conde, O.M. Directional Kernel Density Estimation for Classification of Breast Tissue Spectra. IEEE Trans. Med. Imaging 2017, 36, 64–73. [Google Scholar] [CrossRef]
- Smola, A.J.; Schölkopf, B. A Tutorial on Support Vector Regression. Stat. Comput. Arch. 2004, 14, 199–222. [Google Scholar] [CrossRef]
- Liu, X.; Ouellette, S.; Jamgochian, M.; Liu, Y.; Rao, B. One-class machine learning classification of skin tissue based on manually scanned optical coherence tomography imaging. Sci. Rep. 2023, 13, 867. [Google Scholar] [CrossRef] [PubMed]
- Retico, A.; Gori, I.; Giuliano, A.; Muratori, F.; Calderoni, S. One-Class Support Vector Machines Identify the Language and Default Mode Regions As Common Patterns of Structural Alterations in Young Children with Autism Spectrum Disorders. Front. Neurosci. 2016, 10, 306. [Google Scholar] [CrossRef] [PubMed]
- Teufl, W.; Taetz, B.; Miezal, M.; Dindorf, C.; Frohlich, M.; Trinler, U.; Hogan, A.; Bleser, G. Automated detection and explainability of pathological gait patterns using a one-class support vector machine trained on inertial measurement unit based gait data. Clin. Biomech. 2021, 89, 105452. [Google Scholar] [CrossRef] [PubMed]
- Scikit Learn. Random Forests and Other Randomized Tree Ensembles. Available online: https://scikit-learn.org/stable/modules/ensemble.html#forest (accessed on 20 November 2023).
- Rigatti, S.J. Random Forest. J. Insur. Med. 2017, 47, 31–39. [Google Scholar] [CrossRef] [PubMed]
- Yang, L.; Wu, H.; Jin, X.; Zheng, P.; Hu, S.; Xu, X.; Yu, W.; Yan, J. Study of cardiovascular disease prediction model based on random forest in eastern China. Sci. Rep. 2020, 10, 5245. [Google Scholar] [CrossRef] [PubMed]
- Tian, Y.; Yang, J.; Lan, M.; Zou, T. Construction and analysis of a joint diagnosis model of random forest and artificial neural network for heart failure. Aging (Albany NY) 2020, 12, 26221–26235. [Google Scholar] [CrossRef]
- Wang, F.; Wang, Y.; Ji, X.; Wang, Z. Effective Macrosomia Prediction Using Random Forest Algorithm. Int. J. Environ. Res. Public Health 2022, 19, 3245. [Google Scholar] [CrossRef]
- Carreras, J.; Hamoudi, R. Artificial Neural Network Analysis of Gene Expression Data Predicted Non-Hodgkin Lymphoma Subtypes with High Accuracy. Mach. Learn. Knowl. Extr. 2021, 3, 720–739. [Google Scholar] [CrossRef]
- Carreras, J.; Kikuti, Y.Y.; Roncador, G.; Miyaoka, M.; Hiraiwa, S.; Tomita, S.; Ikoma, H.; Kondo, Y.; Ito, A.; Shiraiwa, S.; et al. High Expression of Caspase-8 Associated with Improved Survival in Diffuse Large B-Cell Lymphoma: Machine Learning and Artificial Neural Networks Analyses. BioMedInformatics 2021, 1, 18–46. [Google Scholar] [CrossRef]
- XGBoost Tutorials. Available online: https://xgboost.readthedocs.io/en/stable/index.html (accessed on 20 November 2023).
- XGBoost Tutorials. Scalable and Flexible Gradient Boosting. Web. © 2015–2016 DMLC. Available online: http://xgboost.readthedocs.io/en/latest/tutorials/index.html (accessed on 20 November 2023).
- Ringner, M. What is principal component analysis? Nat. Biotechnol. 2008, 26, 303–304. [Google Scholar] [CrossRef]
- Giuliani, A. The application of principal component analysis to drug discovery and biomedical data. Drug Discov. Today 2017, 22, 1069–1076. [Google Scholar] [CrossRef]
- Campo, E.; Jaffe, E.S.; Cook, J.R.; Quintanilla-Martinez, L.; Swerdlow, S.H.; Anderson, K.C.; Brousset, P.; Cerroni, L.; de Leval, L.; Dirnhofer, S.; et al. The International Consensus Classification of Mature Lymphoid Neoplasms: A report from the Clinical Advisory Committee. Blood 2022, 140, 1229–1253. [Google Scholar] [CrossRef]
- de Leval, L.; Alizadeh, A.A.; Bergsagel, P.L.; Campo, E.; Davies, A.; Dogan, A.; Fitzgibbon, J.; Horwitz, S.M.; Melnick, A.M.; Morice, W.G.; et al. Genomic profiling for clinical decision making in lymphoid neoplasms. Blood 2022, 140, 2193–2227. [Google Scholar] [CrossRef]
- King, R.L.; Hsi, E.D.; Chan, W.C.; Piris, M.A.; Cook, J.R.; Scott, D.W.; Swerdlow, S.H. Diagnostic approaches and future directions in Burkitt lymphoma and high-grade B-cell lymphoma. Virchows Arch. 2023, 482, 193–205. [Google Scholar] [CrossRef]
- Arber, D.A.; Campo, E.; Jaffe, E.S. Advances in the Classification of Myeloid and Lymphoid Neoplasms. Virchows Arch. 2023, 482, 1–9. [Google Scholar] [CrossRef]
- Cazzola, M.; Sehn, L.H. Developing a classification of hematologic neoplasms in the era of precision medicine. Blood 2022, 140, 1193–1199. [Google Scholar] [CrossRef]
- Alaggio, R.; Amador, C.; Anagnostopoulos, I.; Attygalle, A.D.; Araujo, I.B.O.; Berti, E.; Bhagat, G.; Borges, A.M.; Boyer, D.; Calaminici, M.; et al. The 5th edition of the World Health Organization Classification of Haematolymphoid Tumours: Lymphoid Neoplasms. Leukemia 2022, 36, 1720–1748. [Google Scholar] [CrossRef]
- Grimm, K.E.; O’Malley, D.P. Aggressive B cell lymphomas in the 2017 revised WHO classification of tumors of hematopoietic and lymphoid tissues. Ann. Diagn. Pathol. 2019, 38, 6–10. [Google Scholar] [CrossRef]
- Ott, G. Aggressive B-cell lymphomas in the update of the 4th edition of the World Health Organization classification of haematopoietic and lymphatic tissues: Refinements of the classification, new entities and genetic findings. Br. J. Haematol. 2017, 178, 871–887. [Google Scholar] [CrossRef] [PubMed]
- Falini, B.; Martino, G.; Lazzi, S. A comparison of the International Consensus and 5th World Health Organization classifications of mature B-cell lymphomas. Leukemia 2023, 37, 18–34. [Google Scholar] [CrossRef]
- Brown, J.R.; Freedman, A.S.; Aste, J.C. Pathobiology of Diffuse Large B Cell Lymphoma and Primary Mediastinal Large B Cell Lymphoma. UpToDate. 2022. Available online: https://medilib.ir/uptodate/show/4722 (accessed on 20 November 2023).
- Schmitz, R.; Wright, G.W.; Huang, D.W.; Johnson, C.A.; Phelan, J.D.; Wang, J.Q.; Roulland, S.; Kasbekar, M.; Young, R.M.; Shaffer, A.L.; et al. Genetics and Pathogenesis of Diffuse Large B-Cell Lymphoma. N. Engl. J. Med. 2018, 378, 1396–1407. [Google Scholar] [CrossRef]
- Chapuy, B.; Stewart, C.; Dunford, A.J.; Kim, J.; Kamburov, A.; Redd, R.A.; Lawrence, M.S.; Roemer, M.G.M.; Li, A.J.; Ziepert, M.; et al. Molecular subtypes of diffuse large B cell lymphoma are associated with distinct pathogenic mechanisms and outcomes. Nat. Med. 2018, 24, 679–690. [Google Scholar] [CrossRef]
- Lacy, S.E.; Barrans, S.L.; Beer, P.A.; Painter, D.; Smith, A.G.; Roman, E.; Cooke, S.L.; Ruiz, C.; Glover, P.; Van Hoppe, S.J.L.; et al. Targeted sequencing in DLBCL, molecular subtypes, and outcomes: A Haematological Malignancy Research Network report. Blood 2020, 135, 1759–1771. [Google Scholar] [CrossRef]
- Reddy, A.; Zhang, J.; Davis, N.S.; Moffitt, A.B.; Love, C.L.; Waldrop, A.; Leppa, S.; Pasanen, A.; Meriranta, L.; Karjalainen-Lindsberg, M.L.; et al. Genetic and Functional Drivers of Diffuse Large B Cell Lymphoma. Cell 2017, 171, 481–494.e15. [Google Scholar] [CrossRef]
- Sha, C.; Barrans, S.; Cucco, F.; Bentley, M.A.; Care, M.A.; Cummin, T.; Kennedy, H.; Thompson, J.S.; Uddin, R.; Worrillow, L.; et al. Molecular High-Grade B-Cell Lymphoma: Defining a Poor-Risk Group That Requires Different Approaches to Therapy. J. Clin. Oncol. 2019, 37, 202–212. [Google Scholar] [CrossRef]
- Sha, C.; Barrans, S.; Care, M.A.; Cunningham, D.; Tooze, R.M.; Jack, A.; Westhead, D.R. Transferring genomics to the clinic: Distinguishing Burkitt and diffuse large B cell lymphomas. Genome Med. 2015, 7, 64. [Google Scholar] [CrossRef]
- Supplemetary Data. Gene Sets Tested in Different Classifiers. Transferring Genomics to the Clinic: Distinguishing Burkitt and Diffuse Large B Cell Lymphomas. Available online: https://www.ncbi.nlm.nih.gov/pmc/articles/PMC4512160/bin/13073_2015_187_MOESM4_ESM.pdf (accessed on 20 November 2023).
- Carey, C.D.; Gusenleitner, D.; Chapuy, B.; Kovach, A.E.; Kluk, M.J.; Sun, H.H.; Crossland, R.E.; Bacon, C.M.; Rand, V.; Dal Cin, P.; et al. Molecular classification of MYC-driven B-cell lymphomas by targeted gene expression profiling of fixed biopsy specimens. J. Mol. Diagn. 2015, 17, 19–30. [Google Scholar] [CrossRef] [PubMed]
- Dave, S.S.; Fu, K.; Wright, G.W.; Lam, L.T.; Kluin, P.; Boerma, E.J.; Greiner, T.C.; Weisenburger, D.D.; Rosenwald, A.; Ott, G.; et al. Molecular diagnosis of Burkitt’s lymphoma. N. Engl. J. Med. 2006, 354, 2431–2442. [Google Scholar] [CrossRef] [PubMed]
- Deffenbacher, K.E.; Iqbal, J.; Sanger, W.; Shen, Y.; Lachel, C.; Liu, Z.; Liu, Y.; Lim, M.S.; Perkins, S.L.; Fu, K.; et al. Molecular distinctions between pediatric and adult mature B-cell non-Hodgkin lymphomas identified through genomic profiling. Blood 2012, 119, 3757–3766. [Google Scholar] [CrossRef] [PubMed]
- Harris, N.L.; Horning, S.J. Burkitt’s lymphoma—The message from microarrays. N. Engl. J. Med. 2006, 354, 2495–2498. [Google Scholar] [CrossRef] [PubMed]
- Hecht, J.L.; Aster, J.C. Molecular biology of Burkitt’s lymphoma. J. Clin. Oncol. 2000, 18, 3707–3721. [Google Scholar] [CrossRef] [PubMed]
- Hummel, M.; Bentink, S.; Berger, H.; Klapper, W.; Wessendorf, S.; Barth, T.F.; Bernd, H.W.; Cogliatti, S.B.; Dierlamm, J.; Feller, A.C.; et al. A biologic definition of Burkitt’s lymphoma from transcriptional and genomic profiling. N. Engl. J. Med. 2006, 354, 2419–2430. [Google Scholar] [CrossRef] [PubMed]
- Iqbal, J.; Shen, Y.; Huang, X.; Liu, Y.; Wake, L.; Liu, C.; Deffenbacher, K.; Lachel, C.M.; Wang, C.; Rohr, J.; et al. Global microRNA expression profiling uncovers molecular markers for classification and prognosis in aggressive B-cell lymphoma. Blood 2015, 125, 1137–1145. [Google Scholar] [CrossRef]
- Leich, E.; Hartmann, E.M.; Burek, C.; Ott, G.; Rosenwald, A. Diagnostic and prognostic significance of gene expression profiling in lymphomas. APMIS 2007, 115, 1135–1146. [Google Scholar] [CrossRef] [PubMed]
- Lin, B.T. Genomic diagnosis of Burkitt’s lymphoma. N. Engl. J. Med. 2006, 355, 1064. [Google Scholar] [CrossRef] [PubMed]
- Snuderl, M.; Kolman, O.K.; Chen, Y.B.; Hsu, J.J.; Ackerman, A.M.; Dal Cin, P.; Ferry, J.A.; Harris, N.L.; Hasserjian, R.P.; Zukerberg, L.R.; et al. B-cell lymphomas with concurrent IGH-BCL2 and MYC rearrangements are aggressive neoplasms with clinical and pathologic features distinct from Burkitt lymphoma and diffuse large B-cell lymphoma. Am. J. Surg. Pathol. 2010, 34, 327–340. [Google Scholar] [CrossRef] [PubMed]
- Staiger, A.M.; Ziepert, M.; Horn, H.; Scott, D.W.; Barth, T.F.E.; Bernd, H.W.; Feller, A.C.; Klapper, W.; Szczepanowski, M.; Hummel, M.; et al. Clinical Impact of the Cell-of-Origin Classification and the MYC/ BCL2 Dual Expresser Status in Diffuse Large B-Cell Lymphoma Treated Within Prospective Clinical Trials of the German High-Grade Non-Hodgkin’s Lymphoma Study Group. J. Clin. Oncol. 2017, 35, 2515–2526. [Google Scholar] [CrossRef]
- Staudt, L.M.; Dave, S. The biology of human lymphoid malignancies revealed by gene expression profiling. Adv. Immunol. 2005, 87, 163–208. [Google Scholar] [CrossRef]
- Thomas, D.A.; O’Brien, S.; Faderl, S.; Manning, J.T., Jr.; Romaguera, J.; Fayad, L.; Hagemeister, F.; Medeiros, J.; Cortes, J.; Kantarjian, H. Burkitt lymphoma and atypical Burkitt or Burkitt-like lymphoma: Should these be treated as different diseases? Curr. Hematol. Malig. Rep. 2011, 6, 58–66. [Google Scholar] [CrossRef]
- Thomas, N.; Dreval, K.; Gerhard, D.S.; Hilton, L.K.; Abramson, J.S.; Ambinder, R.F.; Barta, S.; Bartlett, N.L.; Bethony, J.; Bhatia, K.; et al. Genetic subgroups inform on pathobiology in adult and pediatric Burkitt lymphoma. Blood 2023, 141, 904–916. [Google Scholar] [CrossRef] [PubMed]
- Carreras, J.; Kikuti, Y.Y.; Miyaoka, M.; Hiraiwa, S.; Tomita, S.; Ikoma, H.; Kondo, Y.; Ito, A.; Hamoudi, R.; Nakamura, N. The Use of the Random Number Generator and Artificial Intelligence Analysis for Dimensionality Reduction of Follicular Lymphoma Transcriptomic Data. BioMedInformatics 2022, 2, 268–280. [Google Scholar] [CrossRef]
- Carreras, J.; Kikuti, Y.Y.; Miyaoka, M.; Hiraiwa, S.; Tomita, S.; Ikoma, H.; Kondo, Y.; Ito, A.; Nakamura, N.; Hamoudi, R. A Combination of Multilayer Perceptron, Radial Basis Function Artificial Neural Networks and Machine Learning Image Segmentation for the Dimension Reduction and the Prognosis Assessment of Diffuse Large B-Cell Lymphoma. AI 2021, 2, 106–134. [Google Scholar] [CrossRef]
- Carreras, J.; Kikuti, Y.Y.; Miyaoka, M.; Hiraiwa, S.; Tomita, S.; Ikoma, H.; Kondo, Y.; Ito, A.; Nakamura, N.; Hamoudi, R. Artificial Intelligence Analysis of the Gene Expression of Follicular Lymphoma Predicted the Overall Survival and Correlated with the Immune Microenvironment Response Signatures. Mach. Learn. Knowl. Extr. 2020, 2, 647–671. [Google Scholar] [CrossRef]
- Carreras, J.; Kikuti, Y.Y.; Miyaoka, M.; Roncador, G.; Garcia, J.F.; Hiraiwa, S.; Tomita, S.; Ikoma, H.; Kondo, Y.; Ito, A.; et al. Integrative Statistics, Machine Learning and Artificial Intelligence Neural Network Analysis Correlated CSF1R with the Prognosis of Diffuse Large B-Cell Lymphoma. Hemato 2021, 2, 182–206. [Google Scholar] [CrossRef]
- Davies, A.; Cummin, T.E.; Barrans, S.; Maishman, T.; Mamot, C.; Novak, U.; Caddy, J.; Stanton, L.; Kazmi-Stokes, S.; McMillan, A.; et al. Gene-expression profiling of bortezomib added to standard chemoimmunotherapy for diffuse large B-cell lymphoma (REMoDL-B): An open-label, randomised, phase 3 trial. Lancet Oncol. 2019, 20, 649–662. [Google Scholar] [CrossRef] [PubMed]
- Davies, A.J.; Barrans, S.; Stanton, L.; Caddy, J.; Wilding, S.; Saunders, G.; Mamot, C.; Novak, U.; McMillan, A.; Fields, P.; et al. Differential Efficacy From the Addition of Bortezomib to R-CHOP in Diffuse Large B-Cell Lymphoma According to the Molecular Subgroup in the REMoDL-B Study With a 5-Year Follow-Up. J. Clin. Oncol. 2023, 41, 2718–2723. [Google Scholar] [CrossRef]
- Mosquera Orgueira, A.; Diaz Arias, J.A.; Serrano Martin, R.; Portela Pineiro, V.; Cid Lopez, M.; Peleteiro Raindo, A.; Bao Perez, L.; Gonzalez Perez, M.S.; Perez Encinas, M.M.; Fraga Rodriguez, M.F.; et al. A prognostic model based on gene expression parameters predicts a better response to bortezomib-containing immunochemotherapy in diffuse large B-cell lymphoma. Front. Oncol. 2023, 13, 1157646. [Google Scholar] [CrossRef]
- Carreras, J.; Hamoudi, R.; Nakamura, N. Artificial Intelligence Analysis of Gene Expression Data Predicted the Prognosis of Patients with Diffuse Large B-Cell Lymphoma. Tokai J. Exp. Clin. Med. 2020, 45, 37–48. [Google Scholar]
- Carreras, J.; Kikuti, Y.Y.; Hiraiwa, S.; Miyaoka, M.; Tomita, S.; Ikoma, H.; Ito, A.; Kondo, Y.; Itoh, J.; Roncador, G.; et al. High PTX3 expression is associated with a poor prognosis in diffuse large B-cell lymphoma. Cancer Sci. 2022, 113, 334–348. [Google Scholar] [CrossRef]
- Carreras, J.; Kikuti, Y.Y.; Bea, S.; Miyaoka, M.; Hiraiwa, S.; Ikoma, H.; Nagao, R.; Tomita, S.; Martin-Garcia, D.; Salaverria, I.; et al. Clinicopathological characteristics and genomic profile of primary sinonasal tract diffuse large B cell lymphoma (DLBCL) reveals gain at 1q31 and RGS1 encoding protein; high RGS1 immunohistochemical expression associates with poor overall survival in DLBCL not otherwise specified (NOS). Histopathology 2017, 70, 595–621. [Google Scholar] [CrossRef] [PubMed]
- Miyaoka, M.; Kikuti, Y.Y.; Carreras, J.; Itou, A.; Ikoma, H.; Tomita, S.; Shiraiwa, S.; Ando, K.; Nakamura, N. AID is a poor prognostic marker of high-grade B-cell lymphoma with MYC and BCL2 and/or BCL6 rearrangements. Pathol. Int. 2022, 72, 35–42. [Google Scholar] [CrossRef] [PubMed]
Disclaimer/Publisher’s Note: The statements, opinions and data contained in all publications are solely those of the individual author(s) and contributor(s) and not of MDPI and/or the editor(s). MDPI and/or the editor(s) disclaim responsibility for any injury to people or property resulting from any ideas, methods, instructions or products referred to in the content. |
© 2024 by the authors. Licensee MDPI, Basel, Switzerland. This article is an open access article distributed under the terms and conditions of the Creative Commons Attribution (CC BY) license (https://creativecommons.org/licenses/by/4.0/).