Article

Explainable Machine Learning Models for Identification of Food-Related Lifestyle Factors in Chicken Meat Consumption Case in Northern Greece

by
Dimitrios Chiras
1,
Marina Stamatopoulou
2,
Nikolaos Paraskevis
3,
Serafeim Moustakidis
4,
Irini Tzimitra-Kalogianni
2 and
Christos Kokkotis
5,*
1
H. Lundbeck A/S, Ottiliavej 9, 2500 København, Denmark
2
Department of Agricultural Economics, School of Agriculture, Aristotle University of Thessaloniki, 54124 Thessaloniki, Greece
3
Laboratory of Hygiene, Social and Preventive Medicine and Medical Statistics, School of Medicine, Faculty of Health Sciences, Aristotle University of Thessaloniki, 54124 Thessaloniki, Greece
4
AIDEAS OÜ, Narva mnt 5, 10117 Tallinn, Estonia
5
Department of Physical Education and Sport Science, Democritus University of Thrace, 69100 Komotini, Greece
*
Author to whom correspondence should be addressed.
BioMedInformatics 2023, 3(3), 817-828; https://doi.org/10.3390/biomedinformatics3030051
Submission received: 31 July 2023 / Revised: 6 September 2023 / Accepted: 14 September 2023 / Published: 19 September 2023

Abstract

:
A consumer’s decision-making process regarding the purchase of chicken meat is a multifaceted one, influenced by various food-related, personal, and environmental factors that interact with one another. The mediating effect of food lifestyle that bridges the gap between consumer food values and the environment, further shapes consumer behavior towards meat purchase and consumption. This research introduces the concept of Food-Related Lifestyle (FRL) and aims to identify and explain the factors associated with chicken meat consumption in Northern Greece using a machine learning pipeline. To achieve this, the Boruta algorithm and four widely recognized classifiers were employed, achieving a binary classification accuracy of up to 78.26%. The study primarily focuses on determining the items from the FRL tool that carry significant weight in the classification output, thereby providing valuable insights. Additionally, the research aims to interpret the significance of these selected factors in the decision-making process using the SHAP model. Specifically, it turns out that the freshness, safety, and nutritional value of chicken meat are essential considerations for consumers in their eating habits. Additionally, external factors like health crises and price fluctuations can have a significant impact on consumer choices related to chicken meat consumption. The findings contribute to a more nuanced understanding of consumer preferences, enabling the food industry to align its offerings and marketing efforts with consumer needs and desires. Ultimately, this work demonstrates the potential of AI in shaping the future of the food industry and informs strategies for effective decision-making.

1. Introduction

The consumption of red meat, especially in Western societies, has undergone changes in the last decade and is influenced by various factors, such as socio-economic, religious beliefs, nutritional scandals, ethical concerns and tradition [1]. However, the growing lifestyle-related diseases, like obesity, or diabetes, have led consumers on chicken meat consumption, as a healthier option, due to less fat and cholesterol [2]. Thus, chicken meat shows differentiation from other meats since it is considered healthier, cheaper, more convenient and without religious restrictions on dietary choice [3,4,5,6,7,8,9,10].
A consumer’s decision to purchase chicken meat is found to be a complex process determined by a variety of food-related, personal, as well as environmental factors interacting with each other [11,12]. In addition to the internal and external factors that affect meat consumption, consumer’s behavior towards meat purchase and consumption could be shaped by the influence of food lifestyle, which is found to mediate between consumer’s food values and the environment [3]. As a consequence, the concept of Food-Related Lifestyle (FRL) has been introduced to describe the possible areas of lifestyle trends that might frame consumer behavior, leading beyond the actions of the individual [13,14]. The FRL tool tries to identify the changes in food lifestyle and consists of five components: (a) ways of shopping, (b) quality aspects, (c) cooking methods, (d) consumption situations, and (e) purchase motives [14]. The suitability and validity of the FRL instrument have been certified through its application in several European countries in terms of consumers’ meat behavior [2,13,15,16]. In relation to chicken meat consumption, some studies used the FLR framework for segmenting consumers according to their sociodemographic variables and their purchasing preferences, in order to obtain different consumer profiles [2,13].
Moreover, the COVID-19 pandemic has caused changes in meat consumption patterns. Overall, international meat prices decreased in 2020, since some leading countries in consuming and importing have temporarily limited meat demand, due to the impact of the coronavirus in 2019, which led to logistical obstacles, increased livestock feeding costs, reduced food services, and limited household spending due to lower incomes [17]. The latter has forced consumers to restrict their intake of meat products to cheaper options such as poultry and pork. According to “Agricultural Outlook 2021–2030”, consumers prefer poultry meat because of its lower price, its product stability and adaptability to market requirements, and its higher protein content with lower fat. Thus, in developing countries poultry consumption reflects a lower price, while in high-income countries, poultry consumption reflects a healthier and more convenient food choice. In Greece, meat consumption was estimated to have decreased by −7% in 2020 compared to 2019, due to the health crisis, which led to reduced demand for meat, mainly in the catering sector (restaurants, hotels, and mass catering units) (Meatnews, 2022). In particular, for poultry meat in the period 2019–2020, domestic consumption decreased by −0.6%, while in 2021 it remained approximately at the same levels compared to the previous year. At the same time, annual per capita consumption increased compared to 2018 and amounted to approximately 23 kg of poultry meat and remained stable in the period 2019–2021. Also, according to the ICAR-CRIF S.A. study (Meatnews, 2022), it has appeared first in consumers’ preferences since 2018. Therefore, in this study we try to identify consumers’ influences that affect chicken meat consumption during the pandemic period using the FRL instrument in combination with Artificial Intelligence (AI)
In recent years, the use of AI in the food industry has increased significantly. AI is transforming the food industry by offering innovative solutions to challenges in food production, distribution, and consumption [18,19,20]. From precision agriculture that utilizes sensors and machine learning to optimize crop yields, to personalized nutrition that tailors diets to individual needs and preferences, AI is improving the efficiency, sustainability, and healthfulness of our food systems [21,22]. By harnessing the power of big data and machine learning, AI is enabling a more transparent, traceable, and equitable food system that benefits consumers, producers, and the environment alike. Thus, one area where AI has the potential to make a significant contribution is in the identification of consumer profiles for chicken meat based on food-related lifestyles. By analyzing large datasets related to consumer behavior, preferences, and attitudes toward food, AI algorithms can identify patterns and correlations that reveal important insights about consumer segments. These insights can be used by producers and marketers to tailor their products and messaging to specific target groups. Hence, the scope of this study is to (i) develop an explainable machine learning (ML) methodology for the identification of Food-Related Lifestyle factors in the chicken meat consumption case in Northern Greece and (ii) to interpret the contribution of the selected factors in decision-making.

2. Materials and Methods

2.1. Study Area and Data Collection

The primary data were collected after the lifting of the restrictive measures due to the COVID-19 pandemic, between June and September 2020, in Northern Greece. The sample of 689 consumers was selected randomly during their purchases in food stores such as supermarkets, butchers, specialized butchers and open markets, during their meals in fast food and restaurants, and at various times during the day and all days of the week in the urban complex of the city of Thessaloniki. Each questionnaire took about fifteen to twenty minutes to answer. The questionnaire was structured in 4 sections: (1) consumers’ habits in chicken meat consumption; (2) quality and safety consumers’ beliefs towards chicken meat; (3) food-related lifestyle trends towards food and the pandemic situation; and (4) consumers and their household characteristics. Furthermore, participation in the survey was voluntary and anonymous, and no sensitive personal information was requested. In addition, participants were informed about the purpose of the study and the use of the data, and they were assured that their answers would remain confidential and would be used exclusively in the context of the research. Finally, the consumers verbally stated that they consumed and bought chicken meat by themselves, and it was considered that they answered the questions of the questionnaire honestly. Thus, the consumers in the present study are considered to be the end users who compose the final chicken meat chain.

2.2. Data Description

The employed variables in our study were sociodemographic variables in order to describe the status of the consumers, and the questions of the Food-Related Lifestyle (FRL) [2,14,15,16] were employed in the proposed ML model. Specifically, a reduced version of the FRL model was preferred so that the respondents would not be overloaded with a lot of questions (69 questions in the full version). The FRL instrument of the study, which was conducted to segment and profile consumers, included 20 questions regarding the aspects of food-lifestyle culture as well as the consumers’ food perceptions during the pandemic situation (Appendix A). The questions of the FRL tool were measured on a 5-point Likert scale ranging from 5 “strongly agree” to 1 “strongly disagree” whereas a neutral midpoint was at 3 “neither agree nor disagree”. As the outcome assessment, we used the variable chicken meat purchase intention.

2.3. Problem Definition

In this study, we worked on a binary classification problem for the identification of FRL factors in chicken meat consumption case in Northern Greece. Specifically, the participants of the study were divided into two classes (Figure 1): (1) rare chicken consumers, consumers who buy chicken meat one or two times in 3 months (n = 319), and (2) chicken consumers, consumers who buy chicken meat at least 2 times a month to every week (n = 370).

2.4. Machine Learning Workflow

An explainable multi-stage ML pipeline was proposed in order to identify which FRL factors are important for the classification of potential customers when it comes to the chicken market in Northern Greece. The proposed ML methodology can be seen in Figure 2.

2.5. Feature Engineering

In order to deal with the missing values, we used the most frequent values (mode strategy, available on https://scikit-learn.org/stable/modules/generated/sklearn.impute.SimpleImputer.html, accessed on 25 June 2023). Additionally, we used the StandardScaler function from the scikit-learn package as a standardization technique [23]. The Boruta algorithm was applied to rank the various features in order of importance [24,25]. It is a supervised learning algorithm that provides a feature importance ranking and is effective in problems where the dataset for model building is comprised of several variables. Specifically, the Boruta algorithm provides a ranking of features by assigning importance scores based on their performance compared to shuffled counterparts. Features with higher importance scores are ranked higher, indicating their relative significance in the dataset for subsequent modeling or analysis.

2.6. Learning Process

Four well-known ML classifiers were evaluated for their suitability [26]. To ensure that the ML models perform well on the employed data, as well as to avoid bias error and overfitting, hyperparameter selection was implemented. Specifically, we used Random Forest (RF), which is an ensemble learning algorithm known for its fast execution speed and increased model performance. Additionally, SVM algorithms were employed, leveraging their effectiveness in high-dimensional spaces. Another algorithm that was employed was Logistic Regression (LR). This model uses a generalized linear model in order to predict a binary outcome based on prior observations of a dataset. Neural networks (NNs) were also tested as they can recognize relationships between complex data using a series of algorithms that mimic the operations of a human brain. Different activation functions were tested (including tanh, sigmoid, and ReLU) for their suitability as part of the hyperparameter optimization phase.

2.7. Evaluation

For the evaluation of the proposed classifiers, a stochastic 70–30% random data split was applied to generate the training and testing subsets, respectively. Specifically, the learning was performed on the stratified version of the training sets, and the final performance was estimated using the accuracy testing sets. Furthermore, the performance of the classifiers was also evaluated in terms of recall (or sensitivity), f1-score, and precision as additional evaluation criteria. Additionally, confusion matrices were utilized in order to evaluate the classifiers’ performance. A confusion matrix is a means of evaluating a classifier’s performance, acting as a summary of prediction results on a classification problem. It is comprised of the count of correct (true) and incorrect (false) predictions, broken down by each class.

2.8. Explainability

Aiming to better understand the rationale behind the decision-making process of the trained AI models, we additionally (i) investigated how much each of the features contributed to the final decision and (ii) estimated each feature’s importance. To that end, we resorted to SHapley Additive explanations (SHAP), which are based on Shapley Values of game theory [27,28,29]. SHAP is a mathematical method that explains the predictions of machine learning models by calculating the level of each feature that contributes to the final prediction. This enhances our understanding of the internal decision-making rationale of the trained AI models, especially with respect to the mechanism with which selected food-related lifestyle parameters are combined to produce decisions regarding potential customer prediction.

3. Results

In this section, the descriptive statistics of the employed consumers and the FRL variables, the testing performance metrics of the comparative analysis, the selected features for the best-performing ML model, and the interpretation of the model output of the best-performing ML classifier are presented below.

3.1. Descriptive Statistics

Table 1 presents the frequencies of the employed participants in this study. As observed, 61.8% are women, and 38.2% are men. The most populous age groups are 36–45 y (26.1%) and 46–55 y (36.6%). Furthermore, 37.1% of the participants have EUR 1001–1500 in income per month.
Table 2 summarizes the descriptive statistics (mean ± SD) of the employed dataset in our study per group.

3.2. Prediction Performance
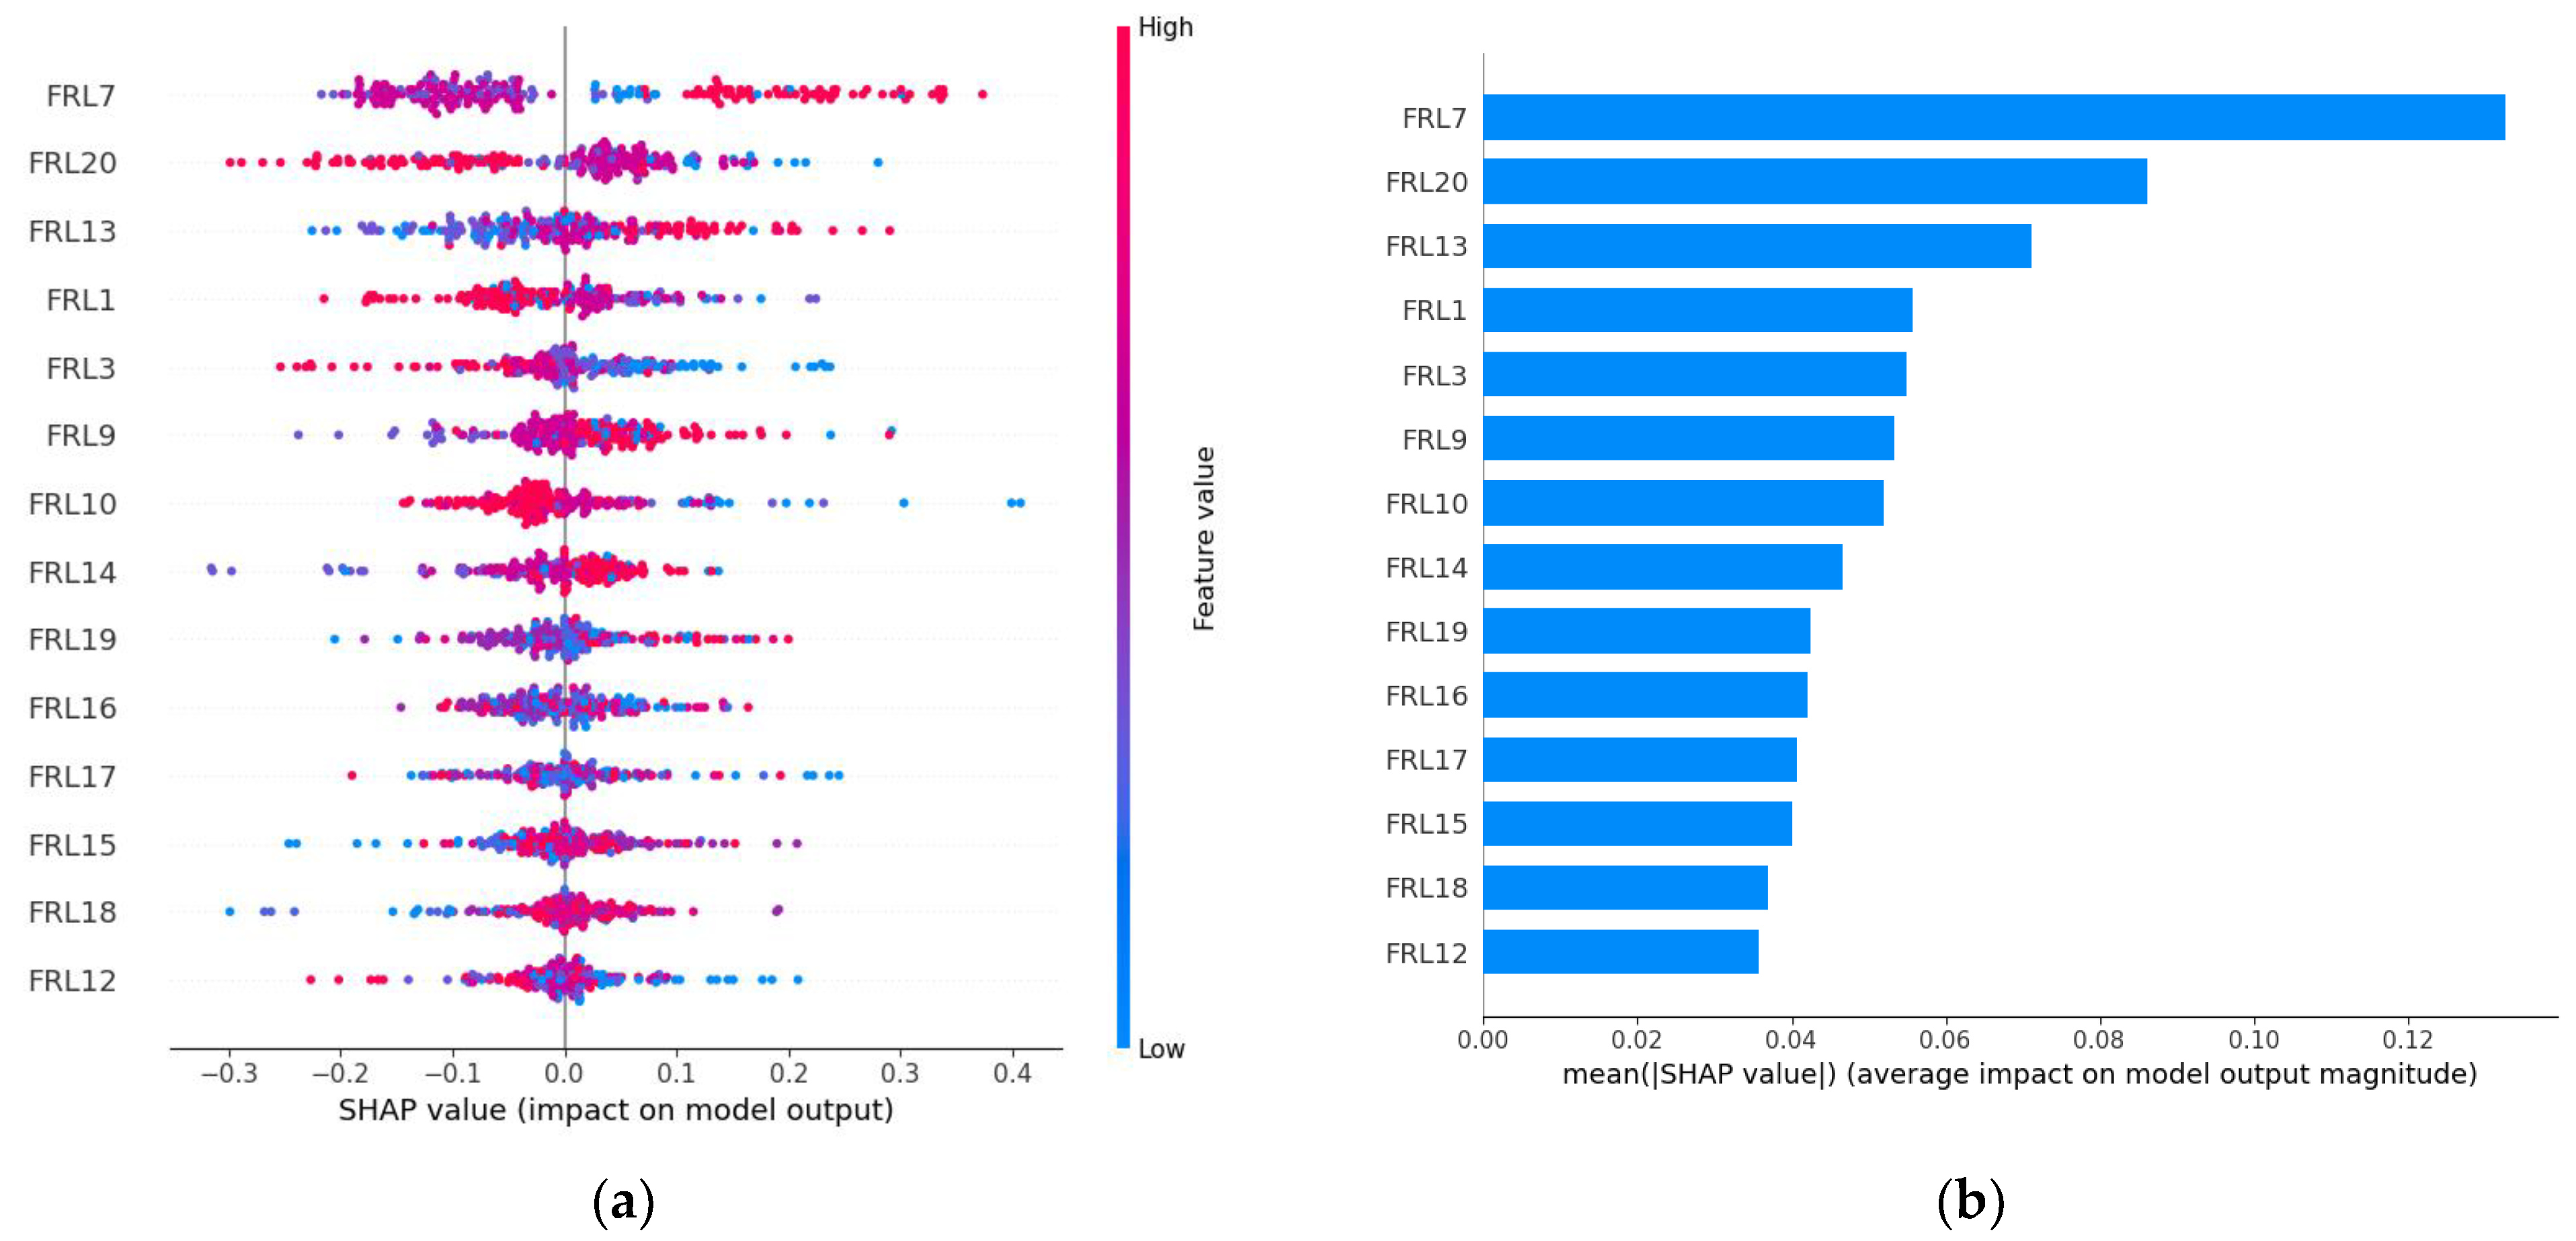
Figure 3 demonstrates the accuracy testing performance (%) of the competing ML models with respect to the number of selected features in the 2-class problem. Initially, the features of the employed data were ranked by using the Boruta algorithm. At this point, we should mention that the ML models were trained on feature subsets of increasing dimensionality (with a step of 1), and the testing classification accuracies were finally calculated until the full feature set had been tested. It turned out that the majority of the ML models had an upward trend in the whole feature dimensionality range, followed by a steady testing performance in most cases. Specifically, the Random Forest model showed an upward trend with respect to the first selected features, with fluctuations across multiple features, with a maximum of 78.26% at 14 features, which is the overall best performance. The SVM model achieved the second-best accuracy (75.36%), also following the pattern of fluctuating, non-steadily increasing performance across different selected features. In contrast with the other models, Logistic Regression fell short in this task, recording low accuracy testing performances below 64%.
Table 3 summarizes the best performance metrics such as accuracy, recall, precision, and f1-score of the employed ML classifiers. It also presents the number of features and confusion matrices. Best performances were achieved from the RF classifier. Specifically, RF achieved 78.26% accuracy, 80.36% recall, 79.65% precision, and 80.00% f1-score. On the contrary, the LR classifier achieved the lowest performance scores (61.35% accuracy, 68.75% recall, 63.12% precision, and 65.81% f1-score).
Table 4 shows the ranking of the selected factors based on the Boruta feature-selection algorithm for the best-performing ML model in our approach.

3.3. Explainability

The impact of the FRL items on the output of the best-performing model (RF) is illustrated in Figure 4. The figure demonstrates the relationships, both negative and positive, between the FRL items and the purchase preference for chicken meat, which is the target variable. A positive relationship indicates that an increase in the value of a specific feature is associated with an increase in the model’s output, while a negative relationship indicates the opposite. Figure 4a presents the SHAP summary values of the FRL items, arranged in descending order from top to bottom based on their impact. The color coding represents the individual observation’s high (red) or low (blue) value for each FRL item. The FRL item “FRL7” indicates a high and positive impact on the purchase preference for chicken meat, meaning that as the participants’ purchase frequencies increase, the model’s output tends to lean towards classifying them as chicken consumers. In other words, there is a correlation between FRL7 and the likelihood of purchasing chicken meat. Conversely, FRL3 exhibits a negative correlation with the purchase of chicken meat. In Figure 4b, the average impact of each FRL item on the magnitude of the model’s output is depicted. It can be observed that FRL7, FRL20, and FRL13 have significant contributions to the model’s output, while FRL items like FRL17, FRL15, FRL18, and FRL12 have a moderate to low impact on the model’s output.

4. Discussion

The primary objective of the current study is to create a machine learning pipeline that can provide explanations for the identification of Food-Related Lifestyle factors in the context of chicken meat consumption in Northern Greece. The task involves classifying participants into two groups: rare chicken consumers and chicken consumers. To achieve this, four widely recognized classifiers were utilized. The accuracy of the binary classification task reached 78.26%. The main focus was to determine which items from an established tool carry more weight in the classification output and provide valuable insights. In addition, the secondary goals of the research included interpreting the significance of the selected factors in the decision-making process.
We employed the Boruta algorithm, which utilizes the RF classifier, as our chosen feature-selection technique. We opted for this algorithm due to its reliability and automation, enabling us to enhance model performance, decrease dimensionality, and extract valuable insights from datasets with numerous dimensions. Moreover, Boruta assesses feature importance by considering the performance of the selected model, granting us flexibility in choosing the most appropriate model for our specific objective. In our particular task, the five highest-ranked features were FRL10 “I check the expiration dates of food”, FRL16 “After the pandemic I prefer not eating out”, FRL13 “I prefer to buy products firstly for their nutritional value and then for their taste”, FRL7 “I like to read the labels of the food products that I buy so as to know what they contain”, and FRL9 “I check the prices and compare them”.
In order to comprehend the influence of FRL items on chicken meat purchase intention, we employed the SHAP model for interpreting the model output. The reason behind selecting this model was its ability to determine the contribution of each feature to the prediction by examining various feature combinations and their corresponding outcomes. This approach guarantees a just and consistent distribution of importance among the features. The selection of item FRL10 “I check the expiration dates of food” as the most important in consumers’ chicken meat choice constructs food involvement in consumers’ chicken meat choice. The expiration date may reflect the perceived quality for meat freshness and the level of safety in chicken meat consumption [6,30], so consumers may consider the expiration date as an indirect way of evaluating chicken meat quality. Thus, the belief in the freshness and safety of chicken meat through the expiration date is considered to be a strong food attribute that leads to eating habits. Additionally, the above result appears to be consistent with the findings of other studies, such as those from Stamatopoulou and Tzimitra-Kalogianni 2022 [31]; Katiyo et al., 2020 [32]; Strašek, 2010 [33]; and Hall and Sandilands, 2007 [34]. Also, FRL 16 “After the pandemic I prefer not eating out” indicates the perception found by Wang et al. [35], that consumers’ eating behavior has been influenced by their concerns due to the health crisis.
Moreover, the items FRL13 “I prefer to buy products firstly for their nutritional value and then for their taste” and FRL7 “I like to read the labels of the food products that I buy so as to know what they contain” strongly reveals consumers’ food values toward chicken meat consumption. According to Verbeke et al. [36], the nutritional value of meat demonstrates a very important value that determines the final choice of consumers. The above food values are in compliance with the relevant literature [6,8,9,10,37,38,39,40,41,42]. Furthermore, these results that reveal consumers’ interest in label information for healthy meat enhances the importance of consumers’ food involvement in their purchasing decisions [43]. Finally, the item FRL9 “I check the prices and compare them” indicates consumers’ food involvement that may affect their final choice. “The value for money” for chicken meat reflects consumers’ food value that may contribute to their overall purchasing finaldecision, since there is a link between food values and food choices, according to Krystallis et al. [44]. In accordance with these results, several studies showed that consumers’ perceptions of chicken meat prices can influence chicken meat choice [3,4,7,8,9,30,30,31,39,41,42,45,46].
At this point, we should mention that SHAP analysis serves as a valuable tool to identify the overall impact of features on our results, providing insight into their collective influence. In contrast, our feature-selection algorithm focuses on pinpointing the most relevant features for a more refined analysis, ensuring the extraction of critical information. Hence, it is important to note that while Figure 4 highlights the SHAP features with the most significant impact on model output, the discussion section delves deeper into the features identified through our specific feature-selection algorithm. This approach allows us to provide a comprehensive understanding of our findings by considering both the broader perspective and the features critical to our analysis.
One limitation of our research lies in the utilization of a modified Food-Related Lifestyle (FRL) instrument, which entails the use of a reduced number of questions instead of the full set. Despite this fact, it did not impact the current findings. According to Buitrago-Vera et al. [15], in order to adapt the FRL model to each research context, this may include different numbers of elements, with each dimension able to provide factors that describe the food lifestyles of consumers. Thus, according to relevant studies [14,15,16], the FRL model of the present study was preferred to include twenty (20) elements (questions) corresponding to all five (5) food dimensions that the FRL model usually contains. Moreover, this survey focused only on consumers in the Thessaloniki agglomeration and did not include the attitudes and perceptions of others involved in the chicken meat supply chain. Post-purchase quality control was not included, because it was not a specific type of chicken meat that was controlled, but chicken meat in general. In future endeavors, we plan to address this limitation by employing the complete FRL tool, encompassing all relevant questions, and extending our research to multiple regions of Greece. To ensure a representative sample, we will adopt a stratified selection approach when recruiting participants for the study. Furthermore, in our upcoming work, we aim to enhance the interpretability of our machine learning pipeline by incorporating graphical models as explanation methods. These graphical models (Graph Neural Networks (GNNs) or Bayesian Networks) will provide visual representations of the relationships and dependencies among various factors, contributing to a more comprehensive understanding of the decision-making process in the classification of Food-Related Lifestyle factors. By leveraging these advanced techniques, we anticipate achieving a deeper level of insight and explanation in our research.

5. Conclusions

In conclusion, our study successfully developed a machine learning pipeline that not only achieved a binary classification task with up to 78.26% accuracy, but also focused on providing explanations for identifying Food-Related Lifestyle factors in chicken meat consumption within Northern Greece. The interpretability of our machine learning pipeline offers a more comprehensive understanding of the decision-making process involved in the classification of Food-Related Lifestyle factors. Overall, this research underscores the potential impact of AI on the food industry, emphasizing the significance of identifying consumer profiles for effective product development and targeted marketing strategies. Through our efforts, we anticipate achieving deeper insights and explanations, which can ultimately contribute to informed decision-making processes in the food industry.

Author Contributions

Conceptualization, D.C., M.S. and C.K.; Data curation, D.C., M.S. and N.P.; Methodology, S.M. and C.K.; Software, D.C. and C.K.; Supervision, C.K.; Validation, S.M.; Visualization, D.C. and C.K.; Writing—original draft, D.C., M.S. and N.P.; Writing—review and editing, S.M., I.T.-K. and C.K. All authors have read and agreed to the published version of the manuscript.

Funding

This research received no external funding.

Institutional Review Board Statement

Not applicable.

Informed Consent Statement

Not applicable.

Data Availability Statement

Data are available upon request.

Conflicts of Interest

The authors declare no conflict of interest.

Appendix A

Table A1. Description of the 20 FRL items.
FRL ItemsDescription
FRL1I always make a list, before I go shopping for food
FRL2I like shopping for food for me or my family
FRL3I like shopping and tasting gourmet foods
FRL4Eating out with my friends or with my family is an important part of my social life
FRL5Eating is an enjoyment
FRL6I try to schedule the weekly menu, so as not to waste time and money
FRL7I like to read the labels of the food products that I buy to know what they contain
FRL8I like to cook for myself, for my family and my friends
FRL9I check the prices and compare them
FRL10I check the expiration dates of food
FRL11I read recipes and experiment in cooking
FRL12Members of my family like to involve in cooking
FRL13I prefer to buy products firstly for their nutritional value and then for their taste
FRL14I prefer to buy natural products without preservatives
FRL15At home, I eat take away food, at least once a month
FRL16After the pandemic, I prefer not to eat out
FRL17I find cooking tiring
FRL18After the pandemic, I pay attention to the places from where I buy food (cleanliness, without overcrowding)
FRL19After the coronavirus pandemic, I do not trust the takeaway food
FRL20I use the internet to inform me and to entertain me

References

  1. Font-i-Furnols, M.; Guerrero, L. Consumer Preference, Behavior and Perception about Meat and Meat Products: An Overview. Meat Sci. 2014, 98, 361–371. [Google Scholar] [CrossRef]
  2. Ripoll García, G.; Albertí Lasalle, P.; Panea Doblado, B. Consumer Segmentation Based on Food-Related Lifestyles and Perception of Chicken Breast. Int. J. Poult. Sci. 2015, 14, 262–275. [Google Scholar] [CrossRef]
  3. Predanocyová, K.; Kubicová, Ľ.; Kádeková, Z.; Košičiarová, I. Key Factors Affecting Consumption of Meat and Meat Products from Perspective of Slovak Consumers. Potravinarstvo 2019, 13, 1001–1012. [Google Scholar] [CrossRef]
  4. Kehagia, O.C.; Colmer, C.; Chryssochoidis, M.G. Consumer Valuation of Traceability Labels: A Cross-Cultural Study in Germany and Greece. Br. Food J. 2017, 119, 803–816. [Google Scholar] [CrossRef]
  5. Raimundo, L.M.B.; Batalha, M.O. Consumption of Chicken Meat in Sao Paulo: Market Segmentation and Strategies. CEP 2015, 13565, 905. [Google Scholar]
  6. Walley, K.; Parrott, P.; Custance, P.; Meledo-Abraham, P.; Bourdin, A. A Review of French Consumers Purchasing Patterns, Perceptions and Decision Factors for Poultry Meat. World’s Poult. Sci. J. 2015, 71, 5–14. [Google Scholar] [CrossRef]
  7. Michel, L.M.; Punter, P.; Wismer, W. Perceptual Attributes of Poultry and Other Meat Products: A Repertory Grid Application. Meat Sci. 2011, 87, 349–355. [Google Scholar] [CrossRef] [PubMed]
  8. Sismanoglou, A.; Tzimitra-Kalogianni, I. Consumer Perception of Poultry Meat in Greece. World’s Poult. Sci. J. 2011, 67, 269–276. [Google Scholar] [CrossRef]
  9. Krystallis, A.; Chryssochoidis, G.; Scholderer, J. Consumer-Perceived Quality in ‘Traditional’ Food Chains: The Case of the Greek Meat Supply Chain. Appetite 2007, 48, 54–68. [Google Scholar] [CrossRef]
  10. Kennedy, O.B.; Stewart-Knox, B.; Mitchell, P.; Thurnham, D. Consumer Perceptions of Poultry Meat: A Qualitative Analysis. Nutr. Food Sci. 2004, 34, 122–129. [Google Scholar] [CrossRef]
  11. Vukasović, T.; Stanton, J.L. Going Local: Exploring Millennials Preferences for Locally Sourced and Produced Fresh Poultry in a Developing Economy. World’s Poult. Sci. J. 2017, 73, 757–766. [Google Scholar] [CrossRef]
  12. Henchion, M.; McCarthy, M.; Resconi, V.C.; Troy, D. Meat Consumption: Trends and Quality Matters. Meat Sci. 2014, 98, 561–568. [Google Scholar] [CrossRef] [PubMed]
  13. Escriba-Perez, C.; Baviera-Puig, A.; Buitrago-Vera, J.; Montero-Vicente, L. Consumer Profile Analysis for Different Types of Meat in Spain. Meat Sci. 2017, 129, 120–126. [Google Scholar] [CrossRef]
  14. Grunert, K.G. Future Trends and Consumer Lifestyles with Regard to Meat Consumption. Meat Sci. 2006, 74, 149–160. [Google Scholar] [CrossRef]
  15. Buitrago-Vera, J.; Escribá-Pérez, C.; Baviera-Puig, A.; Montero-Vicente, L. Consumer Segmentation Based on Food-Related Lifestyles and Analysis of Rabbit Meat Consumption. World Rabbit. Sci. 2016, 24, 169–182. [Google Scholar] [CrossRef]
  16. Bernués, A.; Ripoll, G.; Panea, B. Consumer Segmentation Based on Convenience Orientation and Attitudes towards Quality Attributes of Lamb Meat. Food Qual. Prefer. 2012, 26, 211–220. [Google Scholar] [CrossRef]
  17. OECD/FAO. OECD-FAO Agricultural Outlook 2021–2030. In OECD-FAO Agricultural Outlook; OECD: Paris, France, 2021; pp. 163–177. [Google Scholar]
  18. Kler, R.; Elkady, G.; Rane, K.; Singh, A.; Hossain, M.S.; Malhotra, D.; Ray, S.; Bhatia, K.K. Machine Learning and Artificial Intelligence in the Food Industry: A Sustainable Approach. J. Food Qual. 2022, 2022, 8521236. [Google Scholar] [CrossRef]
  19. Bedoya, M.G.; Montoya, D.R.; Tabilo-Munizaga, G.; Pérez-Won, M.; Lemus-Mondaca, R. Promising Perspectives on Novel Protein Food Sources Combining Artificial Intelligence and 3D Food Printing for Food Industry. Trends Food Sci. Technol. 2022, 128, 38–52. [Google Scholar] [CrossRef]
  20. Addanki, M.; Patra, P.; Kandra, P. Recent Advances and Applications of Artificial Intelligence and Related Technologies in the Food Industry. Appl. Food Res. 2022, 2, 100126. [Google Scholar] [CrossRef]
  21. Miyazawa, T.; Hiratsuka, Y.; Toda, M.; Hatakeyama, N.; Ozawa, H.; Abe, C.; Cheng, T.-Y.; Matsushima, Y.; Miyawaki, Y.; Ashida, K.; et al. Artificial Intelligence in Food Science and Nutrition: A Narrative Review. Nutr. Rev. 2022, 80, 2288–2300. [Google Scholar] [CrossRef]
  22. Deng, X.; Cao, S.; Horn, A.L. Emerging Applications of Machine Learning in Food Safety. Annu. Rev. Food Sci. Technol. 2021, 12, 513–538. [Google Scholar] [CrossRef] [PubMed]
  23. Shivani, C.; Anusha, B.; Druvitha, B.; Swamy, K.K. RNN-LSTM Model Based Forecasting of Cryptocurrency Prices Using Standard Scaler Transform. J. Crit. Rev. 2022, 10, 144–158. [Google Scholar]
  24. Gkantzios, A.; Kokkotis, C.; Tsiptsios, D.; Moustakidis, S.; Gkartzonika, E.; Avramidis, T.; Aggelousis, N.; Vadikolias, K. Evaluation of Blood Biomarkers and Parameters for the Prediction of Stroke Survivors’ Functional Outcome upon Discharge Utilizing Explainable Machine Learning. Diagnostics 2023, 13, 532. [Google Scholar] [CrossRef]
  25. Kursa, M.B.; Rudnicki, W.R. Feature Selection with the Boruta Package. J. Stat. Softw. 2010, 36, 1–13. [Google Scholar] [CrossRef]
  26. Kokkotis, C.; Moustakidis, S.; Tsatalas, T.; Ntakolia, C.; Chalatsis, G.; Konstadakos, S.; Hantes, M.E.; Giakas, G.; Tsaopoulos, D. Leveraging Explainable Machine Learning to Identify Gait Biomechanical Parameters Associated with Anterior Cruciate Ligament Injury. Sci. Rep. 2022, 12, 6647. [Google Scholar] [CrossRef]
  27. Lundberg, S.M.; Lee, S.-I. A Unified Approach to Interpreting Model Predictions. Adv. Neural Inf. Process. Syst. 2017. [Google Scholar]
  28. Lundberg, S.M.; Erion, G.; Chen, H.; DeGrave, A.; Prutkin, J.M.; Nair, B.; Katz, R.; Himmelfarb, J.; Bansal, N.; Lee, S.-I. From Local Explanations to Global Understanding with Explainable AI for Trees. Nat. Mach. Intell. 2020, 2, 56–67. [Google Scholar] [CrossRef]
  29. Janzing, D.; Minorics, L.; Blöbaum, P. Feature Relevance Quantification in Explainable AI: A Causality Problem. arXiv 2019, arXiv:1910.13413. [Google Scholar]
  30. Vukasovič, T. Buying Decision-making Process for Poultry Meat. Br. Food J. 2010, 112, 125–139. [Google Scholar] [CrossRef]
  31. Stamatopoulou, M.; Tzimitra-Kalogianni, I. Consumers’ Profile Analysis for Chicken Meat, during the First Wave of COVID-19 Pandemic: Case of Northern Greece. J. Agric. Sci. 2022, 33, 162–175. [Google Scholar]
  32. Katiyo, W.; Coorey, R.; Buys, E.M.; de Kock, H.L. Consumers’ Perceptions of Intrinsic and Extrinsic Attributes as Indicators of Safety and Quality of Chicken Meat: Actionable Information for Public Health Authorities and the Chicken Industry. J. Food Sci. 2020, 85, 1845–1855. [Google Scholar] [CrossRef] [PubMed]
  33. Strašek, R. Empirical Testing of Correlations between the Effects of Country-of-Origin and Consumer Perceptions. World’s Poult. Sci. J. 2010, 66, 39–52. [Google Scholar] [CrossRef]
  34. Hall, C.; Sandilands, V. Public Attitudes to the Welfare of Broiler Chickens. Anim. Welf. 2007, 16, 499–512. [Google Scholar] [CrossRef]
  35. Wang, E.; An, N.; Gao, Z.; Kiprop, E.; Geng, X. Consumer Food Stockpiling Behavior and Willingness to Pay for Food Reserves in COVID-19. Food Secur. 2020, 12, 739–747. [Google Scholar] [CrossRef] [PubMed]
  36. Verbeke, W.; Marcu, A.; Rutsaert, P.; Gaspar, R.; Seibt, B.; Fletcher, D.; Barnett, J. ‘Would You Eat Cultured Meat?’: Consumers’ Reactions and Attitude Formation in Belgium, Portugal and the United Kingdom. Meat Sci. 2015, 102, 49–58. [Google Scholar] [CrossRef]
  37. Skunca, D.; Tomasevic, I.; Zdolec, N.; Kolaj, R.; Aleksiev, G.; Djekic, I. Consumer-Perceived Quality Characteristics of Chicken Meat and Chicken Meat Products in Southeast Europe. Br. Food J. 2017, 119, 1525–1535. [Google Scholar] [CrossRef]
  38. Djekic, I.; Skunca, D.; Nastasijevic, I.; Tomovic, V.; Tomasevic, I. Transformation of Quality Aspects throughout the Chicken Meat Supply Chain. Br. Food J. 2018, 120, 1132–1150. [Google Scholar] [CrossRef]
  39. Naspetti, S.; Alberti, F.; Solfanelli, F. Quality Function Deployment in the Organic Animal Food Sector: Application to Poultry Meat. Ital. J. Anim. Sci. 2015, 14, 4050. [Google Scholar] [CrossRef]
  40. Imran, S.N.; Kamarulzaman, N.H.; Latif, I.A.; Mohd Nawi, N. Enhancing Poultry Industry Competitiveness: Consumer Perspective on Chicken Meat Quality Based on Sensory Characteristics. J. Food Prod. Mark. 2014, 20, 102–121. [Google Scholar] [CrossRef]
  41. Van Loo, E.J.; Caputo, V.; Nayga, R.M., Jr.; Verbeke, W. Consumers’ Valuation of Sustainability Labels on Meat. Food Policy 2014, 49, 137–150. [Google Scholar] [CrossRef]
  42. Pirvutoiu, I.; Popescu, A. Research on Consumer Behaviour in Bucharest Poultry Meat Market. Sci. Pap. Anim. Sci. Biotechnol./Lucr. Stiintifice Zooteh. Biotehnol. 2013, 46, 389–396. [Google Scholar]
  43. Verbeke, W.; Vackier, I. Profile and Effects of Consumer Involvement in Fresh Meat. Meat Sci. 2004, 67, 159–168. [Google Scholar] [CrossRef]
  44. Krystallis, A.; Vassallo, M.; Chryssohoidis, G. The Usefulness of Schwartz’s ‘Values Theory’ in Understanding Consumer Behaviour towards Differentiated Products. J. Mark. Manag. 2012, 28, 1438–1463. [Google Scholar] [CrossRef]
  45. Marian, L.; Chrysochou, P.; Krystallis, A.; Thøgersen, J. The Role of Price as a Product Attribute in the Organic Food Context: An Exploration Based on Actual Purchase Data. Food Qual. Prefer. 2014, 37, 52–60. [Google Scholar] [CrossRef]
  46. Walley, K.; Parrott, P.; Custance, P.; Meledo-Abraham, P.; Bourdin, A. A Review of UK Consumers’ Purchasing Patterns, Perceptions and Decision Making Factors for Poultry Meat. World’s Poult. Sci. J. 2014, 70, 493–502. [Google Scholar] [CrossRef]
Figure 1. Class percentages of the employed participants in this study.
Biomedinformatics 03 00051 g001
Figure 2. Proposed machine learning workflow.
Biomedinformatics 03 00051 g002
Figure 3. Learning curves of employed ML classifiers.
Biomedinformatics 03 00051 g003
Figure 4. This figure depicts (a) the SHAP summary plot and (b) the SHAP feature importance for the RF trained on the features selected by the proposed Boruta FS algorithm.
Biomedinformatics 03 00051 g004
Table 1. Consumers’ characteristics.
Sociodemographic VariablesFrequencies (%)
Gender
Woman61.8
Man38.2
Age
18–25 y8.9
26–35 y12.2
36–45 y26.1
46–55 y36.6
56–65 y10.6
66–75 y4.9
>75 y0.7
Income (euro per month)
≤50012.1
501–100025.6
1001–150037.1
1501–200016.3
2001–30004.5
>30004.4
Table 2. Mean and standard deviation of the employed 20-item FRL tool.
FRL ItemsRare Chicken Consumers (Mean ± SD)Chicken Consumers (Mean ± SD)
FRL14.09 ± 1.054.01 ± 1.02
FRL24.40 ± 0.754.39 ± 0.80
FRL33.60 ± 1.043.44 ± 1.08
FRL43.97 ± 0.944.05 ± 0.91
FRL54.43 ± 0.714.38 ± 0.79
FRL63.83 ± 0.993.79 ± 1.01
FRL73.89 ± 0.794.01 ± 0.98
FRL84.00 ± 1.024.13 ± 1.00
FRL94.01 ± 0.844.02 ± 1.00
FRL104.45 ± 0.674.37 ± 0.91
FRL113.53 ± 1.113.62 ± 1.08
FRL123.50 ± 1.013.42 ± 1.15
FRL133.46 ± 1.003.60 ± 1.18
FRL144.15 ± 0.814.17 ± 0.99
FRL153.50 ± 1.313.48 ± 1.26
FRL162.75 ± 1.212.88 ± 1.29
FRL172.81 ± 1.232.78 ± 1.23
FRL183.60 ± 1.153.72 ± 1.16
FRL192.67 ± 1.132.78 ± 1.24
FRL204.03 ± 0.953.89 ± 1.06
Table 3. Best performance metrics of the employed ML models.
ML ClassifiersAccuracy (%)Recall (%)Precision (%)f1-Score (%)Number of Selected FeaturesConfusion Matrix
RF78.2680.3679.6580.00147223
2290
SVM75.3674.1179.0576.50197322
2983
NN72.9569.6478.0073.59207322
3478
LR61.3568.7563.1265.81175045
3577
Table 4. Ranking of the employed features for the best-performing ML model.
RankingFeatureType of Variable
1FRL10Categorical
2FRL16Categorical
3FRL13Categorical
4FRL7Categorical
5FRL9Categorical
6FRL14Categorical
7FRL12Categorical
8FRL18Categorical
9FRL3Categorical
10FRL1Categorical
11FRL19Categorical
12FRL17Categorical
13FRL20Categorical
14FRL15Categorical
Disclaimer/Publisher’s Note: The statements, opinions and data contained in all publications are solely those of the individual author(s) and contributor(s) and not of MDPI and/or the editor(s). MDPI and/or the editor(s) disclaim responsibility for any injury to people or property resulting from any ideas, methods, instructions or products referred to in the content.

