Abstract
Studies have shown that STK11 mutation plays a critical role in affecting the lung adenocarcinoma (LUAD) tumor immune environment. By training an Inception-Resnet-v2 deep convolutional neural network model, we were able to classify STK11-mutated and wild-type LUAD tumor histopathology images with a promising accuracy (per slide AUROC = 0.795). Dimensional reduction of the activation maps before the output layer of the test set images revealed that fewer immune cells were accumulated around cancer cells in STK11-mutation cases. Our study demonstrated that deep convolutional network model can automatically identify STK11 mutations based on histopathology slides and confirmed that the immune cell density was the main feature used by the model to distinguish STK11-mutated cases.
1. Introduction
Non-small cell lung cancer is the most common type of lung cancer accounting for more than 80% of lung tumor malignancy cases, among which 50% are adenocarcinoma (LUAD) [1]. STK11 is a critical cancer-related gene that provides instructions for making a tumor suppressor, serine/threonine kinase 11 [2]. About 24% of all adenocarcinoma cases are STK11-mutated, and molecular studies have shown that STK11-mutation plays an important role in influencing the tumor immune environment including the intratumoral immune cell densities [1]. As a result, many researchers have suggested that precision immuno-therapy approaches should take STK11 status of individual tumors into consideration [3,4,5]. In recent years, deep-learning-based methods have been proved to be able to capture morphological features on tumor images that are associated with molecular features such as mutations, subtypes, and immune infiltration. For example, a customized multi-resolution CNN model showed its power in classifying molecular subtypes in endometrial cancer [6]. An InceptionV3-based model was able to identify BRAF mutations in malignant melanoma tissue [7]. A similar architected model was also capable of predicting non-small-cell lung cancer subtypes with high accuracy [8]. In other cancer types that are more heterogeneous such as glioblastoma and colon cancer, CNN-based imaging model also showed its power in predicting critical morphological and molecular features such as G-CIMP and MSI [9,10]. Here, we trained a deep-learning model that can determine LUAD patients’ STK11 mutation status based on histopathology slides with high performance. Visualization of the key features learned by the model confirmed that STK11 mutation is associated with the density of immune cells near cancer cells. Practically, this model is capable of providing guidance to immunotherapy in a faster, more convenient, and less expensive way by examining histopathology images without doing sequencing analyses.
2. Materials and Methods
Inception-Renet-v2, a modified version of Inception-v4 with residual connection derived from the original InceptionNet, was used as the architecture of the deep-learning model for this project [11,12,13]. Figure 1 and Figure S1 shows the general workflow. The nature of digital histopathology images is quite different from the images from ImageNet which these CNN architectures were designed for and pre-trained on. For example, the digital histopathology images are often much larger in size than ImageNet’s. Also, the features are quite different since features in histopathology are often textures rather than objects in ImageNet. Therefore, we believe training end-to-end is a better strategy than transfer learning for our task. The 541 scanned diagnostic histopathology slides from 478 patients with STK11 mutation status were downloaded from Genomic Data Commons (GDC) of the National Cancer Institute (NCI). The data were then separated into training (80%), validation (10%), and testing (10%) sets at per-patient level. Due to the large size of the slides, they were cut into 299-by-299-pixel tiles at 20× magnification level and background was omitted. The model was trained from scratch at per-tile level with batch size of 64 and dropout keep rate of 0.3. The training process stopped when either training or validation loss did not decrease for more than 10,000 iterations to avoid overfitting. When training loss reached minimum at some point, a 100-iteration validation was performed. The model was saved as the best performing one only when both training and validation losses were at minimum. The training time took about 3 days while the testing for one slide took less than 15 min. We used the NYU Langone Health BigPurple high performance computing (HPC) platform with a NVIDIA Tesla V100 GPU and the model is also possible to be trained and tested on other platforms such as Google Colab.

Figure 1.
The general workflow of data preprocessing, model training and evaluation, and feature visualization.
3. Results
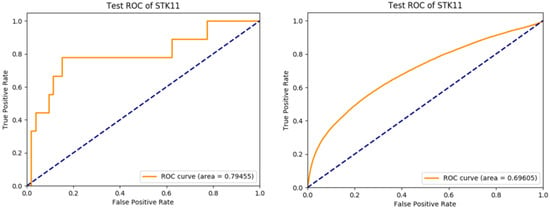
The model achieved per-slide level area under ROC curve of 0.795 (95% CI: 0.601–0.988) and 0.696 (95% CI: 0.692–0.7) at per-tile level (Figure 2). The top-1 accuracy with cutoff at 0.5 was 0.855 (95% CI: 0.742–0.931) at per-slide level and 0.837 (95% CI: 0.835–0.839) at per-tile level. In addition, we also tried an InceptionV3-based model, but the performance was lower with a per-slide level area under ROC curve of 0.64. Considering this is a molecular feature prediction task and the labels are at per-slide level only, we believe that these results are quite decent and successful.

Figure 2.
Per-slide level ROC curve (left) and per-tile level ROC curve (right) of the trained Inception-Resnet-v2 model applying to the test set.
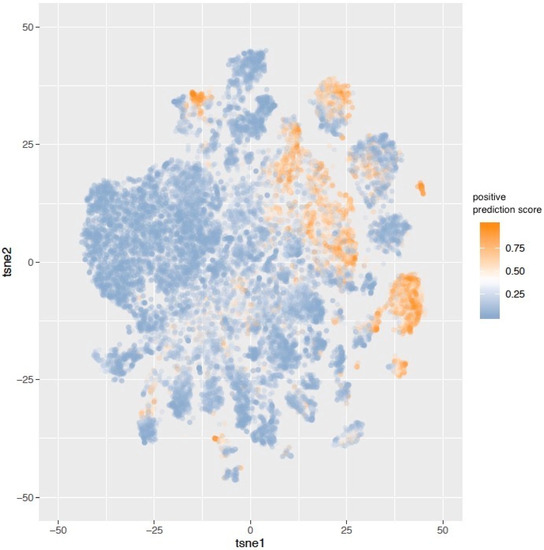
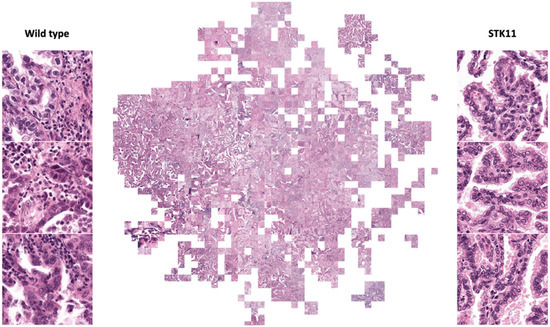
The activation maps before the last fully connected layer of 30,000 randomly selected tiles in the test set were recorded. These activation maps were then projected onto a tSNE plot (Figure 3). To have a more straightforward visualization of the features, we put thresholds on prediction scores and randomly selected tiles to represent their corresponding local binned areas on the tSNE space (Figure 4). An experienced pathologist with no previous knowledge in machine learning interpreted patterns in Figure 4 that tiles in the positively predicted clusters (STK11-mutated) were generally showing plenty of cancer cells with very few immune cells, while a large number of immune cells were present around the cancer cells in the negatively predicted areas (wild-type). In addition, most cancer cells were observed in the areas with high positive or negative prediction scores, suggesting that cancer cells were the main focus of the model in making decisions. These findings validated the molecular studies that STK11 mutation decreases the immune response in LUAD patients.

Figure 3.
30,000 tiles were randomly sampled from the test set. The activation maps before the last fully connected layer of these tiles were represented in the tSNE plot. The color of labels indicates the positive prediction scores of the tiles. Clusters of predicted STK11-mutated and wild-type tiles can be observed.

Figure 4.
Randomly selected tiles represent binned areas on tSNE space (full resolution figure in supplement). Examples of STK11 mutated and wild-type tiles are shown. Cancer cells are the main focuses in these tiles. Predicted STK11 mutated tiles show no immune cells (smaller and darker cells) around cancer cells (larger, lighter, and irregular shape cells) while plenty of immune cells are present in predicted wild-type tiles.
4. Discussion
The model we trained showed capability in predicting STK11 mutation in LUAD patients based on histopathology images. It has great potential in providing guidance to immunotherapies in a faster, cheaper, and more convenient way without any sequencing analyses. Scientifically, it confirms the molecular level findings that STK11 mutation leads to less immune response in LUAD tumor from histopathology perspective and links a critical lung cancer molecular feature to a previously unknown morphological pattern. Moving forward, we will continue working on building the connection between cancer molecular features and morphological features using deep-learning techniques.
Supplementary Materials
The following supporting information can be downloaded at: https://www.mdpi.com/article/10.3390/biomedinformatics2010006/s1, Figure S1: general workflow.
Author Contributions
Conceptualization, R.H., W.L. and D.F.; methodology, R.H.; software, R.H.; validation, R.H. and W.L.; formal analysis, R.H.; investigation, R.H.; resources, R.H.; data curation, R.H.; writing—original draft preparation, R.H.; writing—review and editing, R.H., W.L. and D.F.; visualization, R.H.; supervision, D.F.; project administration, D.F.; funding acquisition, D.F. All authors have read and agreed to the published version of the manuscript.
Funding
This work was supported by NIH/NCI U24CA210972.
Institutional Review Board Statement
Not applicable.
Informed Consent Statement
Not applicable.
Data Availability Statement
Genomics data and digital histopathology data can be found at Genomic Data Commons of National Cancer Institute https://gdc.cancer.gov, accessed on 24 May 2019.
Acknowledgments
We would like to thank the High Performance Computing administration team at NYU Langone Health for maintaining the computational resources of this project.
Conflicts of Interest
The authors declare no conflict of interest.
References
- Mansuet-Lupo, A.; Alifano, M.; Pécuchet, N.; Biton, J.; Becht, E.; Goc, J.; Germain, C.; Ouakrim, H.; Régnard, J.-F.; Cremer, I.; et al. Intratumoral Immune Cell Densities Are Associated with Lung Adenocarcinoma Gene Alterations. Am. J. Respir. Crit. Care Med. 2016, 194, 1403–1412. [Google Scholar] [CrossRef] [PubMed]
- Schumacher, V.; Vogel, T.; Leube, B.; Driemel, C.; Goecke, T.; Möslein, G.; Royer-Pokora, B. STK11 genotyping and cancer risk in Peutz-Jeghers syndrome. J. Med. Genet. 2005, 42, 428–435. [Google Scholar] [CrossRef] [PubMed]
- Dong, Z.-Y.; Zhang, C.; Li, Y.-F.; Su, J.; Xie, Z.; Liu, S.-Y.; Yan, L.-X.; Chen, Z.-H.; Yang, X.-N.; Lin, J.-T.; et al. Genetic and Immune Profiles of Solid Predominant Lung Adenocarcinoma Reveal Potential Immunotherapeutic Strategies. J. Thorac. Oncol. 2018, 13, 85–96. [Google Scholar] [CrossRef] [PubMed]
- Skoulidis, F.; Albacker, L.; Hellmann, M.; Awad, M.; Gainor, J.; Goldberg, M.; Schrock, A.; Gay, L.; Elvin, J.; Ross, J.; et al. MA 05.02 STK11/LKB1 Loss of Function Genomic Alterations Predict Primary Resistance to PD-1/PD-L1 Axis Blockade in KRAS-Mutant NSCLC. J. Thorac. Oncol. 2017, 12, S1815. [Google Scholar] [CrossRef][Green Version]
- Gillette, M.A.; Satpathy, S.; Cao, S.; Dhanasekaran, S.M.; Vasaikar, S.V.; Krug, K.; Petralia, F.; Li, Y.; Liang, W.-W.; Reva, B.; et al. Proteogenomic Characterization Reveals Therapeutic Vulnerabilities in Lung Adenocarcinoma. Cell 2020, 182, 200–225.e35. [Google Scholar] [CrossRef] [PubMed]
- Hong, R.; Liu, W.; DeLair, D.; Razavian, N.; Fenyö, D. Predicting endometrial cancer subtypes and molecular features from histopathology images using multi-resolution deep learning models. Cell Rep. Med. 2021, 2, 100400. [Google Scholar] [CrossRef] [PubMed]
- Kim, R.H.; Nomikou, S.; Coudray, N.; Jour, G.; Dawood, Z.; Hong, R.; Esteva, E.; Sakellaropoulos, T.; Donnelly, D.; Moran, U.; et al. Deep Learning and Pathomics Analyses Reveal Cell Nuclei as Important Features for Mutation Prediction of BRAF-Mutated Melanomas. J. Investig. Dermatol. 2021, in press. [CrossRef]
- Coudray, N.; Ocampo, P.S.; Sakellaropoulos, T.; Narula, N.; Snuderl, M.; Fenyö, D.; Moreira, A.L.; Razavian, N.; Tsirigos, A. Classification and mutation prediction from non–small cell lung cancer histopathology images using deep learning. Nat. Med. 2018, 24, 1559–1567. [Google Scholar] [CrossRef]
- Wang, L.-B.; Karpova, A.; Gritsenko, M.A.; Kyle, J.E.; Cao, S.; Li, Y.; Rykunov, D.; Colaprico, A.; Rothstein, J.H.; Hong, R.; et al. Proteogenomic and metabolomic characterization of human glioblastoma. Cancer Cell 2021, 39, 509–528.e20. [Google Scholar] [CrossRef] [PubMed]
- Kather, J.N.; Pearson, A.T.; Halama, N.; Jäger, D.; Krause, J.; Loosen, S.H.; Marx, A.; Boor, P.; Tacke, F.; Neumann, U.P.; et al. Deep learning can predict microsatellite instability directly from histology in gastrointestinal cancer. Nat. Med. 2019, 25, 1054–1056. [Google Scholar] [CrossRef] [PubMed]
- Szegedy, C.; Ioffe, S.; Vanhoucke, V.; Alemi, A.A. Inception-v4, Inception-ResNet and the Impact of Residual Connections on Learning. In Proceedings of the Thirty-First AAAI Conference on Artificial Intelligence, San Francisco, CA, USA, 4–9 February 2017. [Google Scholar]
- Szegedy, C.; Vanhoucke, V.; Ioffe, S.; Shlens, J.; Wojna, Z. Rethinking the inception architecture for computer vision. In Proceedings of the IEEE Conference on Computer Vision and Pattern Recognition, Las Vegas, NV, USA, 27–30 June 2016; pp. 2818–2826. [Google Scholar]
- Szegedy, C.; Liu, W.; Jia, Y.; Sermanet, P.; Reed, S.; Anguelov, D.; Erhan, D.; Vanhoucke, V.; Rabinovich, A. Going deeper with convolutions. In Proceedings of the 2015 IEEE Conference on Computer Vision and Pattern Recognition (CVPR), Boston, MA, USA, 7–12 June 2015; pp. 1–9. [Google Scholar]
Publisher’s Note: MDPI stays neutral with regard to jurisdictional claims in published maps and institutional affiliations. |
© 2021 by the authors. Licensee MDPI, Basel, Switzerland. This article is an open access article distributed under the terms and conditions of the Creative Commons Attribution (CC BY) license (https://creativecommons.org/licenses/by/4.0/).