Communication

Bridging Spectral Statistics and Machine Learning for Semantic Road Network Analysis

by
Abigail Kelly
1,†,
Ramchandra Rimal
2,*,† and
Arpan Man Sainju
3
1
Computational and Data Science PhD Program, Middle Tennessee State University, Murfreesboro, TN 37128, USA
2
Department of Mathematical Sciences, Middle Tennessee State University, Murfreesboro, TN 37128, USA
3
Department of Computer Science, Middle Tennessee State University, Murfreesboro, TN 37128, USA
*
Author to whom correspondence should be addressed.
These authors contributed equally to this work.
Geomatics 2026, 6(2), 35; https://doi.org/10.3390/geomatics6020035
Submission received: 27 January 2026 / Revised: 25 March 2026 / Accepted: 29 March 2026 / Published: 1 April 2026

Abstract

Accurate identification of road network intersections is essential for urban planning, autonomous navigation, and traffic safety analysis. However, standard approaches relying on local geometric attributes often overlook essential topological information. This limitation is particularly problematic for intersection types that are locally similar but topologically distinct. To address this, we propose a hybrid framework that augments intrinsic node attributes with Generalized Random Dot Product Graph embeddings and neighbor-aggregated features. We utilize tree-based ensemble classifiers, specifically Random Forest and Extreme Gradient Boosting, to process this enriched feature set. Unlike standard spectral methods that assume homophily, this approach explicitly models heterophilous connectivity to capture structural patterns where dissimilar nodes connect. Experiments on a real-world urban road network demonstrate that this topological augmentation yields consistent and robust improvements. The proposed integration with the Extreme Gradient Boosting model achieves a Macro ROC AUC of 0.8966 and a Micro F1 score of 0.7005, outperforming the baseline model (ROC AUC 0.8100, Micro F1 0.5919). Performance gains are most pronounced for topologically ambiguous intersection classes, confirming that local attributes alone fail to capture structural distinctions. These results demonstrate that latent structural context is a critical discriminator for granular road intersection classification.

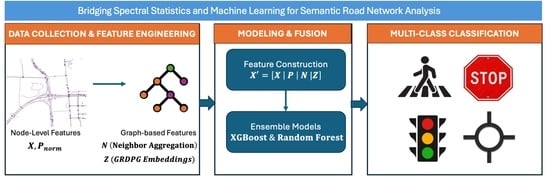
Graphical Abstract

1. Introduction

The realization of Level 5 Autonomous Driving and next-generation Smart City infrastructure relies heavily on the availability of high-fidelity, semantically rich digital maps. Within these complex spatial networks, intersections represent the most critical and hazardous decision-making points. The functional classification of an intersection, whether it is signalized, stop-controlled, or equipped with marked pedestrian infrastructure, directly dictates vehicle trajectory planning, pedestrian safety assessments, and city-wide traffic flow optimization. While proprietary mapping solutions exist, crowdsourced platforms like OpenStreetMap (OSM) have become the global standard for scalable urban planning and open-source geospatial research. However, despite its vast global coverage, OSM data is notoriously semantically sparse [1,2,3,4,5,6,7]. An intersection might be perfectly defined geometrically within the database, yet entirely lack the critical metadata regarding its traffic control mechanisms or pedestrian crossing types.
Inferring these missing attributes from existing, incomplete data presents a unique modeling challenge. In a standard Euclidean feature space, a major signalized intersection and a minor stop-controlled intersection may appear virtually indistinguishable, as they often share identical local physical attributes such as road widths, speed limits, and surrounding land-use types. The true distinguishing factor lies not in their isolated physical properties, but in their topological context within the broader urban network. For instance, signalized intersections typically act as central hubs connecting high-traffic arterial roads, whereas unmarked pedestrian crossings are more frequently embedded within the peripheral subgraphs of residential neighborhoods.
Despite the inherent, fundamental graph structure of urban road networks, traditional supervised learning approaches such as Random Forest and eXtreme Gradient Boosting (XGBoost) treat intersections as independent and identically distributed (i.i.d.) entities. This Euclidean bias discards the rich, relational dependencies encoded in the network’s topology. Conversely, while deep Graph Neural Networks (GNNs) explicitly model these spatial dependencies, they introduce significant computational overhead and suffer from a “black-box” opacity that limits the auditability required for safety-critical transportation systems. To bridge this methodological gap, this research proposes a novel topology-as-feature approach. By leveraging Latent Position Models (LPMs), specifically the Generalized Random Dot Product Graph (GRDPG) [8,9,10], we map the underlying network topology into a mathematically rigorous, continuous latent space. This allows us to capture complex graph structures without sacrificing the speed or interpretability of traditional classifiers.
The primary contributions of this work are as follows:
  • Framework for Topological Augmentation: We propose a highly efficient, hybrid classification framework that seamlessly augments intrinsic node attributes with GRDPG spatial embeddings and neighbor-aggregated features. These augmented features are then processed utilizing robust, tree-based ensemble classifiers (Random Forest and XGBoost).
  • Handling Network Heterophily: We demonstrate that our augmented topological features effectively capture the disassortative mixing (heterophily) inherent in urban road networks. This provides the essential structural context needed to differentiate structurally dissimilar, yet physically connected, intersection nodes.
  • Empirical Validation on Urban Data: Utilizing a massive dataset of over 48,000 intersections across New York City, we empirically prove that topological context is the definitive discriminator for identifying urban infrastructure. Our augmented XGBoost model achieves a + 71.88 % relative improvement in F1 score over the baseline model for the highly challenging marked_crossing class.
The rest of the paper is organized as follows. Section 2 explains the related work in this field. Section 3 explores the implementation of the proposed models. Within this section, Section 3.1 discusses the problem formulation, and Section 3.2 covers data collection and preparation, including graph extraction, label generation, and feature engineering. Section 3.3 presents the exploratory data analysis, Section 3.4 details structural feature extraction with GRDPG and feature augmentation, and Section 3.5 discusses the classification models and statistical validation. Model outcomes, including the predictive capability after tuning hyperparameters, are presented in Section 4. Finally, Section 5 presents the discussion, and Section 6 outlines the conclusion and future work, followed by author contributions, data availability, acknowledgments, and a list of references.

2. Related Work

Urban road networks have been widely studied using tools from network science. Early work demonstrated how centrality measures such as closeness, straightness, and information centrality reveal hierarchical structures and differentiate between planned and self-organized cities, indicating that street networks encode meaningful relationships within urban environments [11,12,13]. Furthermore, metrics like connectivity, redundancy, and efficiency serve as vital indicators of how urban transportation systems support spatial movement [14]. This foundational research is critical for understanding how network topology shapes mobility, accessibility, and route performance. Other studies have evaluated road network resilience under disruptions [15,16,17,18], assessing how the failure of critical intersections affects travel patterns and costs, or have simulated traffic congestion dynamics [19,20,21,22]. However, while these traditional approaches provide valuable insights into macro-scale network behavior, they typically focus on global structural characteristics rather than leveraging network topology for granular, node-level semantic inference.
To bridge this gap, recent work has begun leveraging multi-source data and advanced learning architectures to address the inherent incompleteness, label noise, and spatial inconsistency in crowdsourced datasets such as OSM [4,5,6]. For instance, to jointly capture topology and appearance, street-block-based graph neural networks fused with convolutional and multilayer perceptron components have been employed to classify urban street-network morphology. This approach integrates topological, geometric, and visual cues, demonstrating the value of multi-model fusion for structure-aware inference at a city-wide scale [23]. Complementing this morphological analysis, researchers have successfully imputed missing network attributes by combining OSM context—such as crossings, traffic signals, and land-use intensity with visual indicators from Street View imagery using scalable graph encoders. This enables citywide traffic speed-class inference that generalizes well to previously unobserved suburban areas [24]. At the physical infrastructure level, attention-augmented MaskCNNs and standard CNNs applied to high-resolution aerial and satellite imagery have successfully improved road-surface material classification and road detection [25,26,27]. These models mitigate OSM label inconsistencies through hierarchical loss functions that penalize semantically distant errors. Finally, the semantic completeness of OSM functional tags has been substantially enhanced through network-based hierarchical feature augmentation, which aggregates geometric, centrality, and semantic information across multiple scales, yielding marked gains in predictive accuracy across diverse urban and rural settings [28]. The most recent paradigm shift in spatial analytics involves modeling the street network as a mathematical graph to capture deep structural dependencies [29]. GNNs have shown significant promise in this domain; for example, He et al. [30] proposed RoadTagger, an architecture that infers road attributes by passing spatial messages along the graph structure.
While recent machine learning architectures have significantly advanced structural feature extraction, statistical network modeling provides the rigorous mathematical foundation required to capture the deep, underlying complexities of relational topologies. Traditional approaches, such as Stochastic Block Models (SBM), represent networks through discrete partitions [31]. More recently, latent position models like the Random Dot Product Graph (RDPG) have advanced this paradigm by embedding nodes into continuous latent feature spaces [32]. However, while RDPGs successfully capture the homophilic relationships typically found in social networks, they struggle with heterophilic structures in which highly dissimilar nodes frequently interact. The Generalized Random Dot Product Graph (GRDPG) overcomes this critical limitation by embedding nodes into an indefinite metric space. This theoretical flexibility has proven highly effective in modeling complex, heterophilic domains, ranging from mapping neural connectomes [9,33] to detecting anomalies in cybersecurity networks [10]. Because GRDPG is explicitly designed to handle heterophily, it is well-suited for urban road networks, which are defined by structural dissimilarity, such as major arterial highways that routinely connect to local access ramps. The fundamental novelty of our proposed work lies in adapting this advanced statistical framework for urban geospatial analysis. By fusing the mathematically rigorous, global structural embeddings of GRDPG with granular local node attributes, we introduce a novel methodology that resolves the semantic ambiguities and label noise that traditionally bottleneck standard classifiers.

3. Methodology

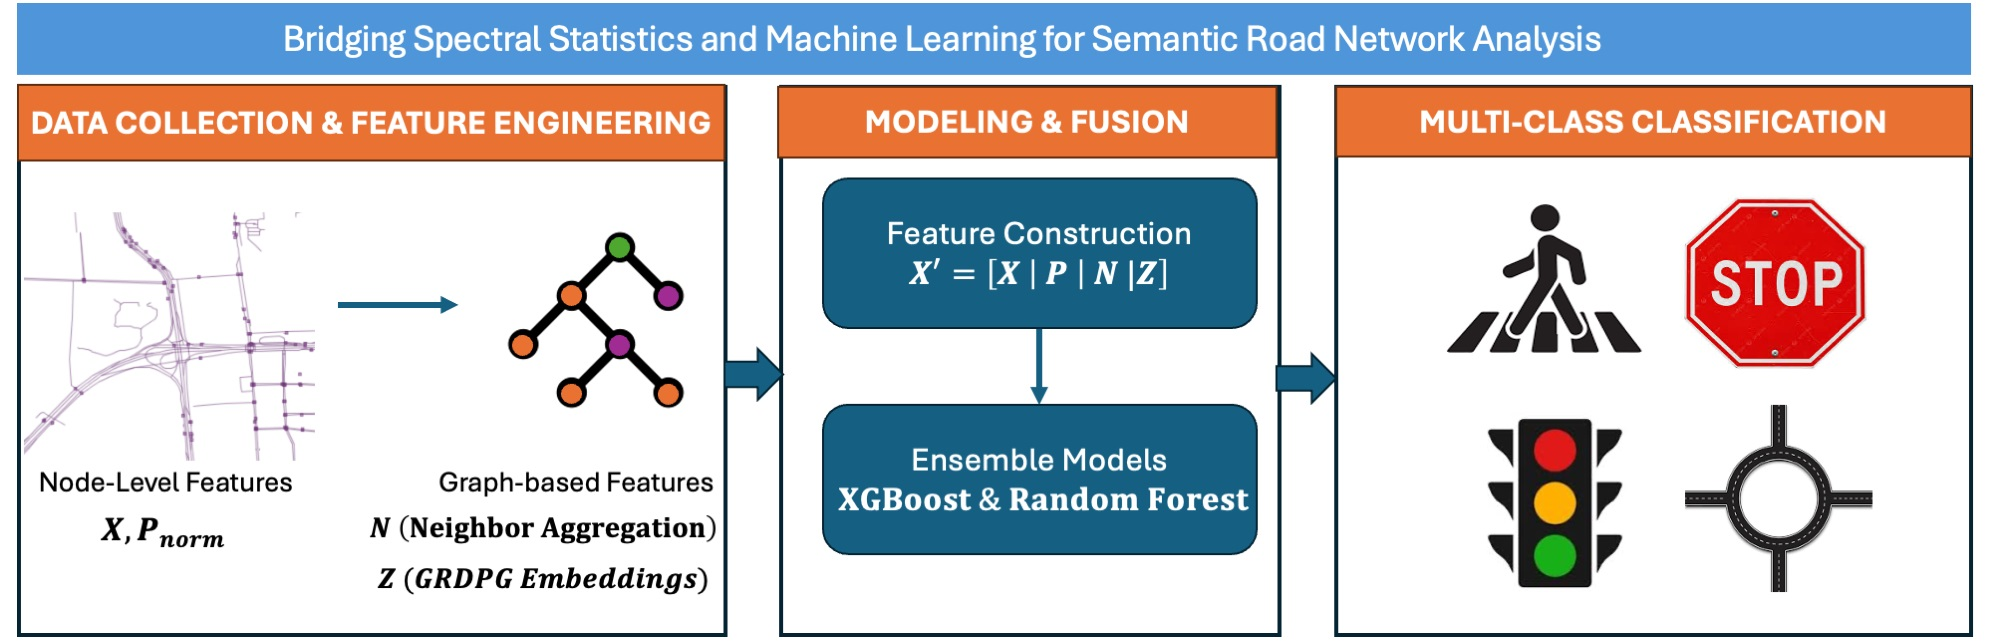
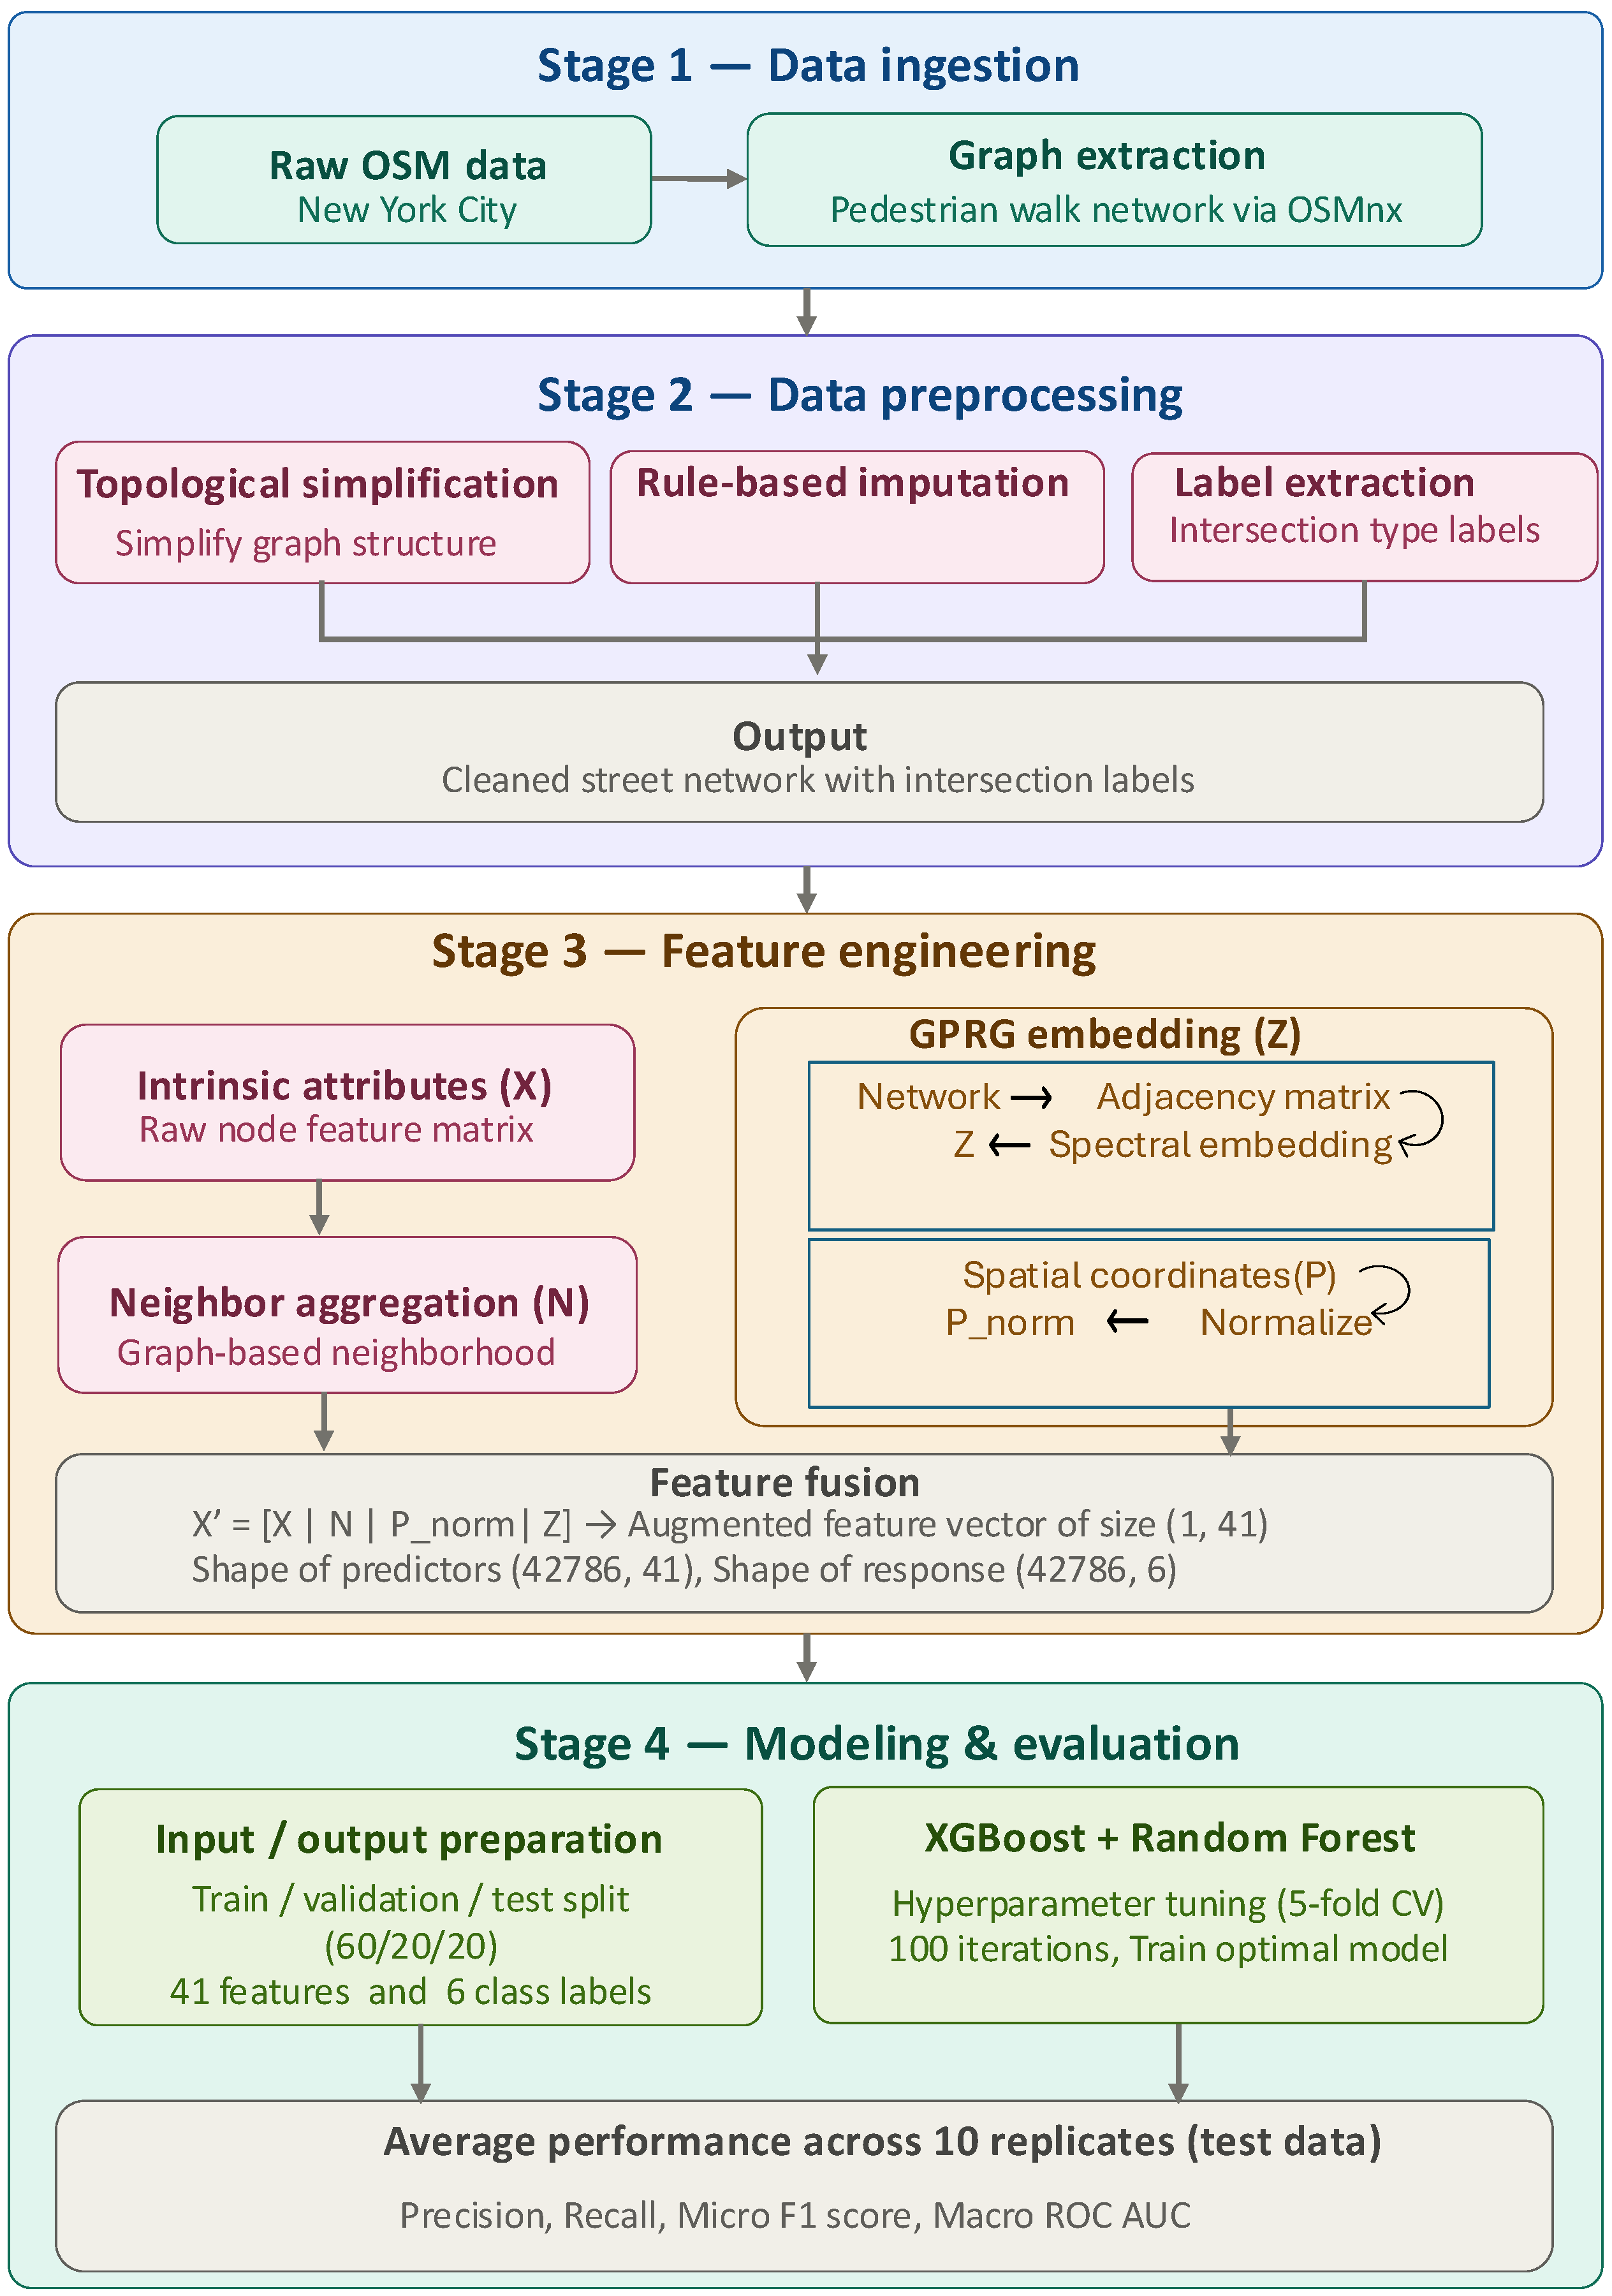
This section provides the details of the proposed methodological framework. The bird’s-eye view of the proposed research framework via the schematic diagram is expressed in Figure 1. As outlined in the diagram, the proposed study begins by formally defining the intersection classification task as a multi-label problem. Subsequent subsections describe the data collection and preparation pipeline, the extraction of latent topological features using GRDPG, and the specific tree-based ensemble models and validation protocols used to evaluate performance.

3.1. Problem Formulation

Let G = ( V , E ) be a graph representing the road network, where V is the set of n nodes (intersections), and E is the set of edges (road segments). Each node is associated with a feature matrix X R n × d , where d denotes the dimension of the intrinsic node attributes. The graph structure is represented by an adjacency matrix A R n × n , where the entry A i , j = 1 if an edge exists between node i and node j, and A i , j = 0 otherwise [34].
The objective is to learn a mapping function f : V Y that assigns each node a label from a set of intersection types Y. This is formulated as a multi-label classification problem, as a single intersection may simultaneously be signalized and possess a marked crossing.

3.2. Data Collection and Preparation

The dataset was constructed using OSM data covering the New York City metropolitan area. The preparation pipeline involved three stages: graph extraction, feature engineering, and label generation.

3.2.1. Graph Extraction

We utilized the OSMnx library [35] to query the OSM database and extract the pedestrian road network. Specifically, we extracted the street graph using the setting network_type=“walk”, which retrieves edges corresponding to pedestrian-accessible streets and paths defined by the OSM highway key (e.g., residential, primary, secondary, tertiary, service, footway, and path). From the extracted road network, we used the OSM attributes lanes, maxspeed, junction, bridge, and tunnel. The lanes and maxspeed tags were used to derive intersection-level features by aggregating values from all road segments incident to each intersection. In particular, we computed the mean and maximum number of lanes and the mean and maximum speed limits across incident edges. The junction tag was used to identify roundabouts (junction=roundabout), while the bridge and tunnel tags were used to detect intersections located near bridges or tunnels.
The raw geospatial data was processed to create a topologically simplified graph. In OSM, a physical intersection may be represented by multiple nearby nodes since the database encodes detailed roadway geometry like curves, medians, and roundabouts. These additional nodes represent geometric shape points rather than distinct intersections. Therefore, we applied a spatial consolidation process: nodes within a 15-m tolerance were merged into single centroids, constituting our vertex set V ( n =  48,360). Edges E were defined as navigable road segments connecting these consolidated intersections. While the pedestrian network is inherently directed, we treated the graph as undirected for the learning task to capture bidirectional connectivity.

3.2.2. Feature Engineering

For each node v i V , we constructed a feature vector that combines spatial coordinates with structural and roadway attributes derived from OSM. The spatial features are projected planar coordinates x and y, expressed in meters, which preserve local distance relationships in the road network. The intersection attributes form a seven-dimensional vector derived from the road network topology and roadway metadata stored in OSM. These features are computed from the OSM edge attributes lanes and maxspeed, together with graph structure derived from the extracted network. The seven dimensions are defined as follows:
  • Node degree: number of neighboring intersections directly connected to the node.
  • Clustering coefficient: local clustering coefficient computed from the intersection graph, measuring the connectivity among neighboring intersections.
  • Number of incident edges: total number of road segments meeting at the intersection.
  • Mean number of lanes: average value of the OSM lanes tag across all incident road segments.
  • Maximum number of lanes: maximum value of the lanes tag across incident road segments.
  • Mean speed limit: average value of the OSM maxspeed tag across incident road segments.
  • Maximum speed limit: maximum value of the maxspeed tag across incident road segments.
For example, a four-way intersection with two lanes in each direction may have a degree of four but eight incident edges, reflecting the higher structural complexity. In the raw OSM data, some roadway attributes such as lanes and maxspeed are occasionally missing or inconsistently mapped. To mitigate this issue, missing values were imputed using rule-based defaults conditioned on road type. For instance, residential streets were assigned two lanes and a speed limit of 25 mph when these attributes were absent. This strategy allows the model to incorporate approximate roadway characteristics while maintaining robustness to incomplete OSM metadata.

3.2.3. Label Generation

Manual annotation at this scale is infeasible. Therefore, we generated labels using a spatial querying approach. For each intersection centroid, we applied a search radius of 30 m [36] to detect the presence of relevant OSM tags, including traffic signals, stop signs, and pedestrian crossing markings. The resulting multi-label target is a binary vector
y = [ y 1 , y 2 , , y 6 ] , y i { 0 , 1 } ,
where each element corresponds to a specific attribute:
  • signalized: Traffic signal presence.
  • marked_crossing: Presence of marked pedestrian crossings.
  • crossing_signalized: Crossing specifically controlled by a signal.
  • crossing_marked: Marked crossing without necessary signalization.
  • crossing_unmarked: Pedestrian crossing point without markings.
  • stop_any: Stop sign controlling any approach.
To assess the reliability of the automatically generated labels, we performed several data validation steps. First, we analyzed label prevalence and co-occurrence statistics across the dataset to identify anomalous or extremely rare attributes. Labels with very low support were excluded from the final label set to reduce noise caused by incomplete OSM tagging. Second, we evaluated correlations and logical relationships between labels (e.g., whether one label consistently implied another). This analysis helped identify redundant labels and ensure consistency among the generated annotations. These verification steps reduce the impact of incomplete or inconsistent OSM tags. However, because OSM is a volunteered geographic information source, the resulting annotations should still be interpreted as weak supervision rather than perfectly verified ground truth.

3.3. Exploratory Data Analysis

Before training, we analyzed the dataset to validate label consistency and topological properties.
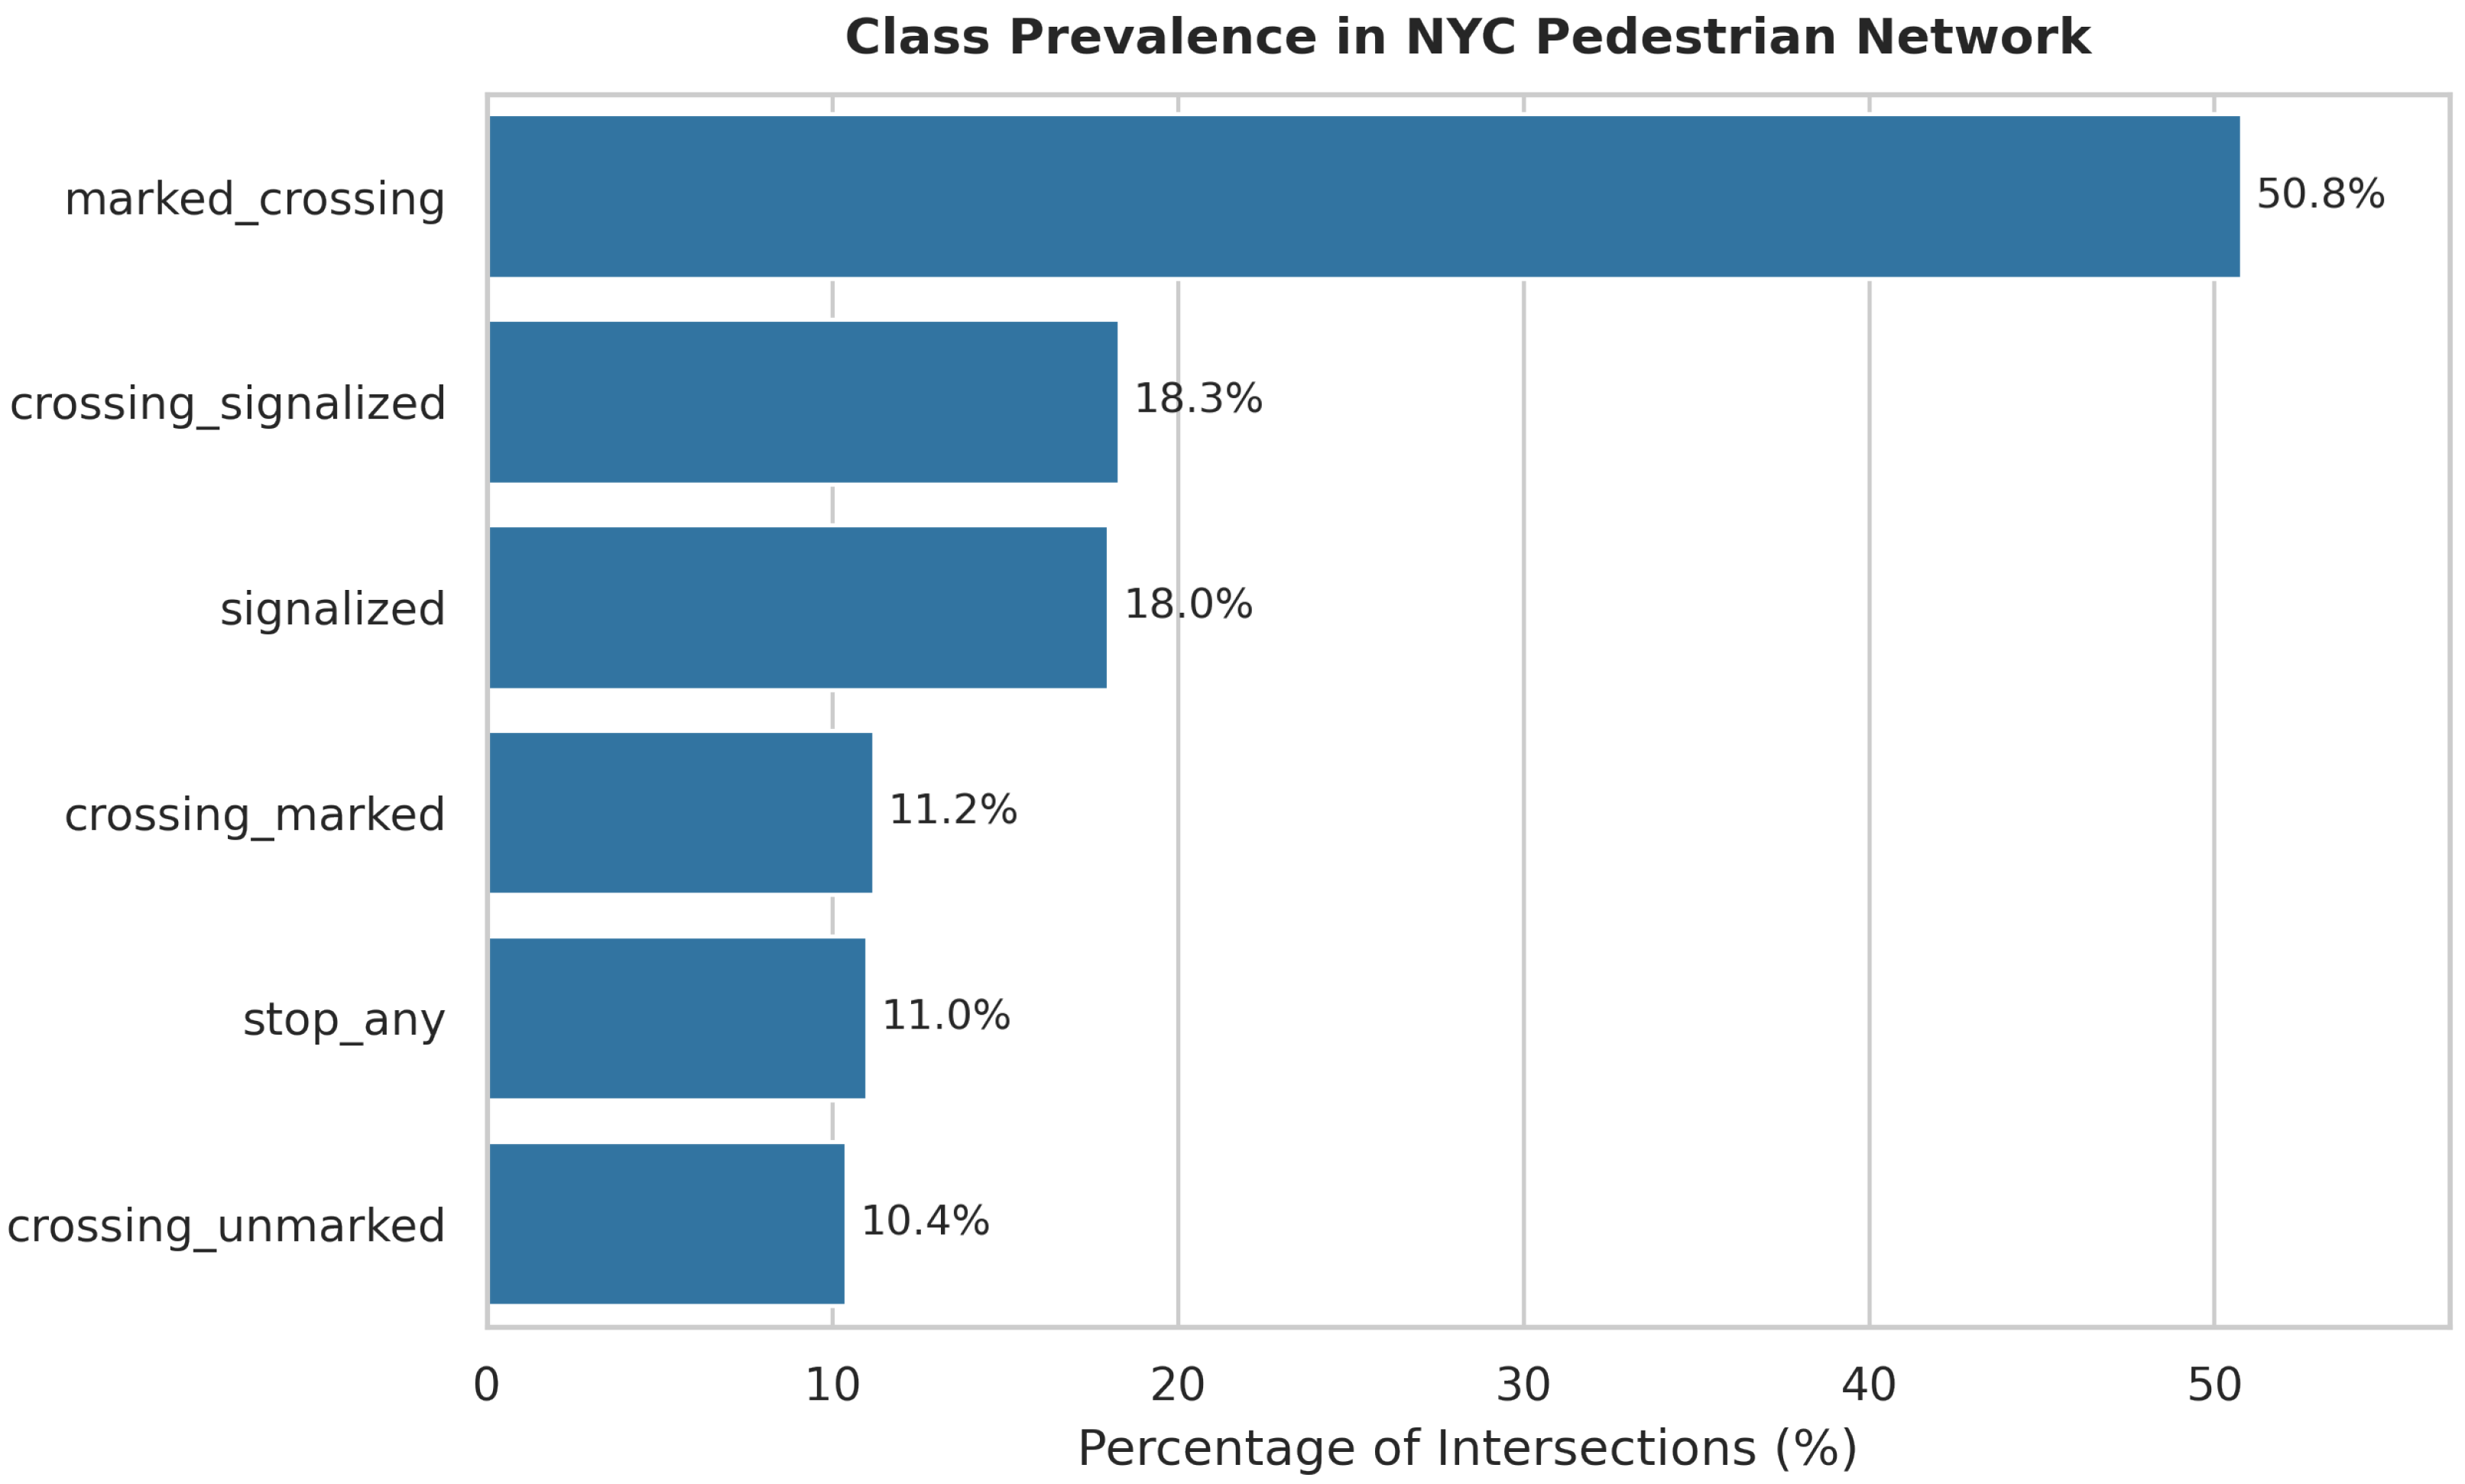
  • Label Prevalence: The dataset exhibits significant class imbalance (Figure 2), with marked_crossing appearing in 50.8% of intersections.
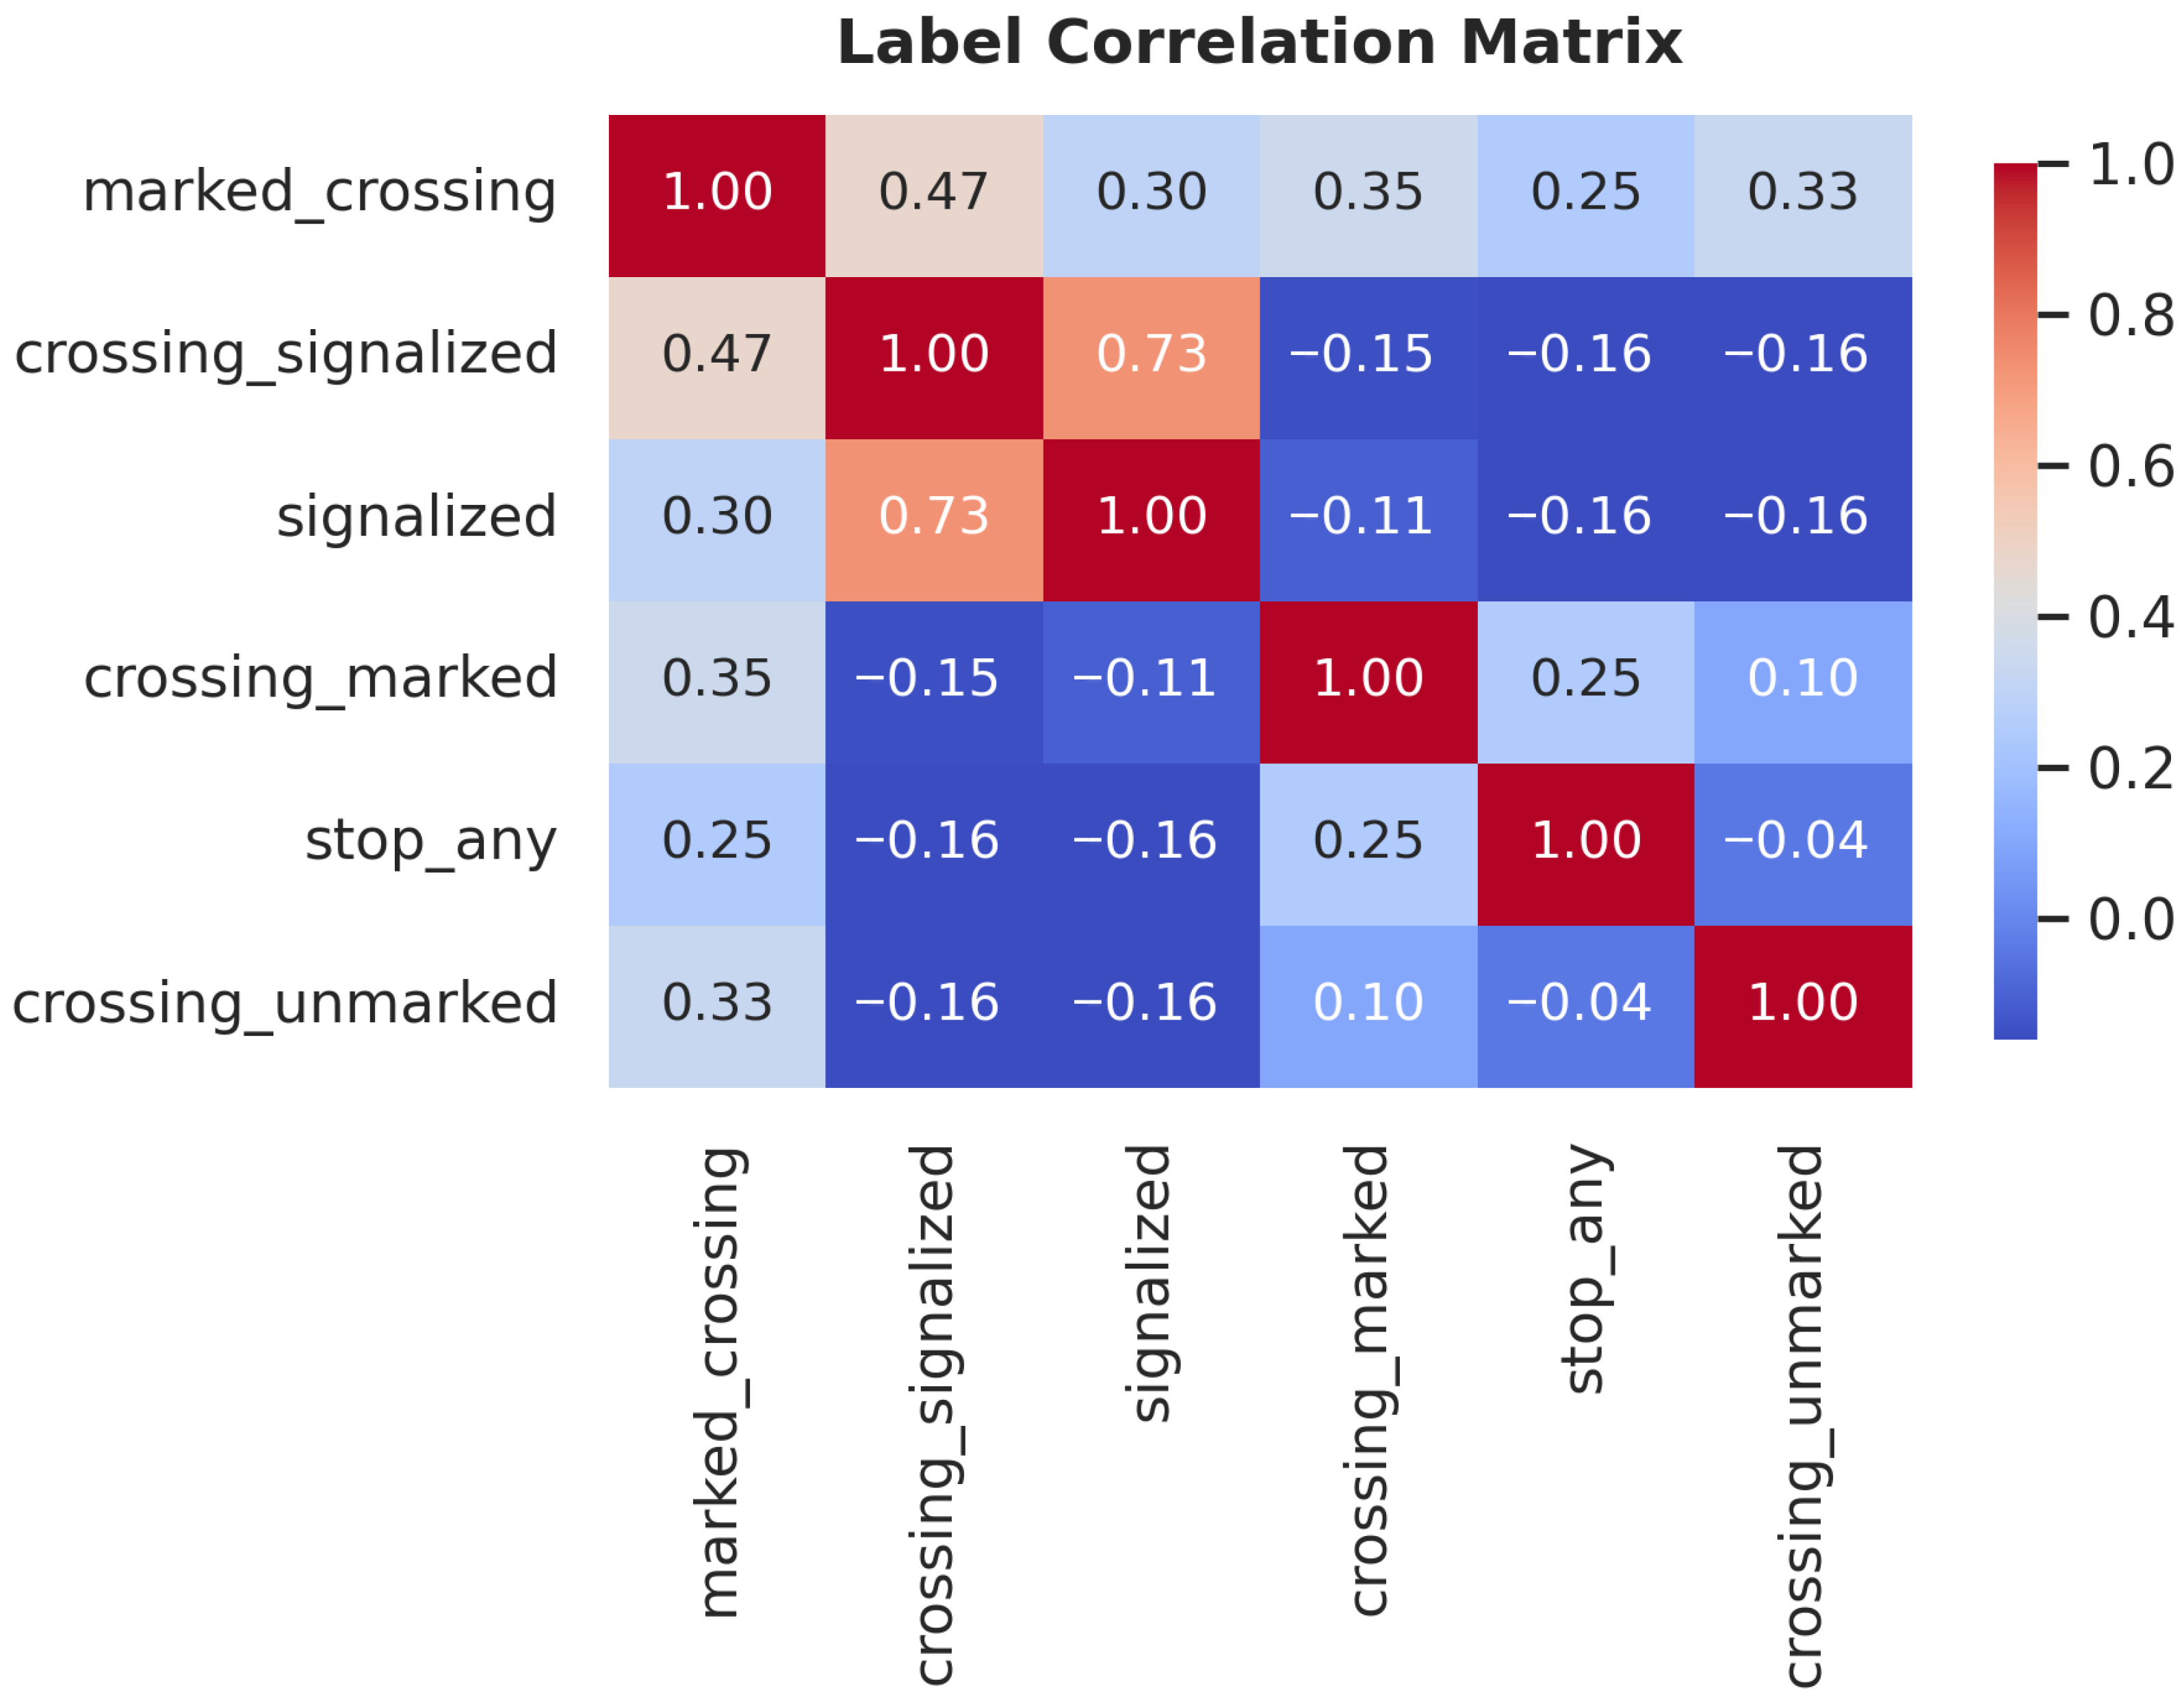
  • Label Correlation: Figure 3 shows the Pearson correlation between labels. A strong positive correlation exists between signalized and crossing_signalized, indicating that traffic signals and signalized pedestrian crosswalks typically co-occur.
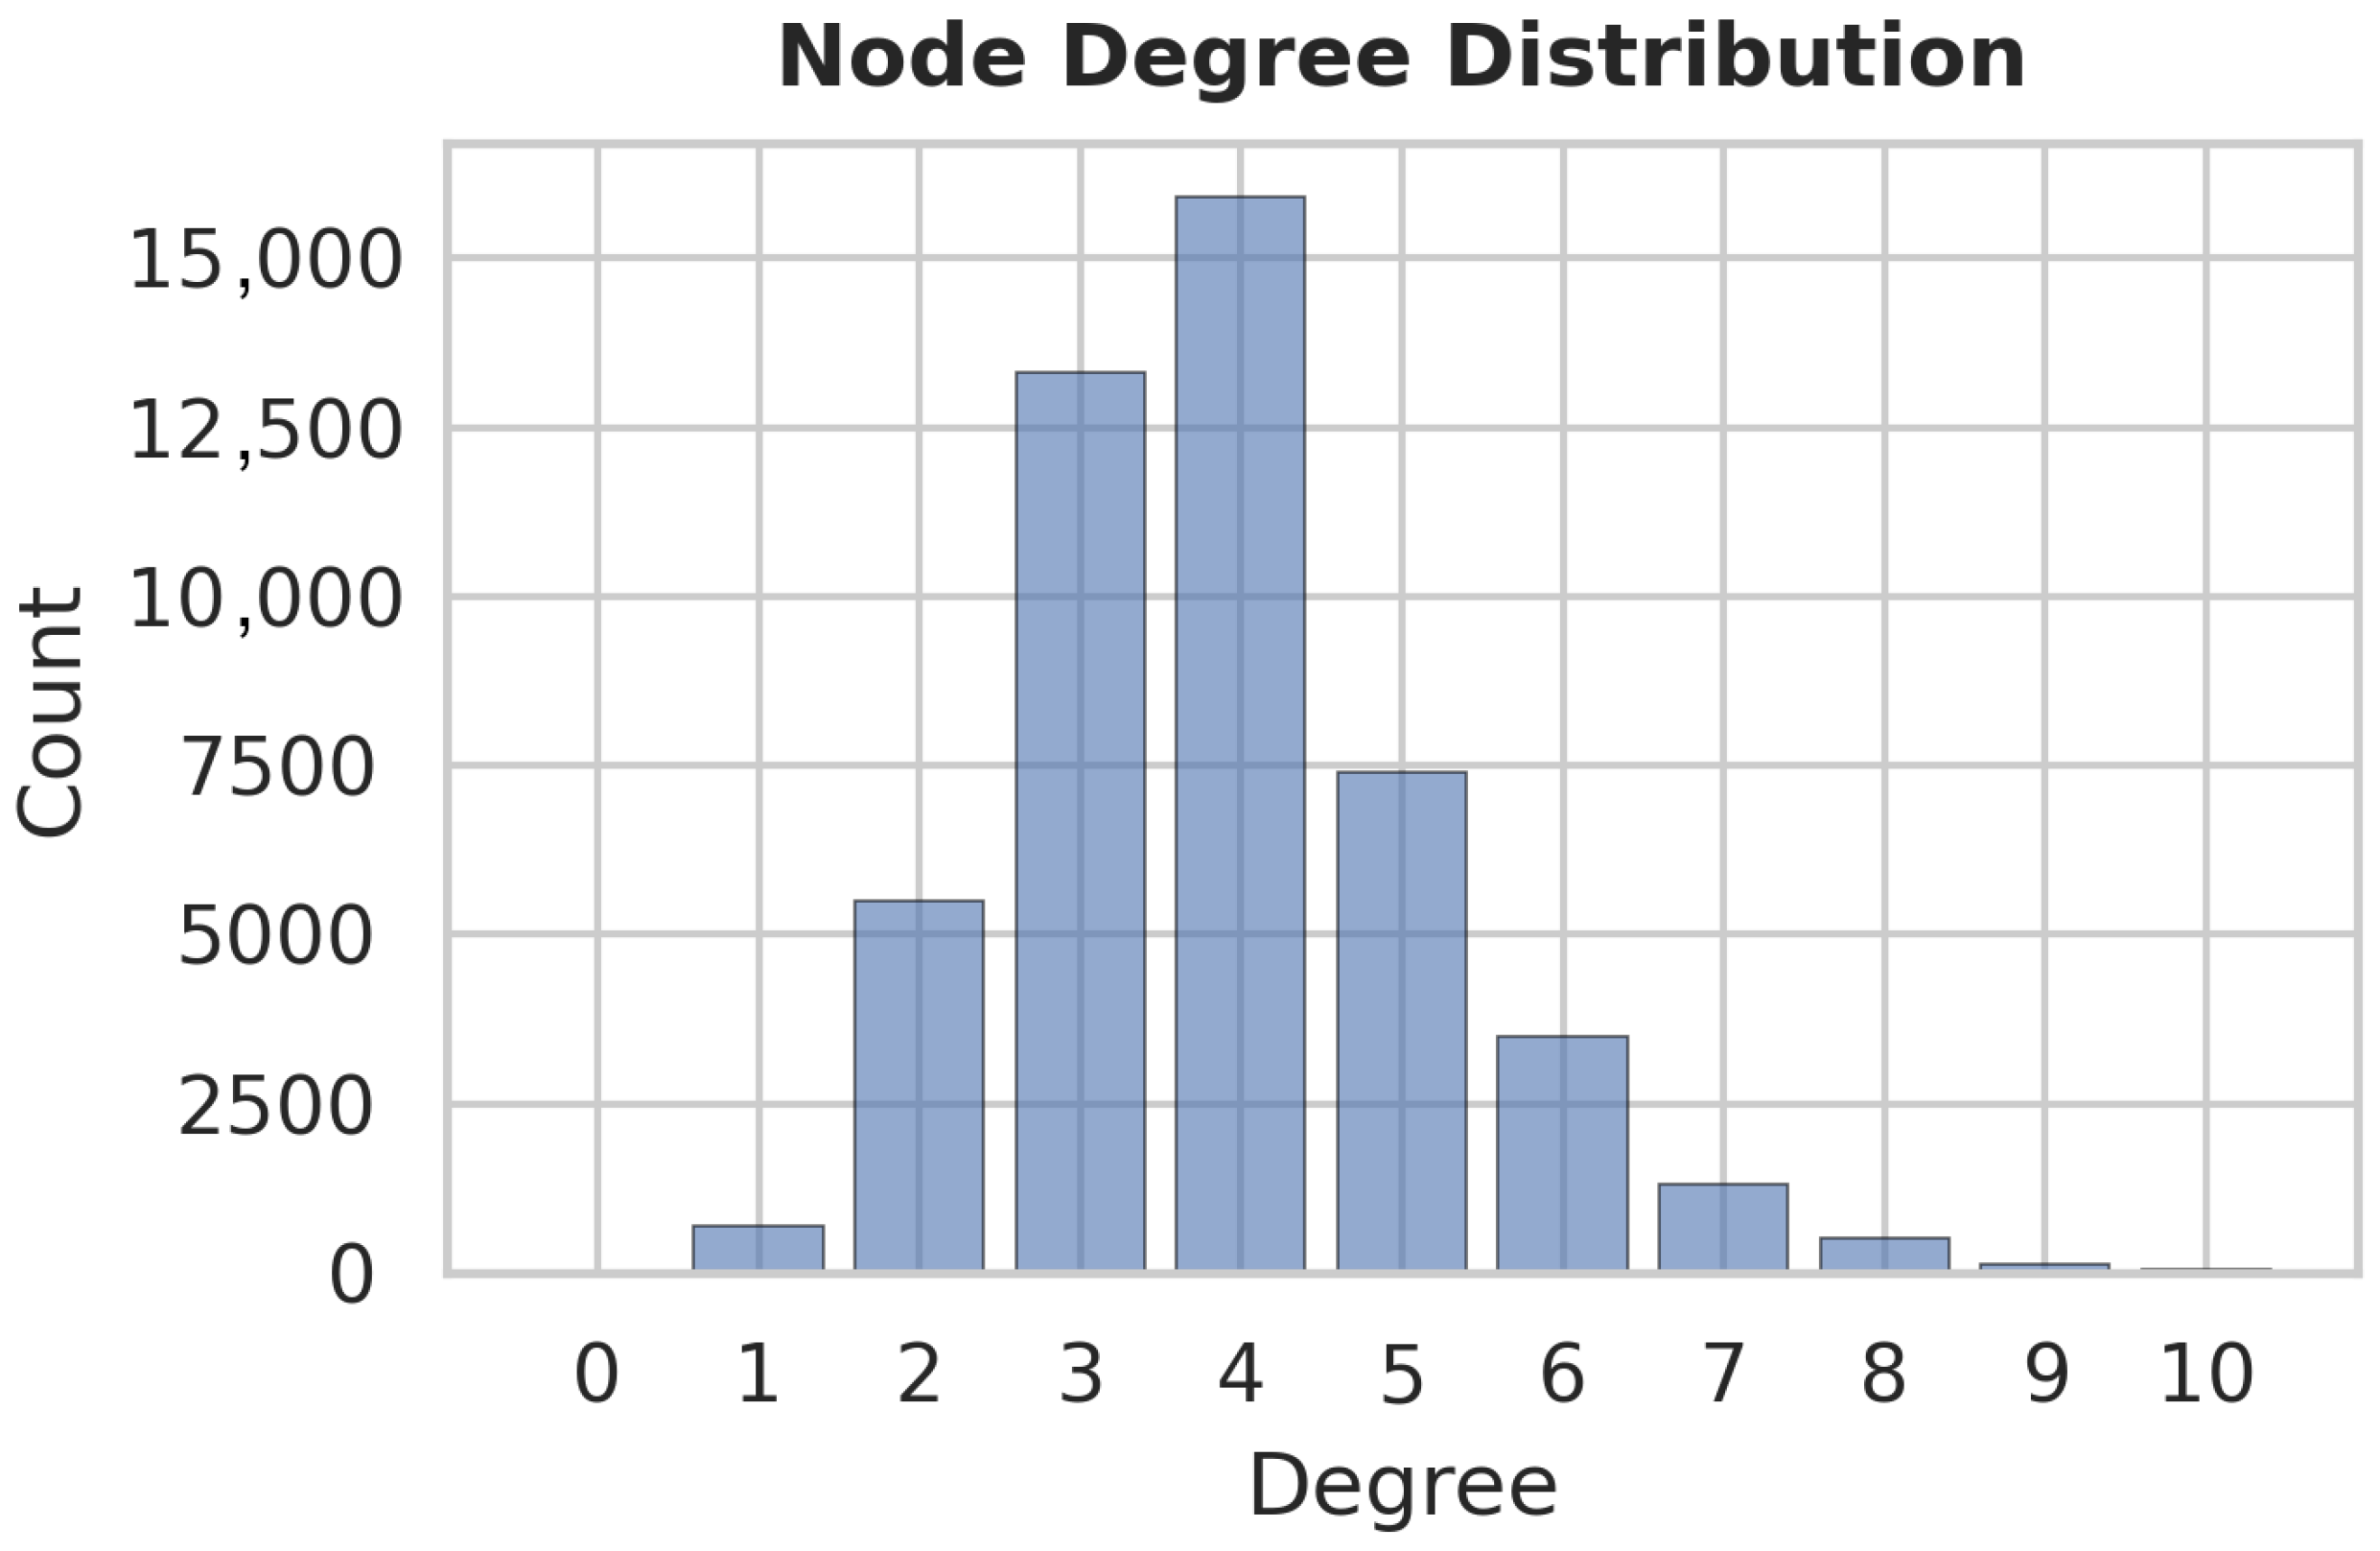
  • Network Topology: The node degree distribution (Figure 4) is bimodal, peaking at k = 4 (standard cross-streets, ≈16,000 nodes) and k = 3 (T-intersections, ≈13,500 nodes). This structural regularity supports the use of spectral embedding methods to capture local neighborhood geometry.

3.4. Structural Feature Extraction with GRDPG and Feature Augmentation

To quantify the topological role of each intersection, we employ the GRDPG framework [8]. As established in the Introduction, this model extends standard LPMs by relaxing the positive semidefinite constraint. This flexibility enables the latent space to capture disassortative mixing patterns in which dissimilar nodes connect, a critical characteristic of road networks. Mathematically, the edge probability in GRDPG is given by the indefinite inner product:
P i j = z i I p , q z j
where z i , z j R k represent the latent position vectors (the rows of matrix Z ) for nodes i and j, and I p , q is a diagonal matrix with p ones and q minus ones ( k = p + q ). The parameters p and q correspond to the positive and negative eigenvalues of the adjacency matrix, respectively. This indefinite inner product ensures that the calculated probability P i j remains within the valid range [ 0 , 1 ] even when the underlying probability matrix is not positive semidefinite [9], effectively capturing disassortative mixing patterns.
To generate the embeddings, we employed Adjacency Spectral Embedding (ASE). As established by [8], ASE provides a consistent estimator for the latent positions of a GRDPG, effectively recovering the underlying geometry of the graph. First, the edge list was converted into a sparse symmetric adjacency matrix A { 0 , 1 } n × n . Then we performed a truncated Singular Value Decomposition on A to extract the top k = 32 singular values and corresponding vectors. The threshold was empirically determined to maximize predictive power while minimizing model complexity. Finally, the spectral embedding Z R n × k was computed as:
Z = U k S k 1 / 2
where U k contains the leading k singular vectors, and S k is the diagonal matrix of the top k singular values.
The final augmented feature matrix X combines intrinsic attributes X , spectral embeddings Z , normalized spatial coordinates P norm , and neighbor-aggregated features N computed as the mean attributes of directly connected intersections:
X = X     Z     P norm     N
where P norm represents z-score normalized coordinates. Neighbor-aggregated features provide local attribute context from the network, complementing intrinsic and embedding-based representations.

3.5. Classification Models & Statistical Validation

We employed two tree-based ensemble methods: Random Forest and XGBoost. These models were selected for their ability to capture non-linear interactions between topological and spatial features and their invariance to monotonic feature transformations [37,38]. We will use the terms baseline model for the model trained on the original features X and the augmented model for the model trained on the X .

3.5.1. Model Configurations

We define the classification task as learning a decision function f from the feature space to the target labels using tree-based ensembles.
Random Forest: We construct an ensemble of B de-correlated decision trees { h ( x ; Θ b ) } b = 1 B , where Θ b captures the stochastic bootstrap sampling and feature selection [39]. For a given input x , the final class prediction y ^ R F is obtained via majority voting (for discrete labels) or probability averaging:
y ^ R F = mode { h ( x ; Θ 1 ) , , h ( x ; Θ B ) }
This aggregation shown in (1) reduces the variance of the estimator, mitigating the overfitting often observed in individual decision trees. XGBoost: We employ Gradient Boosting, where trees are added sequentially to minimize a regularized objective. At iteration t, the additive model y ^ i ( t ) = y ^ i ( t 1 ) + f t ( x i ) minimizes the following objective:
L ( t ) = i = 1 n l ( y i , y ^ i ( t 1 ) + f t ( x i ) ) + Ω ( f t )
where l is the differentiable convex loss function and Ω ( f t ) is the regularization term defined as:
Ω ( f t ) = γ T + 1 2 λ w 2
Here, T is the number of leaves and w represents the leaf weights. The parameter γ in the loss function (2) specifies the minimum loss reduction required to make a further partition on a leaf node, while λ controls the L2 regularization on leaf weights to ensure smoothness and prevent overfitting [40].
Hyperparameter Tuning: Hyperparameter tuning was conducted using a randomized search strategy with 5-fold cross-validation to identify model configurations that effectively balance predictive accuracy and generalization. The search space was sampled across 100 iterations. For the XGBoost model, the learning rate was restricted to a narrow range (0.005–0.05) to promote stable training, while the number of boosting rounds was varied between 600 and 1200 estimators. Both depth-wise and loss-guided tree construction strategies were evaluated to enable the model to adapt to the heterogeneous geometric structures inherent in different intersection types. The optimal XGBoost configuration yielded an ensemble of 848 trees with a maximum depth of 17 and a learning rate of approximately 0.015. To strictly control overfitting and manage the dataset’s inherent class imbalance, this final model utilized a loss-guided growth policy, high subsampling rates (subsample = 0.99, colsample_bytree = 0.94), explicit L1 and L2 regularization penalties ( α = 0.86 , λ = 2.43 ), and a positive class scaling weight of 5.
For the Random Forest classifier, the hyperparameter search space included estimator counts between 100 and 1500. Model complexity was controlled by varying maximum tree depths from 20 to 60 and imposing constraints on minimum leaf nodes. The maximum proportion of features evaluated per split was capped at 40% to encourage the learning of the broader global context rather than overfitting to specific local attributes. The optimal Random Forest configuration yielded an ensemble of 927 trees with a maximum depth of 35, utilizing the log loss criterion and a balanced subsample weighting scheme to dynamically handle class imbalance.
Class imbalance was addressed for the XGBoost model by introducing class-dependent weighting. Instead of applying the inverse class frequency weights unchanged, we scaled them by factors between 0.1 and 0.75, allowing the optimization process to adjust the relative cost of misclassification based on validation performance. Various class weights, including balanced ones, are used for the Random Forest to address class imbalance. In addition, prediction thresholds were not fixed at the default value of 0.5. For each class, Precision–Recall curves were computed on the validation set, and the decision threshold τ c that maximized the corresponding F 1 score was selected. This class-specific calibration helped account for differences in detection difficulty across intersection categories.

3.5.2. Validation Protocol

To ensure stability, we implemented a repeated random subsampling validation scheme with 10 independent trials. In each trial, data were stratified into training (60%), validation (20%), and testing (20%) sets. We utilized a paired experimental design: for every trial, models were trained on identical splits using either the baseline features ( X ) or the augmented features ( X ).
Performance is reported using Precision (P), Recall (R), and F 1 -score. Given the multi-label nature of the task, we report both Micro and Macro averages:
P m i c r o = i = 1 C T P i i = 1 C ( T P i + F P i ) , R m i c r o = i = 1 C T P i i = 1 C ( T P i + F N i ) , F 1 m i c r o = 2 · P m i c r o · R m i c r o P m i c r o + R m i c r o
where T P i , F P i , and F N i in Equation (3) denote the number of true positives, false positives, and false negatives for the i-th class, respectively, and C represents the total number of classes.
The Micro-average gives equal weight to every instance, making it robust for overall system performance, while the Macro-average ( F 1 macro = 1 C i = 1 C F 1 i ) treats all classes equally, penalizing models that fail on rare intersection types.

4. Results

This section presents the experimental results evaluating the efficacy of incorporating topological embeddings into intersection classification models. The analysis is organized into four components: global performance metrics, class-specific performance gains, false positive reduction, and feature importance rankings.

4.1. Comparative Analysis

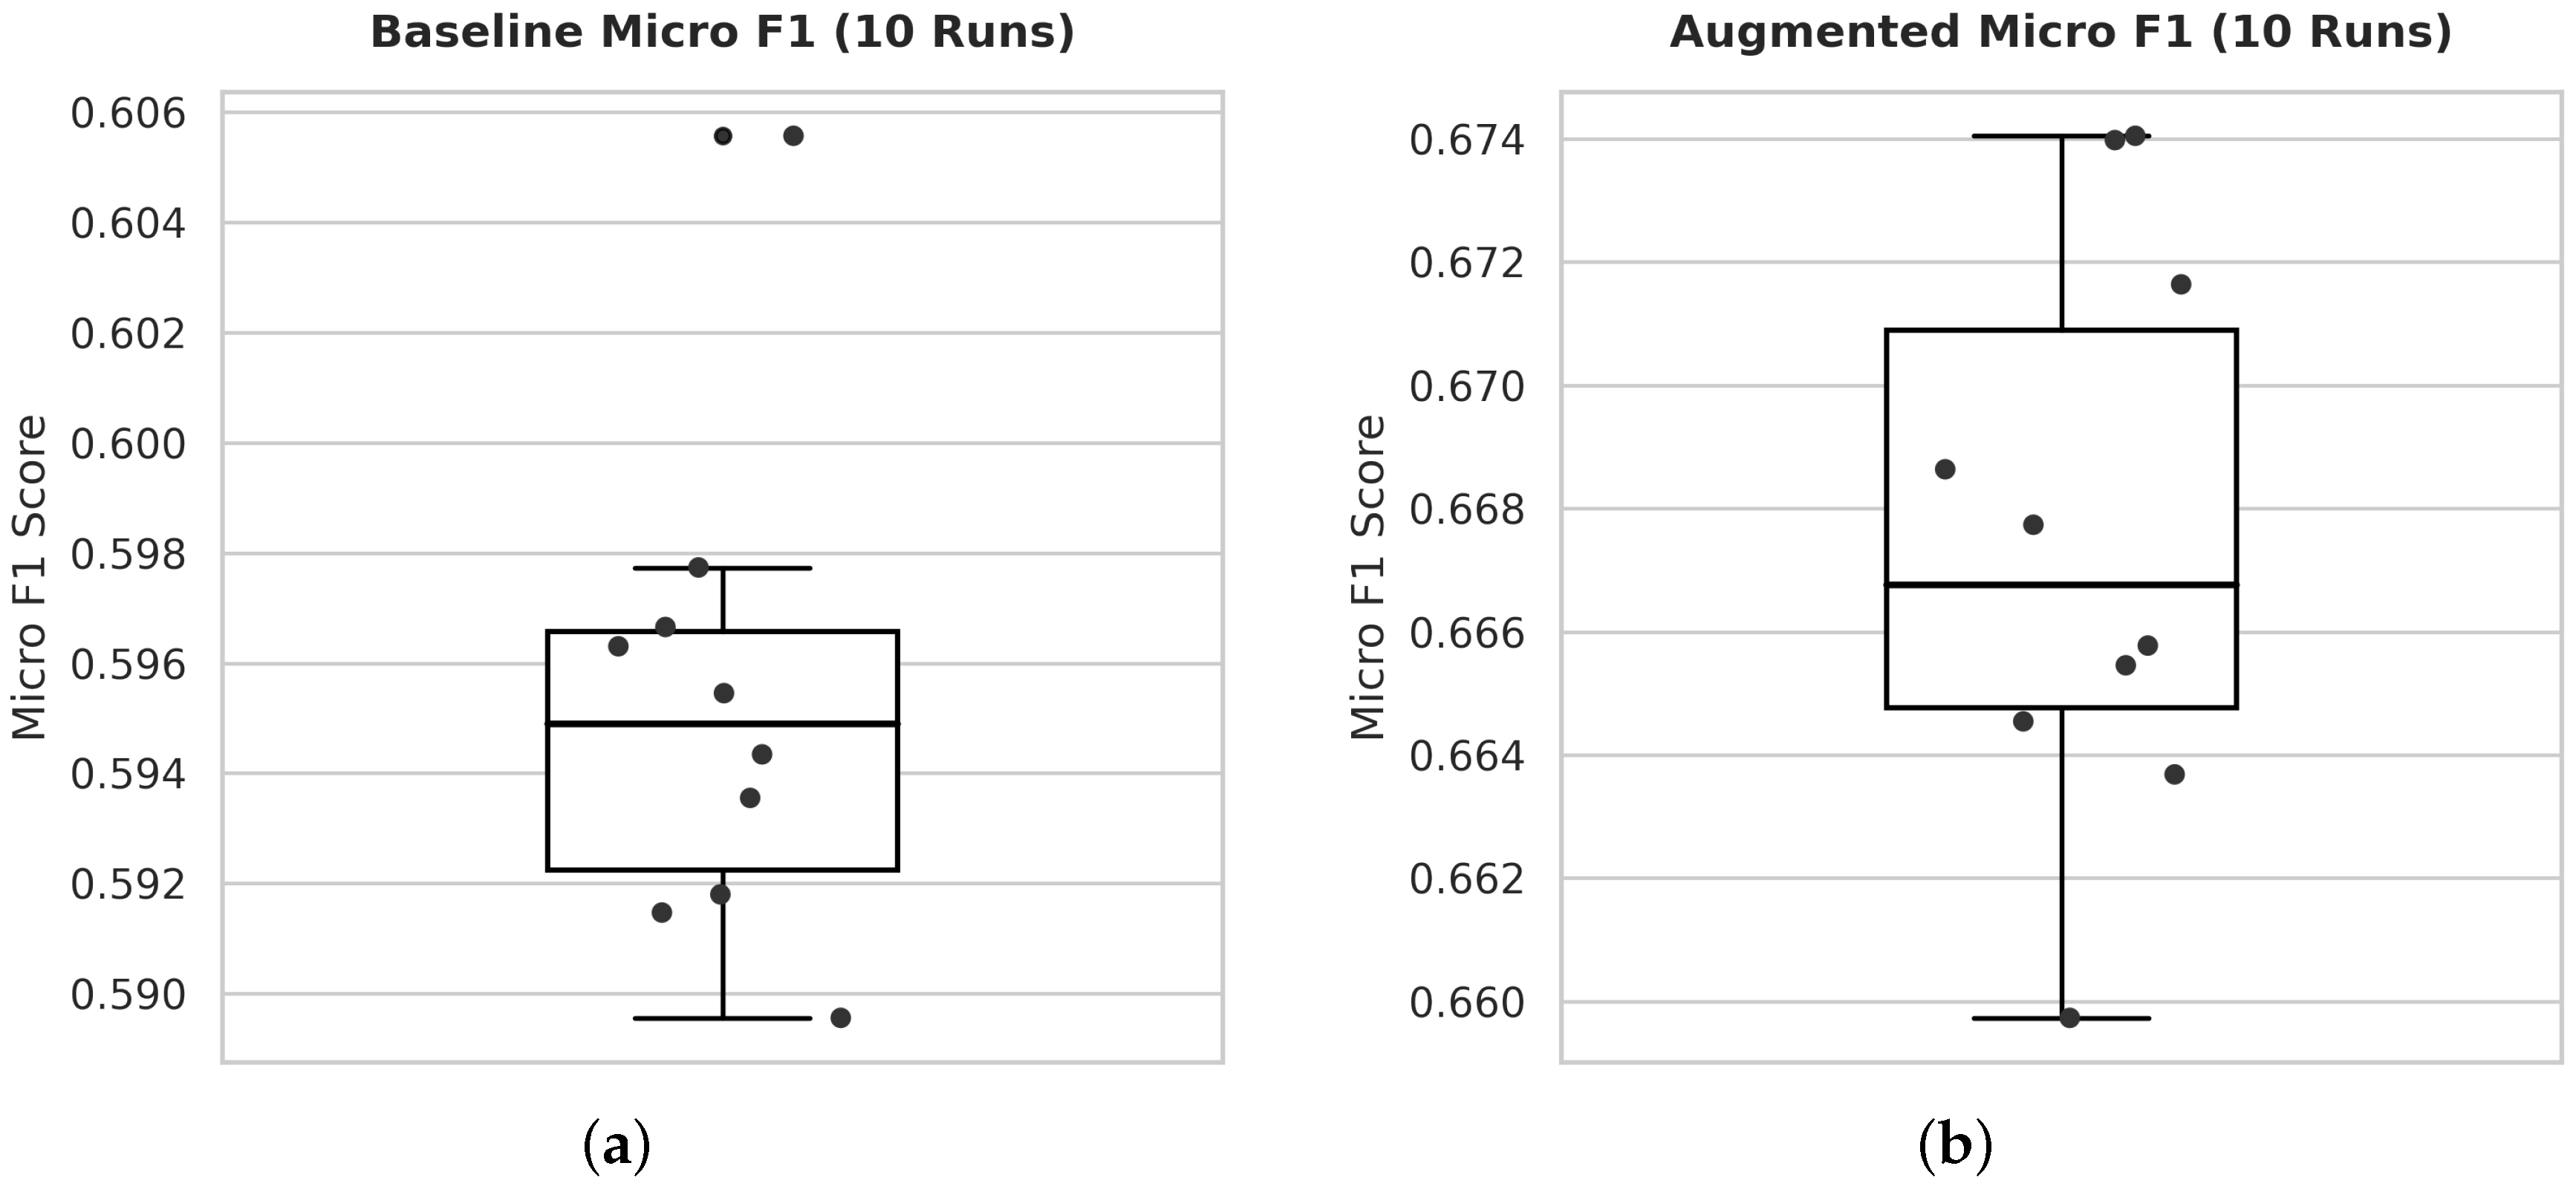
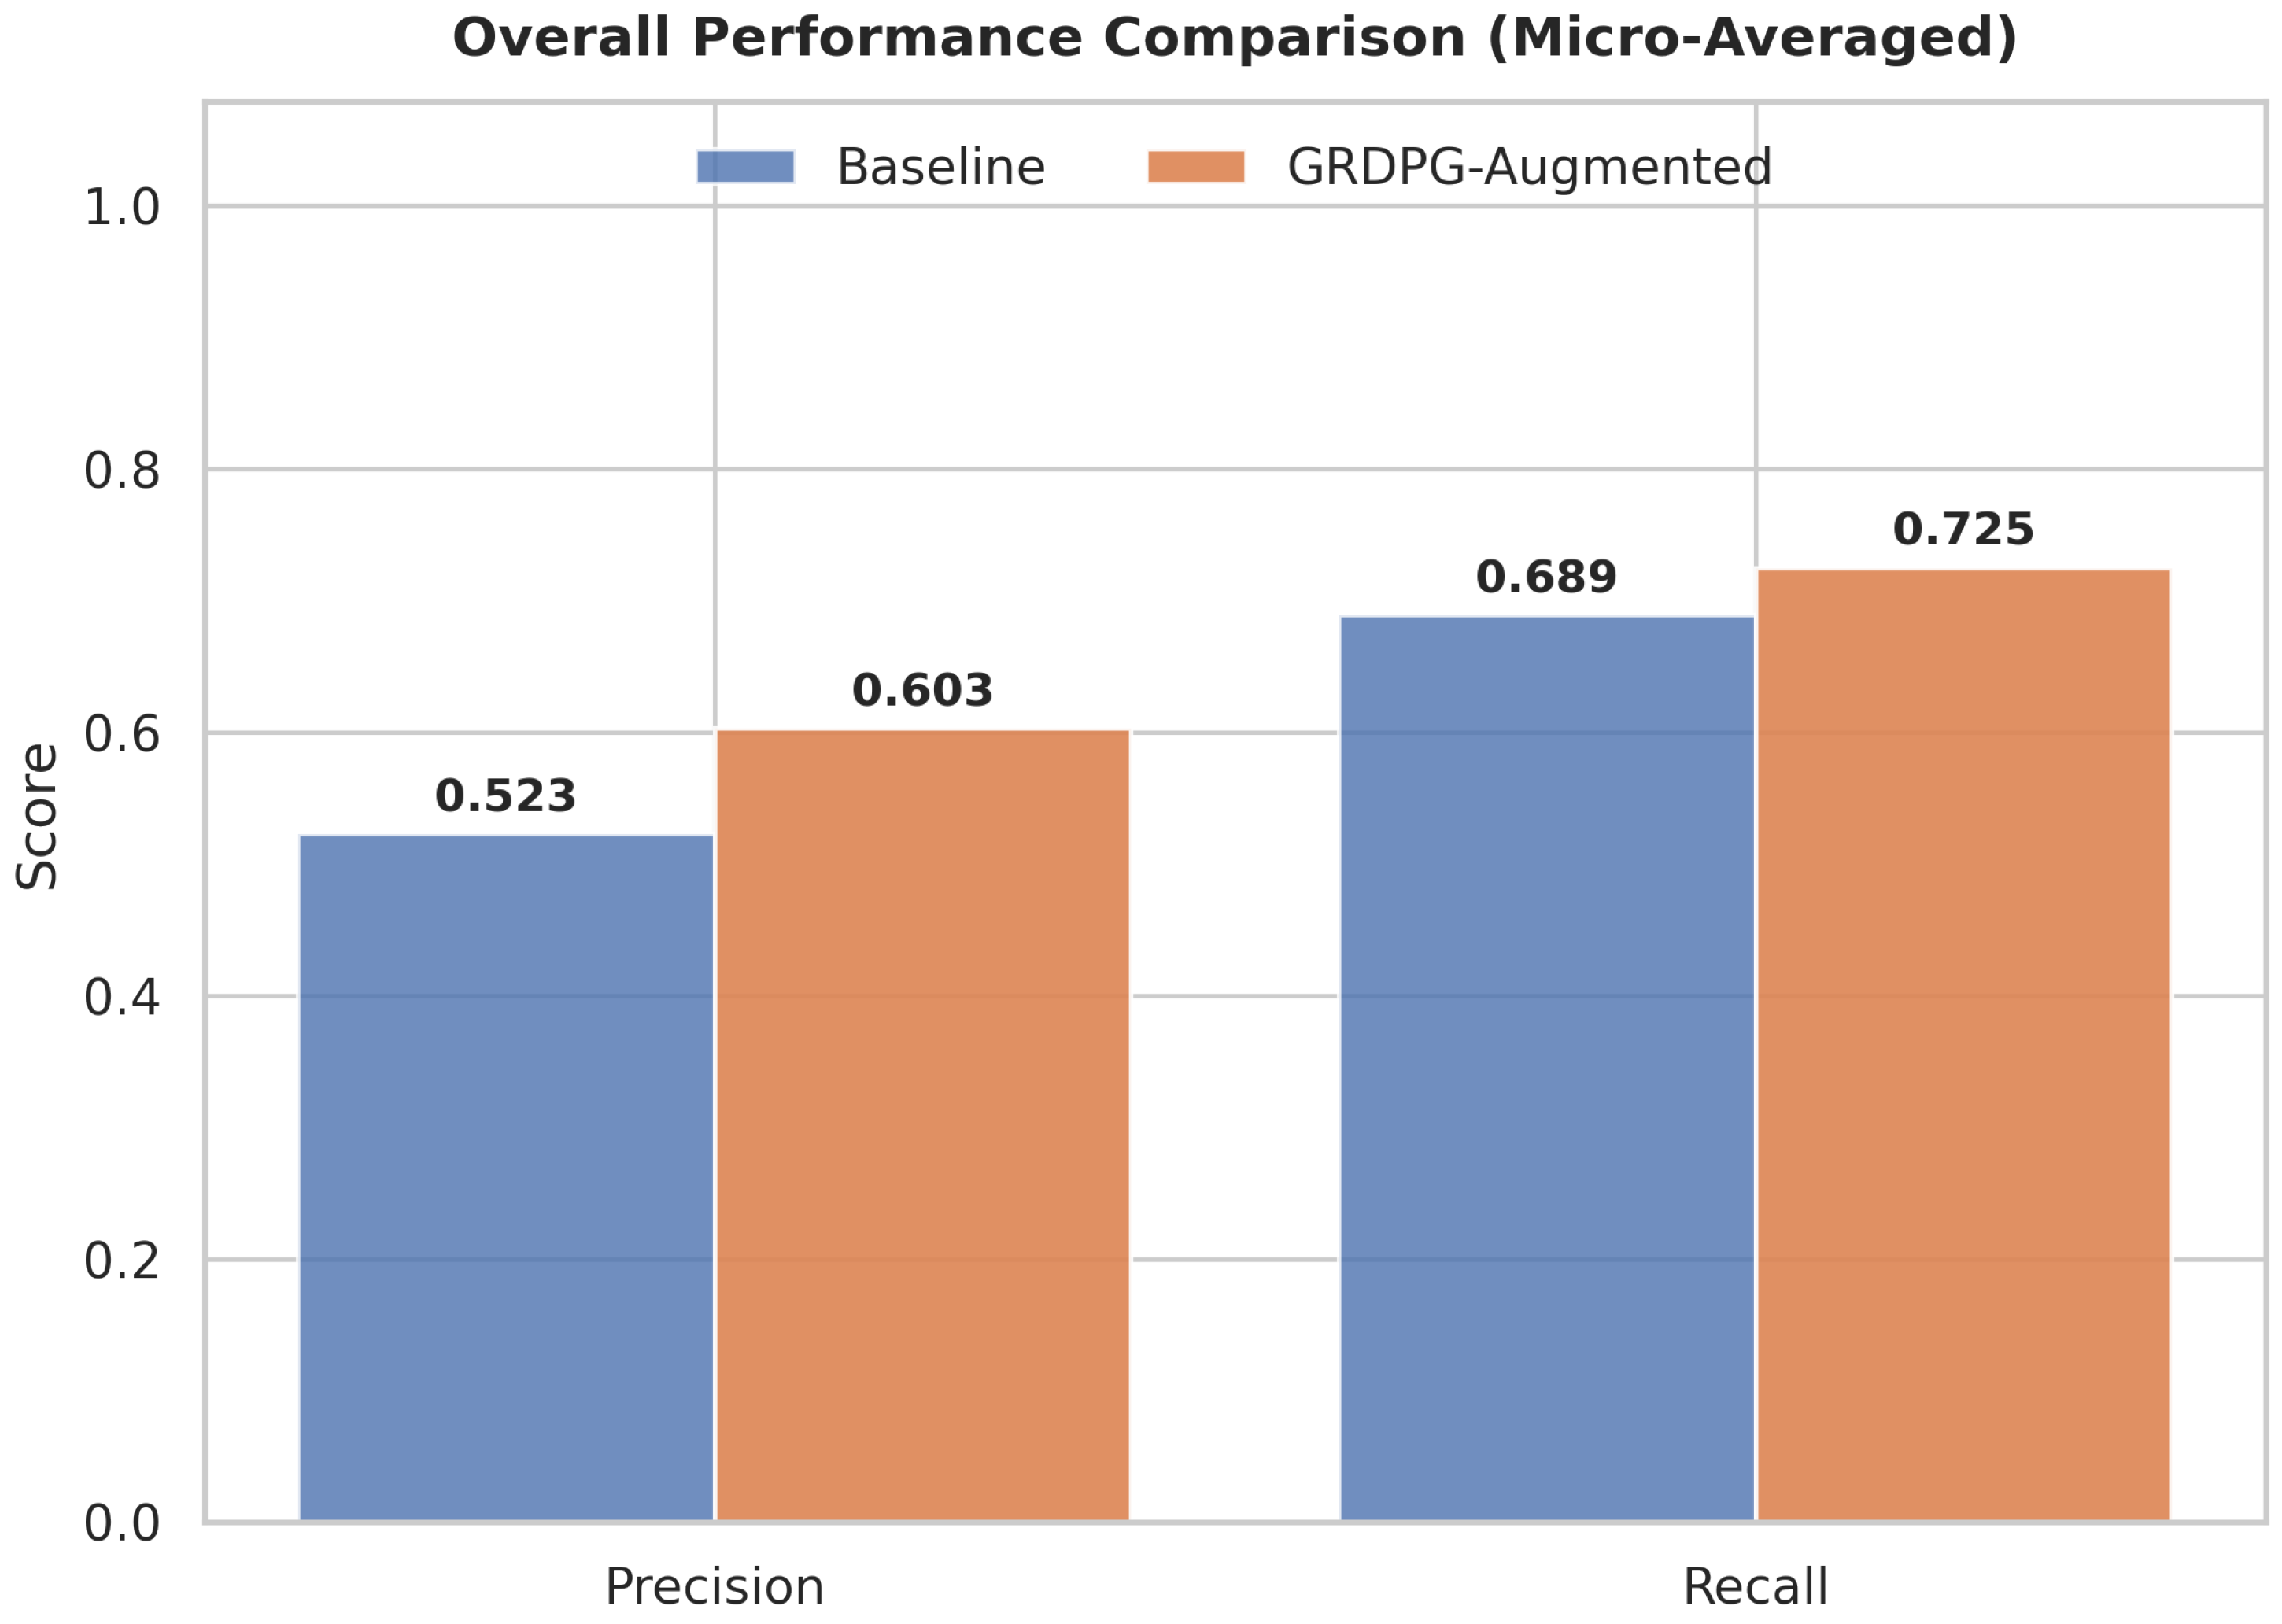
Table 1 summarizes the comparative performance metrics on the test data. The results demonstrate that incorporating graph-derived features enhances predictive performance, with the proposed XGBoost model achieving the highest scores across all evaluated metrics. Specifically, the augmented XGBoost model achieved a Micro F1 Score of 0.7005, representing an 18.35% absolute improvement over the XGBoost baseline (0.5919). Similarly, the Macro ROC AUC increased from 0.8100 to 0.8966. Figure 5 and Figure 6 illustrate these distributions visually.
The baseline XGBoost model recorded a global precision of 0.5210. Following feature augmentation, precision rose to 0.6558 (a 25.87% relative increase), while recall simultaneously improved from 0.6845 to 0.7520. When compared against a Random Forest architecture, the augmented XGBoost model surpassed the augmented Random Forest in F1 score (0.7005 vs. 0.6555). The performance gain from graph-derived feature augmentation was also more pronounced for XGBoost ( Δ F 1 + 0.1601 ) than for Random Forest ( Δ F 1 + 0.0053 ).

4.2. Class-Specific Performance Gains

As shown in Table 2, all intersection classes exhibited improved performance following topological augmentation. The marked_crossing class recorded the most significant gain, with a +71.88% relative improvement in F1 score (rising from 0.3371 to 0.5794). Other structurally ambiguous classes, such as crossing_unmarked, also saw substantial gains (+44.12%).

4.3. Visualizing Model Performances

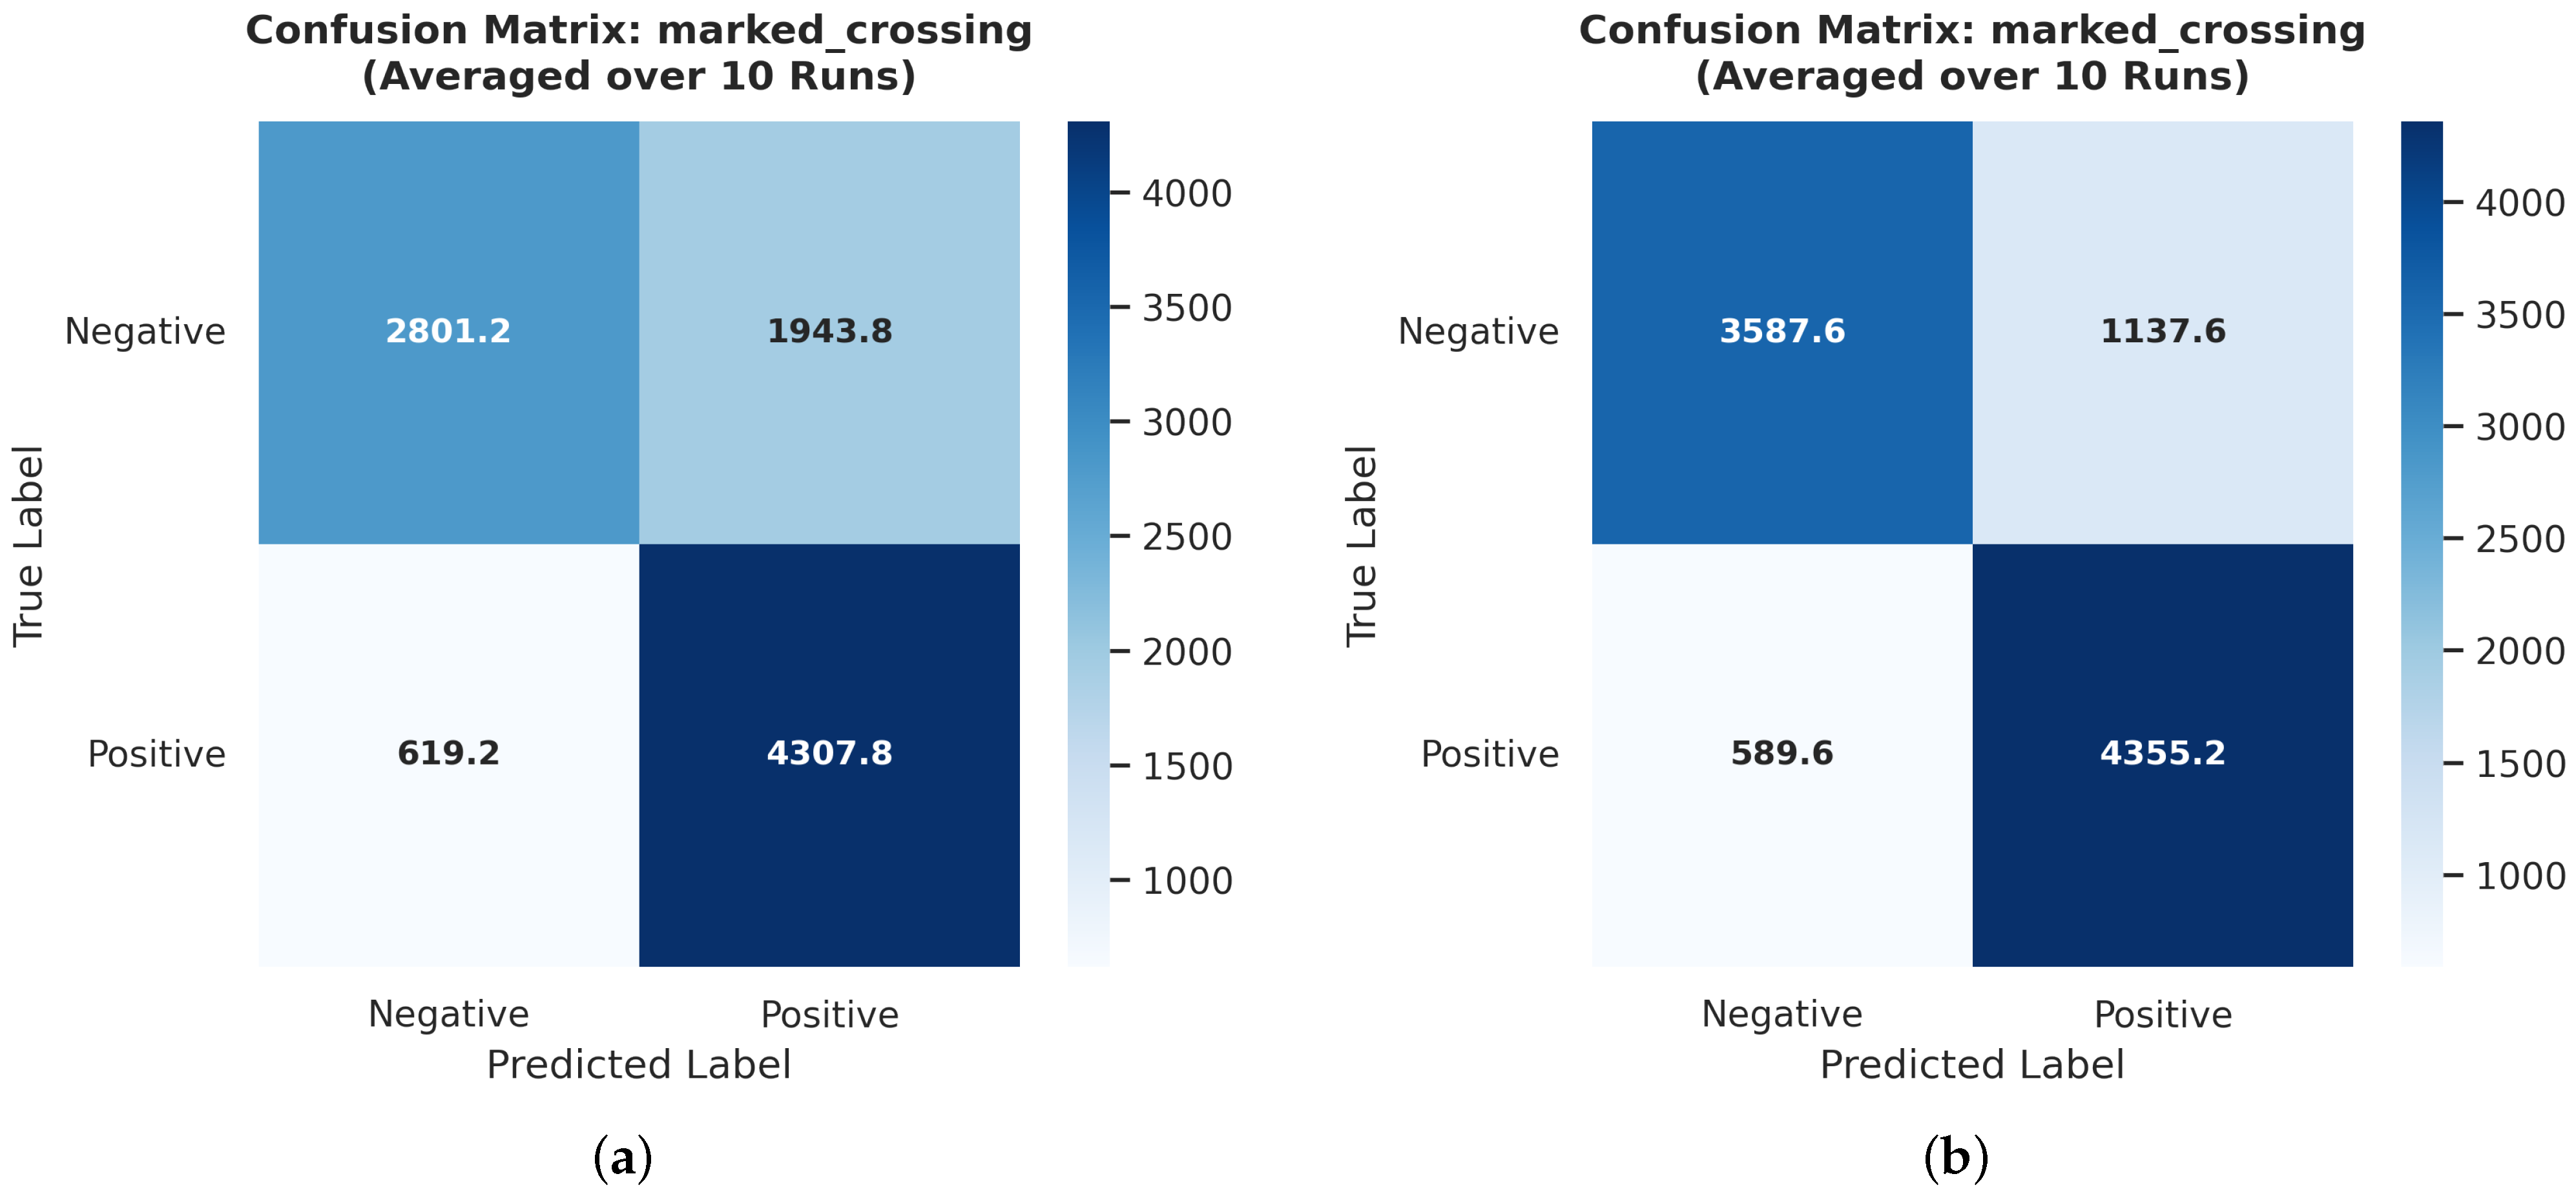
Figure 7 presents the confusion matrices for the marked_crossing class, averaged over 10 independent replicates. As shown in Figure 7a, the baseline model incorrectly classified an average of 1,944 negative instances as marked crossings. By incorporating GRDPG embeddings, the augmented XGBoost model reduced this misclassification to 1137 instances (Figure 7b), representing a 41.48% reduction in false positives.

4.4. Feature Importance

Table 3 and Table 4 present the feature importance rankings for the baseline and augmented models, respectively. In the baseline Random Forest model, geospatial coordinates (Latitude and Longitude) are the top two features, jointly accounting for over 58% of the total importance. In the augmented models, these raw coordinates decrease substantially in rank. They are replaced by contextual network features, such as Neighbor Speed (Mean) (0.2620) and Neighbor Speed (Max) (0.2221). Additionally, individual GRDPG embedding dimensions (e.g., Dim 17, Dim 20) consistently occupy the middle ranks (Ranks 10–15) of the augmented XGBoost and Random Forest models.
In the augmented models (Table 4), the relative importance of raw coordinates decreases substantially. In the augmented Random Forest model, coordinates are replaced by contextual features such as Neighbor Speed (Mean) (0.2620) and Neighbor Speed (Max) (0.2221). This shift indicates that incorporating graph-derived features encourages the model to classify intersections based on their local environment and connectivity patterns rather than their precise geospatial location. Moreover, although individual GRDPG embedding dimensions (e.g., Dim 17, Dim 20) do not emerge as the single most important features, they consistently occupy the middle ranks of the augmented models (Ranks 10–15). Their presence among the top features suggests that GRDPG embeddings encode structural roles and network-level relationships that simple node-level attributes cannot capture, providing a richer and more informative signal for classification.

5. Discussion

The experimental results validate the central hypothesis of this research: standard Euclidean physical attributes are insufficient for classifying complex urban intersections, and topological context is a necessary discriminator.

5.1. The Value of Topological Context

The utility of topological embedding is most evident when analyzing intersection classes that lack distinct physical markers but possess distinct connectivity patterns. In the baseline model, the precision for the marked_crossing class was notably low, suggesting that the model frequently confused marked crossings with generic road segments due to their physical similarities. The sharp 71.88% increase in F1 score, alongside the 41.48% reduction in false positives, indicates that the structural embeddings effectively filtered out these errors. The GRDPG dimensions provided the necessary global context that local geometry lacked, allowing the model to successfully distinguish between actual pedestrian infrastructure and road segments that merely resemble it locally. Furthermore, the concurrent improvement in both precision and recall (Table 1) confirms that the structural embeddings did not merely shift the decision boundary but fundamentally enriched the feature space, thereby achieving a more robust classification.

5.2. Model Suitability and Generalization

The comparative analysis reveals that gradient-boosted decision trees are particularly well-suited for this topological framework. While the baseline Random Forest outperformed the baseline XGBoost, XGBoost extracted significantly more value from the graph-derived features. This suggests that the sequential, error-correcting nature of XGBoost is highly adept at exploiting the subtle, nonlinear structural signals encoded within the continuous latent vectors of the GRDPG embeddings.
Finally, the shift in feature importance (Table 3 and Table 4) highlights a critical improvement in model generalizability. Because the baseline models relied on raw X and Y coordinates for over 58% of their predictive power, they effectively memorized the geospatial layout of the training city, severely limiting their ability to generalize to new urban environments. In contrast, the augmented models rely primarily on contextual environment and network-level relationships. By replacing precise GPS locations with neighbor-aggregated attributes and continuous GRDPG dimensions, the augmented framework learns the intrinsic structural roles of intersections, making it highly adaptable and generalizable to previously unseen urban networks.

5.3. Limitations

While the proposed topological augmentation framework significantly improves intersection classification, it is constrained by inherent limitations in the data and modeling approach. First, the methodology is intrinsically dependent on the quality and completeness of crowdsourced OSM data. Although the framework effectively mitigated attribute sparsity within the dense New York City dataset, its predictive performance may vary when applied to rural areas or developing regions where the underlying network topology is insufficiently mapped. Second, our approach currently models the urban road network as a static graph. It does not account for temporal dynamics, such as variable traffic flow patterns, temporary construction, or time-of-day signal behavior, which could provide vital discriminative context. Finally, while topological embeddings successfully resolve many semantic ambiguities, certain classifications may still rely on hyper-local, unrecorded physical features (e.g., specific signage, micro-elevation changes, or line-of-sight constraints) that cannot be captured solely through macroscopic network connectivity. These constraints define the boundaries of this work and establish the foundation for subsequent research directions.

6. Conclusions and Future Work

This study shows that adding graph-derived features improves multi-label intersection classification. The approach captures key connectivity patterns and local context that standard tabular models often overlook. Importantly, these improvements are achieved without the need for complex Graph Neural Networks. Results show substantial gains in F1 scores, especially for minority and ambiguous classes; for instance, the detection of marked crossings improved by 71.88%. Feature importance analysis reveals that structural features reduce reliance on raw geospatial coordinates, suggesting stronger generalization potential to new areas.
Future work could explore integrating dynamic traffic and temporal flow data into the network representation to capture time-varying patterns. Expanding the framework to multi-modal urban networks, including pedestrian, cycling, and public transit layers, may provide richer structural insights. Another promising direction is the development of hierarchical or multi-scale embeddings that capture both local intersection patterns and city-wide connectivity. Finally, applying these methods across multiple cities could reveal transferable structural signatures that support large-scale urban planning and traffic safety analysis.

Author Contributions

Conceptualization, methodology, and software, R.R.; validation and formal analysis, A.K. and R.R.; investigation, all authors; resources, A.M.S.; data curation, A.K.; writing—original draft preparation, A.K.; writing—review and editing, R.R. and A.M.S.; visualization, all authors; Supervision and project administration, R.R. All authors have read and agreed to the published version of the manuscript.

Funding

This project was partially supported by funds from the College of Basic and Applied Sciences Research & Innovation Grant Program of Middle Tennessee State University.

Data Availability Statement

The dataset was constructed using OpenStreetMap data covering the New York City metropolitan area and is available from the OpenStreetMap project at https://www.openstreetmap.org (accessed on 10 November 2025). To support transparency and reproducibility, the implementation code will be made publicly available on GitHub upon acceptance of the manuscript.

Conflicts of Interest

The authors declare no conflicts of interest.

References

  1. Haklay, M. How good is volunteered geographical information? A comparative study of OpenStreetMap and Ordnance Survey datasets. Environ. Plan. B Plan. Des. 2010, 37, 682–703. [Google Scholar] [CrossRef] [Scilit]
  2. Barrington-Leigh, C.; Millard-Ball, A. The world’s user-generated road map is more than 80% complete. PLoS ONE 2017, 12, e0180698. [Google Scholar] [CrossRef] [Scilit]
  3. Moradi, M.; Roche, S.; Abolfazl Mostafavi, M. Exploring Five Indicators for the Quality of OSM Road Network: A Case Study of Qubec, Canada. Geomatica 2021, 75, 1–55. [Google Scholar] [CrossRef] [Scilit]
  4. Hosseini, R.; Tong, D.; Lim, S.; Sohn, G.; Gidófalvi, G. A framework for performance analysis of OpenStreetMap data in navigation applications: The case of a well-developed road network in Australia. Ann. GIS 2025, 31, 233–250. [Google Scholar] [CrossRef] [Scilit]
  5. Deri, F.; Mara, F.; Anselmi, C. Crowdsourced Data for Urban Planning: A Critical Evaluation of OpenStreetMap Accuracy and Completeness. In Proceedings of the International Conference on Computational Science and Its Applications; Springer: Berlin/Heidelberg, Germany, 2025; pp. 403–420. [Google Scholar]
  6. Han, C.; Lu, B.; Zheng, J.; Yu, D.; Zheng, S. Research on multiscale OpenStreetMap in China: Data quality assessment with EWM-TOPSIS and GDP modeling. Geo-Spat. Inf. Sci. 2025, 28, 1316–1340. [Google Scholar] [CrossRef] [Scilit]
  7. Borkowska, S.; Pokonieczny, K. Analysis of OpenStreetMap data quality for selected counties in Poland in terms of sustainable development. Sustainability 2022, 14, 3728. [Google Scholar] [CrossRef] [Scilit]
  8. Rubin-Delanchy, P.; Priebe, C.; Tang, M. The generalised random dot product graph. arXiv 2017, arXiv:1709.05506. [Google Scholar]
  9. Athreya, A.; Fishkind, D.E.; Tang, M.; Priebe, C.E.; Park, Y.; Vogelstein, J.T.; Levin, K.; Lyzinski, V.; Qin, Y.; Sussman, D.L. Statistical inference on random dot product graphs: A survey. J. Mach. Learn. Res. 2018, 18, 1–92. [Google Scholar]
  10. Rubin-Delanchy, P.; Cape, J.; Tang, M.; Priebe, C.E. A statistical interpretation of spectral embedding: The generalised random dot product graph. J. R. Stat. Soc. Ser. B Stat. Methodol. 2022, 84, 1446–1473. [Google Scholar] [CrossRef] [Scilit]
  11. Crucitti, P.; Latora, V.; Porta, S. Centrality in networks of urban streets. Chaos Interdiscip. J. Nonlinear Sci. 2006, 16, 015113. [Google Scholar] [CrossRef] [Scilit]
  12. Crucitti, P.; Latora, V.; Porta, S. Centrality measures in spatial networks of urban streets. Phys. Rev. E—Stat. Nonlinear Soft Matter Phys. 2006, 73, 036125. [Google Scholar] [CrossRef] [Scilit]
  13. Porta, S.; Crucitti, P.; Latora, V. The network analysis of urban streets: A dual approach. Phys. A Stat. Mech. Its Appl. 2006, 369, 853–866. [Google Scholar] [CrossRef] [Scilit]
  14. Barthelemy, M.; Boeing, G. A review of the structure of street networks. arXiv 2024, arXiv:2409.08016. [Google Scholar] [CrossRef] [Scilit]
  15. Yadav, N.; Chatterjee, S.; Ganguly, A.R. Resilience of urban transport network-of-networks under intense flood hazards exacerbated by targeted attacks. Sci. Rep. 2020, 10, 10350. [Google Scholar] [CrossRef] [Scilit]
  16. Xu, Z.; Chopra, S.S. Interconnectedness enhances network resilience of multimodal public transportation systems for Safe-to-Fail urban mobility. Nat. Commun. 2023, 14, 4291. [Google Scholar] [CrossRef] [Scilit]
  17. Kim, S.; Yeo, H. A flow-based vulnerability measure for the resilience of urban road network. Procedia-Soc. Behav. Sci. 2016, 218, 13–23. [Google Scholar] [CrossRef] [Scilit]
  18. Li, Z.; Yan, W.; Wang, L. Measuring mobility resilience with network-based simulations of flow dynamics under extreme events. Transp. Res. Part D Transp. Environ. 2024, 135, 104362. [Google Scholar] [CrossRef] [Scilit]
  19. Tao, R.; Xi, Y.; Li, D. Simulation analysis on urban traffic congestion propagation based on complex network. In Proceedings of the 2016 IEEE International Conference on Service Operations and Logistics, and Informatics (SOLI); IEEE: New York, NY, USA, 2016; pp. 217–222. [Google Scholar]
  20. Ding, R.; Ujang, N.; Hamid, H.B.; Manan, M.S.A.; Li, R.; Albadareen, S.S.M.; Nochian, A.; Wu, J. Application of complex networks theory in urban traffic network researches. Netw. Spat. Econ. 2019, 19, 1281–1317. [Google Scholar] [CrossRef] [Scilit]
  21. Osorio, C.; Bierlaire, M. A simulation optimization framework for the management of congested urban road networks. In Proceedings of the Seventh Swiss Transport Research Conference (STRC), Ascona, Switzerland, 9–11 September 2009. [Google Scholar]
  22. Hu, W.; Wang, H.; Qiu, Z.; Yan, L.; Nie, C.; Du, B. An urban traffic simulation model for traffic congestion predicting and avoiding. Neural Comput. Appl. 2018, 30, 1769–1781. [Google Scholar] [CrossRef] [Scilit]
  23. Liu, Y.; Guo, Q.; Zheng, C. Urban street network morphology classification through street-block based graph neural networks and multi-model fusion. Int. J. Digit. Earth 2025, 18, 2497490. [Google Scholar] [CrossRef] [Scilit]
  24. Tang, S.; Randhawa, S.; Rui, J.; Ludwig, C.; Knoblauch, S.; Hatfield, C.; Zipf, A. Estimating road speed classes: Integrating OpenStreetMap and Street View imagery for missing data imputation. Comput. Environ. Urban Syst. 2026, 125, 102392. [Google Scholar] [CrossRef] [Scilit]
  25. Vargas-Munoz, J.E.; Srivastava, S.; Tuia, D.; Falcao, A.X. OpenStreetMap: Challenges and opportunities in machine learning and remote sensing. IEEE Geosci. Remote Sens. Mag. 2020, 9, 184–199. [Google Scholar] [CrossRef] [Scilit]
  26. Zurbaran, M.; Wightman, P.; Brovelli, M.A. A machine learning pipeline articulating satellite imagery and openstreetmap for road detection. Int. Arch. Photogramm. Remote Sens. Spat. Inf. Sci. 2019, 42, 255–260. [Google Scholar] [CrossRef] [Scilit]
  27. Parvathi, R.; Pattabiraman, V.; Saxena, N.; Mishra, A.; Mishra, U.; Pandey, A. Automated road surface classification in OpenStreetMap using MaskCNN and aerial imagery. Front. Big Data 2025, 8, 1657320. [Google Scholar] [CrossRef] [Scilit]
  28. Hacar, M.; Altafini, D.; Cutini, V. Network-based hierarchical feature augmentation for predicting road classes in OpenStreetMap. ISPRS Int. J. Geo-Inf. 2024, 13, 456. [Google Scholar] [CrossRef] [Scilit]
  29. Neira, M.; Murcio, R. Graph representation learning on street networks. ISPRS Int. J. Geo-Inf. 2025, 14, 284. [Google Scholar] [CrossRef] [Scilit]
  30. He, S.; Bastani, F.; Jagwani, S.; Park, E.; Abbar, S.; Alizadeh, M.; Balakrishnan, H.; Chawla, S.; Madden, S.; Sadeghi, M.A. Roadtagger: Robust road attribute inference with graph neural networks. In Proceedings of the AAAI Conference on Artificial Intelligence, New York, NY, USA, 7–12 February 2020; Volume 34, pp. 10965–10972. [Google Scholar]
  31. Holland, P.W.; Laskey, K.B.; Leinhardt, S. Stochastic blockmodels: First steps. Soc. Netw. 1983, 5, 109–137. [Google Scholar] [CrossRef] [Scilit]
  32. Young, S.J.; Scheinerman, E.R. Random dot product graph models for social networks. In Proceedings of the International Workshop on Algorithms and Models for the Web-Graph; Springer: Berlin/Heidelberg, Germany, 2007; pp. 138–149. [Google Scholar]
  33. Priebe, C.E.; Park, Y.; Tang, M.; Athreya, A.; Lyzinski, V.; Vogelstein, J.T.; Qin, Y.; Cocanougher, B.; Eichler, K.; Zlatic, M.; et al. Semiparametric spectral modeling of the Drosophila connectome. arXiv 2017, arXiv:1705.03297. [Google Scholar] [CrossRef] [Scilit]
  34. Yuan, C.; Zhao, K.; Kuruoglu, E.E.; Wang, L.; Xu, T.; Huang, W.; Zhao, D.; Cheng, H.; Rong, Y. A survey of graph transformers: Architectures, theories and applications. arXiv 2025, arXiv:2502.16533. [Google Scholar] [CrossRef] [Scilit]
  35. Boeing, G. OSMnx: New methods for acquiring, constructing, analyzing, and visualizing complex street networks. Comput. Environ. Urban Syst. 2017, 65, 126–139. [Google Scholar] [CrossRef] [Scilit]
  36. Badran, A.; El-Geneidy, A.; Miranda-Moreno, L. Inferring Road Intersection Control Type from GPS Data. 2022. Available online: https://findingspress.org/article/37715-inferring-road-intersection-control-type-from-gps-data (accessed on 24 March 2026).
  37. Caruana, R.; Niculescu-Mizil, A. An empirical comparison of supervised learning algorithms. In Proceedings of the 23rd International Conference on Machine Learning, Pittsburgh, PA, USA, 25–29 June 2006; pp. 161–168. [Google Scholar]
  38. Sun, Z.M.; Ren, G.; Hu, Y.X.; Lin, H. Improved traffic flow estimation based on integrated learning methods. In Proceedings of the Eighth International Conference on Electromechanical Control Technology and Transportation (ICECTT 2023); SPIE: Bellingham, WA, USA, 2023; Volume 12790, pp. 500–507. [Google Scholar]
  39. Breiman, L. Random forests. Mach. Learn. 2001, 45, 5–32. [Google Scholar] [CrossRef] [Scilit]
  40. Chen, T. XGBoost: A Scalable Tree Boosting System; Cornell University: Ithaca, NY, USA, 2016. [Google Scholar]
Figure 1. Schematic diagram of the proposed research framework.
Geomatics 06 00035 g001
Figure 2. Prevalence of labels in intersections.
Geomatics 06 00035 g002
Figure 3. Pearson correlation matrix of target labels.
Geomatics 06 00035 g003
Figure 4. Node degree distribution of the intersection graph.
Geomatics 06 00035 g004
Figure 5. Distribution of Micro F1 scores across 10 replicates for baseline and augmented models. The black dots represent the actual F1 scores obtained in 10 replicates. The box plots show that the feature-augmented models achieve higher median scores while exhibiting similar variance. (a) Baseline (XGBoost). (b) Augmented (XGBoost).
Geomatics 06 00035 g005
Figure 6. Performance comparison by metrics. The chart highlights that the primary contribution of graph-derived features is a substantial increase in precision (reducing false positives) while maintaining or slightly improving recall.
Geomatics 06 00035 g006
Figure 7. Confusion matrices for the marked_crossing label. (a) Baseline XGBoost showing a high rate of false positives. (b) Augmented XGBoost showing a sharper diagonal, indicating improved identification of marked_crossing.
Geomatics 06 00035 g007
Table 1. Comparative performance metrics (Test Set, Mean ± SD). Precision and Recall represent global micro-averaged metrics.
ModelPrecisionRecallMicro F1 ScoreMacro ROC AUC
XGBoost (Baseline)0.52100.6845 0.5919 ± 0.0120 0.8100 ± 0.008
XGBoost (Augmented)0.65580.7520 0.7005 ± 0.0023 0.8966 ± 0.0013
Random Forest (Baseline)0.60020.7095 0.6502 ± 0.0043 0.8614 ± 0.0028
Random Forest (Augmented)0.60360.7177 0.6555 ± 0.0022 0.8638 ± 0.0023
Table 2. Class-Level improvements: XGBoost (baseline) vs. XGBoost (augmented). The boldfaced values in the Augmented F1 columns highlight that they are improved across all classes compared to Baseline F1. Also, the boldfaced values in the Relative Improvement column highlight the greatest improvement across the class.
Class LabelBaseline F1Augmented F1Relative Improvement
marked_crossing0.33710.5794+71.88%
crossing_unmarked0.33520.4831+44.12%
stop_any0.39210.4889+24.6%
signalized0.58580.6840+16.76%
crossing_signalized0.56220.6783+20.65%
Table 3. Feature importance comparison (baseline models). Side-by-side ranking of the top features when trained only on original graph attributes and coordinates.
Random ForestXGBoost
RankFeatureImp.FeatureImp.
1Coord X (Latitude)0.313Incident Edges0.243
2Coord Y (Longitude)0.276Degree0.170
3Incident Edges0.192Lanes (Max)0.125
4Degree0.069Coord X (Latitude)0.101
5Clustering Coefficient0.065Clustering Coefficient0.097
6Lanes (Mean)0.032Coord Y (Longitude)0.076
7Lanes (Max)0.029Max Speed (Mean)0.063
8Max Speed (Mean)0.013Max Speed (Max)0.062
9Max Speed (Max)0.011Lanes (Mean)0.062
Table 4. Feature importance comparison (augmented models): Ranking of the top 15 features when trained on the augmented feature set.
Random Forest (MDI)XGBoost (Gain)
RankFeatureImp.FeatureImp.
1Neighbor Speed (Mean)0.2620Incident Edges0.0931
2Neighbor Speed (Max)0.2221Lanes (Max)0.0801
3Incident Edges0.1712Degree0.0781
4Degree0.0598Lanes (Mean)0.0761
5Clustering Coefficient0.0551Max Speed (Mean)0.0536
6Lanes (Mean)0.0282Max Speed (Max)0.0389
7Lanes (Max)0.0252Clustering Coefficient0.0329
8Neighbor Lanes (Max)0.0172Coord Y (Longitude)0.0322
9Max Speed (Mean)0.0094Coord X (Latitude)0.0204
10GRDPG Dim 170.0090Neighbor Incident Edges0.0194
11GRDPG Dim 200.0079GRDPG Dim 170.0169
12Max Speed (Max)0.0079Neighbor Clustering0.0155
13Neighbor Clustering0.0077Neighbor Speed (Max)0.0148
14GRDPG Dim 140.0075GRDPG Dim 260.0141
15GRDPG Dim 240.0071Neighbor Lanes (Mean)0.0137
Disclaimer/Publisher’s Note: The statements, opinions and data contained in all publications are solely those of the individual author(s) and contributor(s) and not of MDPI and/or the editor(s). MDPI and/or the editor(s) disclaim responsibility for any injury to people or property resulting from any ideas, methods, instructions or products referred to in the content.