Article

Implicit Equation for Photovoltaic Module Temperature and Efficiency via Heat Transfer Computational Model

1
The Faculty of Industrial Engineering, Mechanical Engineering and Computer Science, University of Iceland, 102 Reykjavík, Iceland
2
Computational Fluid Dynamics, Simulation and Data Lab, National Competence Centre of Iceland, University of Iceland, 102 Reykjavík, Iceland
3
Juelich Supercomputing Centre, 52428 Jülich, Germany
*
Author to whom correspondence should be addressed.
Thermo 2022, 2(1), 39-55; https://doi.org/10.3390/thermo2010004
Submission received: 25 January 2022 / Revised: 13 February 2022 / Accepted: 15 February 2022 / Published: 21 February 2022

Abstract

:
This paper evaluates the photovoltaic (PV) module operating temperature’s relation to efficiency via a numerical heat transfer model. The literature reports that higher PV module operating temperatures impact PV module efficiency. There are dozens of explicit and implicit equations used to determine the PV module operating temperature. However, they are not universal, and for each application, it is necessary to insert a correction coefficient based on the environment and boundary conditions. Using a numerical method covering a more comprehensive range of PV module operation conditions to estimate a global equation, this study considers the solar radiation flux, Gt, solar ray direction with respect to the ground level, γ, convective heat transfer coefficient, h, tilt angle, β, ambient temperature, Ta, PV power output, Ppv, PV panel efficiency, η, and environmental properties. The results match the extant empirical work and related literature. PV module efficiency is found to have a linear relationship to the PV module operating temperature via a numerical heat transfer model corresponding to the well-known PV module. It specifies that heat transfer convection changes with PV module tilt angle, causing PV module operating temperature effects. It also represents the PV module operating temperature variations with ambient temperature and solar flux, like those reported in the literature.

1. Introduction

1.1. Photovoltaic (PV) Panel Operating Temperature

Solar energy technologies are becoming more pervasive worldwide. Both the capture and use of solar energy have very little impact on the environment, and this is a significant advantage. The cost of PV cells has been greatly reduced owing to their rapid development [1]. Solar resources are tantamount to infinite and can support the world’s electricity needs with appropriate equipment and investment [2]. A PV module converts solar radiation flux into electricity. However, as it absorbs the solar radiation, the PV module operating temperature increases proportionally, as shown empirically and in the literature [3,4,5,6,7,8,9,10,11,12,13,14]. Noticeably, higher PV module operating temperatures cause a reduction in PV module efficiency. This issue has been well studied and has resulted in a compendium of equations [9,10,11,12,13,14,15,16,17,18,19,20,21,22]. Most equations use both explicit and implicit approaches, in which the PV module operating temperature is a function of solar radiation flux, Gt, ambient temperature, Ta, and local wind speed, Vw [15,16,17,18,19,20,21,22]. However, the equations do not use heat transfer equations to characterize the PV module operating temperature’s effect on efficiency. The pioneering equation is based on traditional steady-state energy [16], based on the nominal operating cell temperature (NOCT) [15] in nominal terrestrial environment (NTE) conditions. Under these conditions, solar radiation flux (irradiation) is 800 W/m2, ambient temperature is 20 °C, average wind speed is 1 m/s with zero electrical loads (i.e., open circuit), and the cell surface is perpendicular to the solar noon direction [23,24]. The NOCT model assumes that both sides of the PV module contact the same ambient temperature, and therefore the temperature difference (Tc − Ta) is not a function of ambient temperature. The NOCT equation for PV module operating temperature includes PV electric efficiency, which is a function of the PV module operating temperature. Therefore, the NOCT equation is an implicit approach for PV module operating temperatures, and it is only suitable for PV modules mounted in a free-standing manner. Hence, this is largely unrealistic [16].
Equations designed to account for various other conditions are based upon the NOCT equation, and they all require correction coefficients based on varied situations [25].

1.2. Heat Transfer Model of Thermal Collectors and Solar Panels

Most studies have used heat transfer models designed for solar thermal collectors. The thermal collector directly obtains heat energy and converts it to usable power. Often, thermal collectors are applied commercially to heat an air space, but their complex installation requires a moving water supply such that the water is converted to steam to feed a turbine connected to an electric generator. The convection heat transfer rate for the inclined collector is based on the flat collector’s performance, as correlated in two or three dimensionless parameters [16]: the Rayleigh number, Ra, the Nusselt number, Nu, and the Prandtl number, Pr. The definitions for these dimensionless parameters are provided in Section 2. The results of several reliable data investigations were reported and published by the U.S. Home Finance Agency [16]. In a more recent experimental study using air, the equations showed a relationship between the Nusselt number, Rayleigh number, and tilt angle [16]. For horizontal surfaces, there is also a correlation with the available equations [16].
Indeed, all of these works were employed on thermal collectors because they fundamentally work with heat transfer without generating electricity directly to a collector. It is possible to consider the heat transfer model for PV panels because the central concept is that energy is collected in heat form and converted to electricity. Most studies on PV modules are performed from the electricity’s perspective, wherein the available empirical equations determine the PV module operating temperature’s relation to ambient temperature, local airspeed, and solar flux [9,10,11,12,13,14,15,16,17,18,19,20,21,22]. Apparently, the tilt angle, solar ray direction, and air properties surrounding the PV module also affect the PV module operating temperature, but they are not accounted for in extant equations [15]. Although ambient temperature is usually considered to be a constant temperature, it is well known that it varies greatly throughout the day. It is also a factor of location. Several equations have been proposed to account for variable ambient temperatures based on apparent sky temperature, cloudy sky temperature, water vapor pressure, dew point temperature, dry bulb temperature, and hours from midnight [16]. However, local wind speed could also be considered in terms of cooling forced convection, depending on air speed.

1.3. Aim of This Study

Concerning the available equations and most solar energy applications, the lack of a general equation that can meet universal conditions is obvious, and this is needed to investigate environmental parameters as they relate to the PV module operating temperatures and electricity generation efficiency.
On the other hand, some variables from the traditional method can be redefined with distinct independence. For instance, the local wind speed in a free-standing mounted PV module can be determined via forced convection heat transfer, and the free and forced convection can be shown to have a specific convection coefficient affected by local velocity and PV module surface direction (tilt angle), which can increase or reduce convection.
This study determines the relationship between PV module operating temperatures, PV module setup, and environmental variables via heat transfer concepts. This approach makes the proposed model more globally applicable. The proposed equations are compared to extant literature results to evaluate the efficacy of the modification. Hence, this paper is organized as follows. The applied theory and the methods used to define the PV module operating temperature equation are presented in Section 2. In Section 3, the main results are provided. Section 4 offers a detailed discussion, and the conclusions are presented in Section 5.

2. Methods

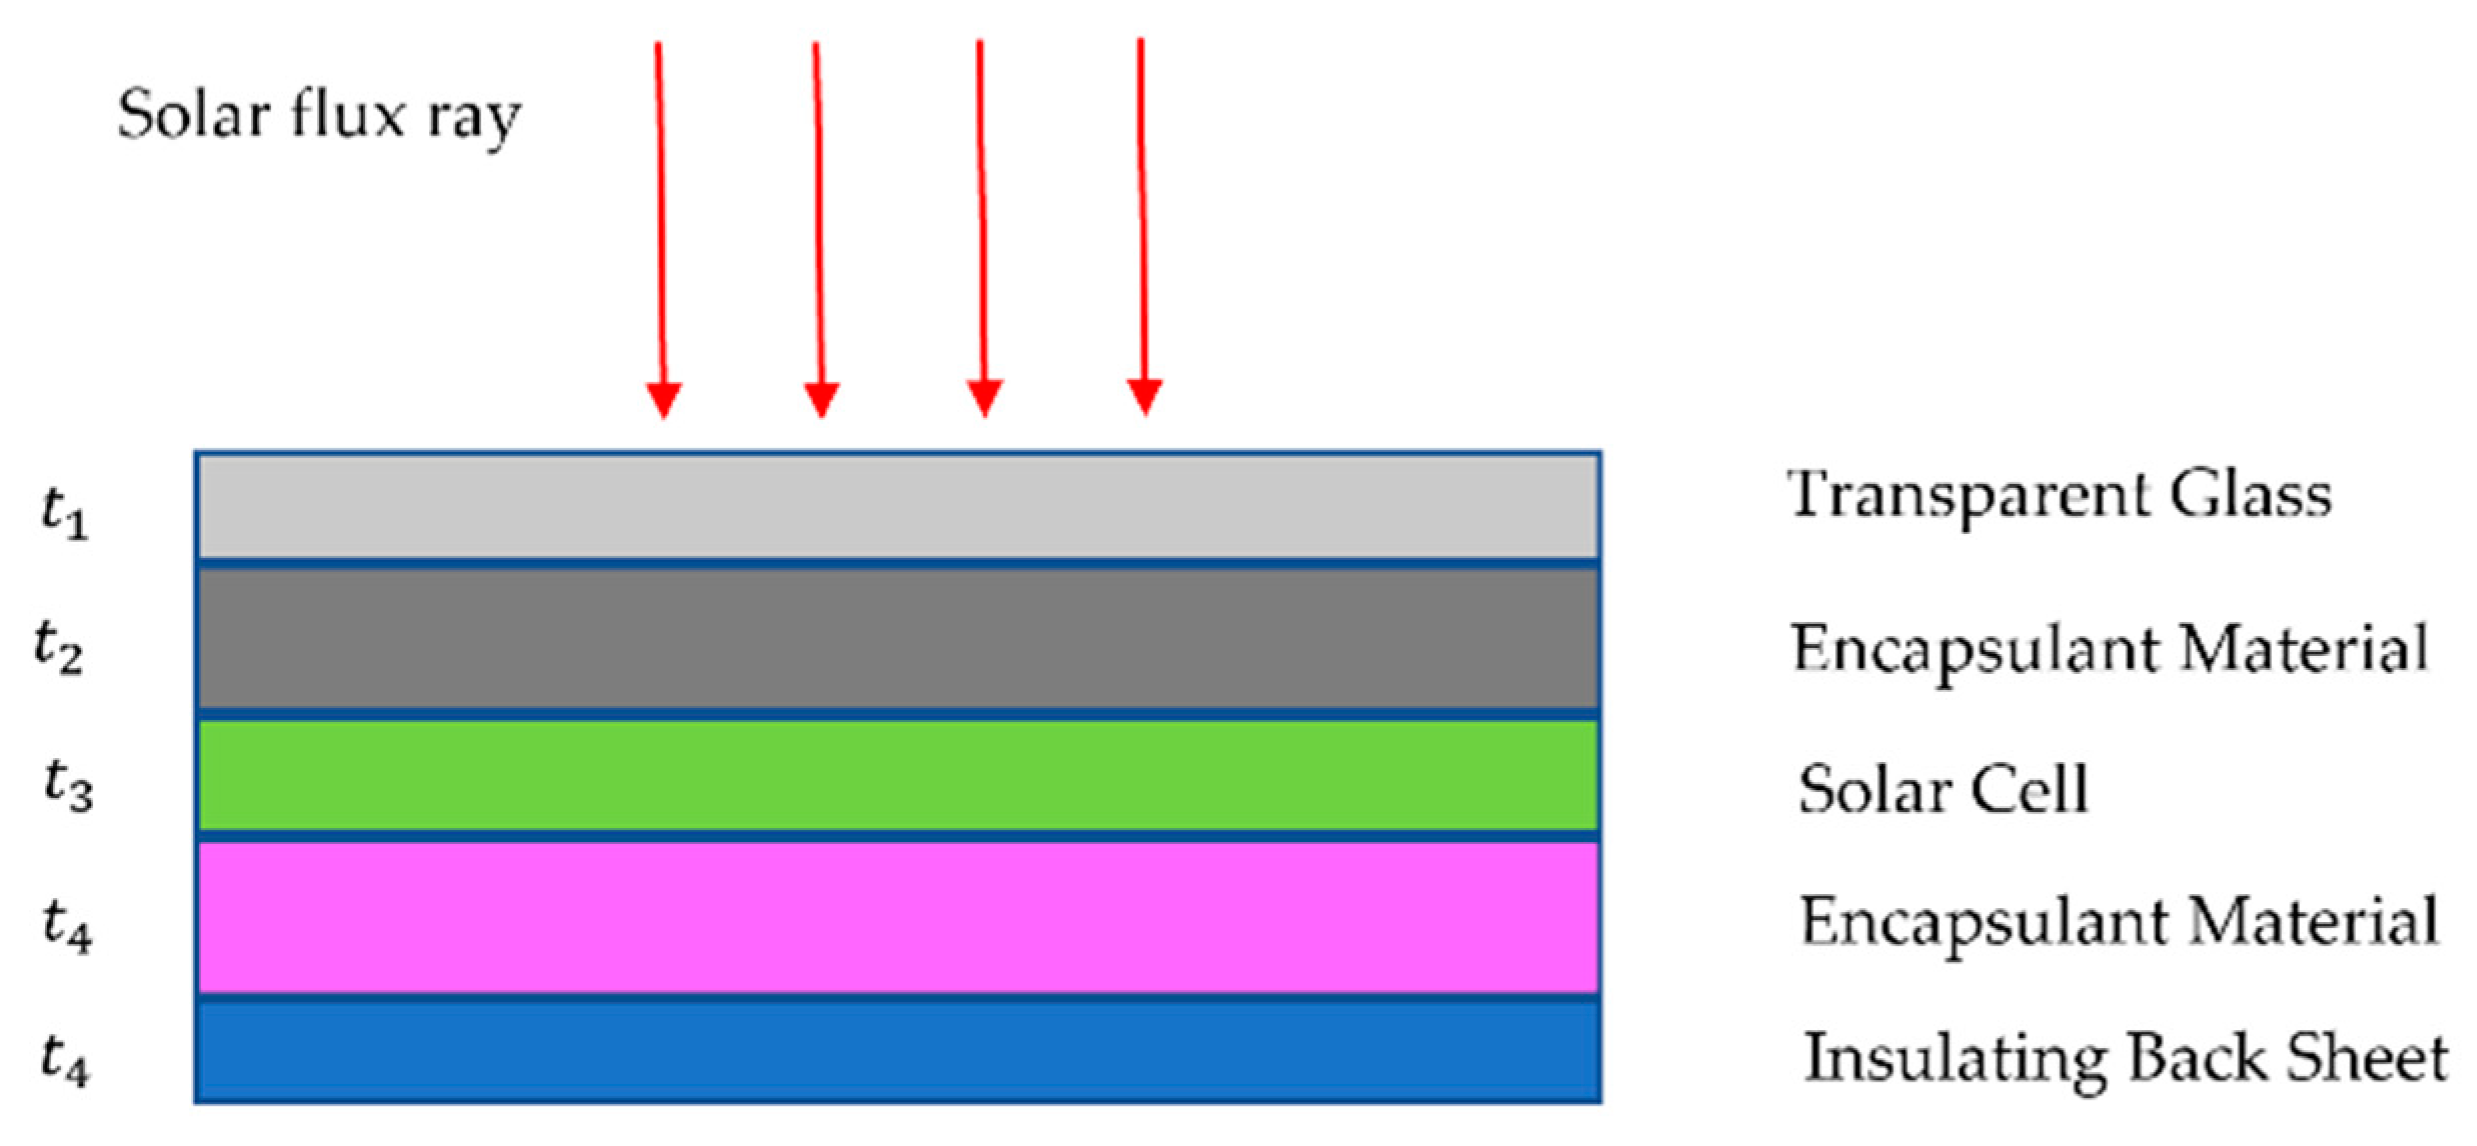
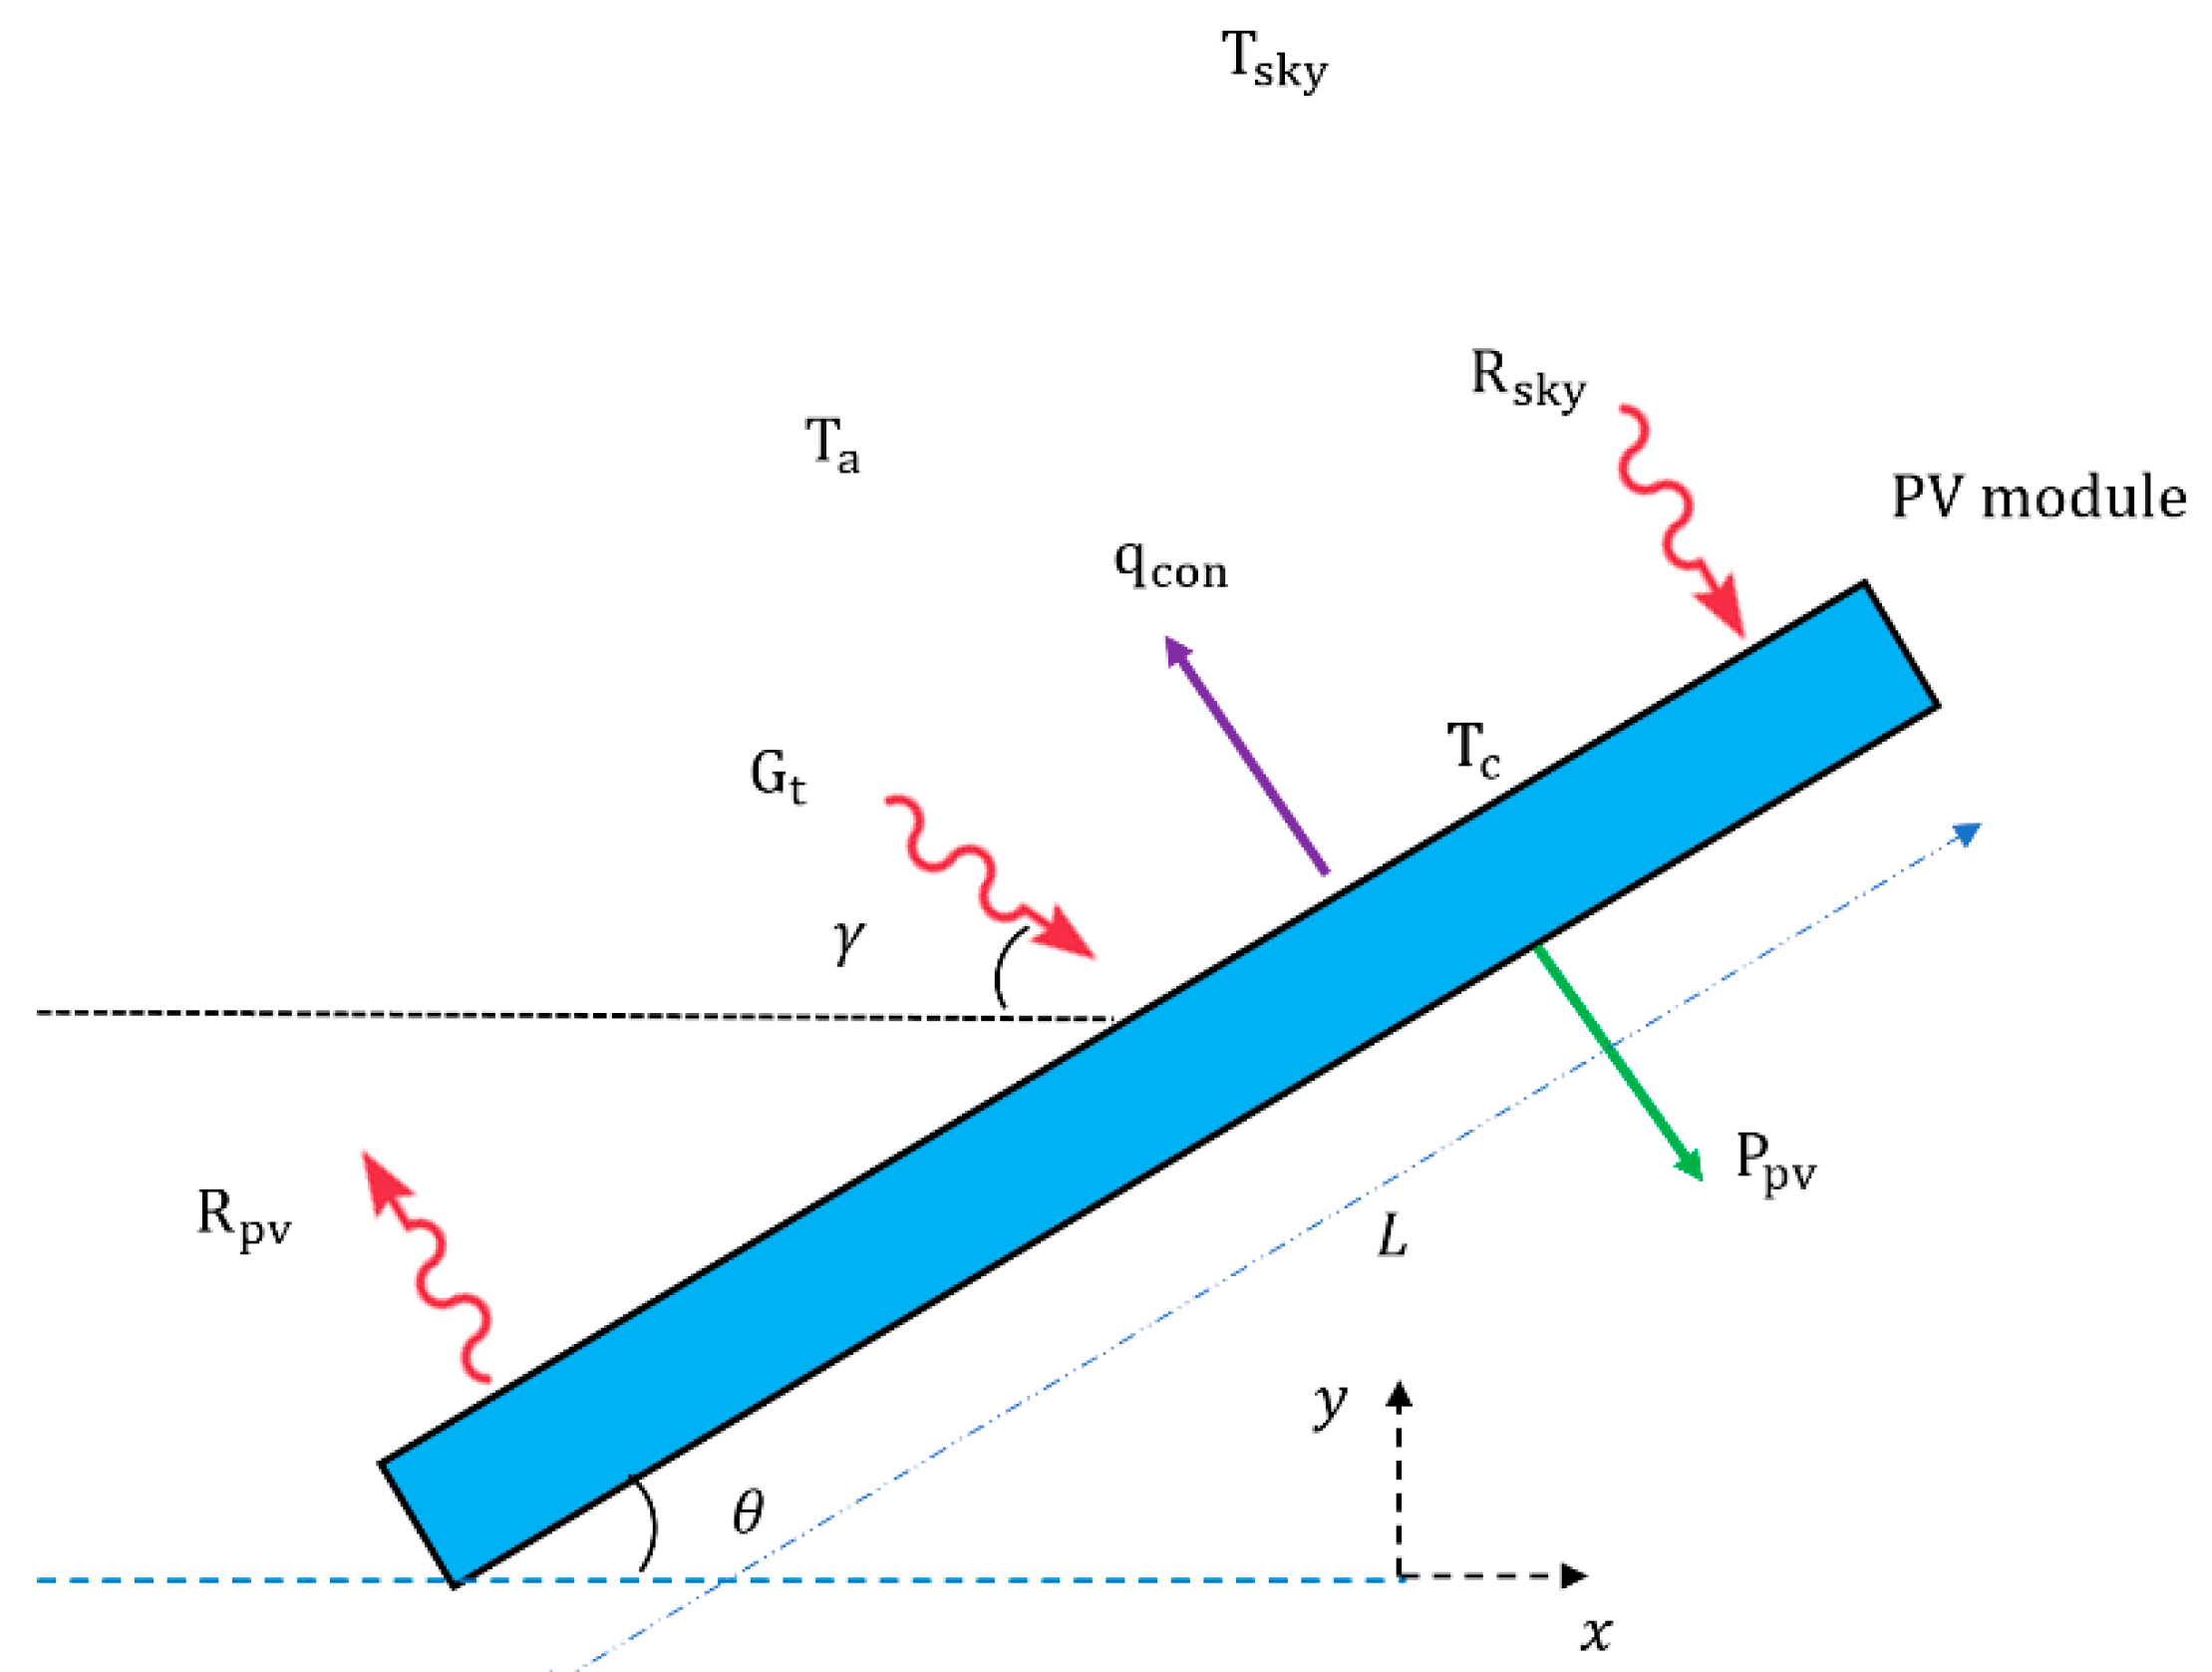
2.1. PV Module Structure and Setup

A PV cell has a specific layered structure that receives solar flux and converts it to electricity [5,9,11]. In this work, we consider the heat transfer properties of this structure to model the PV module operating temperature and efficiency.
Figure 1 presents the simplified layered structure of the PV module. Each layer has a particular thickness, and there is a material property for the coating that enhances heat transfer conduction between layers. The solar flux during the day changes orientation. At midday, the Sun is assumed to radiate perpendicularly to the PV module, which has a 90° exposure to ground level. For the rest of the day, the module has a greater or smaller solar radiation intercept. Hence, the absorbed solar flux must consider the perpendicular component of the PV module and the radiation absorbed during the daytime.
On the other hand, an optimal tilt angle for the PV module determines an inclination with which to gain maximum solar flux [2,26,27,28,29]. Therefore, we cannot assume that the PV module maintains horizontal conditions with a tilt angle of zero.

2.2. Environment Surrounding the PV Module

The PV module is mounted in open air and surrounded by airflow. In the literature, wind speed affects PV module operating temperature and efficiency via forced convection [16,30,31]. However, as mentioned in Section 2.1, the PV module can be adjusted with a unique tilt angle, becoming an inclined plane in the air. The inclined hot/cold plate has a free convection heat transfer that can be formulated into an empirical equation [32,33,34,35]. Free convection is characterized by the surrounding air, which affects the ambient temperature. Hence, the ambient temperature is not constant throughout the day. These characterizations should be used in an energy conservation equation to determine how they affect each other.

2.3. Theory

The inclined open-air PV module gains solar flux and generates electricity. Energy transfer via the radiation exterior and the conduction interior affects the PV module operating temperature and efficiency. A cooling system is applied to many models to reduce the PV module operating temperature and increase efficiency. There are distinct cooling techniques for PV modules which are known as passive and active. Cooling technologies have developed towards more sophisticate approaches, such as heat sinks, microchannels, heat exchangers, phase-change materials (PCMs), nano-fluids, thermoelectric generators (TEGs), or combinations with other systems. Forced convective heat transfer via wind speed is one of the traditional methods. This study considers a PV module without a cooling system. However, our trial uses constant cooling when evaluating the proposed model.
Using the traditional steady-state [33,36] PV module, we describe the energy balance in Equation (1) with heat transfer on an inclined or horizontal plate [31,33]:
E in E out = 0
Figure 2 illustrates an inclined PV module absorbing solar radiation, and it assumes fundamental radiation concepts [33]:
G s R pv q con P pv = 0
where G s is gained solar flux, R pv is radiation heat transfer, q con is convection heat transfer, and P pv is the electric power generated and output.

2.3.1. Solar Flux on the PV Module

The solar flux component gained from the PV module has a specific direction. The solar flux radiation is G t , and the earned amount related to α pv solar absorptivity of the PV module, G s , is calculated by Equation (3):
G s = α pv G t sin ( γ + θ )
where γ is the complement angle of the solar radiation ray angle with vertical axis, y, and θ is the PV modules’ tilt angle. This equation represents the received solar flux corresponding to the solar ray direction and the module tilt angle. A PV module with a greater α pv induces more flux absorption.

2.3.2. Radiation to/from the PV Module

It is well known that PV modules generate heat transfer radiation. Indeed, there is radiation absorption from the sky and the PV module. Net radiation is the difference between emission and absorption in the PV module. Equation (4) defines the radiation energy of the PV module, where σ is the Stefan–Boltzmann constant, α sky is sky emission, and ε c   is the PV absorber surface emissivity. The sky emission absorbed on the PV module vs. the sky emission can be assumed to be equal to ε c = ε , the PV absorber surface of emissivity. T c is the PV module temperature, and T sky is the sky temperature, which is assumed to be equal to the ambient temperature, T a [15,16,31]:
R pv = σ ( ε c T c 4 α sky T sky 4 ) = σ ε ( T c 4 T a 4 )

2.3.3. PV Module Output

The electricity power output of the PV module corresponds to the PV module efficiency [31], which is determined using a linear function of the PV module operating temperature with empirical considerations [30,31]. The basic concept for PV power output is defined in Equation (5):
P = AG s η
where P is the electricity output in W, A is the PV module surface in m2, and η is the PV module efficiency.

2.3.4. Wind Speed Effect on the PV Module

The wind effect on a PV module is usually considered to be a forced cooling effect, as it is well known that when reducing the PV module temperature, the PV module efficiency could increase [16,32,33,34,37].
The forced convection of wind over a flat PV module involves a large number of variables, such as wind speed, wind direction, time-dependent fluctuation, module surface characteristics, tilt angle, and wind interference from terrain and structures [37]. In general, the correlation is complicated. However, a particular case of parallel flow has been well investigated [16,23,37,38]. For steady-state airflow over a parallel plate, the following simple formula was found to give good correlations to experimental measurements [37]:
H w = 3.8   V w ; V w 5   m / s H w = 7.17   V w 0.78 ; V w > 5   m / s
where Hw is the forced convective coefficient of heat transfer in W/m2·°C and Vw is the free stream wind velocity parallel to the module near the surface in m/s.
The literature has reported that the effect of wind cooling on PV modules is governed by wind speed, wind direction, and the location of wind measurement [37]. The empirical studies mentioned that are related to the situation studied in this paper are located in sites with low wind speed, and the wind does not affect the PV modules’ operations and efficiency [23,37,39]. Those studies show that an average convective heat transfer coefficient can approximate the wind effect; however, this average coefficient is not able to involve wind direction and the height of the measurement [23,37].
However, a long-term field test with a linear regression analysis of data indicates that the PV module temperature has a very weak sensitivity to change in wind speed [37]. The reports dictate that considering PV module energy production without considering wind effects can create long-term predictions with less than a 2% deviation [37,40]. Those studies also show that in an environment with wind speed Vw < 5 m/s, its effect is insignificant [37,40]. It is well known that at the location of the PV module installation, wind has less speed than that.
In the current study, the proposed equation does not consider the wind speed effect because: (a) it is not a universal effect, (b) it is considered for cooling and efficiency improvement, and can be added by known correlations [37,38,39,40], and (c) this study is a steady-state analysis without forced cooling effect investigations [16,32,33,34,37].

2.3.5. Heat Transfer Convection in the PV Module

The inclined PV module experiences heat transfer via convection. In the literature, convection is usually considered to be constant [31]. In an environment with significant wind speed (Vw > 5 m/s), the force convection is also regarded. On the other hand, an inclined plate (e.g., the PV module) has free convection heat transfer, which has an empirical equation that is a function of gravity, tilt angle, airflow properties, and temperature difference between the plate and the environment. The free convection equations have categories based on the Rayleigh number, which specifies the thermal boundary layer laminar and turbulence states. The equation is considered to be specific when the PV module is horizontal with a tilt angle of zero. There are also equations for the inclined plate at other tilt angles. In this study, we employ these equations to define the numerical model.
This study considers only free convection, and it assumes that there is no forced convection (cooling system). We employ the Nusselt number, Nu, which implies relativity between convection and conduction heat transfer [16,33]:
Nu = hL k h = Nuk L
where h is the convective heat transfer coefficient, k is the effective thermal conductivity, and L is the PV module length. For vertical and inclined panels, L is the panel length, but for horizontal panels, L = A s / P s , where As is a panel surface and Ps is the panel perimeter [33].
Evaluating the Rayleigh number in Equation (8) is necessary to choose the correct Nusselt equation for the inclined or horizontal PV module. The Rayleigh number evaluation is mentioned in the results section, assuming a regular PV module application and free convection, with Ra < 2 × 10⁹ and Ra < 1011, respectively, for inclined and flat PV modules [32,33,34,35]. In Equation (8), g must convert to gsin θ [33], and the Nusselt number for inclined and horizontal PV modules are defined with Equations (9) and (10), respectively [33]
R a L = g β ( T c T a ) L 3 α υ
Nu = 0.68 + 0.67 × ( Ra L ) 1 4 [ 1 + ( 0.492 Pr ) 9 16 ] 4 9
Nu = 0.15 ( Ra L ) 1 3 · ( Horizontal PV ) ,
Where g is gravity (9.98 m/s2), β is the volumetric thermal expansion coefficient, α is thermal diffusivity, υ is kinematic viscosity, θ is tilt angle, and Pr is the Prandtl number.

2.3.6. PV Module Heat Transfer Model

From the previous subsections, when Equations (3)–(5) and (7)–(10) are substituted in Equation (2):
A pv G t sin ( γ + θ ) σ ε ( T c 4 T a 4 ) Nuk L ( T c T a ) A α pv G t sin ( γ + θ ) η = 0
Equation (11) presents the functionality of the PV module operation temperature and these characterizations:
-
Solar flux.
-
Solar beam orientation.
-
PV module tilt angle.
-
Airflow properties, most of which function as ambient temperature.
-
PV module operating temperature related to ambient temperature.
-
PV module temperature is a function of the PV module area.
-
There is a functionality between the PV module operating temperature and the PV module efficiency.
Equation (11) is shown in a detailed form for the horizontal and inclined PV modules in Equations (12) and (13), with specified Nusselt numbers, respectively:
( 1 1 η ) α pv G t Asin ( γ + θ ) σ ε A ( T c 4 T a 4 ) 0.15 A k L ( g β L 3 α υ ) 1 3 ( T c T a ) 4 3 = 0
( 1 1 η ) α pv G t Asin ( γ + θ ) σ ε A ( T c 4 T a 4 ) 0.68 A k L ( T c T a ) 0.67 A k L × ( g β L 3 α υ sin θ ) 1 4 [ 1 + ( 0.492 Pr ) 9 16 ] 4 9 ( T c T a ) 5 4 = 0

2.3.7. Numerical Solution

Equations (12) and (13) are solved using Newton’s iterative numerical approach, with an initial guess equal to Ta since it is a steady-state condition, to evaluate the relationships among PV module temperature, PV module efficiency, and environmental characterizations. In the numerical solution, the input values and boundary conditions are applied from [1] to specify the coefficients in the nonlinear equation. In addition, both equations, after substituting the inputs, could be rearranged, and are solved as an efficiency function of PV module temperature. Therefore, the results are compared to previous studies with a similar state, such as [1]. Table 1 mentions the applied input.
When the PV module is adjusted in the horizontal state, θ = 0°. For the inclined PV module, θ is various. Equation (9) for an inclined PV module is valid within 30° ≤ θ ≤ 80°; therefore, the changes will be in this range [33]. This θ identifies the tilt angle setup. Variable γ is the solar ray angle with respect to the horizontal level, and it is assumed to be varied within 30 ° γ 90 ° . The γ specifies the Sun direction flux during the daytime, and it changes hourly; at midday, it is at about 90° with maximum G t [16].
The solar flux, G t , changes depending on the weather, pollutants, and other environmental conditions [16]. In this study, we consider G t to exist particularly without named effects. The results are obtained from the numerical solution and are presented in Section 3.

3. Results

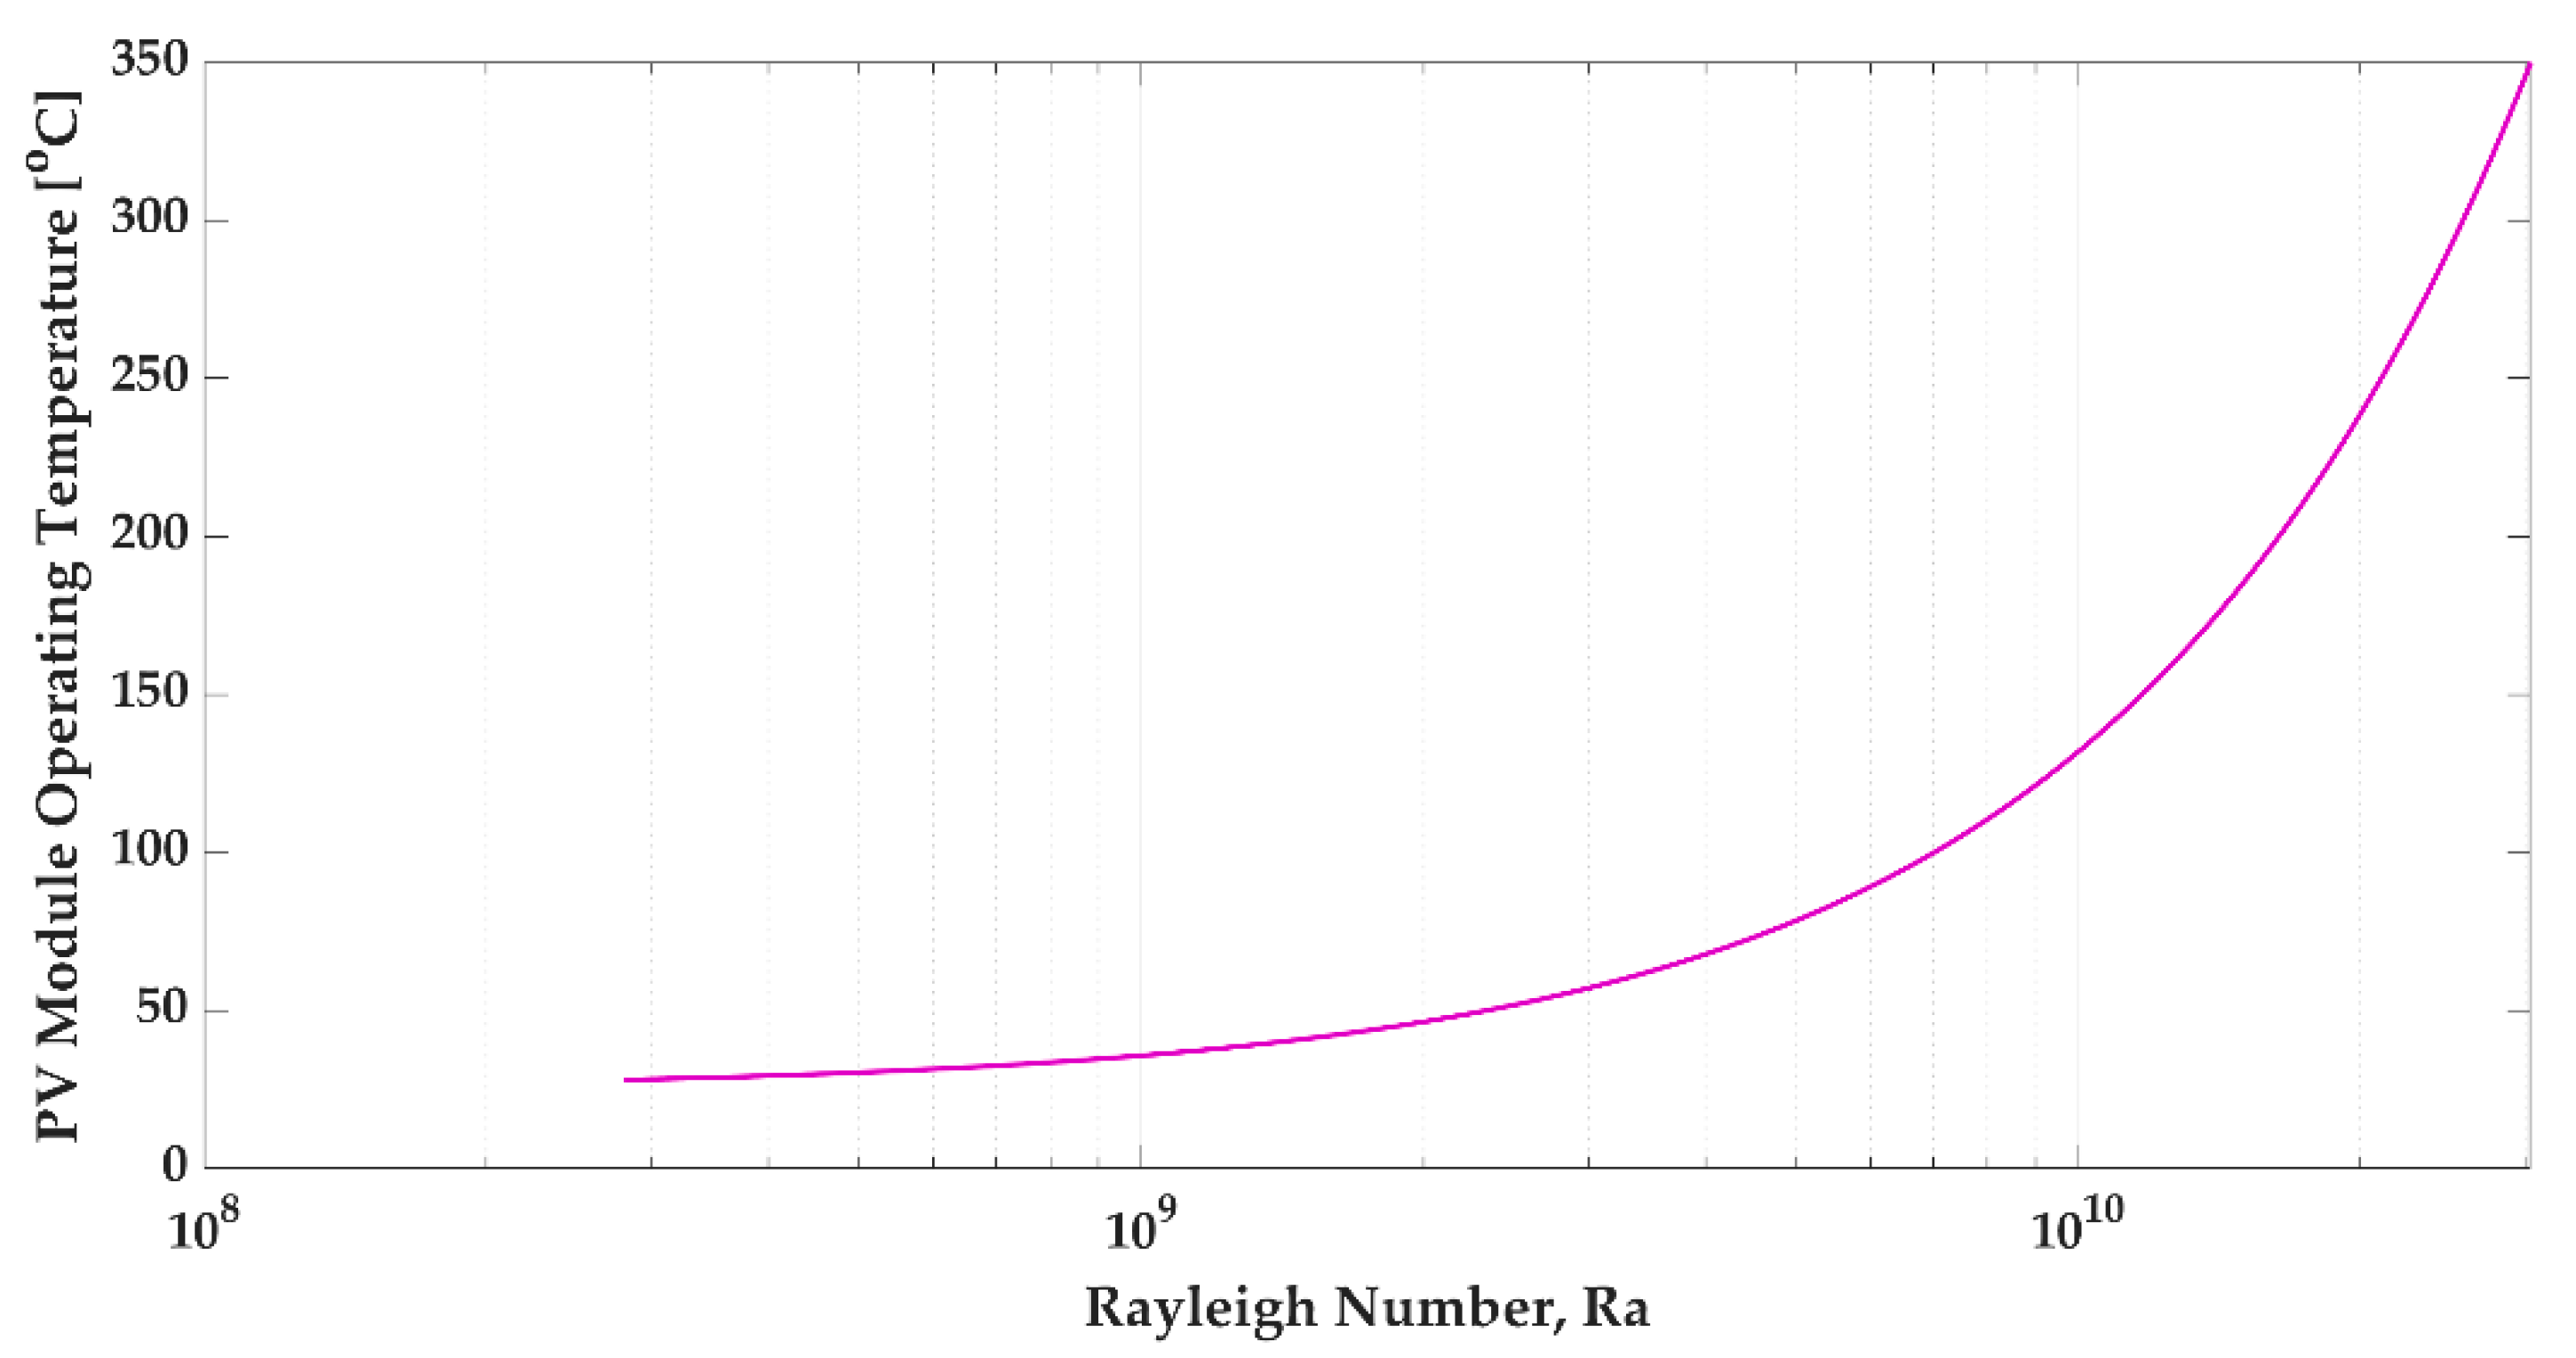
3.1. Rayleigh Number Evaluation

Figure 3 illustrates the flat PV module temperature change with the Rayleigh number. In this figure, the module has a tilt angle θ = 0 ° , and sunrays at γ = 90 ° . The Rayleigh number function of ambient temperature, T a , difference per module operating temperature is υ T = T c T a . In this figure, the ambient temperature is assumed to be constant; therefore, the airflow properties are stable [16,33]. The Rayleigh number increased logarithmically as the operating module temperature increased. When the module operating temperature was under 50 °C, the Rayleigh number increased slowly; however, after 50 °C, it gained a sharp curve slope. This figure presents the PV module operating temperature at 300 °C. However, the operating temperature in the application has a peak efficiency for PV modules at 15 to 35 °C, and the maximum measured PV module temperature is 65 °C [30,41]. The Rayleigh number is seen in this domain as less than 1011, validating Equation (10) for the application of a flat PV module.
In Figure 4, the inclined PV module temperature is presented in terms of a logarithmically changing Rayleigh number. The angle of solar incidence is assumed to be γ = 90 ° . The PV module tilt angle is varied within 30 ° θ 80 ° . This figure shows that when the operating temperature is under 50 °C, the Rayleigh number moderately increases for all tilt angles. However, for PV module temperatures higher than 50 °C, the Rayleigh number increases dramatically. According to the literature, the maximum PV module temperature is 65 °C [30,41].
In Figure 4, the Rayleigh numbers for this temperature, Ra < 2 × 10⁹, and Equation (9) are suggested for use in engineering applications. Ra < 109 [33] covers our study domain. It is well known that a higher Ra reflects turbulence conditions in the boundary layer and is expected to have more desirable convective heat transfer than a smaller Ra [32,33,34,35]. Figure 4 indicates a tilt angle of 30° with a Rayleigh number higher than that of the other tilt angles. This reflects the larger tilt angle, causing a lower Ra and less convective heat transfer.

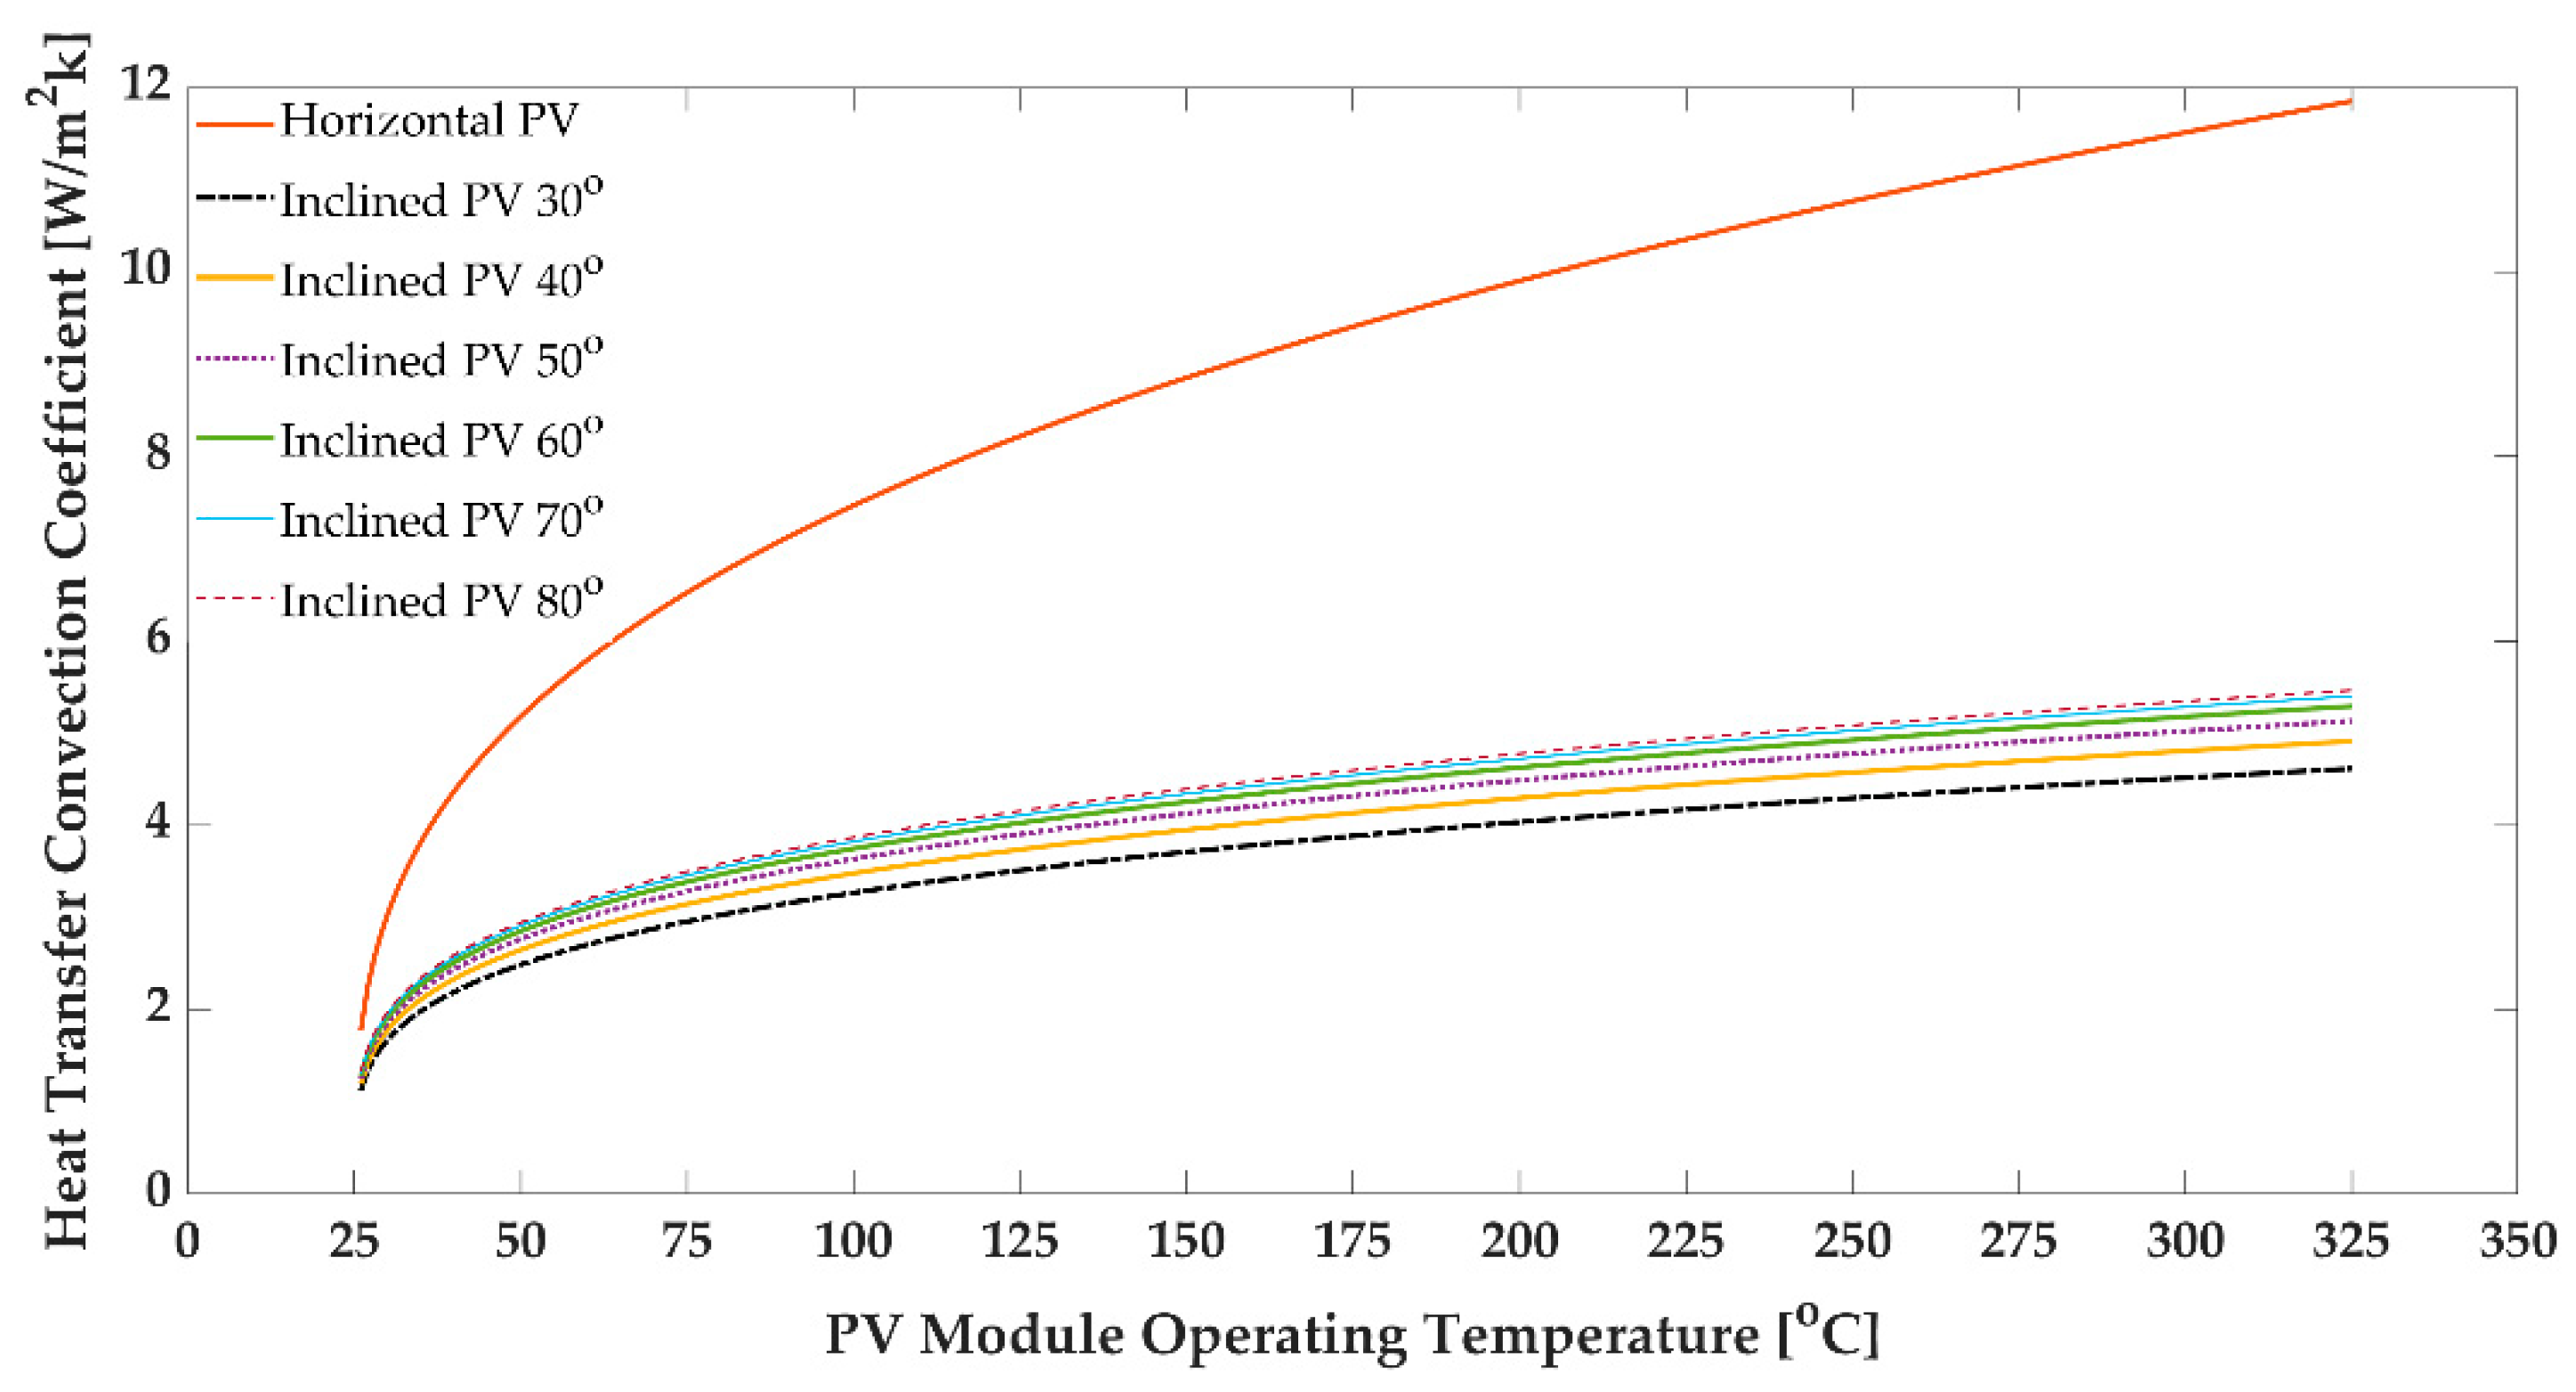
3.2. Convection Heat Transfer Coefficient on the PV Module

Figure 5 represents the convection heat transfer coefficient, h, for a PV panel with various operating temperatures. Based on the relationship obtained in Equations (12) and (13) for flat and inclined panels, this figure shows that the flat PV module convection coefficient is more extensive than all inclined PV modules with any tilt angle in this study.
For a flat PV panel whose hot surface faces upward in a cooler environment, the heated airflow rises freely, inducing natural solid (free) convection currents and effective heat transfer [32,33,34,35]. For an inclined PV panel in which the hot surface faces upward, the net force (the difference between buoyancy and gravity) acts on the unit volume of the airflow in the boundary layer and is always in the vertical direction. On the other hand, on an inclined panel, the airflow has a parallel motion along the plate, and these two forces’ directions break up the boundary layer and form plumes [32]. As a result, the thickness of the boundary layer and the resistance to heat transfer decrease, and the rate of the heat transfer increases relative to the vertical orientation panel [32,42,43,44,45,46,47,48,49,50,51,52,53,54,55,56,57,58,59,60,61]. For inclined panels beyond a specified temperature, h does not have an effective change and keeps constant.
The figure clarifies the significant distinction regarding convection heat transfer on an inclined panel and a flat panel. This figure illustrates how the horizontal PV module has more convection heat transfer. It causes the PV module not to gain the maximum solar flux and means that it will have a lower operating temperature. Moreover, this behavior explains why the literature looks for an optimal tilt angle for a PV module which, with that angle, could receive significant solar flux and generate higher temperatures [2,26,27,28,29,62,63,64,65,66,67].

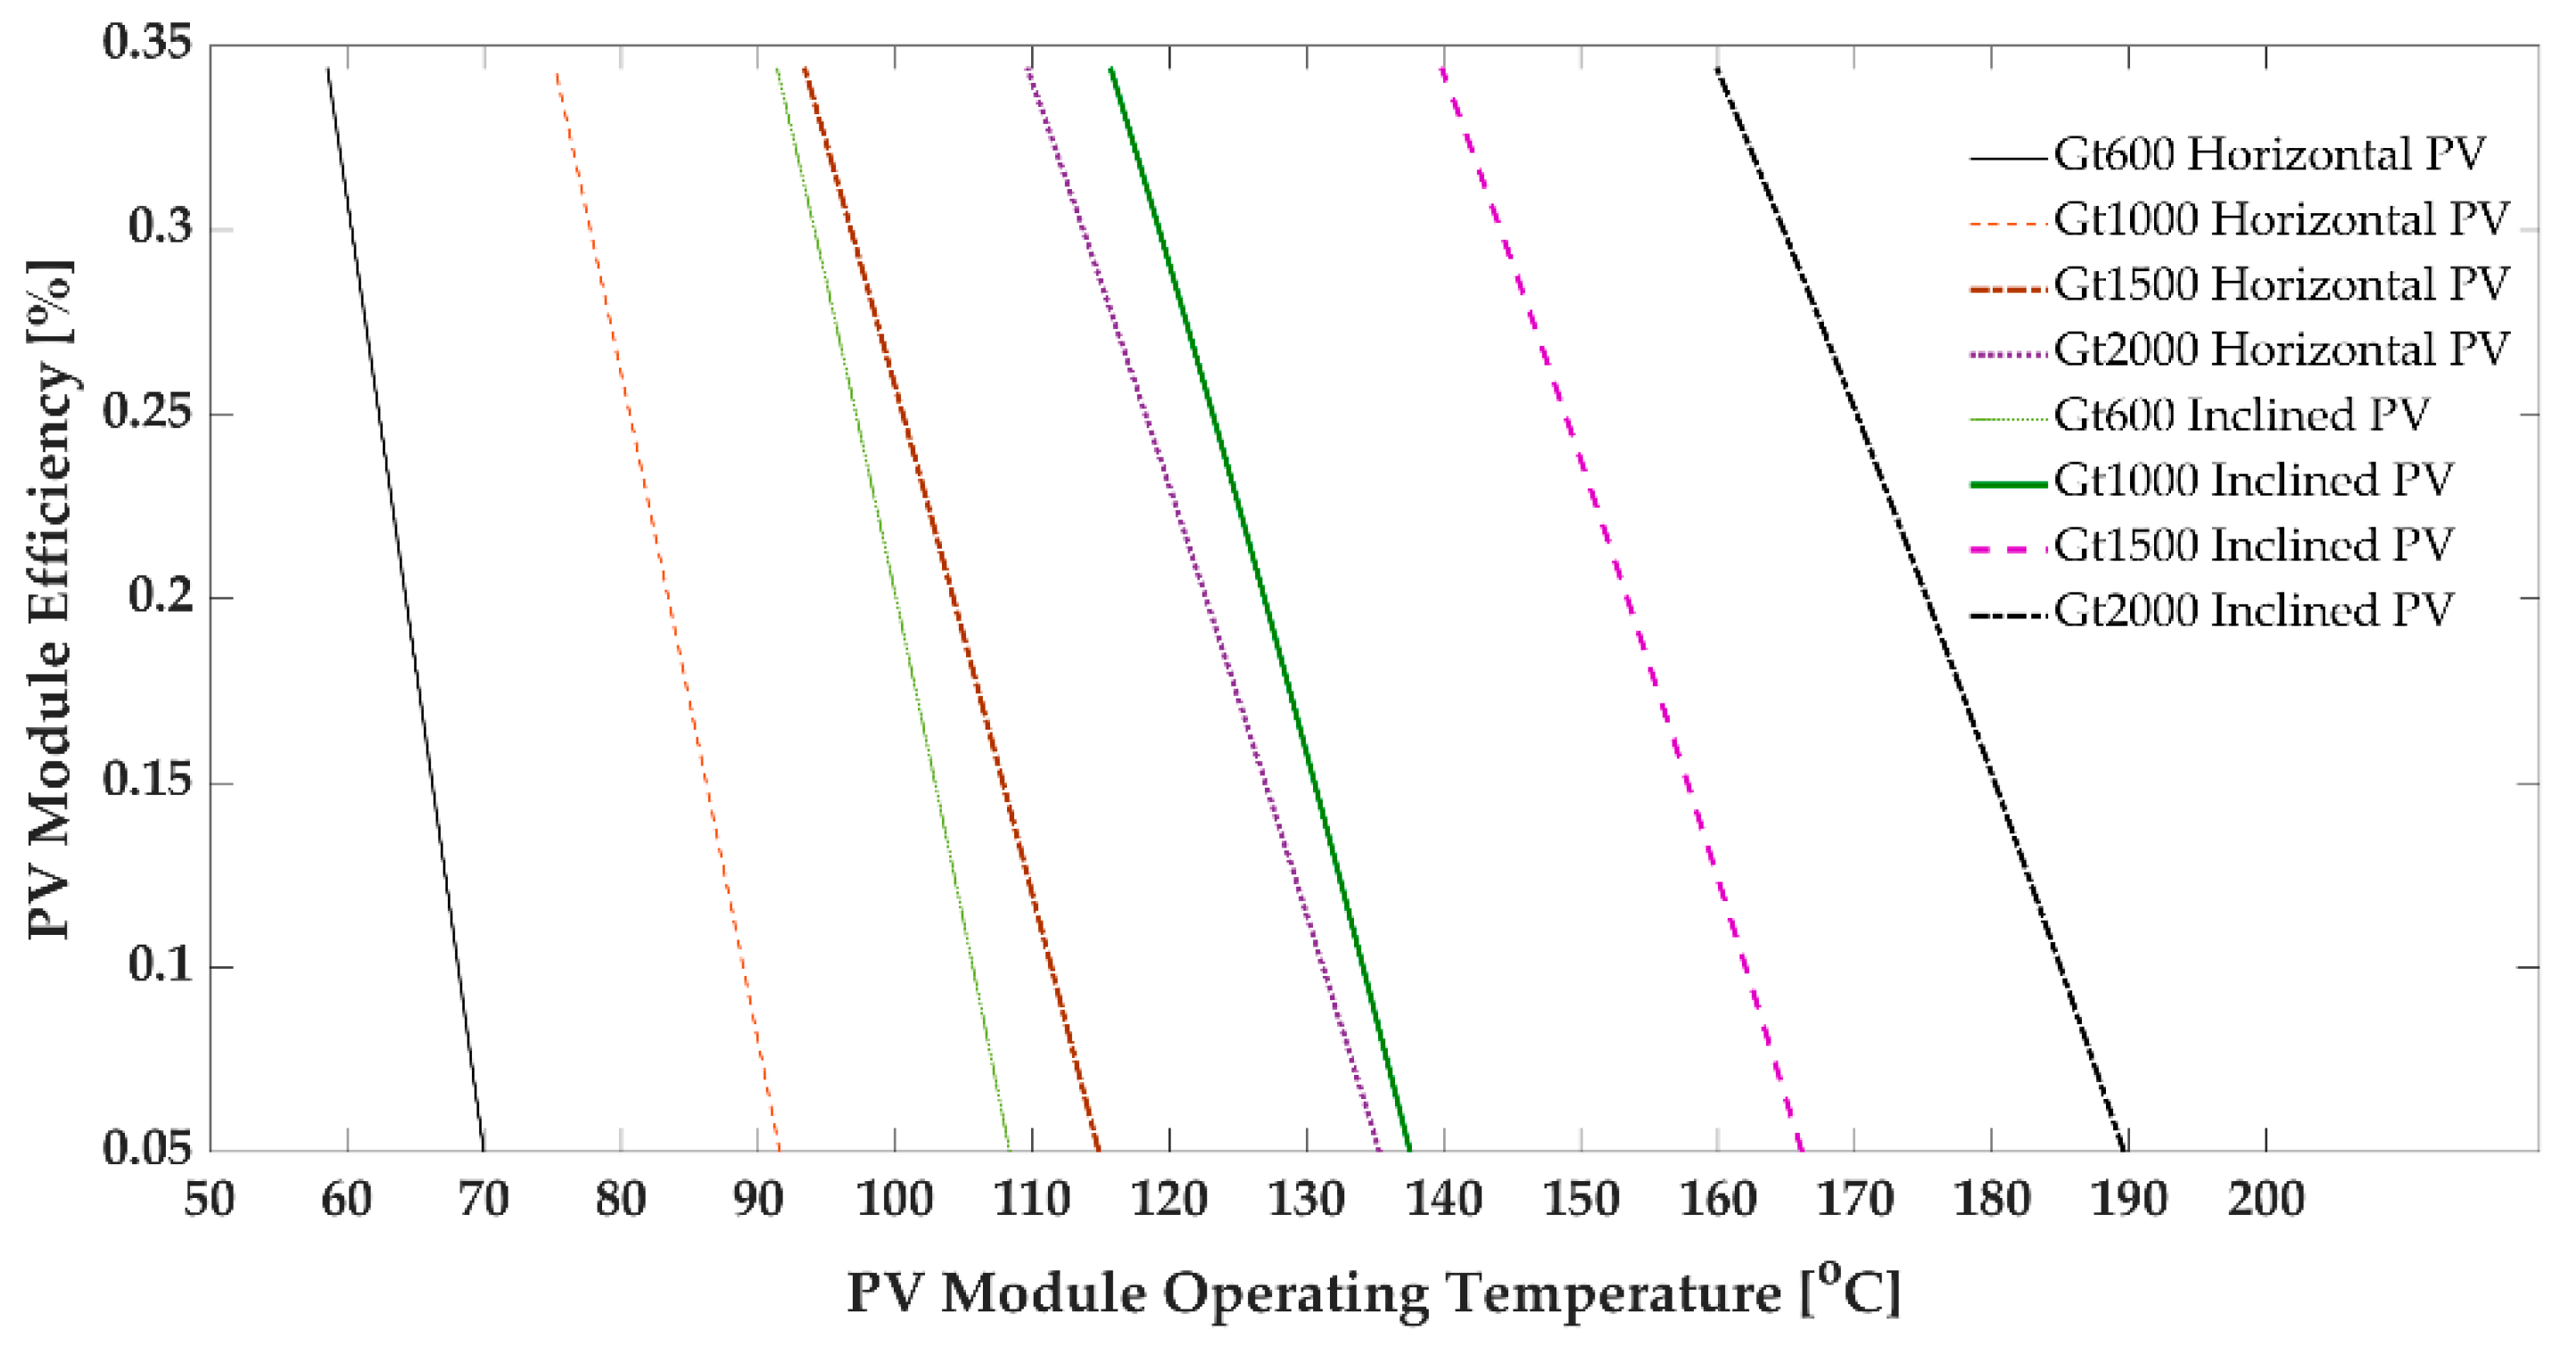
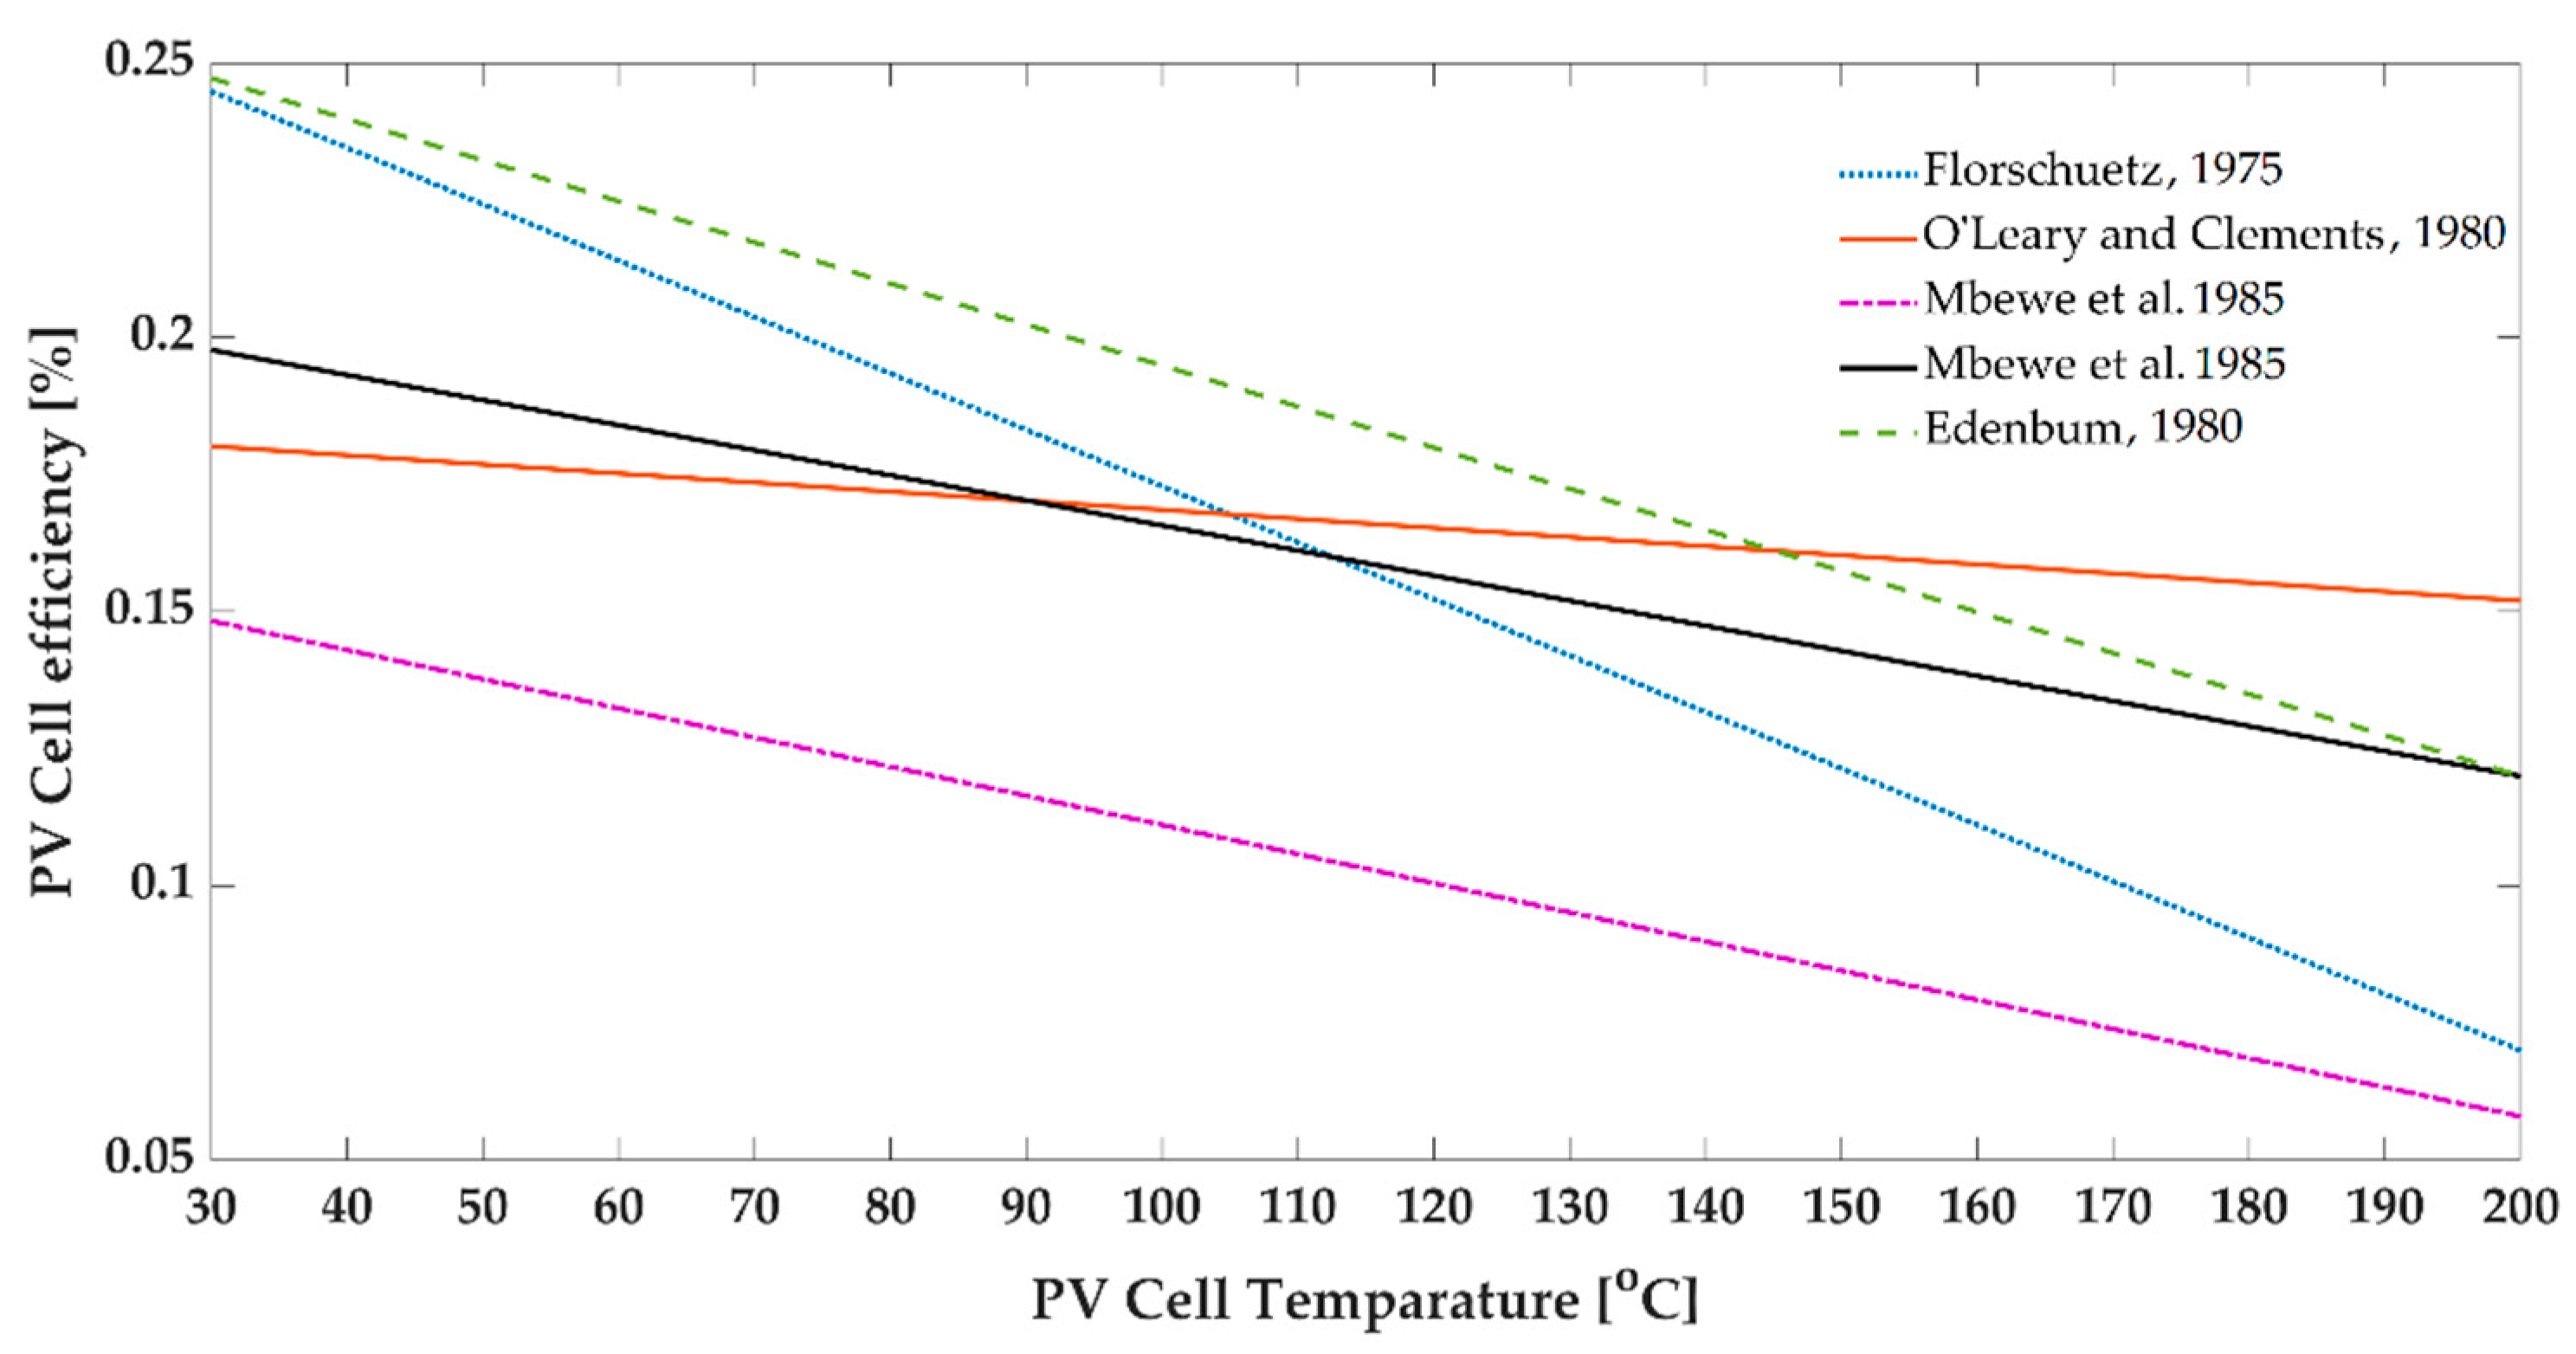
3.3. PV Module Efficiency and Temperature

Figure 6 explains the PV module efficiency relationship with the operating temperature. The result from the proposed equation shows that the efficiency has a linear relationship to the operating temperature. This concept matches previous experimental studies [16,31].
PV modules with a higher Gt have better efficiency. In the literature, efficiency is a function of the PV module operating temperature and solar flux [3,31]. Nevertheless, there is no significant investigation of efficiency and solar flux correlations [31]. Figure 6 dictates an analogous flat PV panel with different solar flux, and each curve has a unique efficiency compared to the corresponding inclined PV module with similar solar flux.
Figure 7 presents the empirical model from the literature that mentioned the linear relation between the PV cell efficiency and operating temperature. All suggested models specify unique PV cell properties and working conditions. As evident in Figure 7, there were no similarities between the models because the models did not cover all the effective parameters from the environment and PV cell setup [67].
Figure 8 shows the operating temperature change vs. the tilt angle for an inclined PV module with a specified efficiency: solar flux is Gt = 1000 W/m2 at γ = 90 ° . This shows that an increasing tilt angle leads to a colder PV module, resulting in less energy gain. For all efficiency curves, a tilt angle of θ = 30 ° has the best efficiency at this setup. This figure illustrates that a hotter operating temperature causes less efficiency.

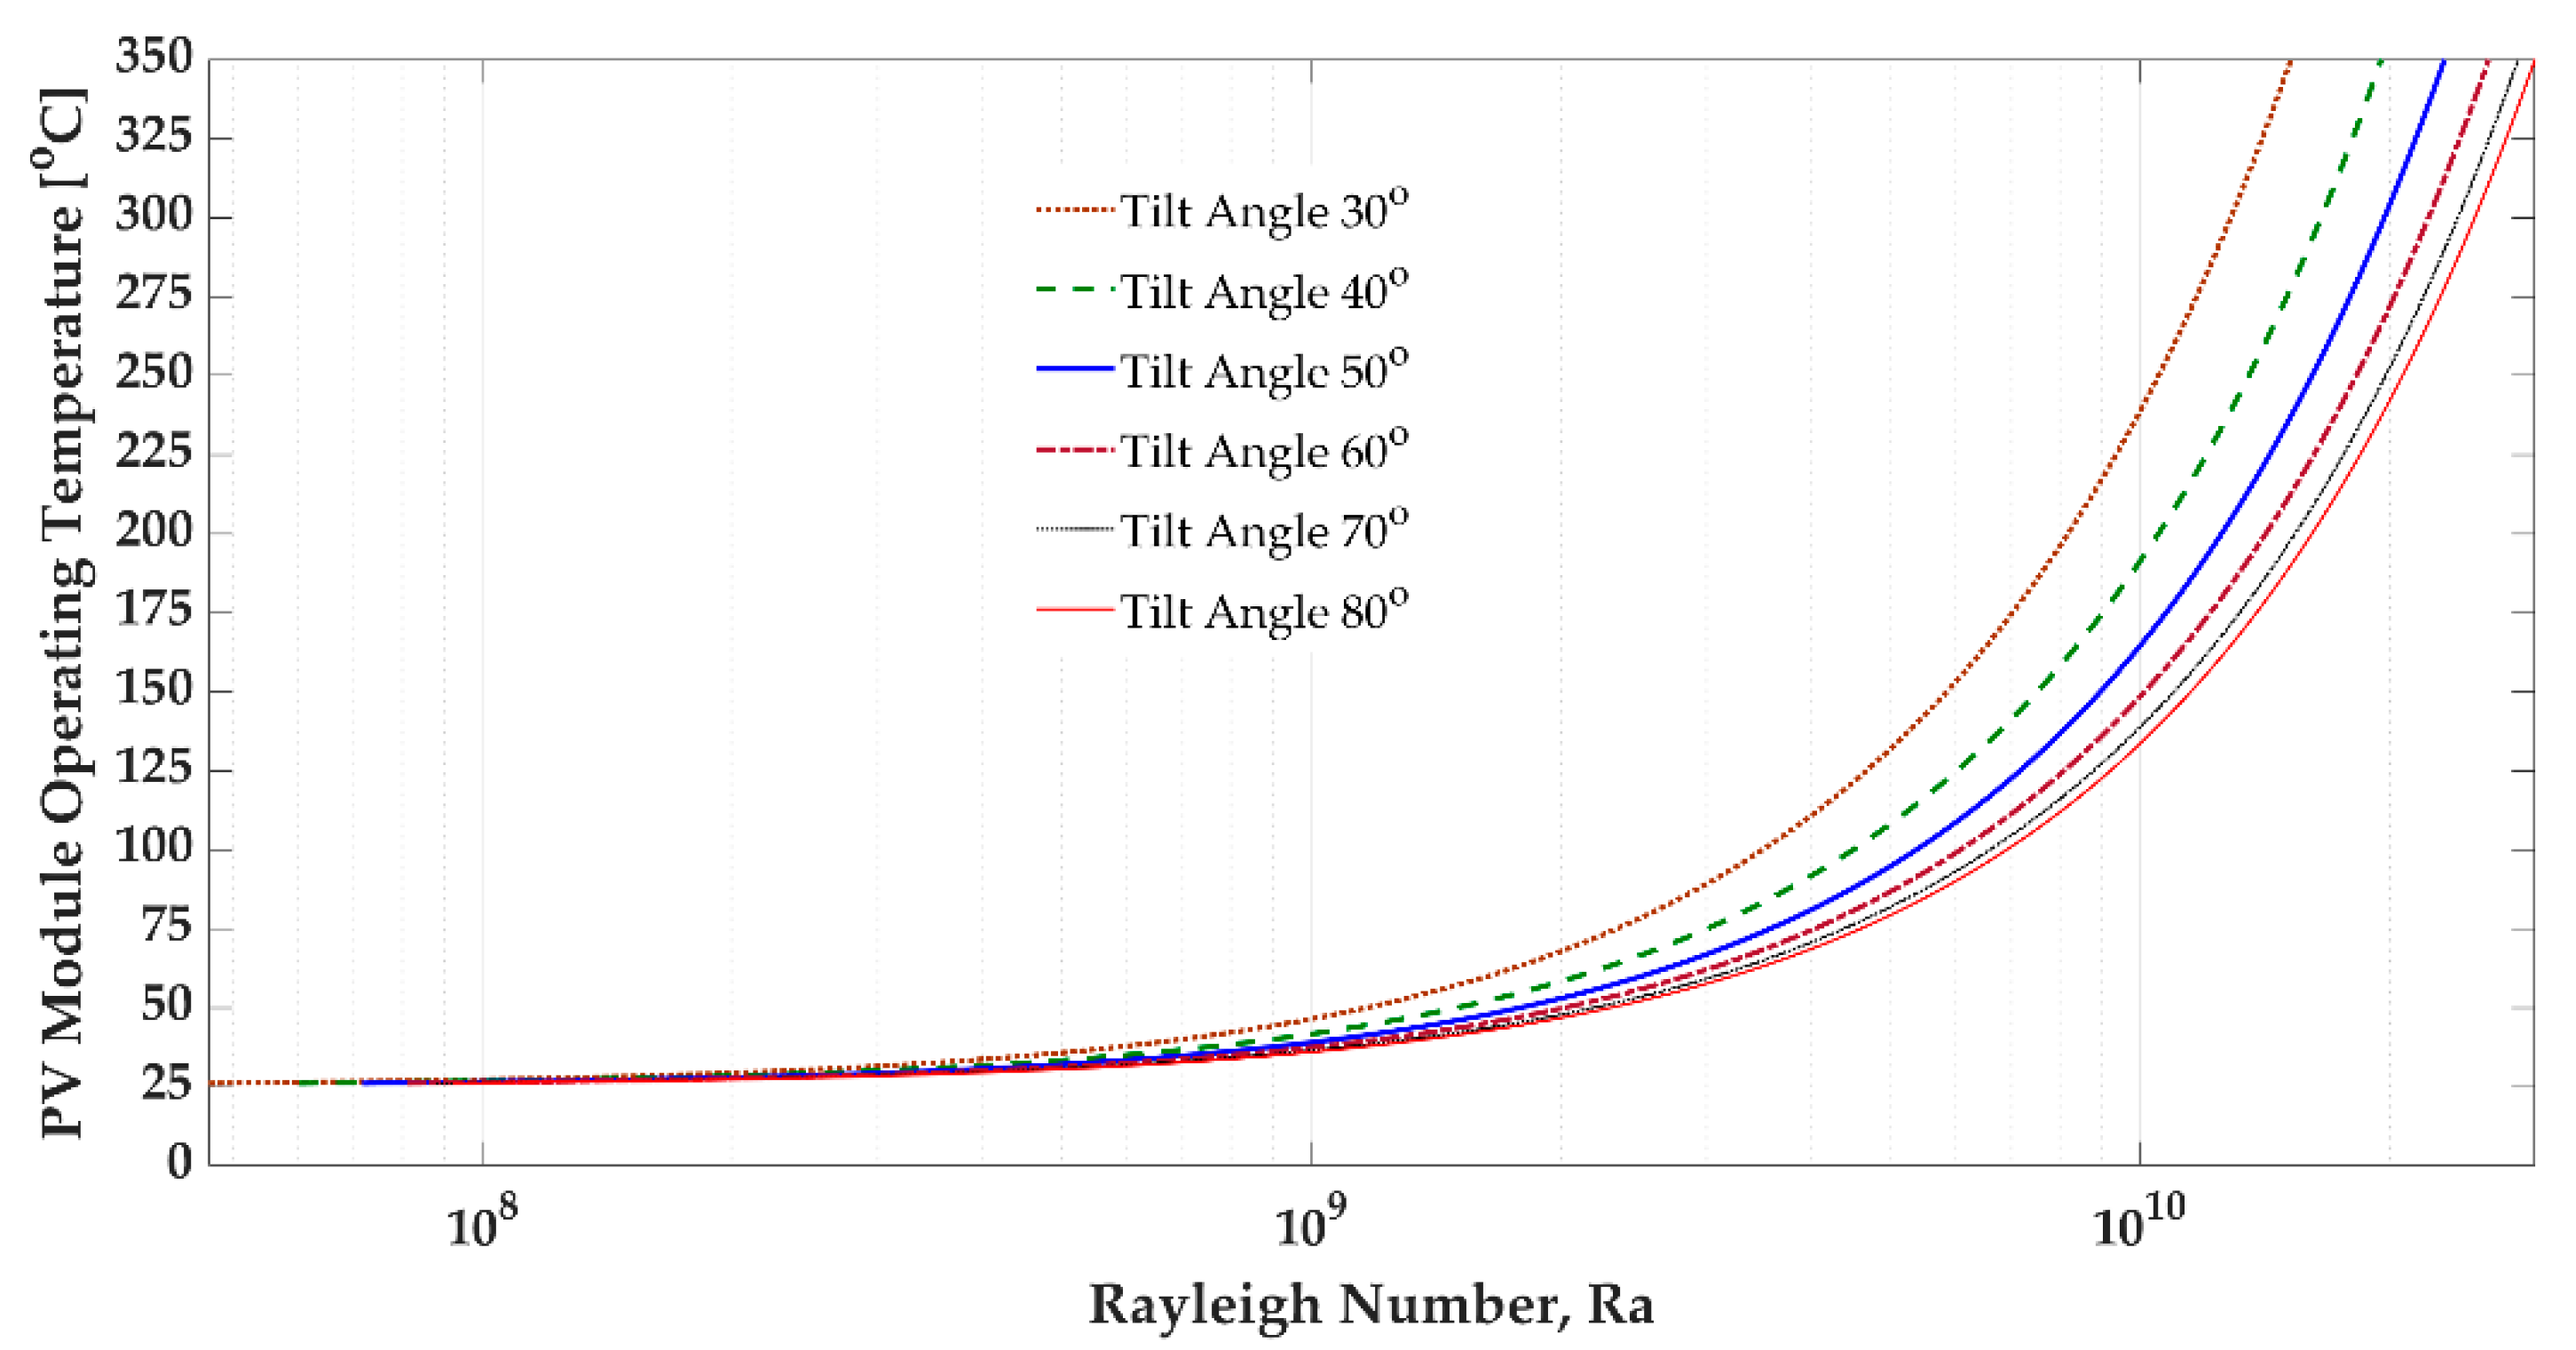
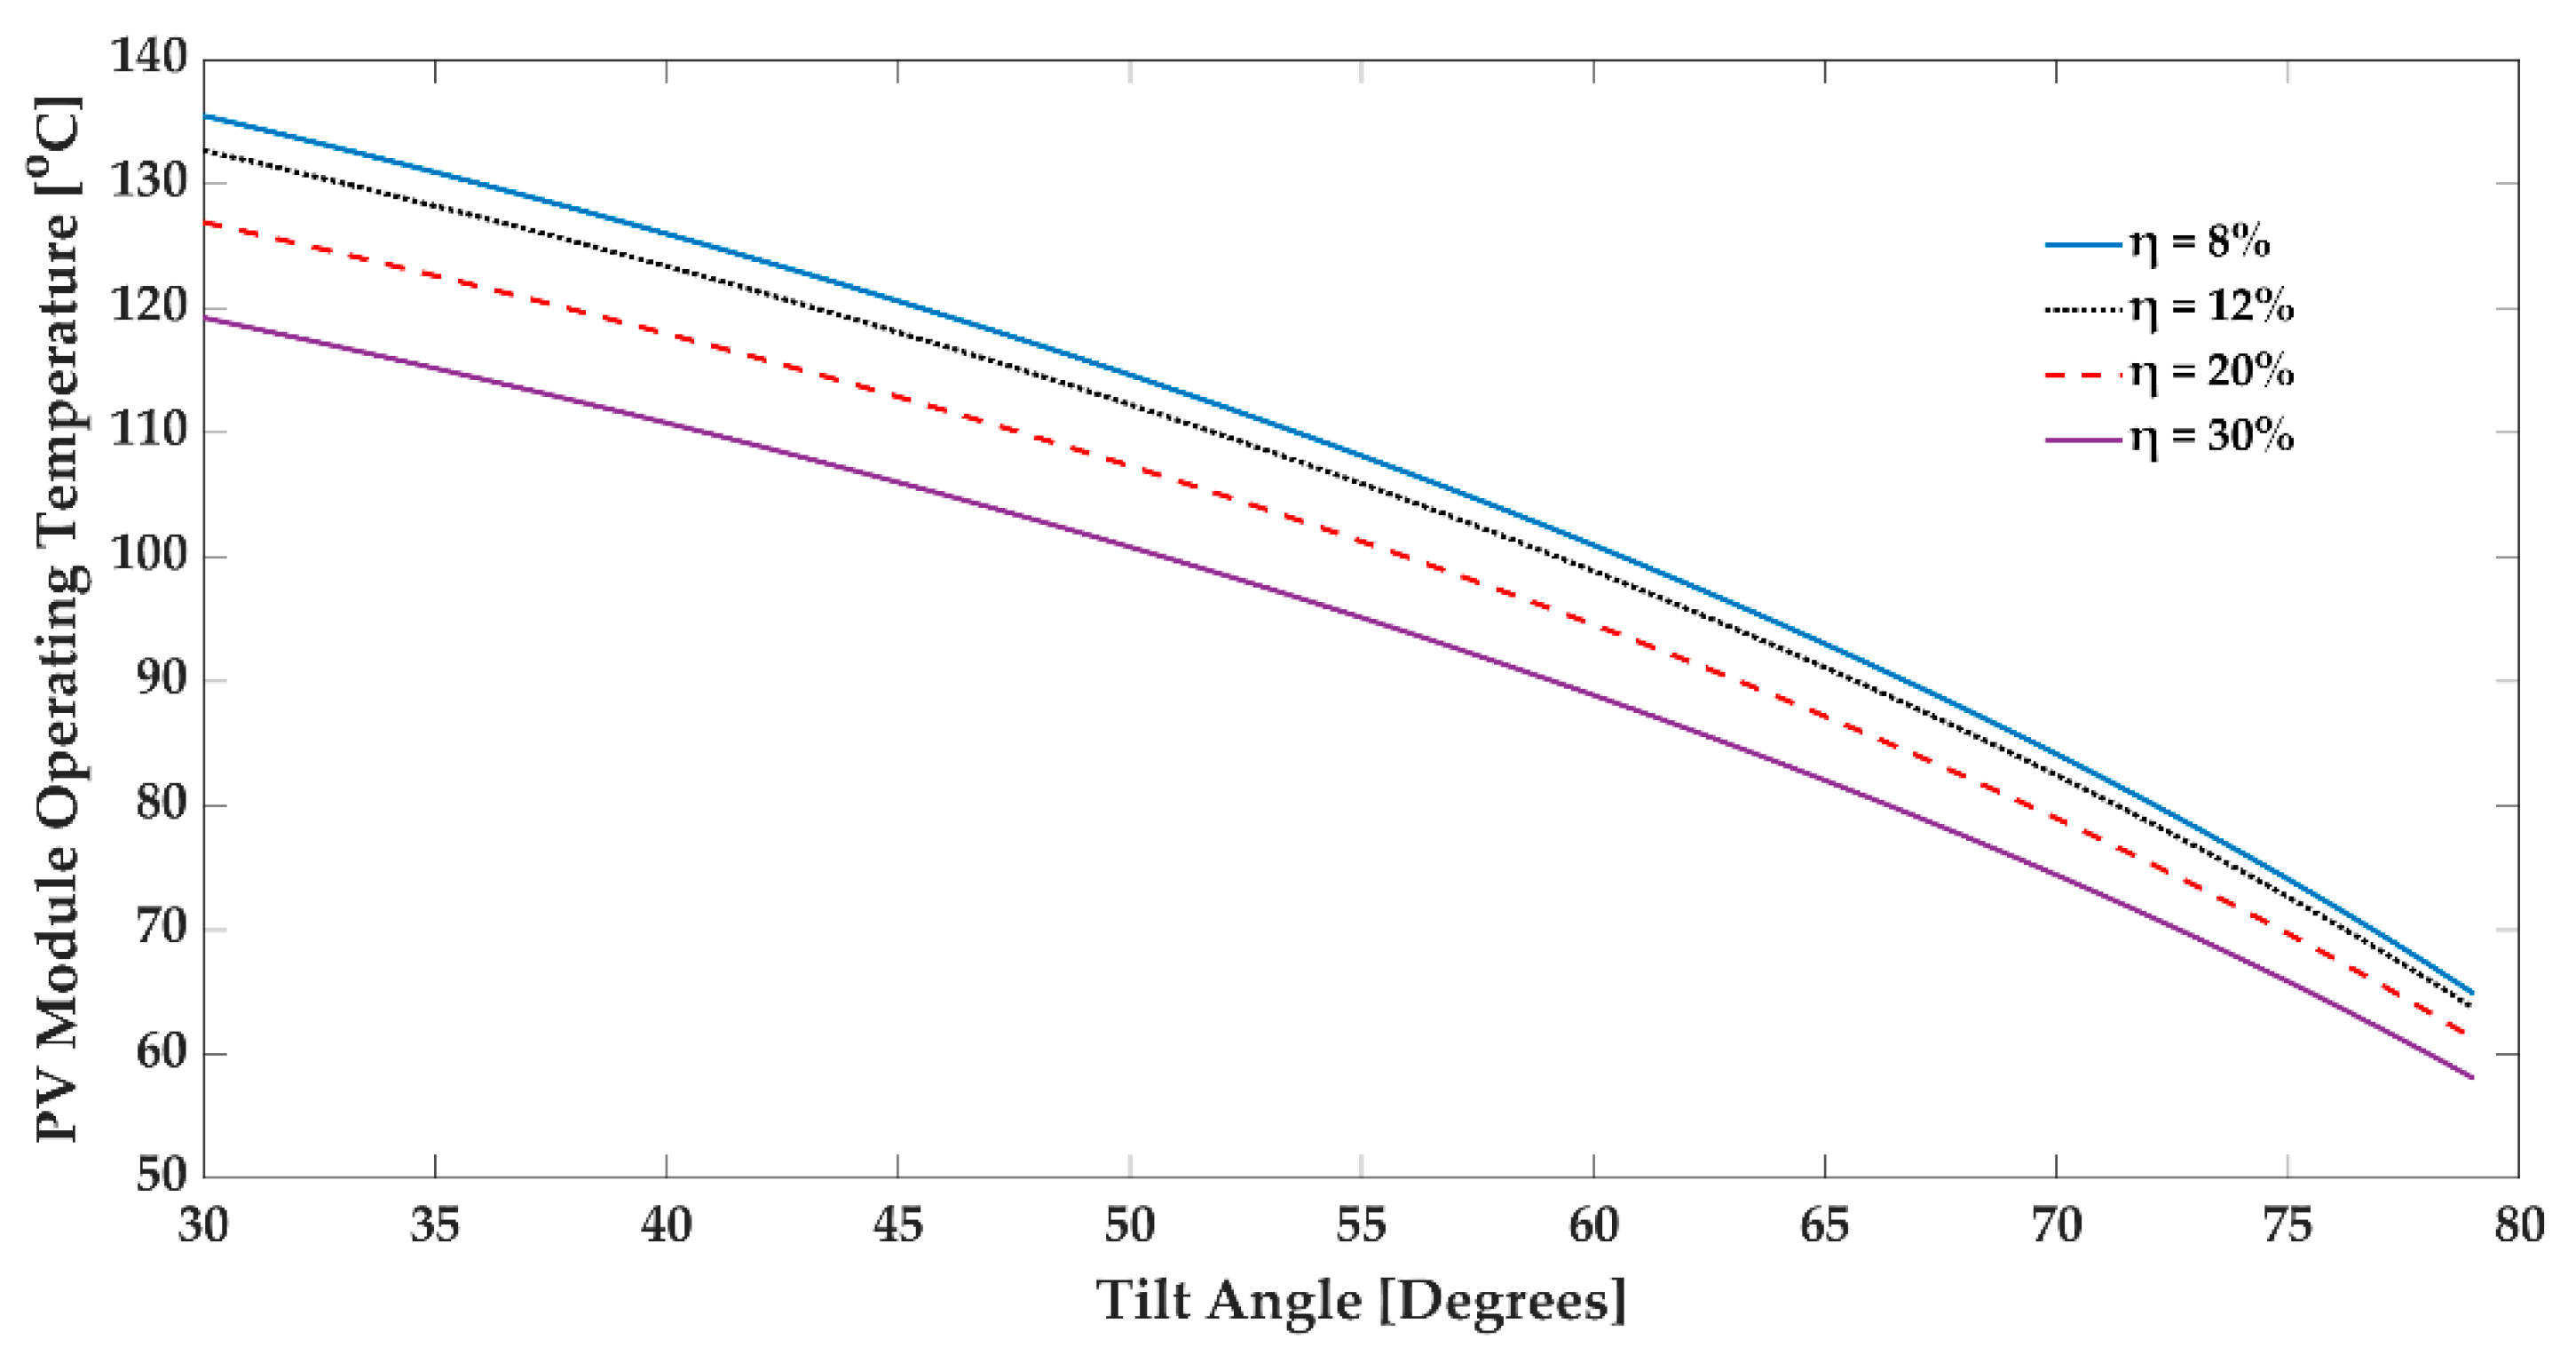
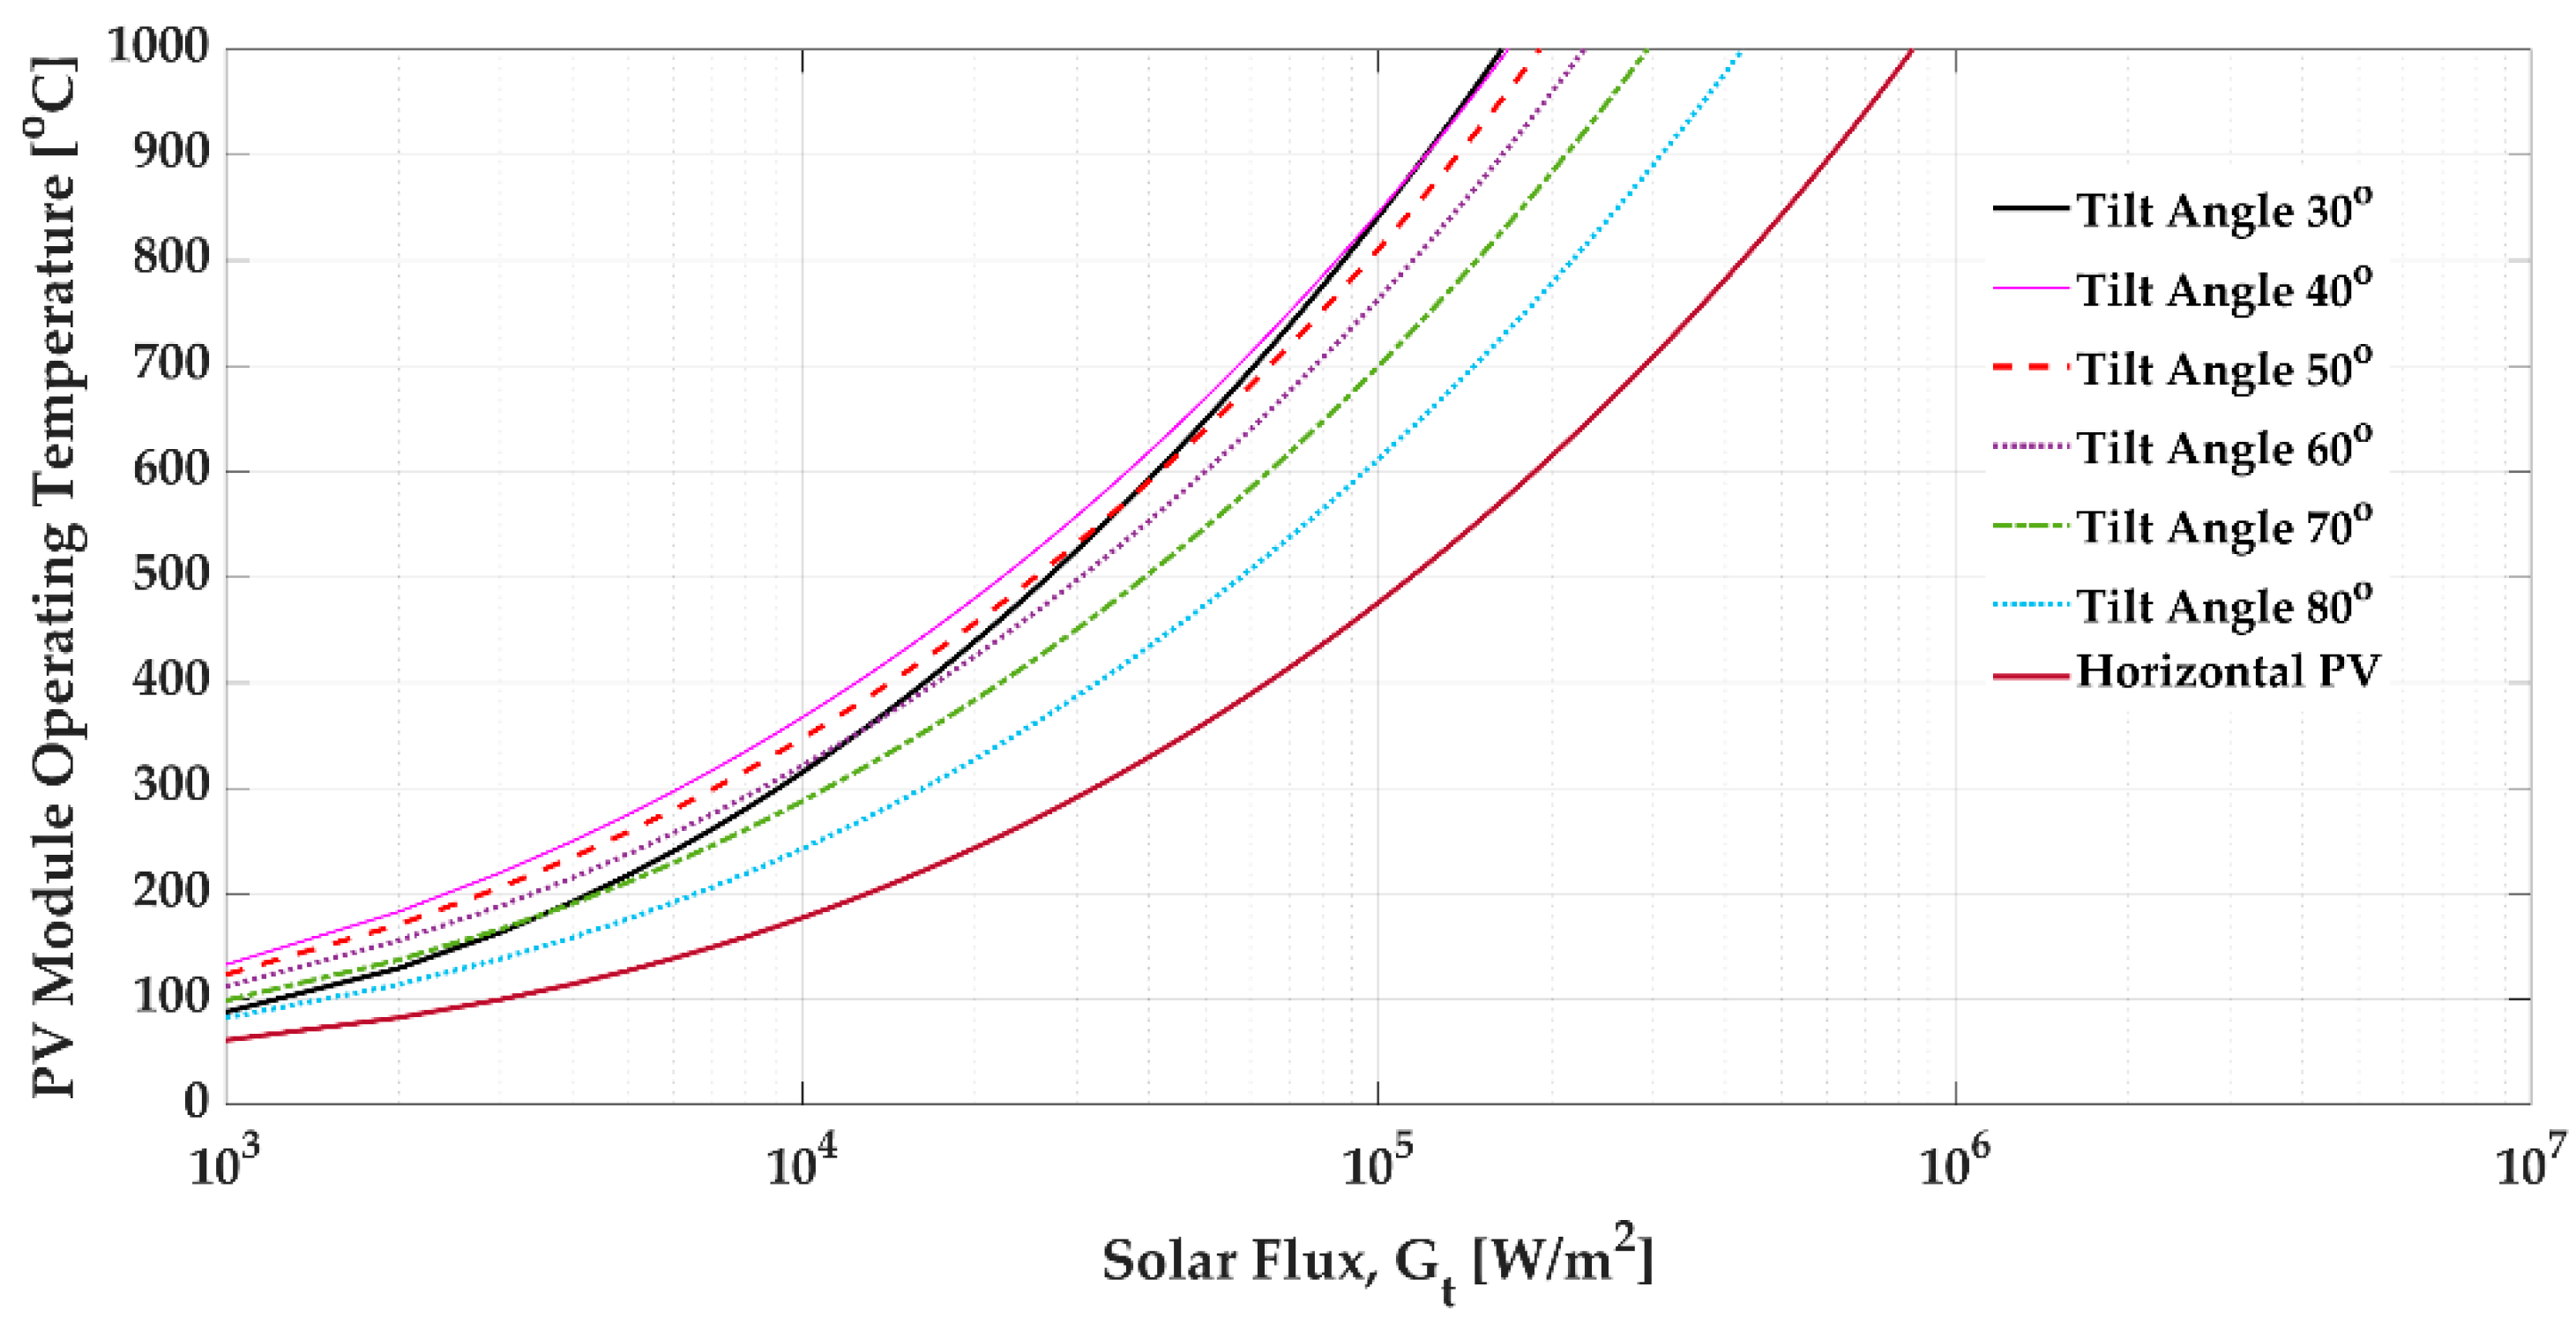
3.4. PV Module Tilt Angle and Temperature

The results in Figure 9 represent the PV module temperature variation vs. the solar flux gained. It is well known that when a PV module receives intensive solar fluxes, the operating temperature increases. This figure shows that the flat PV module has a smaller increase in temperature than the inclined PV module. On the other hand, between the diagonal PV panels with various tilt angles, a PV panel with a tilt angle of θ = 30 ° has a sharper increase in temperature than different tilt angles. In the literature, for solar fluxes perpendicular to a flat PV module, the optimum tilt angle ranges between 28 and 32 ° [2,26,27,28,29], which matches this θ = 30 ° at a hotter temperature. Hence, there is a higher absorbed energy.

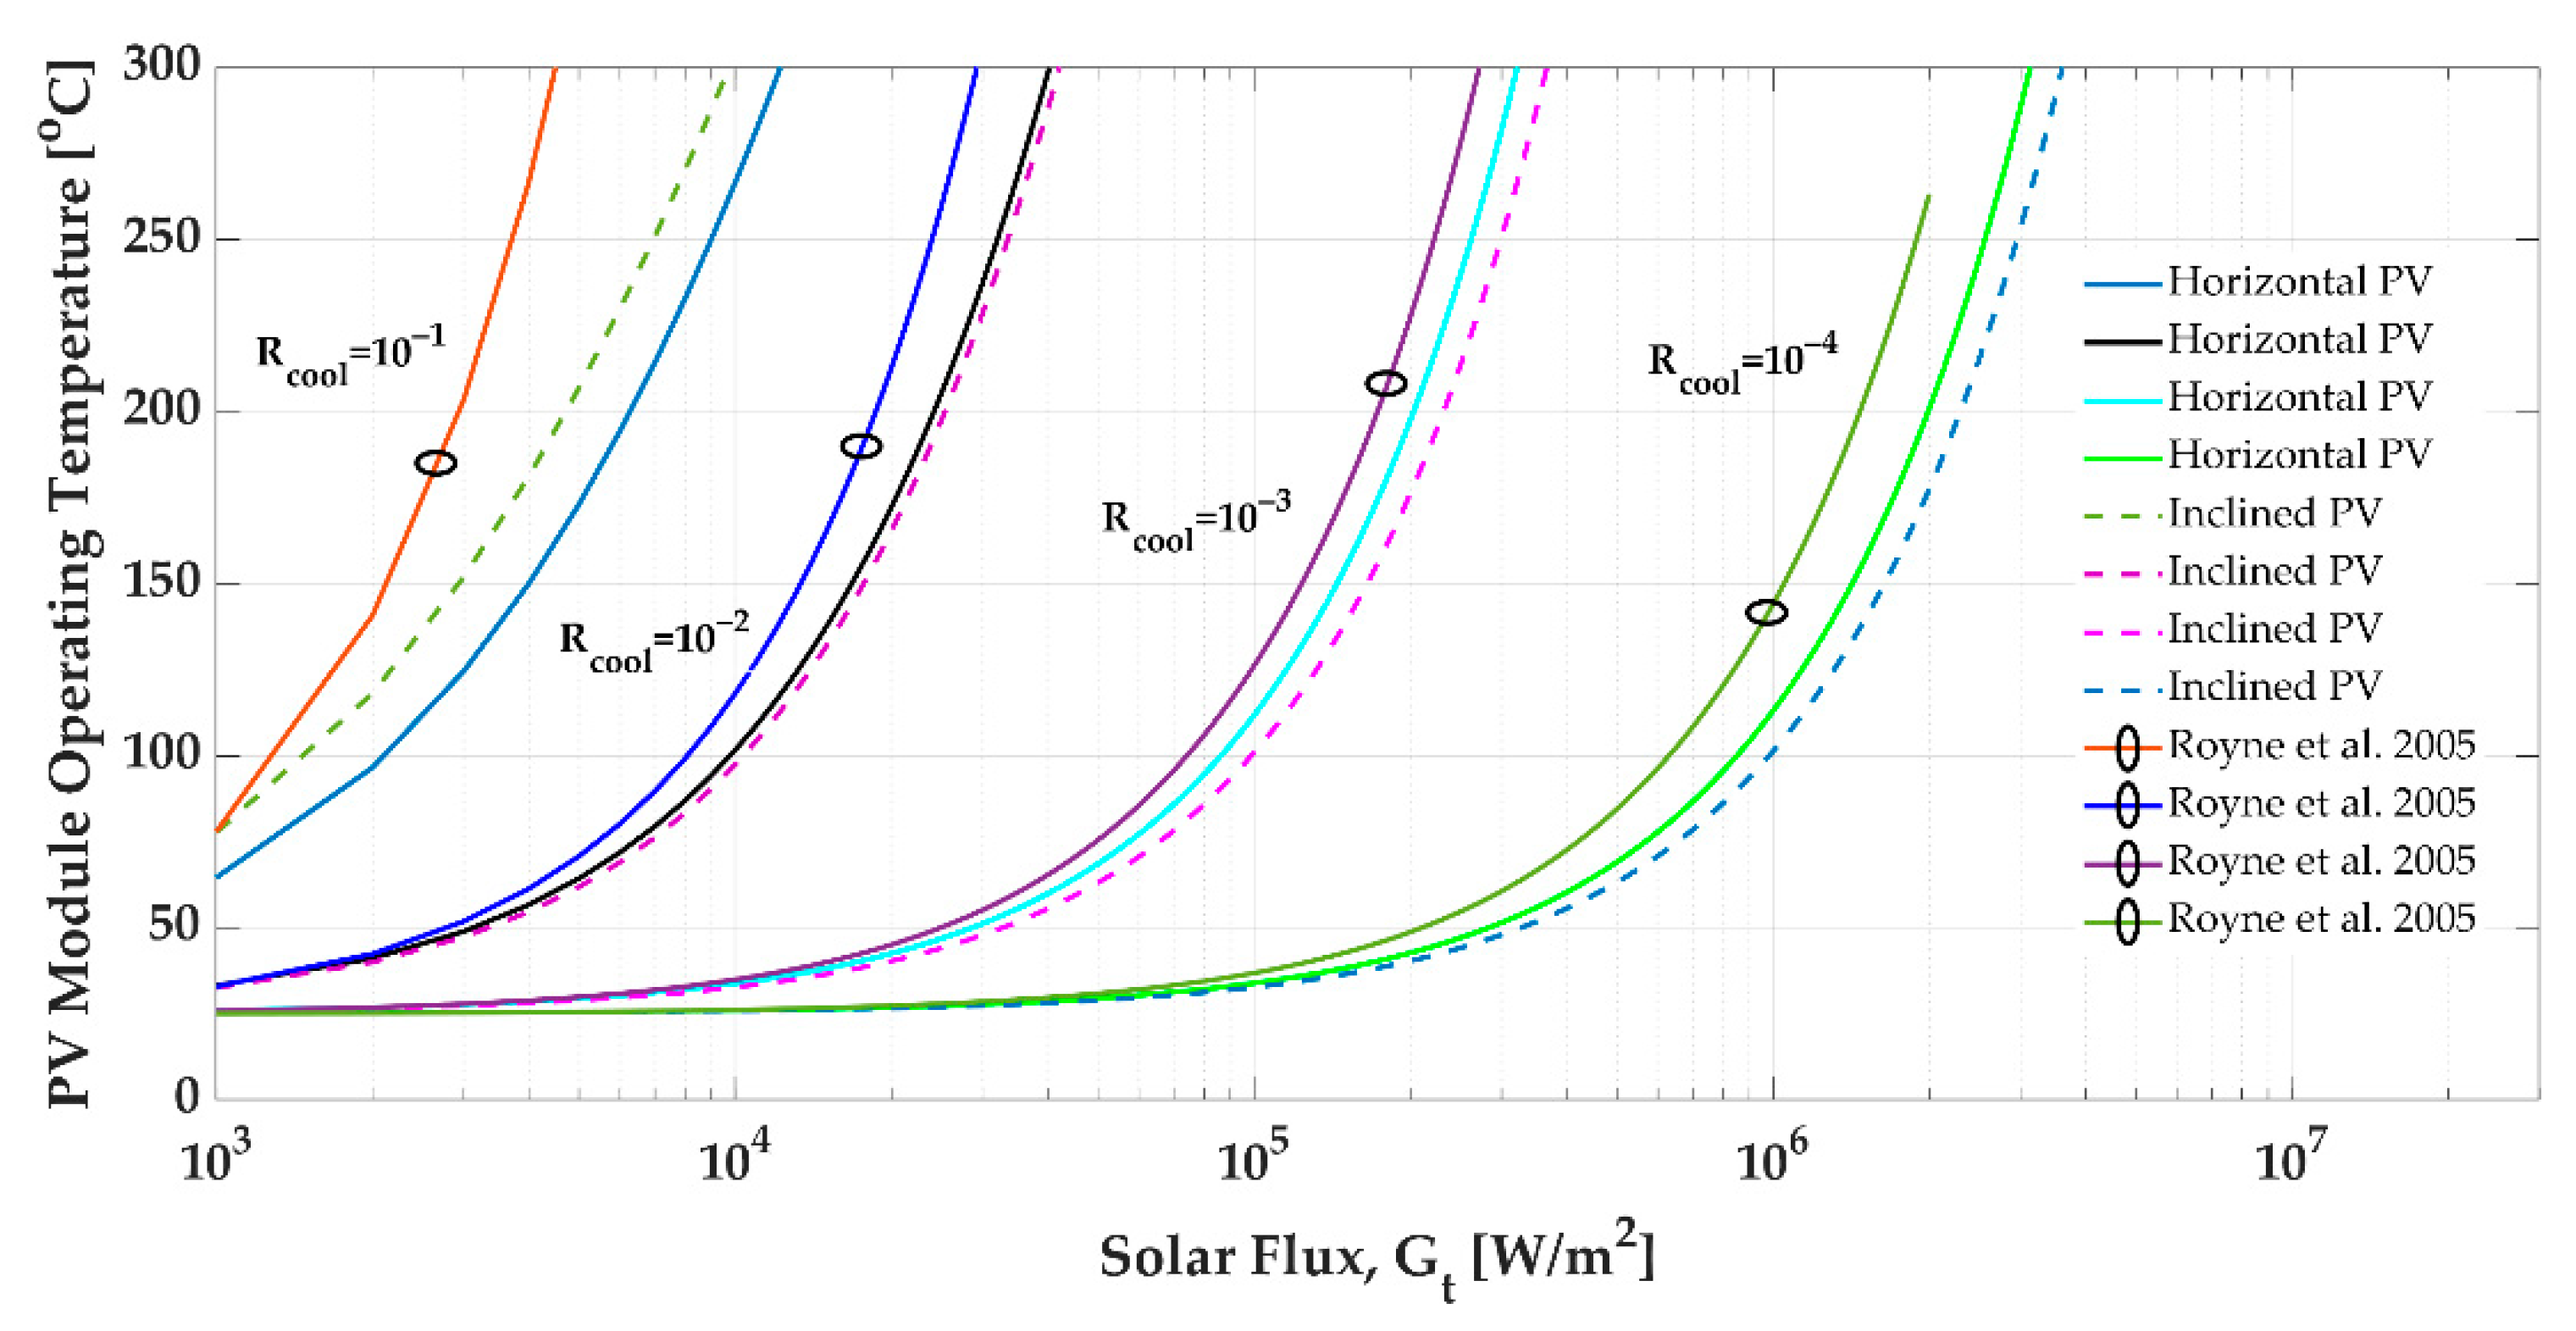
3.5. PV Module Temperature and Cooling Systems

The spate of studies consider a cooling system to control the PV panel operating temperature to maintain optimum efficiency [31]. Cooling system effects are added to the proposed equation to evaluate the model and to observe the operating temperature variation. Figure 10 illustrates that a higher cooling system will keep the PV module temperature constant for a wide range of solar flux and will provide appropriate efficiency. On the other hand, this model’s result significantly matches the literature of experimental studies’ cooling systems and represents a similar curve [31].
Additionally, in Figure 10, the inclined PV module increases the temperature more dramatically than does the horizontal PV panel [31].

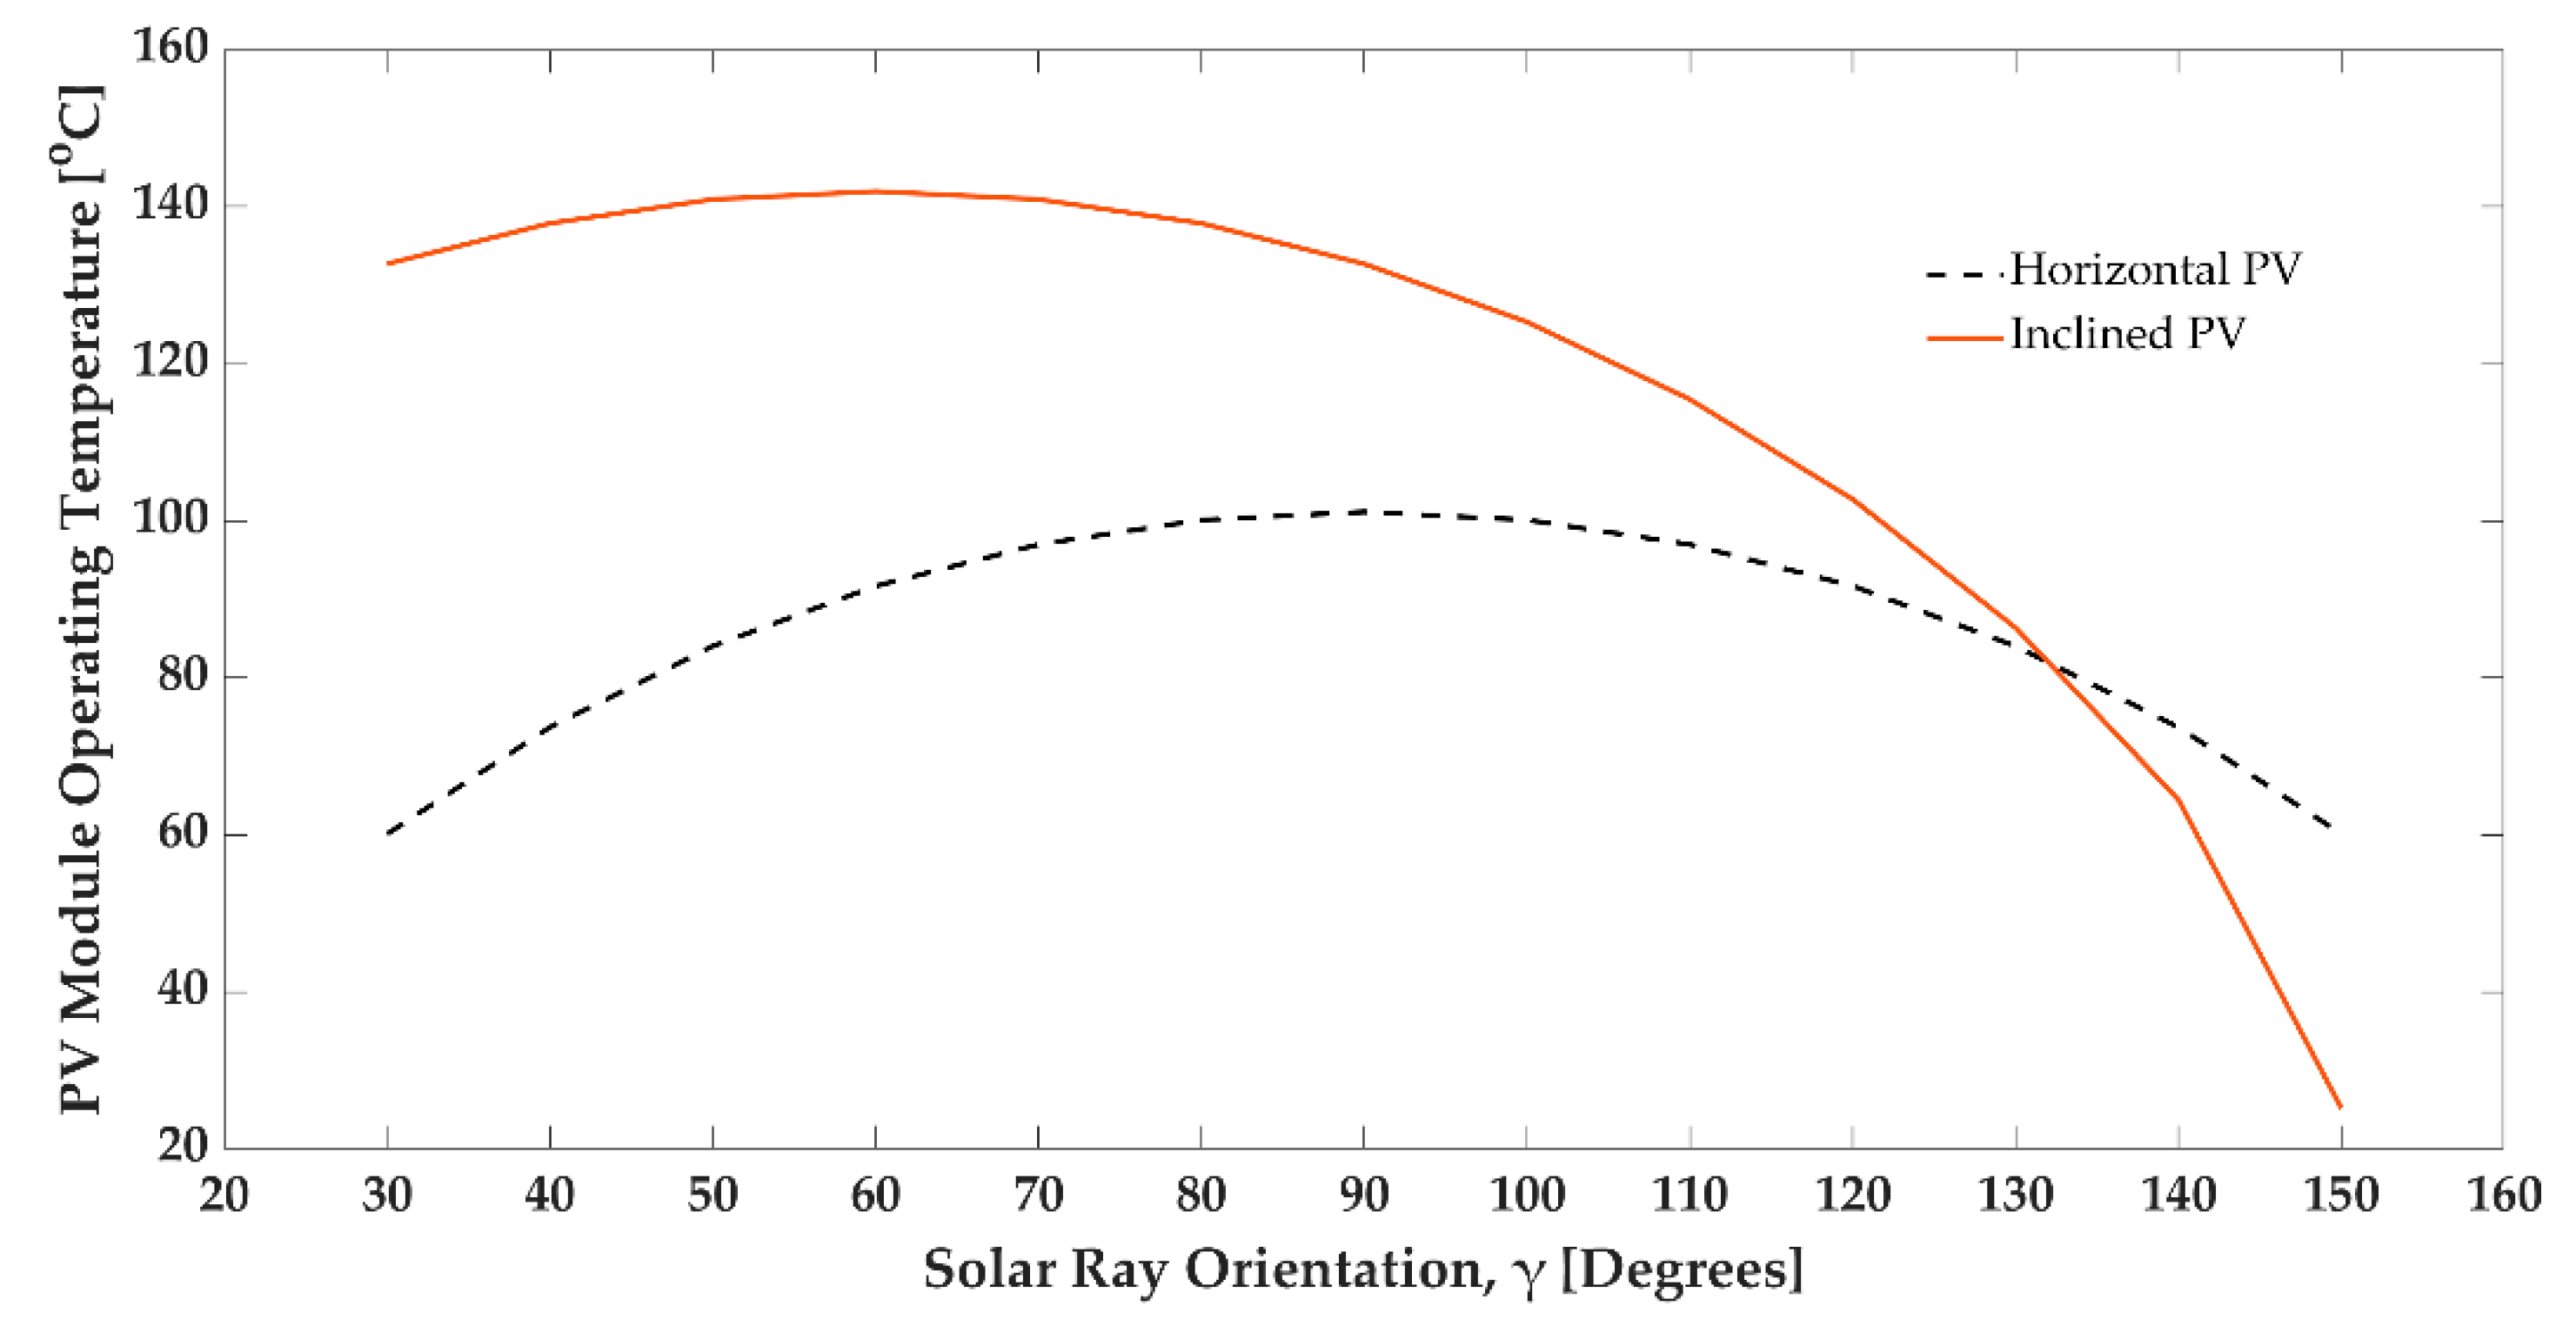
3.6. Solar Orientation and PV Module Temperature

As mentioned in Section 2.3, the Sun’s orientation changes during the daytime, resulting in different solar fluxes gained by the PV panel. Figure 11 represents the PV panel temperature vs. solar ray orientation with the following assumptions: a constant solar flux, Gt = 1000 W/m2, η = 12 % , an inclined PV module with a tilt angle θ = 30 ° , and a flat PV panel. This flat PV module assumes a solar angle of incidence changing from 30° to 150° with respect to ground level. The PV module temperature increases to the maximum temperature at noon and then drops. The curve is symmetric to the noon assumed angle, γ = 90 ° , because, in this assessment, the ambient temperature is constant, and cloudy skies, pollutants, and humidity are not considered.
From the inclined PV module curve, two issues are considered. First, the PV tilt angle is θ = 30 ° and, at γ = 60 ° , the solar angle of incidence will be perpendicular; therefore, maximum solar flux is gained. Second, because of the tilt angle at θ = 30 ° and γ = 60 ° , the Sun’s rays will pass the PV module’s front face and radiate the solar flux on the back face, which is isolated and does not gain flux. Hence, after γ = 150 ° , the PV module temperature is equal to ambient temperature because it does not receive any solar flux. On the other hand, in most of the daytime, the inclined panel becomes hotter than the flat PV panel, and only after γ = 135 ° does it become colder than a flat PV module.
To assess the solar ray orientation from the equation, we employed recorded data for solar flux on a horizontal PV module installed at Tehran’s meteorological station. Data from 4 days’ recordings of PV module temperature and solar flux gained by the PV panel were obtained from 7 a.m. to 7 p.m. daily, as presented in Figure 12. For recorded data in open air, we must account for parameters not considered in our proposed model:
-
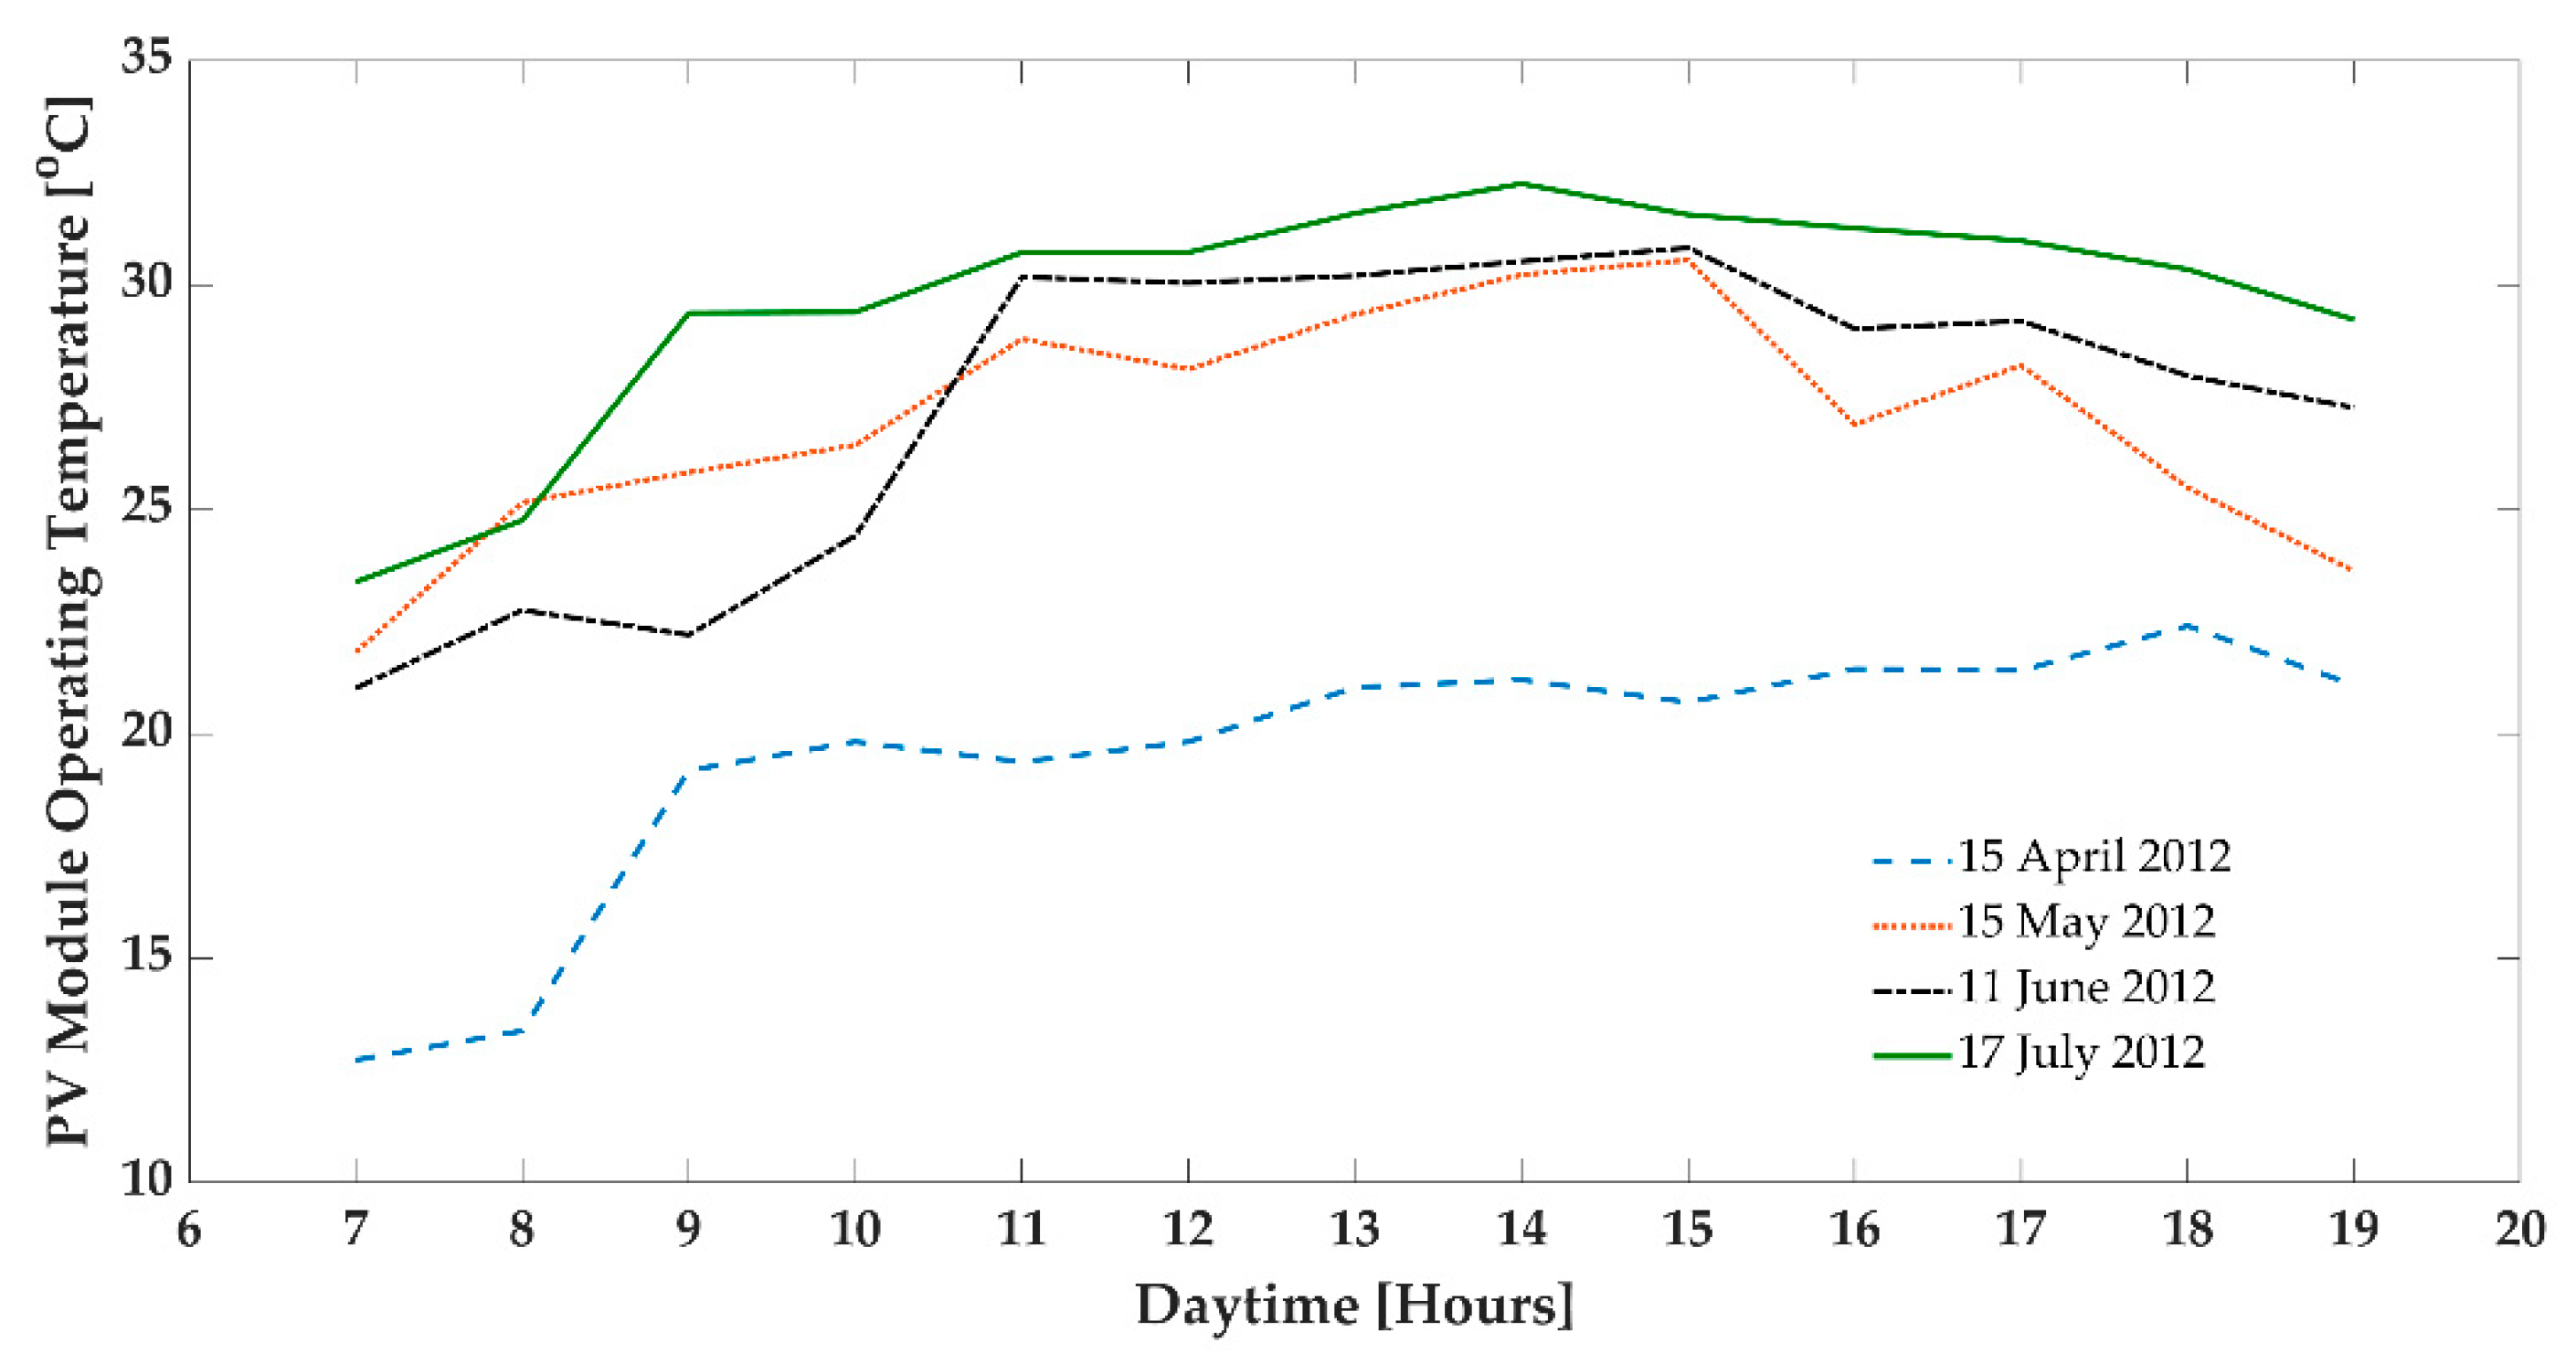
The ambient temperature is not constant, and it changes during the daytime.
-
The sky can sometimes be cloudy, causing changes to the solar flux.
-
Humidity changes cause differences in temperature.
-
For wind speeds > 5 m/s, forced convection can occur, affecting PV module temperature.
-
Air pollution can affect heat transfer.
Note that the ambient temperature and solar flux in our solution differ from the recorded data. Notably, we did not expect to see similar PV module temperatures. However, Figure 12 shows that the curves of PV module temperatures during the daytime for all 4 days have similar patterns as the proposed model. From the morning until noon, the temperature increased; then, the temperature dropped in the afternoon. The proposed model has a uniform curve, but for the recorded data, because there were additional parameters not accounted for in our numerical model, the real data were not completely uniform and had sharp changes. The reason for the sharp changes has not been fully resolved, but could be caused by a few measurement data points (e.g., the interval of measurement points was large).
Figure 13 represents the recorded data comparison to the output that has been calculated with the proposed model for similar conditions. Mamun et al. [67] have reported the experiment for the PV module. This study used the PV module properties and condition information as the input in the proposed model to see how the model can predict the PV module temperature and evaluate the model. It must be noticed that the air properties change with the ambient temperature. Additionally, the panel efficiency is reduced when the module temperature is increased. There was no information about the wind and how it could affect the temperature. Therefore, in the model calculation, the parameters listed here and previously for Figure 12 have been assumed to be constant, and they could be the main reasons for the distinction between the model calculation and the recorded data.

4. Discussion

Many studies have considered the PV panel operating temperature’s relationship to the PV module efficiency via empirical approaches and specific conditions with correction coefficients. Among many proposed equations in the literature, there is no universal equation for PV modules using the heat transfer concept to investigate PV module performance, including the consideration of environmental parameters and PV module setup simultaneously. This study has employed heat transfer fundamentals in the steady-state energy balance equation for the PV module, considering the relationship between PV module operation impact and environmental parameters to determine their relationships.
The proposed equation employs free convective heat transfer, h, defined for two categories: an inclined flat PV module and a horizontal flat PV module (Figure 3, Figure 4 and Figure 5). The explained convective heat transfer meets the Rayleigh number condition [2,26,27,28,29,62,63,64,65,66,67] and, analytically, appears to be the reason for increased energy loss by the horizontal panel compared to a diagonal panel. Secondly, the equation determines the PV module temperature and efficiency correlation linearly (Figure 6 and Figure 7), which corresponds to the empirical reports [3,16,31,67]. It is well known that there is no unique linear relationship for PV module efficiency and temperature because it is a function of the environmental characterizations and PV module setup, the relation of which is shown in the suggested equations. Moreover, the efficiency depends upon the PV module material properties. The proposed equations indicate the efficiency correlation with solar flux (Figure 6 and Figure 9), which is a significant analytical consequence, and this effect has been reported in the literature [9,10,11,12,13,14,15,16,17,18,19,20,21,22].
The tilt angle effects, such as PV module setup, are considered in the equations, and the represented results correspond to the literature (Figure 8 and Figure 9). It clearly displays the optimal tilt angle concept in heat transfer and how it increases energy absorption and efficiency [2,26,27,28,29,67].
The suggested equation was evaluated with an analogous cooling system added from the literature [1]. It significantly matches the previous studies obtained from empirical works (Figure 10).
Solar ray direction, which changes during daytime and causes a direct effect on the PV module temperature, is considered in the equation. The daytime changing pattern for PV module temperature via the equation significantly matches the recorded site data concerning the daytime hours shown in Figure 11, Figure 12 and Figure 13.

5. Conclusions

This study aimed to determine PV module temperature and its relationship to environmental parameters and PV properties via heat transfer concepts. The proposed equation is provided in an implicit numerical scheme. Its evaluation shows strength and reliability according to previous empirical studies. This equation can be used to estimate a wide range of operating conditions. The results of this new equation can be listed as follows:
-
The proposed equation has an implicit scheme that determines the environmental and operational characterizations of PV modules.
-
PV module efficiency is a linear function of PV module temperature, and it depends on the solar flux.
-
The PV panel temperature changes with tilt angle.
-
The PV module temperature depends on the solar angle of incidence.
-
The inclined PV module becomes hotter than a flat PV panel owing to convection heat transfer, assuming no forced convection and no conduction vis-a-vis a cooling system with a non-isolated backside PV module.
-
The optimum operating condition is available with an inclined PV module, and the flat panel has minimum energy generation.

Author Contributions

R.H. contributed with the conceptualization, method, software, data analysis, and writing—original draft preparation. M.R. contributed with writing—review and editing, and supervision. A.H. contributed with review and editing. N.Y. contributed data, resources, method, visualization, writing—review and editing. R.U. contributed with the review. All authors have read and agreed to the published version of the manuscript.

Funding

This work was performed in the Center of Excellence (CoE) Research on AI and Simulation-Based Engineering at Exascale (RAISE) and the EuroCC projects receiving funding from EU’s Horizon 2020 Research and Innovation Framework Programme under the grant agreement no. 951733 and no. 951740, respectively.

Institutional Review Board Statement

Not applicable.

Informed Consent Statement

Not applicable.

Data Availability Statement

Not applicable.

Conflicts of Interest

The authors declare no conflict of interest.

References

  1. Kamuyu, W.C.L.; Lim, J.R.; Won, C.S.; Ahn, H.K. Prediction Model of Photovoltaic Module Temperature for Power Performance of Floating PVs. Energies 2018, 11, 447. [Google Scholar] [CrossRef] [Green Version]
  2. Hassanian, R.; Riedel, M.; Yeganeh, N.; Unnthorsson, R. A Practical Approach for Estimating the Optimum Tilt Angle of a Photovoltaic Panel for a Long Period—Experimental Recorded Data. Solar 2021, 1, 5. [Google Scholar] [CrossRef]
  3. Mbewe, D.J.; Card, H.C.; Card, D.C. A model of silicon solar cells for concentrator photovoltaic and photovoltaicthermal system design. Sol. Energy 1985, 35, 247–258. [Google Scholar] [CrossRef]
  4. Dalal, V.L.; Moore, A.R. Design considerations for high-intensity solar cells. J. Appl. Phys. 1977, 48, 1244–1251. [Google Scholar] [CrossRef]
  5. Luque, A.; Sala, G.; Arboiro, J.C. Electric and thermal model for non-uniformly illuminated concentration cells. Sol. Energy Mater. Sol. Cells 1998, 51, 269–290. [Google Scholar] [CrossRef]
  6. SunPower. Application Notes for HED312 Silicon Concentrator Solar Cell; Sunpower: San Jose, CA, USA, 2002. [Google Scholar]
  7. Horne, W.E. Solar Energy System. US Patent US5269851, 14 December 1993. [Google Scholar]
  8. Anton, I.; Sala, G.; Pachon, D. Correction of the Voc vs. temperature dependence under non-uniform concentrated illumination. In Proceedings of the 17th European Photovoltaic Solar Energy Conference, Munich, Germany, 22–26 October 2001; pp. 156–159. [Google Scholar]
  9. Mathur, R.K.; Mehrotra, D.R.; Mittal, S.; Dhariwal, S.R. Thermal non-uniformities in concentrator solar cells. Sol. Cells 1984, 11, 175–188. [Google Scholar] [CrossRef]
  10. Sanderson, R.W.; Odonnel, D.T.; Backus, C.E. The effects of nonuniform illumination and temperature profiles on silicon solar cells under concentrated sunlight. In Proceedings of the 14th IEEE PVSC, San Diego, CA, USA, 7–10 January 1980; pp. 431–436. [Google Scholar]
  11. Chenlo, F.; Cid, M. A linear concentrator photovoltaic module: Analysis of non-uniform illumination and temperature effects on efficiency. Sol. Cells 1987, 20, 27–39. [Google Scholar] [CrossRef]
  12. Dinesh, S.B.; Sunil, V.P.; Jayashree, G. Performance Evaluation of Photovoltaic Solar Panel Using Thermoelectric cooling. Int. J. Eng. Res. 2014, 3, 536–539. [Google Scholar]
  13. Amelia, A.R.; Irwan, Y.M.; Leow, W.Z.; Irwanto, M.; Safwati, I.; Zhafarina, M. Investigation of the Effect Temperature on Photovoltaic (PV) Panel Output Performance. Int. J. Adv. Sci. Eng. Inf. Technol. 2016, 6, 682–688. [Google Scholar]
  14. Thong, L.W.; Murugan, S.; Ng, P.K.; Sun, C.C. Analysis of Photovoltaic Panel Temperature Effects on Its Efficiency. In Proceedings of the 2nd International Conference on Electrical Engineering and Electronics Communication System, Ho Chi Minh, Vietnam, 18–19 November 2016. [Google Scholar]
  15. Skoplaki, E.; Palyvos, J.A. Operating temperature of photovoltaic modules: A survey of pertinent correlations. Renew. Energy 2009, 34, 23–29. [Google Scholar] [CrossRef]
  16. Duffie, J.A.; Beckman, W.A. Solar Engineering of Thermal Processes; Wiley: New York, NY, USA, 2006. [Google Scholar]
  17. Ross, R. Interface design Considerations for terrestrial solar cell modules. In Proceedings of the 12th IEEE Photovoltaic Specialists Conference, Baton Rouge, LA, USA; 1976; pp. 801–806. [Google Scholar]
  18. Buresch, M. Photovoltaic Energy Systems; McGraw-Hill: New York, NY, USA, 1983. [Google Scholar]
  19. Nordmann, T.C.L. Understanding temperature effects on PV system performance. In Proceedings of the 3rd World Conference On Photovoltaic Energy Conversion, Osaka, Japan, 11–18 May 2003. [Google Scholar]
  20. Markvart, T. Solar Electricity; Wiley: Chichester, UK, 2000. [Google Scholar]
  21. Bloem, J. Evaluation of a PV-integrated building application in a well wellcontrolled. Build. Environ. 2008, 43, 205–216. [Google Scholar] [CrossRef]
  22. Whitaker, C.; Wrasman, B.; Risser, V. Photovoltaic array thermal behaviour. In Proceedings of the 6th E.C. Photovoltaic Solar Energy Conference, London, UK, 15–19 April 1985. [Google Scholar]
  23. Stultz, J.; Wen, L. Thermal Performance Testing and Analysis of Photovoltaic Modules in Natural Sunlight. DOE/JPL LSA Task Report 5101-31; Jet Propulsion Laboratory, California Institute of Technology: Pasadena, CA, USA, 1977. [Google Scholar]
  24. ASTM. Method for Determining the Nominal Operating Cell Temperature (NOCT) of An Array or Module. E1036M, Annex A.1, in ASTM; ASTM International: West Conshohocken, PA, USA, 1999; p. 544. [Google Scholar]
  25. Palyvos, J. A survey of wind convection coefficient correlations for building envelope energy systems, modeling. Appl. Therm. Eng. 2009, 28, 801–808. [Google Scholar] [CrossRef]
  26. Gopinathan, K.K. Optimization of tilt angle of solar collector for maximum irradiation on sloping surfaces. Sol. Energy 1991, 10, 51–61. [Google Scholar] [CrossRef]
  27. Khalil, A.; Alnajjar, A. Experimental and theoretical investigation of global and diffuse solar radiation in the United Arab Emirates. Renew. Energy 1995, 6, 537–543. [Google Scholar] [CrossRef]
  28. Lave, M.; Kleissl, J. Optimum fixed orientations and benefits of tracking for capturing solar radiation in the continental United States. Renew. Energy 2011, 36, 1145–1152. [Google Scholar] [CrossRef] [Green Version]
  29. Tamimi, A. Modeling of optimum inclination angles of solar systems for Amman, Jordan. J. Renew. Sustain. Energy 2011, 3, 43109. [Google Scholar] [CrossRef]
  30. Dhouib, A.; Filali, S. Operating temperatures of photovoltaic panels. Energy Environ. 1990, 1, 494–498. [Google Scholar]
  31. Anja, R.; Christopher, J.D.; Mills, D.R. Cooling of photovoltaic cells under concentrated illumination: A critical review. Sol. Energy Mater. Sol. Cells 2005, 86, 451–483. [Google Scholar]
  32. Yunus, C.; Afshin, G. Heat and Mass Transfer: Fundamentals and Applications, 6th ed.; McGraw-Hill Education: New York, NY, USA, 2019. [Google Scholar]
  33. Frank, P.I.; David, P.D.T.L.B.; Adrienne, S.L. Fundamentals of Heat and Mass Transfer; John Wiley & Sons: New York, NY, USA, 2006. [Google Scholar]
  34. Jack, H. Heat Transfer; McGraw-Hill Education: New York, NY, USA, 2009. [Google Scholar]
  35. Ozisik, M. Necati. Heat Transfer: A Basic Approach; McGraw-Hill College: New York, NY, USA, 1984. [Google Scholar]
  36. Luque, A. Solar Cells and Optics for Photovoltaic Concentration; Hilger, A., Ed.; Philadelphia: Bristol, UK, 1989. [Google Scholar]
  37. Wen, L. An Investigation of the Effect of Wind Cooling on Photovoltaic Arrays, JPL Internal Report No. 5101-201; Jet Propulsion Laboratory: Pasadena, CA, USA, 1982. [Google Scholar]
  38. McAdams, W.H. Heat Transmission, 3rd ed.; McGraw-Hill Book Co., Inc.: New York, NY, USA, 1954. [Google Scholar]
  39. Veldhuis, J.; Nobre, A.; Reindl, T.; Rüther, R.; Reinders, A.H.M.E. The influence of wind on the temperature of PV modules in tropical environments, evaluated on an hourly basis. In Proceedings of the 2013 IEEE 39th Photovoltaic Specialists Conference (PVSC), Tampa, FL, USA, 16–21 June 2013; pp. 824–829. [Google Scholar]
  40. Ali, M.; Iqbal, M.H.; Sheikh, N.A.; Hafiz, M.; Ali, M.; Manzoor, S.; Khan, M.M.; Tamrin, K.F. Performance Investigation of Air Velocity Effects on PV Modules under Controlled Conditions. Int. J. Photoenergy 2017, 2017, 3829671. [Google Scholar] [CrossRef]
  41. Giuseppina, C.; Valerio, L.B.; Vincenzo, F.; Marco, T. Assessment of the Operating Temperature of Crystalline PV Modules Based on Real Use Conditions. Int. J. Photoenergy 2014, 2014, 718315. [Google Scholar]
  42. Burak, V.S.; Volkov, S.V.; Martynenko, O.G.; KhramtsovI, P.P.; Shikh, A. Free-convective heat transfer on a vertical surface with heat-flux discontinuity. Int. J. Heat Mass Transf. 1995, 38, 155–161. [Google Scholar] [CrossRef]
  43. Zariffeh, M.D.E.K. Laminar free convection on an inclined flat plate or a vertical cylinder with prescribed wall heat flux. Int. J. Heat Mass Transf. 1981, 24, 1071–1075. [Google Scholar] [CrossRef]
  44. Hassan, K.-E.; Mohamed, S. Natural convection from isothermal flat surfaces. Int. J. Heat Mass Transf. 1970, 13, 1873–1886. [Google Scholar] [CrossRef]
  45. Husar, R.; Sparrow, E. Patterns of free convection flow adjacent to horizontal heated surfaces. Int. J. Heat Mass Transf. 1968, 11, 1206–1208. [Google Scholar] [CrossRef]
  46. Lewandowski, W.; Kubski, P.; Khubeiz, J. Natural convection heat transfer from round horizontal plate. Wärme-Und Stoffübertrag. 1992, 27, 281–287. [Google Scholar] [CrossRef]
  47. Rotem, Z.; Claassen, L. Natural convection above unconfined horizontal surfaces. J. Fluid Mech. 1969, 38, 173–192. [Google Scholar] [CrossRef]
  48. Pera, L.; Gebhart, B. Natural convection flows adjacent to horizontal surfaces resulting from the combined buoyancy effects of thermal and mass diffusion. Int. J. Heat Mass Transf. 1972, 15, 269–278. [Google Scholar] [CrossRef]
  49. Pera, L.; Gebhart, B. Natural convection boundary layer flow over horizontal and slightly inclined surfaces. Int J. Heat Mass Transf. 1973, 16, 1131–1146. [Google Scholar] [CrossRef]
  50. Fujii, T.; Imura, H. Natural-convection heat transfer from a plate with arbitrary inclination. Int J. Heat Mass Transf 1972, 15, 755–767. [Google Scholar] [CrossRef]
  51. Tetsu, F.; Hiroshi, H.; Itsuki, M. A theoretical study of natural convection heat transfer from downward-facing horizontal surfaces with uniform heat flux. Int. J. Heat Mass Transf. 1973, 16, 611–627. [Google Scholar] [CrossRef]
  52. Lewandowski, W.; Radziemska, E.; Buzuk, M.; Bieszk, H. Free convection heat transfer and fluid flow above horizontal rectangular plates. Appl. Energy 2000, 66, 177–197. [Google Scholar] [CrossRef]
  53. Pretot, S.; Zeghmati, B.; Le, P.G. Theoretical and experimental study of natural convection on a horizontal plate. Appl. Energy 2000, 20, 873–891. [Google Scholar] [CrossRef]
  54. Martorell, I.; Herrero, J.; Grau, F. Natural convection from narrow horizontal plates at moderate Rayleigh numbers. Int. J. Heat Mass. Transf. 2003, 46, 2389–2402. [Google Scholar] [CrossRef]
  55. Kozanoglu, B.; Lopez, J. Thermal boundary layer and the characteristic length on natural convection over a horizontal plate. Heat Mass Transf. 2007, 43, 333–339. [Google Scholar] [CrossRef]
  56. Lloyd, J.; Moran, W. Natural convection adjacent to horizontal surface of various planforms. J. Heat Transf 1974, 96, 443–447. [Google Scholar] [CrossRef]
  57. Al-Arabi, M.; El-Riedy, M. Natural convection heat transfer from isothermal horizontal plates of different shapes. Int. J. Heat Mass Transf. 1976, 19, 1399–1404. [Google Scholar] [CrossRef]
  58. Kitamura, K.; Kimura, F. Heat transfer and fluid flow of natural convection adjacent to upward-facing horizontal plates. Int. J. Heat Mass Transf. 1995, 38, 3149–3159. [Google Scholar] [CrossRef]
  59. Kitamura, K.; Kimura, F. Fluid flow and heat transfer of natural convection over upward-facing, horizontal heated circular disks. Heat Transf.-Asian Res. 2008, 37, 339–351. [Google Scholar] [CrossRef]
  60. Wragg, A.; Loomba, R. Free convection flow patterns at horizontal surfaces with ionic mass transfer. Int. J. Heat Mass Transf. 1970, 13, 439–442. [Google Scholar] [CrossRef]
  61. Yousef, W.; Tarasuk, J.; McKeen, W. Free convection heat transfer from upward-facing isothermal horizontal surfaces. J. Heat Transf. 1982, 104, 493–500. [Google Scholar] [CrossRef]
  62. Chang, T.P. Study on the optimal tilt angle of solar collector according to different. Int. J. Appl. Sci. Eng. 2008, 6, 151–161. [Google Scholar]
  63. Assi, A.; Jama, M. Estimation of solar radiation using sun hours in the Emirate of Abu Dhabi—UAE. In Proceedings of the 11th World Renewable Energy Congress, Abu Dhabi, United Arab Emirates, 25–30 September 2010. [Google Scholar]
  64. Islam, M.; Kubo, I.; Ohadi, M.; Alili, A. Measurement of solar energy radiation in Abu Dhabi. Appl. Energy 2009, 86, 511–515. [Google Scholar] [CrossRef]
  65. Rusheng, T.; Tong, W.U. Optimum tilt angle for solar collectors used in China. Appl. Energy 2004, 79, 239–248. [Google Scholar]
  66. Ulgen, K. Optimum tilt angle for solar collectors, Energy Sources A Recovery Util. Environ. Eff. 2006, 28, 1171–1180. [Google Scholar]
  67. Mamun, M.A.A.; Islam, M.M.; Hasanuzzaman, M. Jeyraj Selvaraj, Effect of tilt angle on the performance and electrical parameters of a PV module: Comparative indoor and outdoor experimentalS investigation. Energy Built Environ. 2021, in press.
Figure 1. PV module layered structure with perpendicular solar flux beams.
Thermo 02 00004 g001
Figure 2. Schematic representation of energy gained and generated by the PV module.
Thermo 02 00004 g002
Figure 3. Rayleigh number variation at horizontal θ = 0 ° against PV module operating temperature with various solar flux at γ = 90 ° .
Thermo 02 00004 g003
Figure 4. Rayleigh number variation on inclined PV module operating temperature, with various solar fluxes at γ = 90 ° and 30 ° θ 80 ° .
Thermo 02 00004 g004
Figure 5. Heat transfer free convection coefficient vs. PV module operating temperature.
Thermo 02 00004 g005
Figure 6. PV module efficiency vs. PV module operating temperature with specified solar flux at γ = 90 ° on the horizontal module and inclined PV module with θ = 30 ° .
Thermo 02 00004 g006
Figure 7. PV cell efficiency vs. PV cell operating temperature with specified conditions from [3,31]. The suggested models in previous studies mentioned that efficiency and temperature have a linear relation.
Thermo 02 00004 g007
Figure 8. PV module operating temperature vs. tilt angle with specified solar flux at γ = 90 ° on an inclined PV module. The tilt angle is 30 ° θ 80 ° and the solar flux is Gt = 1000 W/m2.
Thermo 02 00004 g008
Figure 9. PV module operating temperature vs. solar flux with γ = 90 ° , horizontal PV module and an inclined PV module at η = 12 % , without a cooling system.
Thermo 02 00004 g009
Figure 10. PV module operating temperature vs. solar flux with γ = 90 ° , a horizontal PV module and an inclined PV module with a tilt angle of θ = 30 ° , η = 12 % for various values of Rcool Km2/W. The cooling system results from [31] are presented in this figure (which has an ellipse mark on the curve) to compare the proposed model output with the literature.
Thermo 02 00004 g010
Figure 11. PV module operating temperature vs. solar ray orientation γ , horizontal PV module, and inclined PV module, η = 12 % ; solar flux is constant at Gt = 1000 W/m2.
Thermo 02 00004 g011
Figure 12. PV module operating temperature vs. daytime hours from 7 a.m. to 7 p.m. from experimentally recorded data over 4 days, 15 April, 15 May, 11 June, and 17 July, at Tehran’s meteorological station in 2012.
Thermo 02 00004 g012
Figure 13. PV module operating temperature vs. daytime hours from 8:10 a.m. to 3:15 p.m. The filled red color circle curve is experimentally recorded data from [67]. The filled black color square curve has been calculated based on the input from [67] to compare the proposed model and empirical result.
Thermo 02 00004 g013
Table 1. Variables and constants taken from [1] used in the numerical solution.
DescriptionCharacterUnitValue
PV solar absorptivity α pv -1
PV module surface A m 2 1
Stefan–Boltzmann constant σ W / m 2 K 4 5.67 × 10 8
PV surface emissivity ε -0.855
Ambient temperature T a °C25
Air effective thermal conductivity k W / mK 0.026
PV module length L m 1
Gravity acceleration g m / s 2 9.81
Volumetric thermal expansion coefficient β K 1 3.35 × 10 3
Air thermal diffusivity α m 2 / s 22.4 × 10 6
Air kinematic viscosity υ m 2 / s 15.7 × 10 6
Air Prandtl number Pr -0.7
Publisher’s Note: MDPI stays neutral with regard to jurisdictional claims in published maps and institutional affiliations.

