Abstract
Noble gas fission byproducts, such as Kr and Xe, are generated within nuclear power reactors are currently being discharged into the atmosphere. This practice has a major economic drawback because of the high value associated with some of these gases. The separations of these gases are economically prohibitive because of the high energy requirement associated with cryogenic distillation. Zeolites, nanoporous materials suitable for gas separation processes, have exhibited high selectivity for such separations. We have used nonequilibrium molecular dynamics (MD) to investigate the separation performance of DD3R framework zeolitic membrane. The effects of pressure, temperature, and pure vs. mixture gas feed conditions are studied in this work to understand and explain, at the molecular level, the mechanisms of these (Kr/Xe) separations. Our studies have shown that the DD3R membrane shows promise for high selectivity ratios of Kr over Xe. MD runs show agreement with experimental trends of the permeation of Kr/Xe pure and mixed gases using DD3R zeolite with high separation factor. Despite the absence of Xe complete permeation through the membrane because of MD timescale limitations, our results are sufficient to describe the mechanisms of these separations.
1. Introduction
Nuclear energy, despite being unfavored for a long time, is being seriously reconsidered as a clean, reliable alternative energy source due to its minimal contribution to global warming in comparison to other energy sources such as fossil-fuels. This is a big motivation for research that aims to make nuclear power a safer and economically feasible energy alternative, even when compared to intermittent renewable energy sources. For this to be achieved, some practices in nuclear power generation require some change.
Currently, noble gases, such as radioactive 85Kr isotope and sTable 135Xe, generated as fission byproducts in nuclear power reactors, are being discharged into the atmosphere. Although radiation level increases are limited, radioactive gases should be stored until stable. Unfortunately, the volume occupied by this gas is prohibitively large and represent a major challenge to store. Meanwhile, almost three quarters of the volume of this gas is sTable 135Xe, which provides an economical motive due to its high market value.
For a long time, Kr/Xe separations were done using cryogenic distillation, which is associated with high energy requirement. Adsorption on nanoporous materials, a process shown to be a good alternative to cryogenic distillation, has two important characteristics: the high surface area that allows for higher gas uptake, caused by the unique-shaped cages within zeolite crystalline structures, and the potential enhancement of selectivity by chemical fine tuning to acquire desired adsorbate-adsorbent interactions. Zeolitic molecular sieves are categorized among the industrial nanoporous materials most used for gas separation. Based on characteristics including pore size, cage occupancy numbers, and void fraction of different zeolite frameworks, a wide range of values for Kr/Xe selectivity factors are found; the adsorption selectivity of zeolites is favorable toward Xe.
For example, Linde Type A (NaA) zeolite has shown Xe/Kr adsorption selectivity factors as high as 4.6 at 1 atm and 300 K for an equimolar mixture [1]. NaA zeolite has a uniform aperture size of 4.1, which is larger than both kinetic diameters (d(Kr) = 3.69Å and d(Xe) = 4.05Å) making diffusion selectivity in favor for Xe, an unfavorable outcome. Chabazite (CHA) zeolite, on the other hand, has an aperture size of 3.8Å resulting in barrier-height-limited permeation conditions in favor of Kr with Kr/Xe separation factor as high as 51 [2].
Experimental work for such separations has been carried out for deca-dodecasil-rhombohedral (DD3R) zeolite frameworks, with promising Kr/Xe separation factors [3]. In the experiments, DD3R zeolite membranes fabricated on four-channel hollow fibers had a thickness of ~4.4 µm, and were highly robust and defect-free. The single gas permeation and mixed gas separation performance were evaluated by the Wicke-Kallenbach technique. The experimental details are described in detail in an earlier work and its supporting information [4]. The earlier gas separation experiments were carried out using the same Wicke-Kallenbach technique described in [5]. The partial pressures in the permeate and retentate side were measured with a Ledamass Quadrupole Mass Analyzer. Although the commercial sources for the DD3R crystals and the membranes were listed in the acknowledgment, no description was provided [6].
According to experiments, Kr permeation through DD3R membranes is higher in the mixture case in comparison to the individual pure gases. In addition, Kr pure gas permeance is higher than that of pure Xe [3].
In the present work, we used non-equilibrium molecular dynamics (MD), as implemented by [4] for CO2/Xe gas separation, to examine Kr/Xe gas separation via DD3R zeolite membrane, to understand and explain the reported experimental trends, and to describe the mechanisms of such separations at the molecular level, along with the effects of pressure and temperature on gas permeation.
Zeolites are available in a wide range of pore size distributions. DDR3 has been identified as a potential candidate for the separation of Xe/Kr. Our results have agreed with all trends reported experimentally. Simulations use much smaller membrane thicknesses than actual experiments and are on a much smaller time scale, so there is no realistic expectation of simulation results numerically agreeing with experimental results. The main goal of simulations once the trends agree is to understand the mechanics of the separations that our simulations were able to establish. Other zeolites have since our work was completed also found to be effective in such separations. A recent paper on chabazite membranes has reported this recently [2].
2. Materials and Methods
To obtain comparable results for gas permeation through a porous crystal structure, proper gas density numbers are required to simulate the effects of pressures and/or temperatures for different gas feeds. We carried out 10 nanoseconds (timestep = 1.0 femtosecond) of NPT ensemble MD simulation of only gas atoms, for pure and equimolar mixture, Kr, and Xe to estimate gas density numbers under different temperatures and pressures.
Gas densities obtained from NPT simulations were used to pack the feed region of the DD3R gas permeation system with the correct number of gas atoms to simulate desired conditions. A typical system set-up is shown in Figure 1. Gas atoms were packed into the central region in Figure 1 using the PACKMOL, which provides a non-overlapping initial configuration [7]. Two DD3R zeolite membrane slabs of thickness 25 Å are used to separate gas feed in the central region, while the two vacuum regions on both edges of normal to the membrane surface serve as the drive force to induce the gas permeation. This makes the simulation system compatible with the periodic boundary conditions used. The membrane structure was obtained from the Database of Zeolite Structures [8]. This method of nonequilibrium MD simulation has been implemented successfully to study mass transfer through porous mediums in several applications, such as ion-exchange, alcohol dehydration, reverse osmosis, and gas separations [9,10,11,12]. These references detail the specific considerations involved in setting up systems of such simulations.

Figure 1.
Overall view of the simulation box including top view (left) and front view (right) at the beginning of the simulation. The membrane is 2.517 nm thick.
As shown in Figure 2, the DD3R unit cell is trigonal; the way we truncated the crystal structure leaves open cages on the surface. These open cages act as the surface adsorption sites for gas atoms. These openings end with inner cage apertures. The smaller cages, with 5-member ring windows shown in Figure 3a, are not accessible to guest atoms such as Kr and Xe. The 8-member ring window of the alpha cages in Figure 3b is 3.6 Å by 4.4 Å representing the VDW distances between oxygen atoms [8], resulting in a barrier-height-limited Xe (size = 4.1 Å) permeation, a condition that is required for a high Kr/Xe separation factor, as we shall see later.
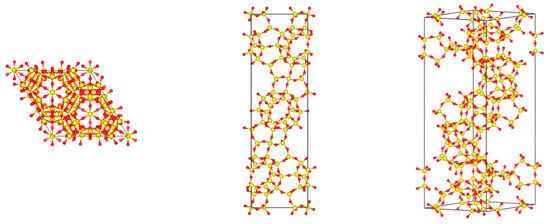
Figure 2.
Visualization of DD3R framework unit cell.
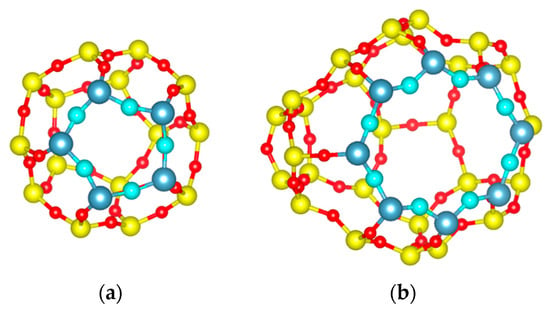
Figure 3.
Visualization of the different cages of DD3R: (a) Visualization of DD3R sodalite cage. Aperture atoms are in different colors for visualization purposes (oxygen is cyan and silicon is silver); (b) Visualization of the DD3R alpha cage, showing the 8-member ring opening with the smallest interatomic distance between two opposing oxygens of (3.6 Å).
Using the LAMMPS MD software package [13], we performed 30 ns NVT ensemble MD simulations to study the effect of pressure, temperature, and pure vs. mixture feed on gas permeation. With temperature and volume being fixed for the whole duration of each run, the number of gas atoms required to simulate the desired conditions was calculated from density numbers obtained from the NPT MD simulations explained earlier. All gas permeation simulations used a timestep of 1.0 femtosecond.
We used the 12-6 Lennard-Jones potential for inter-molecular interactions. The 12-6 Lennard-Jones potential is given by (1), where ε is the depth of the potential well and σ is the inter-atomic distance at which potential is equal to zero. The parameters are detailed in Table 1. Lorentz-Berthelot mixing rules were used for interactions of cross-species. We considered a global cut-off distance of 12 Å for the potential interaction. In our studies, we assumed a rigid structure for the zeolite. Pictures of crystalline structure were rendered by VESTA [14], while other molecular visualizations, were done using VMD (Visual Molecular Dynamics software) [15].

Table 1.
12-6 Lennard-Jones potential parameters.
Data analyses include number densities of each species in different regions, and calculation of running averages of these values over the duration of the simulation. Running averages were calculated simultaneously during the MD. These averages were collected after having allowed the system to equilibrate for 1 microsecond. In addition, density profiles along the direction normal to the membrane surface facing the gas are plotted by using the running average of the number of atoms in each bin (bin width = 1 Å), along the x-axis. Density profiles are normalized by the total number of atoms of the same species. Density profiles exhibit almost two occupancy peaks in each layer of DD3R cages. These correspond to the favorable adsorption positions within each cage along the permeation path. The numerical results and discussions of density profiles are supported by molecular level visualizations, which were obtained by reading the molecular dynamics trajectories of each run using VMD. The observed selectivity of the Xe/Kr systems depends upon both the sizes of the atoms as well as their molecular interactions with the zeolite. These are usually referred to as steric and dispersive attraction effects. The attractive forces lead to one atom finding a more hospitable environment for adsorption on the surface as well as the cavities of the zeolite.
While all simulations span 30 ns each, for Xe, no complete permeation nor presence in inner cages was ever observed under any simulation conditions considered. Therefore, further examination of the adsorption layer at the membrane surface was helpful in determining the saturated conditions in this region. Two-dimensional density plots on yz plane, for the two adsorption layers formed by Xe in addition to the first layer of open cages, were prepared to examine the membrane surface for active adsorption sites. Another fact related to Xe not completely permeating, is its possible effect on the Kr permeation; that is, Xe forms concentrated adsorption layers that might act as a barrier to Kr in the case of mixture simulations. To address these problems, DD3R cages were prefilled with Xe ahead of starting the MD runs for the gas mixture. This prefilling follows a manual scheme where each inner cage is populated with its maximum occupancy of two Xe atoms ahead of starting the simulation.
3. Results
We present here the numerical results from running averages obtained from counting the number of gas atoms in each compartment of the simulation box obtained from our MD simulations and reported in Table 2. In addition, density profiles obtained from chunk calculations in these MD simulation as well as visualization of portions of individual snapshots (single time frame) taken from MD trajectories are presented.

Table 2.
Numerical results of 30 ns NVT gas permeation system *.
3.1. Pure Gases
3.1.1. Effect of Pressure on Pure Kr Permeation
From Figure 4, it is observed that, from low to high pressure, more krypton atoms accumulate at the surface of the membrane facing the gas feed region; this is a direct consequence of the higher number density at the higher pressure. We note, however, that the ratio of the total number of adsorbed Kr atoms (integral over the adsorption peak) from 150 to 75 atm is 1.71, which is less than 2; the greater adsorption at the higher pressure is attributed to the higher driving force. Kr permeation into the membrane is also greater at the higher pressure. Inside the membrane, the peaks in Figure 4 correspond to occupation of cages within the membrane as the Kr atoms permeate. There are only small differences in these peaks at the two pressures. Given the membrane structure, cages have a finite capacity, thus, the pressure effect toward increasing krypton content inside the membrane can be limited when cages become saturated. A closer look into the inner cages is illustrated in Figure 5, which shows the maximum number of Kr atoms observed in a single cage was 4 for both pressures, confirming the incidence of saturated cages. Overall, higher pressure yields higher krypton permeation and adsorption. The pressure effect on adsorption for many similar surfaces has been extensively studied by many and the results obtained almost always show a linear dependence on pressure [1,2]. We therefore felt that studying two pressures was sufficient since our primary interest was in obtaining the pressure gradient, which can be obtained from two points sufficiently apart [17,18].
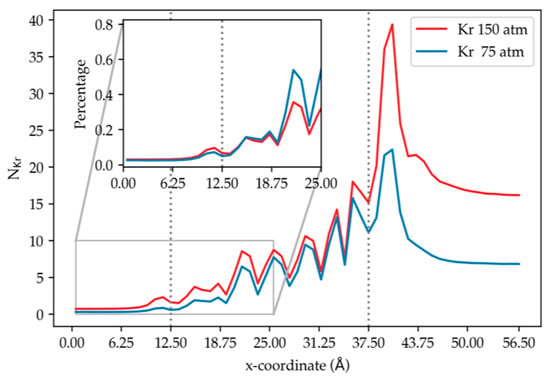
Figure 4.
Density profiles of krypton along the direction normal to membrane surface (bin width = 1 Å). Ni = running average of the number of Kr atoms in the ith bin using results from simulation (1) and (2) at 300 K. The dashed vertical lines correspond to the membrane edges. For this and succeeding figures, the profiles in only one of the membranes in the simulation box are shown, since the other is related by symmetry.
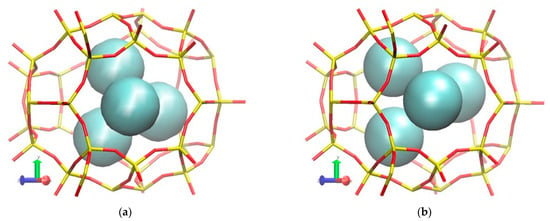
Figure 5.
Molecular visualization of Kr atoms filling up inner cages of DD3R membrane using molecular trajectories from simulations (a) at 300 K and 150 atm and (b) at 300 K and 75 atm.
3.1.2. Effect of Temperature on Pure Kr Permeation
At the lower temperature, it is observed in Figure 6 that more Kr atoms adsorbed on the DD3R surface than at the higher temperature. The integrated adsorption peak on the DD3R surface at the lower temperature is twice as large as at the higher temperature. We note that while there is a secondary adsorption layer at 300 K (already discussed in Figure 4), there is no second adsorption layer at the higher temperature. This is because at the higher temperature, Kr can overcome the energy barriers and enter the cages, causing less accumulation of Kr at the surface. The rate of desorption from inner cages is higher at the high temperature than at the low temperature, allowing fewer krypton atoms to accumulate inside the membrane cages as exhibited in Figure 7a,b. This is explained by the increased gas-particle velocity at the high temperature, which overcomes intermolecular energies between krypton and DD3R cages, thereby promoting higher incidence of complete krypton permeation as shown in Figure 7c,d. By comparing simulations (2) and (3), we find that increasing temperature has tripled the ratio of the completely permeated krypton atoms relative to the total number of krypton atoms. We would also like to point out that experimental behavior of adsorption of noble gases on a range of surfaces show an almost linear behavior w.r.t. temperature as long as the temperature range is not exceeding wide. For example, a recent study in the 77–150 K range for nitrogen, showed essentially a linear variation with temperature for a range of pressures [19].
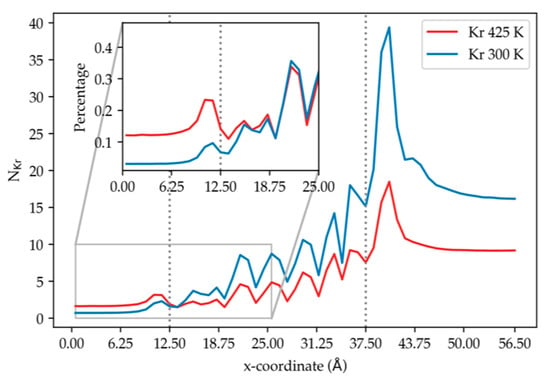
Figure 6.
The density profile of krypton at different temperatures, normalized by the total number of atoms of the same species in the system, along the direction normal to the membrane surface, using results from simulation (2) and (3) at 150 atm. The dashed vertical lines correspond to the membrane edges.
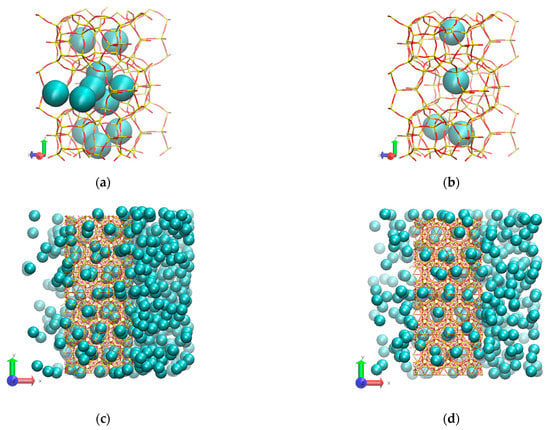
Figure 7.
Molecular visualization of the temperature effect: (a) (inner cages) 300 K and 150 atm; (b) (inner cages) 425 K and 150 atm; (c) (overall view) 300 K and 150 atm; (d) (overall view) 425 K and 150 atm.
3.1.3. Effect of Pressure on Pure Xe Permeation
We note that, under the same pressure, Xe has higher number density in comparison to Kr; Xe gas thus behaves less ideally than Kr. At both pressures, complete permeation of Xe through the DD3R zeolite membrane has not been observed. However, the observation of the first sharp peak inside the membrane indicates that Xe atoms can and do enter the membrane, although less easily than Kr, and some permeation will be observed after much longer simulation times. Figure 8 illustrates how the adsorption layers at both pressures are relatively close, indicating saturation of active sites on the membrane surface. This observation implies that the size of Xe atom relative to the diameter of the structure openings into the cages of the membrane creates a barrier-height-limited permeation. At the membrane surface, the Xe adsorption peak at higher pressure is greater than that at the lower pressure, as was found in the case of pure Kr. However, the ratio of the integrated peak intensity at 150 atm to that at 75 atm is 1.27, compared to 1.71 for the pure Kr. This indicates that, unlike the Kr case, the Xe saturates the membrane surface, a consequence of the greater attractive Xe-membrane interactions compared to Kr-membrane, as well as greater attractive Xe–Xe interactions compared to Kr–Kr. In addition, at higher pressures, Xe has a second peak in the density profile away from the membrane. This second adsorption layer forms primarily due to Xe–Xe interactions of the Xe atoms in the feed region with the ordered Xe first adsorption layer.
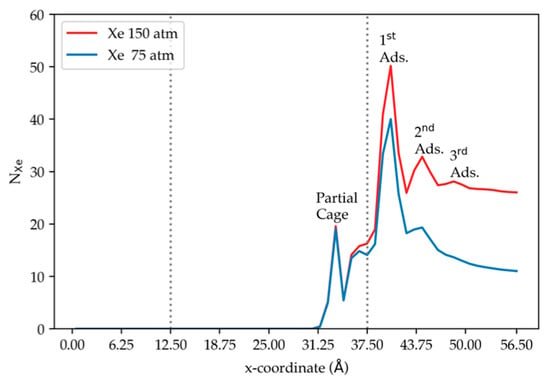
Figure 8.
The density profile of xenon along the direction normal to the membrane surface at two pressures, using results from simulation (4) and (5) at 300 K. The dashed vertical lines correspond to the membrane edges.
To further investigate this accumulation within the first adsorption layer on the membrane surface, two-dimensional density plots were constructed to examine if Xe adsorption exhibits any specific structure that may provide insight into active adsorption sites on the DD3R membrane surface. Figure 9 examines the adsorption of Xe on the membrane surface (in yz-plane). The three sets of the two-dimensional density plots illustrate Xe distribution on the surface for the three peaks shown on the bottom panel of the figure. The first row represents the second (outer) adsorption layer under two pressures, where the left panel has a darker shade indicating that the second adsorption layer starts to saturate under high pressure.
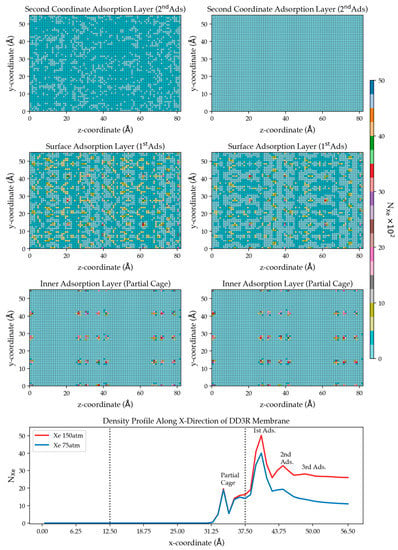
Figure 9.
Two-dimensional density plots illustrating adsorption of Xe atoms on the membrane surface at two pressures using results of simulation (4) 75 atm (right) and (5) 150 atm (left). The top 2 plots correspond to the number density from the integrated peak of the secondary adsorption layer in Figure 8, followed by that of the surface adsorption peak, and the prominent peak inside the membrane. The bottom plot is a copy of Figure 8 as a reminder.
The second row of plots examines the surface adsorption layer. It is observed that the higher-pressure results in higher adsorption of Xe on the membrane surface than the low-pressure. This can be explained by the higher driving force pushing Xe closer to the membrane in high numbers, where they accumulate on the surface, given the strong intermolecular interaction of Xe with the zeolite membrane. The Xe arrangement on the surface provides locations of active adsorption sites on the membrane surface in contact with fluid. The third row of plots examines the inner adsorption layer of Xe in the partly open cages at the surface of the DD3R membrane. The two plots are similar, which agrees with the bottom panel showing the identical density profiles. Due to the barrier-height-limited entry into cages and Xe-cage intermolecular interactions, Xe has shown a much slower permeation process in comparison with Kr.
3.1.4. Effect of Temperature on Pure Xe Permeation
Figure 10 shows the density profiles under different temperatures. At low temperature, Xe atoms accumulate more for all adsorption layers. Lower Xe occupancies are found at open cages on the membrane surface, in which the cages have partial shapes with much larger opening than the 8-member DD3R window. This is illustrated in Figure 11 showing average occupancy for partial cages decreasing to two Xe atoms at the most for the majority of the MD runs. No complete permeation takes place even at 425 K for the length of MD simulations considered in this study. Figure 11a shows Xe atoms occupying an inner cage Figure 11b becomes reduced at a much elevated temperature, while Figure 11c Xe atoms inner cage occupancy has been observed at a much elevated temperatures at similar simulation times.
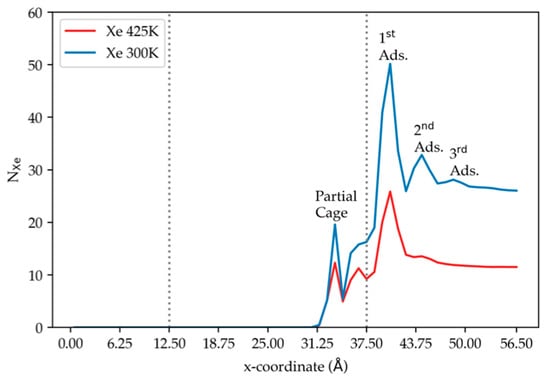
Figure 10.
The density profile of xenon along the direction normal to the membrane surface at two pressures, using results from simulation (5) and (6) at 150 atm. The dashed vertical lines correspond to the membrane edges.
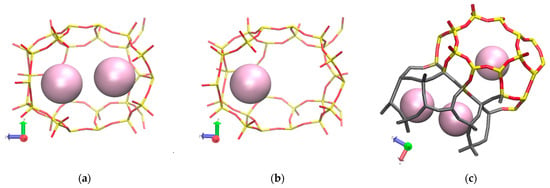
Figure 11.
Molecular visualization of temperature effect on active adsorption site occupancy (a) at 300 K and 150 atm and (b) at 425 K and 75 atm. (c) Xe atom occupying inner cages at elevated temperatures validating the requirement of much longer simulation times. Color difference in membrane structure is to distinguish surface partial cages (gray) and inner cages (colored).
3.2. Mixture Gases
3.2.1. Kr Permeation in Kr–Xe Mixture
Figure 12 illustrates the density profile for pure Kr and for Kr in equimolar Kr–Xe mixture along the x-direction on the membrane surface in contact with the gas. As shown in the figure and discussed earlier, in pure Kr feed, Kr atoms accumulate in the adsorption layer at the membrane surface and also in the layer of partial cages at the DD3R surface. In contrast, in the Kr–Xe mixture system, the Kr ratio, at the adsorption layer and in the layer of partial cages, is lower than for the pure Kr case. This is a direct consequence of the presence of Xe, which is attracted more strongly to the membrane than Kr. The empty DD3R cages at the start of simulation, as shown in Figure 1, are gas atom adsorption sites. The barrier-height-limited permeation of Xe prevents it from entering the cages. So, the Xe atoms accumulating on the surface partial cages prevent Kr from entering the inner cages and passing through completely, which is contrary to experimental trends. We hypothesize that this can be attributed to the barrier created by Xe atoms, whose adsorption on the membrane surface arises from stronger attractive forces with the membrane. On one side, the kinetic dimeter of Xe is 4.10 Å, which is much larger than Kr (3.69 Å) and the pore size of DD3R (3.6 Å) [20]. The presence of Xe can effectively block the pathway of Kr diffusion. Such behavior has been observed in our previous study, where the mixture of Xe/CO2 has been used in the feed [4]. On the other side, the preferential adsorption of Xe over Kr has been proved for various zeolite frameworks experimentally [1,21,22]. If, instead, we start the simulation with DD3R inner cages pre-filled with Xe atoms as shown in Figure 13, we find the percentage of completely permeated Kr atoms has increased from 1.16 percent in pure Kr to 2.40 percent in Kr–Xe mixture, which agrees with experimental trends [3]. Xe hopping in-between cages would require computational time not currently feasible; on the other hand, pre-filling the cages with Xe mimics the steady-state Xe occupancies at 150 atm, prior to (t = 0) of the MD simulation run with equimolar Xe and Kr in the feed. We find that the presence of Xe in the inner cages assists the Kr permeation through the membrane because of attractive Kr–Xe forces. The membrane cage filling scheme in this MD simulation was achieved by identifying accessible cages and manually filling each with two Xe atoms, which corresponds to steady-state Xe occupancies at 150 atm. Despite this somewhat arbitrary manual filling, the pre-filled Xe atoms quickly find more favorable positions inside the cages.
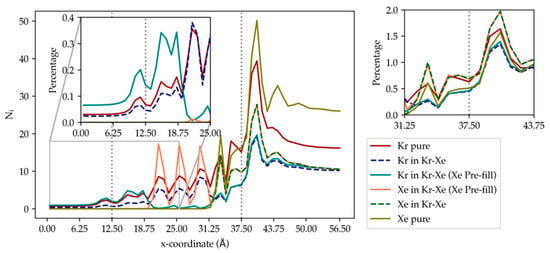
Figure 12.
The density profile of Kr and Xe along the direction normal to the membrane surface at two pressures, using results from simulation (2), (5), (7), and (8) at 300 K. The dashed vertical lines correspond to the membrane edges.
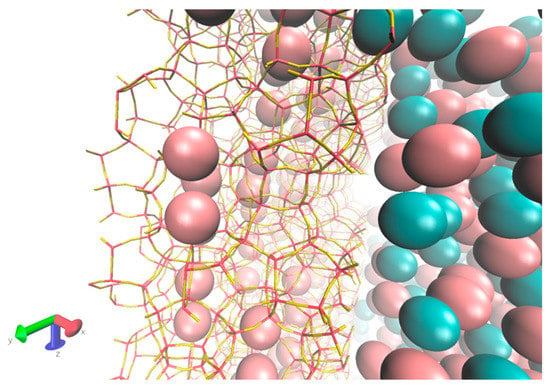
Figure 13.
Close-up visualization of the gas-membrane interface at the beginning of the simulation, showing prefilled Xe atoms inside inner cages of DD3R in pink, while Kr is cyan.
3.2.2. Xe Permeation in Kr–Xe Mixture
In Figure 12, at the adsorption layer, the highest peak for Xe is close to the membrane surface. The integral over the adsorption peak, expressed as the ratio of adsorbed Xe atoms to the total number of Xe atoms in the system, in the pure case is lower than in the Kr–Xe mixture system. This is because of the higher number density of Xe in the pure case. The pure Xe case shows a third small bump away from the membrane, which indicates the saturation of the first two adsorption peaks. Similarly, in the first layer of DD3R partial cages, the profiles show lower ratio for the pure case than the mixture case. Despite greater adsorption in pure Xe, the higher molar density in bulk results in a lower ratio. In addition, the finite number of the partial cages also limits the adsorption capacity. When comparing the actual numbers of Xe atoms in the partial cages layer, the highest peak, the numbers are lower in the mixture case due to the presence of Kr, which has smaller atomic size and could hop in-between cages much more easily. In the case of the DD3R cages pre-filled with Xe atoms, while Xe density profile shown in dashed blue shows a uniform distribution of Xe atoms along the inner cages of the membrane structure, there is no complete permeation of Xe either from the gas feed nor from the Xe atoms initially occupying the inner cages. This validates the assumption on the molecular level in which Xe jumping in and out of cage openings is barrier-limited.
Figure 14 provides a clear visualization of the difference between following the conventional simulation method with empty cages versus using the manual Xe pre-filling scheme discussed earlier. Starting with empty cages, Figure 14a shows Xe forming an adsorption layer on the membrane surface, blocking Kr permeation given the stronger Xe-membrane interaction. In contrast, pre-filling inner cages with Xe allows for the attractive Xe–Kr forces to promote Kr permeation. As a Kr atom approaches an inner cage opening, the presence of Xe in the adjacent cages can attract Kr and help it passing through the inner cages, which results in higher complete permeation of Kr. Such a permeation mechanism is illustrated in Figure 14b–f. Noting that our hypothesis provided here comes from a modeled system under some ideal circumstances, the observation that Kr permeation could be improved with the presence of Xe has been documented in experimental works for the CHA framework [2].
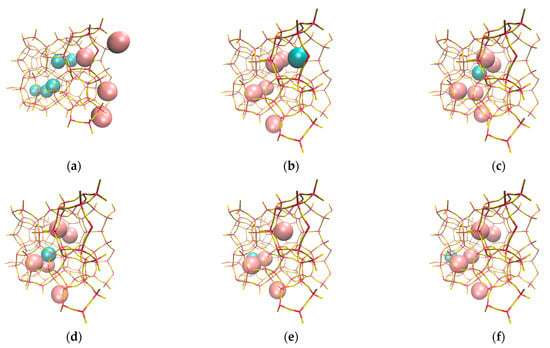
Figure 14.
The absence of Xe pre-filled cages (a) causes Xe to accumulate on the surface, thus limiting Kr permeation, which, in addition, accumulates inside inner cages. Molecular visualization showing the effect of Xe pre-filled zeolite cages on Kr permeation, where we see Kr atom approaches cage window (b), Kr inside first inner cage (c), Kr jumping from and into inner cages and passing to the complete permeation region (d), (e), and (f) respectively.
3.3. MSD Results
In this computational study, the system is set up with gas feed, where high gas concentration numbers exist, that is trapped between two DD3R zeolite membrane slabs that separate the gas from the complete permeation region where dilute gas concentration numbers exist. This results in a high concentration gradient that acts as the driving force for the gas permeation. As the simulation starts, the gas atoms start to permeate through DD3R membrane pores toward the complete permeation region. During this time, mean square displacements in x, y, and z were sampled and averaged over atoms every 10,000 timesteps for the length of each simulation.
Figure 15 illustrates the MSD data, in the direction normal to the membrane surface, plotted against time. The data show the usual fluctuations related to the nature of sampling from molecular dynamics simulations. Data were linearly fit to obtain the slope for each data set for diffusion coefficient calculations. In the direction x-axis, the slope of MSD vs. time is illustrated by Stokes–Einstein Law in Equation (4).
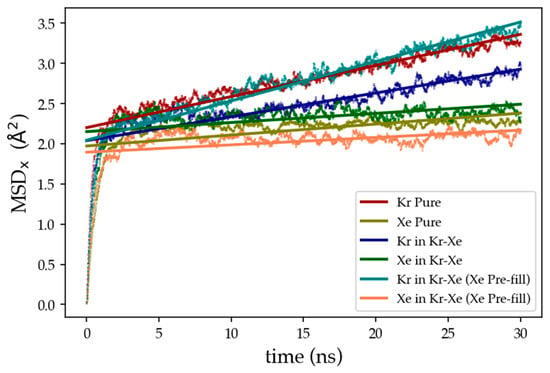
Figure 15.
Mean-Squared-Displacement (MSD) in the direction normal to the membrane surface vs. time for 30 ns of MD simulation. MSD data shows oscillatory behavior that was linearly fit for diffusion coefficient determination.
With n signifying the number of dimensions and the MSD to time interval ratio as the slope from the data plotted. A summary of diffusion coefficient results for gas permeation through DD3R zeolitic membrane is provided in Table 3 for 30 ns of MD simulations at 300 K and 150 atm.

Table 3.
Diffusion Coefficients for Kr/Xe through DD3R.
Diffusion coefficients, along the x-direction, calculated from Figure 15 for pure Kr and for Kr in Kr–Xe mixture were 1.932 × 10⁻¹³ m2 s−1 and 1.481 × 10⁻¹³ m2 s−1. Due to the stronger interaction of Xe-zeolite leading to Xe blockage of the surface, the Kr diffusivity is lower in the mixture case. This is expected to change when Xe atoms advance through the membrane, instead of accumulating on the membrane surface, as the strong Xe–Kr interaction would favor Xe to stay inside the membrane cages and allow Kr to permeate more easily. To study this assumption, DD3R inner cages were filled according to the manual filling scheme explained in the mixture effect on gas permeation previously. MSD results for this case, shown in Figure 15 in turquoise and olive for Kr and Xe, respectively, show higher diffusion coefficient for Kr with 2.450 × 10⁻¹³ m2 s−1 and lower diffusion for Xe at 4.567 × 10⁻¹⁴ m2 s−1 in comparison to the pure gas simulations. This validates both the experimental trends and our molecular-level separation mechanism: Kr gas permeation through DD3R membrane is higher in the Kr/Xe gas mixture case compared to pure gases, because the attractive Kr–Xe forces facilitates higher Kr permeationrates.
4. Discussion
In runs (1) and (2), increasing pressure reduces the fraction of completely permeated Kr, as shown in the inset plot of Figure 4. This agrees with the experimental trends in DD3R published by van den Bergh et al. [6], where Figure 4 of this reference shows the flux of Kr at 303 K increases with increasing pure Kr feed pressure between 100 and 400 kPa, i.e., between 1 and 4 atm, but if normalized to the total number of atoms, there is hardly any change with feed pressure, actually a very slight decrease, while ours is 1.38% at 75 atm in run (1) going down to 1.16% at 150 atm in run (2), which agrees with the experimental trend. Our simulation results were carried out at much greater pressures, and the finite capacity of cages present in the MD simulation box, where cages were filled with maximum occupancy of 4 Kr atom per DD3R alpha cage at both pressures are shown in Figure 5. Note that the fraction of Kr adsorbed went down from 25.05 to 16.50% upon increasing pressure. This is also the case for Xe in runs (4) and (5), where despite the absence of completely permeated Xe in these runs, Xe adsorbed on the membrane surface has gone down from 9.72 to 5.18% with increasing pressure in runs (4) and (5). This is also shown in Figure 8, where Xe surface adsorption peaks are close to each other, signaling the higher adsorption at lower pressures. All these observations in our simulations are consistent with the experimental Kr data in DD3R [6] and the Kr and Xe data [3].
The effect of temperature on gas permeation was studied by increasing temperature to 425 K while keeping pressure at 150 atm by changing the number of atoms considered for the gas phase. Kr complete permeation has increased three-fold, shown clearly in the inset plot of Figure 6. The amount of Kr adsorbed in the membrane is lower at high temperatures as shown in Figure 7, where lower Kr occupancy numbers are observed, caused by higher kinetic energies that permit Kr to go over the energy barriers; Kr atoms more easily hop from one cage into another. Numerical values for runs (2) and (3) in Table 2 show this when examining the number of Kr atoms, which went down from 396 to 229 Kr atoms when temperature was increased. This is similar for pure Xe where atom count on the adsorption surface decreased from 166 Xe atoms in run (4) to 113 in run (6), shown also in Figure 10, where the density profile for Xe at high temperature is much lower than that at low temperature. The trend observed in DD3R in Figure 2 of [6] found the single component flux of Kr through DD3R decreases with increasing temperature between 200 and 300 K, but does not change much between 300 and 400 K, even very slightly increasing with temperature in this region, like our data 1.16% at 300 K in run (2) going to 3.69% at 425 K in run (3). Our MD results do not carry Xe all the way to complete permeation, but when we look inside the membrane region in Table 2, simulations (4) and (6), we find 5.18% at 300 K going up to 7.62% at 425 K, which is the same trend as seen in DD3R [3].
After reviewing the effects of pressure and temperature on permeation of pure gases, we moved into the equimolar gas permeation, which is the major focus of this study. According to experimental results, Kr complete permeation increases in going from pure to mixture gas conditions [3]. Following our conventional simulation setup, starting MD simulations with empty membrane cages, our results from run (7) did not exhibit the same experimental trends with fraction of completely permeated Kr decreasing from 1.16% in the pure gas (2) to 0.88% in the gas mixture as shown by the dark blue dashed line in Figure 12. As discussed earlier, this is caused by the slow diffusion process of Xe, which results in its accumulation on the membrane surface rather than complete permeation. The blockage stops Kr diffusion, as shown in Figure 14a. This artefactual result is attributed to the fact the system was not simulated at equilibrium adsorption conditions. Xe prefers to occupy zeolite cages as shown by experimental adsorption isotherms in the literature, so to carry out permeation simulations under steady state conditions, the Xe occupancies of the cages should be what would have been in steady state, before the start of the permeation simulation.
To circumvent this, we followed the manual Xe pre-filling scheme explained previously to explore the effect of Xe–Kr attractive forces on Kr permeation in the gas mixture. While the idea of simulating adsorption equilibrium conditions for the membrane structure is of actual relevance to real-life experiments, the manual Xe pre-filling proposed in this study and used in run (8) was successful in reproducing experimental trends for Kr permeation; ref. [3] that is, the fraction of completely permeated Kr has doubled compared to the pure simulation in run (2). On the other hand, Xe kept the same behavior as in the conventional simulation method with no complete permeation as shown in Figure 12, where pre-filled Xe is showing a uniform distribution in the inner cages of the membrane. These results provide a clear picture of the mechanism of the observed separation. Xe because of its stronger affinity for the zeolite occupies the cavities of the cages. The Xe in the cages then because of their stronger interaction with Kr, promote their transport through the zeolite membrane. Thus, Kr permeates at a higher rate when Xenon is present than when it is not. This is often not the case because the larger molecules can block the zeolite surface and thus prevent the smaller molecules from entering the membrane.
In addition, the value 1.932 × 10⁻¹³ m2 s−1 at 300 K for Kr in DD3R reported here in Table 3 from the MSD data is close to the experimental value of (3.1 ± 1.3) × 10−13 m2 s−1 at 300 K for Kr in DD3R from reference [6] and also close to the value calculated using Maxwell Stefan model combined with new thermodynamic factors, and different models for adsorption isotherms in reference [23] (2.03 − 2.09) × 10−13 m2 s−1 at 300 K for Kr in DD3R. This is a further validation of the simulations in this work.
5. Conclusions
The separation of Kr/Xe radioactive waste is a process of enormous benefit for environmental and economic reasons. Using zeolites for such separation has been showing promising results, with some zeolites showing separation factors as high as 51 for Kr/Xe separations [2]. This work examined DD3R zeolite for such a separation process. This computational study has confirmed almost all trends found in experimental work discussed here k. While this study only reproduces trends for experimental work, the next stage of this project will be exploring the equilibrium adsorption conditions in the membrane from the start of MD simulation in addition to using Ar as sweep gas to promote Kr/Xe permeation to study the steady-state conditions to obtain separation factors similar to those observed in experimental work.
Author Contributions
Conceptualization, S.M.; Methodology, B.J.B.; Software, B.J.B.; Validation, X.W., C.J.J. and S.M.; Formal analysis, B.J.B.; Investigation, B.J.B. and C.J.J.; Resources, S.M.; Data curation, B.J.B.; Writing—original draft preparation, B.J.B.; Writing—review and editing, B.J.B., X.W., C.J.J. and S.M.; Visualization, B.J.B.; Supervision, S.M. All authors have read and agreed to the published version of the manuscript.
Funding
B.J.B. is supported by King Abdulaziz University, Jeddah, Saudi Arabia.
Institutional Review Board Statement
Not applicable.
Informed Consent Statement
Not applicable.
Data Availability Statement
The data that support the findings of this study are available from the corresponding author upon reasonable request.
Conflicts of Interest
The authors declare no conflict of interest.
References
- Jameson, C.J.; Jameson, A.K.; Lim, H.-M. Competitive Adsorption of Xenon and Krypton in Zeolite NaA: 129Xe Nuclear Magnetic Resonance Studies and Grand Canonical Monte Carlo Simulations. J. Chem. Phys. 1997, 107, 4364–4372. [Google Scholar] [CrossRef]
- Wang, X.; Zhou, T.; Zhang, P.; Yan, W.; Li, Y.; Peng, L.; Veerman, D.; Shi, M.; Gu, X.; Kapteijn, F. High-Silica CHA Zeolite Membrane with Ultra-High Selectivity and Irradiation Stability for Krypton/Xenon Separation. Angew. Chem. Int. Ed. 2021, 60, 9032–9037. [Google Scholar] [CrossRef]
- Wang, X.; (Nanjing Tech University, Nanjing, China). Personal communication, 2020.
- Wang, X.; Zhang, Y.; Wang, X.; Andres-Garcia, E.; Du, P.; Giordano, L.; Wang, L.; Hong, Z.; Gu, X.; Murad, S.; et al. Xenon Recovery by DD3R Zeolite Membranes: Application in Anaesthetics. Angew. Chem. Int. Ed. 2019, 58, 15518–15525. [Google Scholar] [CrossRef] [PubMed]
- van de Graaf, J.M.; Kapteijn, F.; Moulijn, J.A. Methodological and Operational Aspects of Permeation Measurements on Silicalite-1 Membranes. J. Membr. Sci. 1998, 144, 87–104. [Google Scholar] [CrossRef]
- van den Bergh, J.; Zhu, W.; Gascon, J.; Moulijn, J.A.; Kapteijn, F. Separation and Permeation Characteristics of a DD3R Zeolite Membrane. J. Membr. Sci. 2008, 316, 35–45. [Google Scholar] [CrossRef]
- Martínez, L.; Andrade, R.; Birgin, E.G.; Martínez, J.M. PACKMOL: A package for building initial configurations for molecular dynamics simulations. J. Comput. Chem. 2009, 30, 2157–2164. [Google Scholar] [CrossRef] [PubMed]
- Baerlocher, C.; McCusker, L.B. Database of Zeolite Structures. Available online: http://www.iza-structure.org/databases/ (accessed on 8 October 2021).
- Murad, S.; Jia, W.; Krishnamurthy, M. Ion-Exchange of Monovalent and Bivalent Cations with NaA Zeolite Membranes: A Molecular Dynamics Study. Mol. Phys. 2004, 102, 2103–2112. [Google Scholar] [CrossRef]
- Qu, F.; Shi, R.; Peng, L.; Zhang, Y.; Gu, X.; Wang, X.; Murad, S. Understanding the Effect of Zeolite Crystal Expansion/Contraction on Separation Performance of NaA Zeolite Membrane: A Combined Experimental and Molecular Simulation Study. J. Membr. Sci. 2017, 539, 14–23. [Google Scholar] [CrossRef]
- Hinkle, K.R.; Wang, X.; Gu, X.; Jameson, C.J.; Murad, S. Computational Molecular Modeling of Transport Processes in Nanoporous Membranes. Processes 2018, 6, 124. [Google Scholar] [CrossRef] [Green Version]
- Chen, C.; Cheng, Y.; Peng, L.; Zhang, C.; Wu, Z.; Gu, X.; Wang, X.; Murad, S. Fabrication and Stability Exploration of Hollow Fiber Mordenite Zeolite Membranes for Isopropanol/Water Mixture Separation. Microporous Mesoporous Mater. 2019, 274, 347–355. [Google Scholar] [CrossRef]
- Thompson, A.P.; Aktulga, H.M.; Berger, R.; Bolintineanu, D.S.; Michael Brown, W.; Crozier, P.S.; in’t Veld, P.J.; Kohlmeyer, A.; Moore, S.G.; Nguyen, T.D.; et al. LAMMPS—A Flexible Simulation Tool for Particle-Based Materials Modeling at the Atomic, Meso, and Continuum Scales. Comput. Phys. Commun. 2021, 271, 108171. [Google Scholar] [CrossRef]
- Momma, K.; Izumi, F. VESTA: A Three-Dimensional Visualization System for Electronic and Structural Analysis. J. Appl. Crystallogr. 2008, 41, 653–658. [Google Scholar] [CrossRef]
- Humphrey, W.; Dalke, A.; Schulten, K. VMD: Visual Molecular Dynamics. J. Mol. Graph. 1996, 14, 33–38. [Google Scholar] [CrossRef]
- Parkes, M.V.; Demir, H.; Teich-McGoldrick, S.L.; Sholl, D.S.; Greathouse, J.A.; Allendorf, M.D. Molecular Dynamics Simulation of Framework Flexibility Effects on Noble Gas Diffusion in HKUST-1 and ZIF-8. Microporous Mesoporous Mater. 2014, 194, 190–199. [Google Scholar] [CrossRef]
- Kitani, S.; Takada, J. Adsorption of Krypton and Xenon on Various Adsorbents. J. Nucl. Sci. Technol. 1965, 2, 51–56. [Google Scholar] [CrossRef]
- Guillot, B.; Sator, N. Noble Gases in High-Pressure Silicate Liquids: A Computer Simulation Study. Geochim. Cosmochim. Acta 2012, 80, 51–69. [Google Scholar] [CrossRef] [Green Version]
- Fatriansyah, J.F.; Dhaneswara, D.; Kuskendrianto, F.R.; Abdurrahman, M.H.; Yusuf, M.B.; Abdillah, F.A. The Effect of Temperature and Pressure on Nitrogen Adsorption in Amorphous Silica. J. Phys. Conf. Ser. 2021, 2070, 012045. [Google Scholar] [CrossRef]
- Tomita, T.; Nakayama, K.; Sakai, H. Gas Separation Characteristics of DDR Type Zeolite Membrane. Microporous Mesoporous Mater. 2004, 68, 71–75. [Google Scholar] [CrossRef]
- Auerbach, S.M.; Carrado, K.A.; Dutta, P.K. Handbook of Zeolite Science and Technology; CRC Press: Boca Raton, FL, USA, 2003; ISBN 978-0-203-91116-7. [Google Scholar]
- Shang, J.; Li, G.; Singh, R.; Xiao, P.; Liu, J.Z.; Webley, P.A. Determination of Composition Range for “Molecular Trapdoor” Effect in Chabazite Zeolite. J. Phys. Chem. C 2013, 117, 12841–12847. [Google Scholar] [CrossRef]
- Lito, P.F.; Santiago, A.S.; Cardoso, S.P.; Figueiredo, B.R.; Silva, C.M. New Expressions for Single and Binary Permeation through Zeolite Membranes for Different Isotherm Models. J. Membr. Sci. 2011, 367, 21–32. [Google Scholar] [CrossRef]
Publisher’s Note: MDPI stays neutral with regard to jurisdictional claims in published maps and institutional affiliations. |
© 2022 by the authors. Licensee MDPI, Basel, Switzerland. This article is an open access article distributed under the terms and conditions of the Creative Commons Attribution (CC BY) license (https://creativecommons.org/licenses/by/4.0/).