3. Results
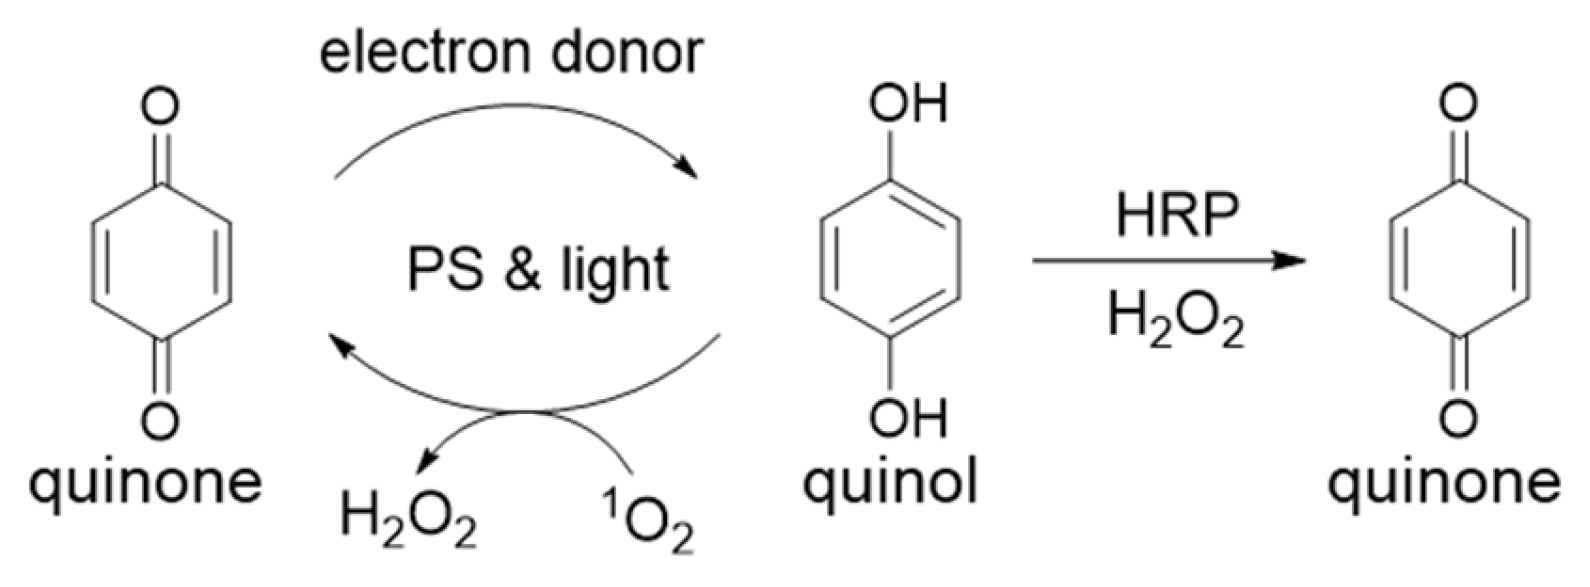
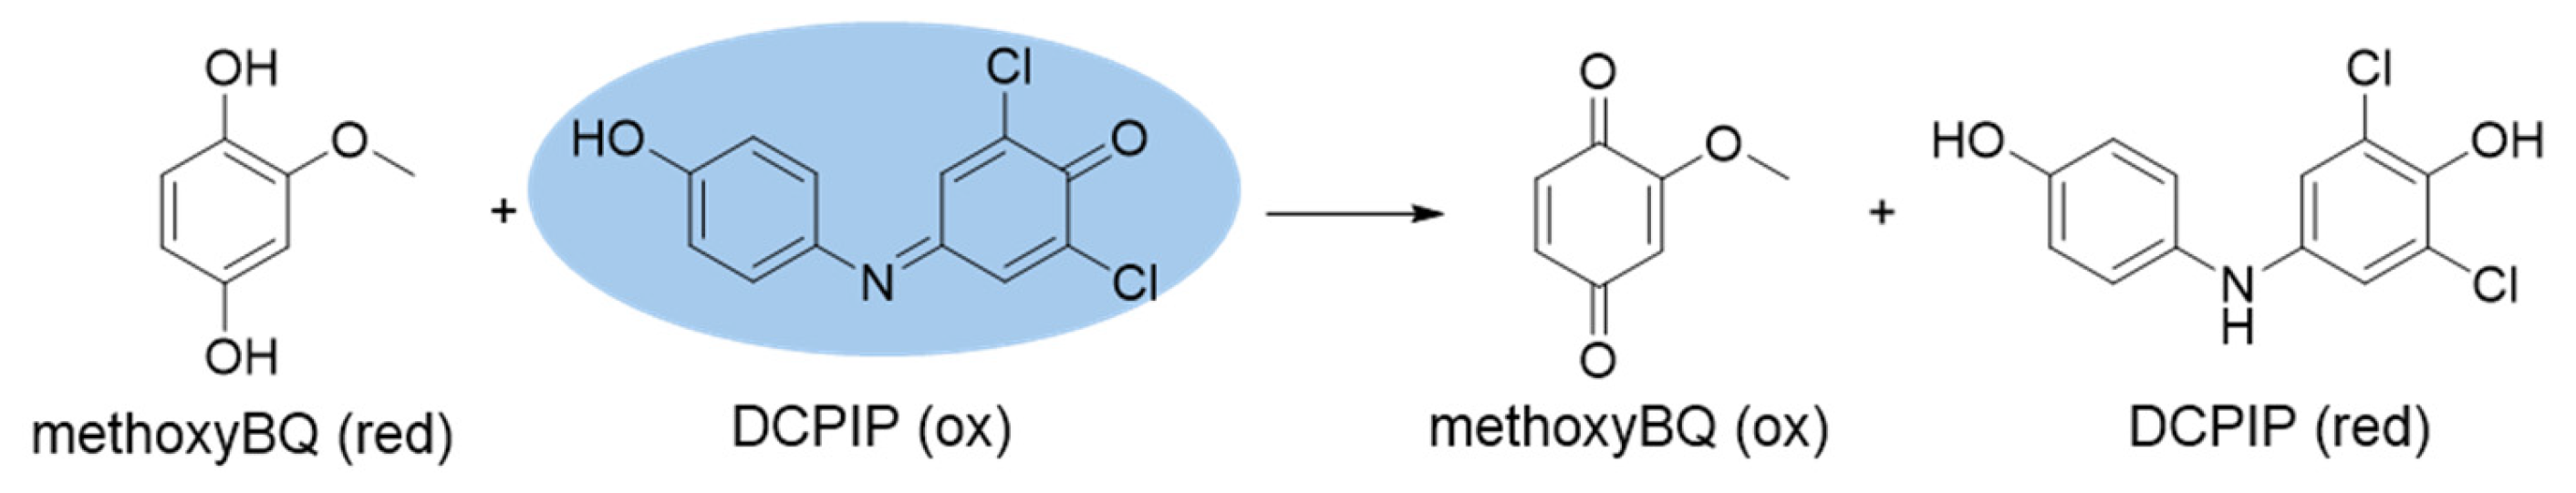
We reported that p-benzoquinones, o- and p-naphthoquinones can be photoreduced by the combination of photosensitizers, red light and electron donors [
9,
10]. In those studies, we observed oxygen uptake and detected H
2O
2 because photoexcitation generated singlet oxygen (
1O
2) concurrently during quinone photoreduction. Newly photoreduced quinols reacted with
1O
2 resulting in reoxidation to the quinone as depicted in
Scheme 3.
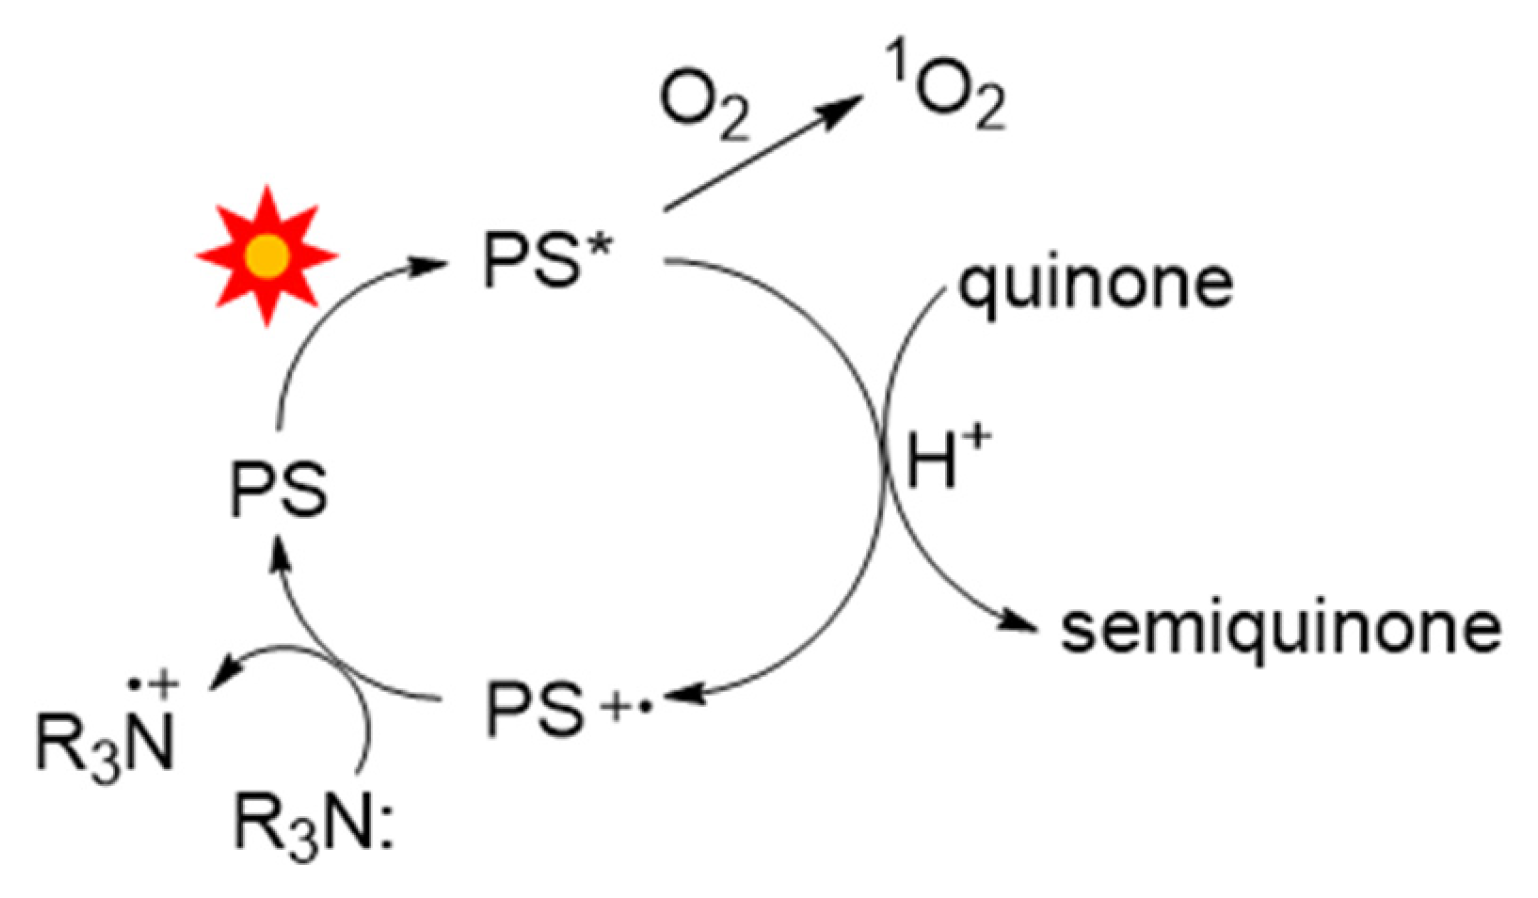
Scheme 4 summarizes the photoreduction cycle where the sensitizer (PS) is excited to the triplet state, PS*. Once formed, PS* may react with O
2 to generate
1O
2 or transfer an electron to the quinone substrate to yield the one-electron reduced semiquinone. The electron-deficient photosensitizer (PS
+•) is restored to its resting state by electron donation from the tertiary amine (R
3N). Two semiquinones (RO•) disproportionate rapidly to yield a quinol and regenerate a quinone [
27].
H
2O
2 formation is the result of
1O
2-mediated hydrogen atom abstraction from the quinol to produce a semiquinone and peroxyl radical (•OOH). Because the pK
a of •OOH is 4.8, it will deprotonate at neutral pH to a superoxide anion [
28]. Disproportionation of two superoxide anions yields O
2 and H
2O
2 according to Equation (1).
Horseradish peroxidase (HRP), an enzyme that requires H
2O
2 to oxidize numerous organic substrates including catechols and quinols, was used to detect H
2O
2 [
29,
30]. Because quinols are oxidized by HRP only when H
2O
2 is available, benzoquinone or naphthoquinone substrates were regenerated when HRP was added following irradiation (
Scheme 3). Previously, for 1,2-naphthoquinone, we monitored the loss of absorbance at 415 nm for photoreduction and the subsequent increase in A
415 when HRP was added [
10]. If catalase was added prior to HRP, no increase in A
415 was detected because it consumed H
2O
2 according to Equation (2):
Direct photoreduction of DCPIP was examined using the methodology described above for benzoquinones and naphthoquinones. Consistent with our earlier work, we employed the combination of methylene blue (MB) as photosensitizer and EDTA as the tertiary amine electron donor. We initiated this work using a 1 mL semimicro cuvette so that it could be irradiated and scanned directly at time intervals to limit mixing and O2 exposure to only the O2 that was in the solution.
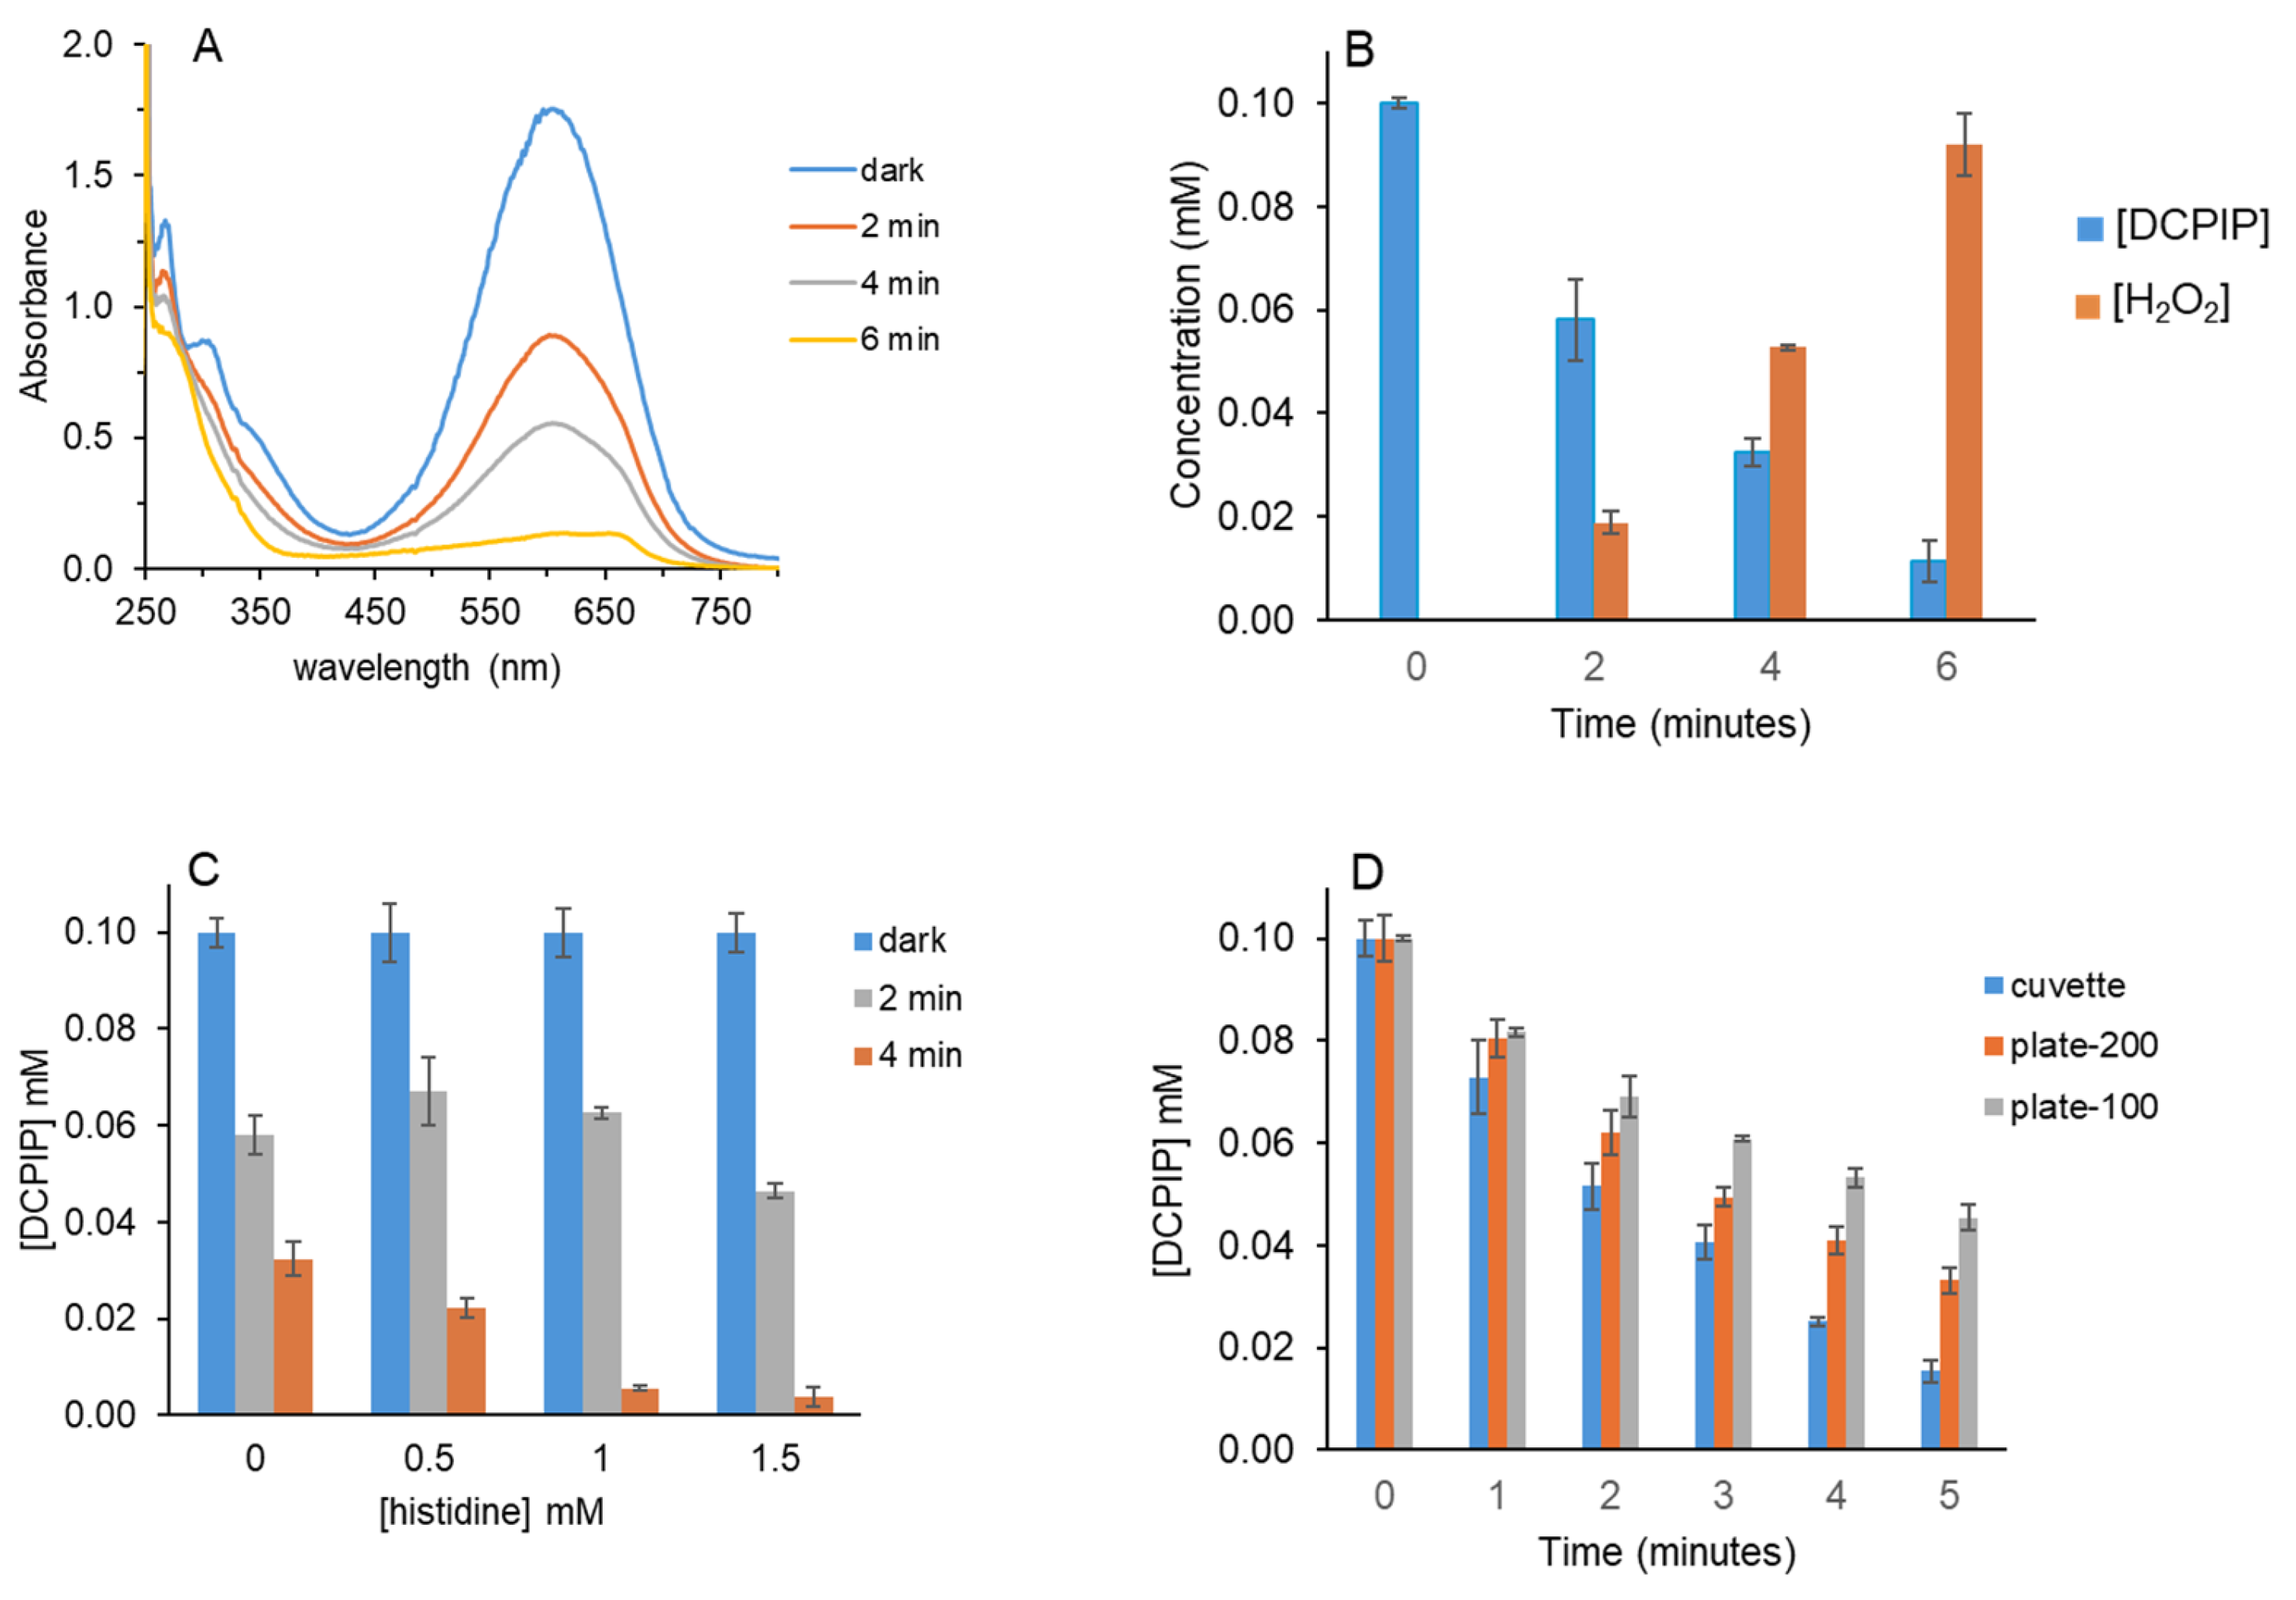
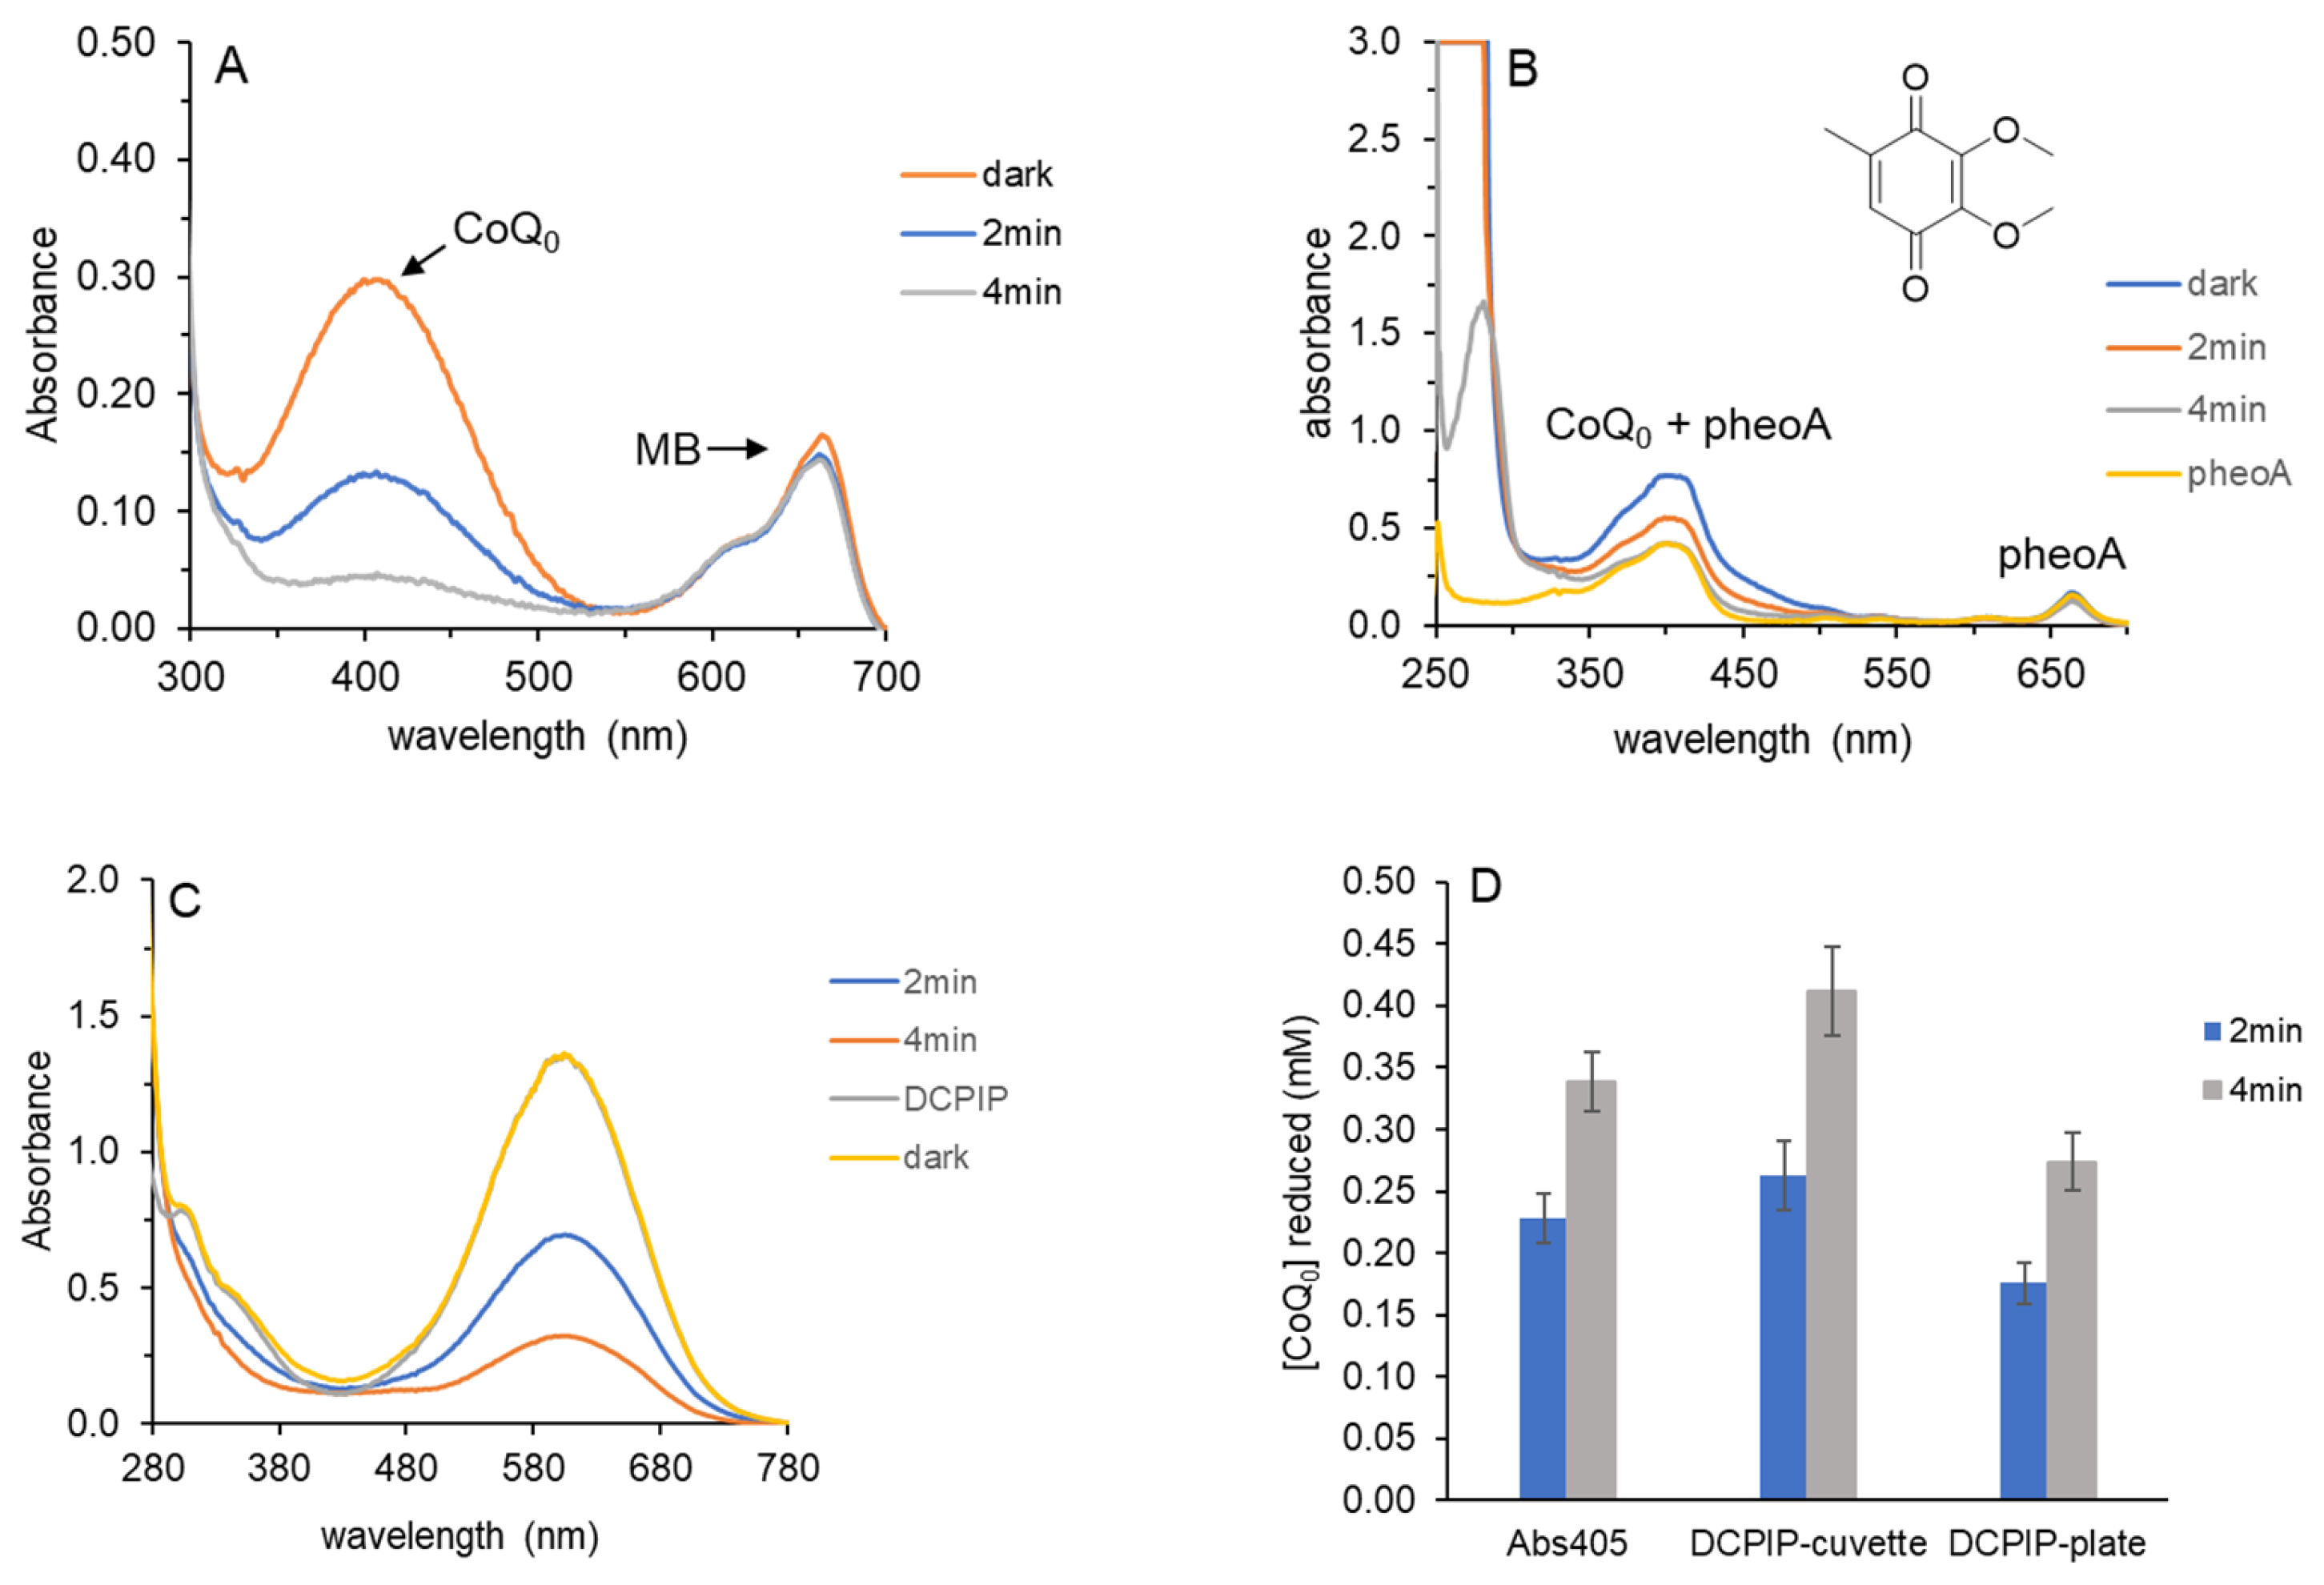
Figure 1A shows that DCPIP absorbance decreased upon irradiation with a 36-watt red light with maximum output at 660 nm. Due to its strong absorbance at 605 nm, the highest concentration of DCPIP used was 0.10 mM. A standard curve of DCPIP was linear up to 0.10 mM; this ensures that decreases in absorbance are in the linear range (
Supplemental Figures S1 and S2). As irradiation time increased, DCPIP absorbance at 605 nm decreased. In the absence of MB or EDTA, no decrease in absorbance was observed.
MB absorbs at 665 nm; therefore, after 6 min of light and when the DCPIP absorbance had decreased by ~90%, the MB peak became visible (
Figure 1A). Only 2 μM MB was used; therefore, its absorbance did not interfere with DCPIP quantification at 605 nm. The MB peak observed after 6 min of light is essentially equal to that of the dark control, confirming that little to no MB photobleaching occurred.
DCPIP absorbance at 605 nm for each time point in
Figure 1A was used to calculate concentrations shown in
Figure 1B (in blue). As in our prior work using benzoquinones, HRP was added to determine if H
2O
2 formed and if reduced DCPIP was a co-substrate for HRP. Upon addition of HRP, the blue color of oxidized DCPIP was regenerated, indicative of H
2O
2. If catalase was added prior to HRP, thereby consuming H
2O
2, no increase at 605 nm was observed.
Multiple photoreduction experiments were performed to determine H
2O
2 concentration for each time interval. For example, a separate sample was irradiated for 2 min, scanned to measure photoreduction from the decrease at 605 nm, treated with HRP and rescanned to determine the H
2O
2 concentration from the increase at 605 nm. H
2O
2 concentration values determined by this method are shown in
Figure 1B (orange).
According to our proposed mechanism, for each quinol that reacts with
1O
2, one H
2O
2 molecule is formed. Because the typical concentration of dissolved O
2 at 20–22 °C is ~0.30 mM, the maximum concentration of H
2O
2 that could form is 0.30 mM if no additional O
2 enters the reaction vessel. The narrow dimensions of the cuvette limit O
2 from mixing with the solution.
Figure 1B shows that H
2O
2 increased to ~0.09 mM at 6 min when 90% of the DCPIP was photoreduced.
If irradiation was extended beyond 6 min, additional H
2O
2 formed as a result of continued cycles of
1O
2 generation and reoxidation of reduced DCPIP because O
2 was not yet depleted (
Scheme 3 and
Scheme 4). In this case, the concentration of H
2O
2 exceeded that of the reduced DCPIP, which functions as the HRP co-substrate. This was evident because upon addition of HRP, the blue color of oxidized DCPIP formed quickly but faded to pale pink within 1 min.
We suspected that the phenol ring of DCPIP shown in
Scheme 2 could be further oxidized to yield a colorless product. To address this, we mixed DCPIP with H
2O
2 and HRP. As added H
2O
2 increased, absorbance at 605 nm decreased (
Supplemental Figure S3) and only a weak absorbance ~500 nm (pink) remained. Therefore, both forms of DCPIP in
Scheme 2 are co-substrates for HRP. Consequently, H
2O
2 concentrations in
Figure 1B are only estimates, especially at 6 min.
The role of dissolved O
2 during DCPIP photoreduction is explored in
Figure 1C. Increasing concentrations of histidine were included in DCPIP photoreduction reactions with MB and EDTA identical to those in
Figure 1A,B. Histidine is a well-characterized
1O
2 scavenger that reacts with it to yield an oxygenated species, oxo-histidine, thereby depleting O
2 in the solution [
31,
32,
33].
Figure 1C shows that DCPIP photoreduction increased at 4 min for all concentrations of histidine tested. For 1.5 mM histidine, DCPIP photoreduction was also greater at 2 min than for the untreated or lower histidine concentrations. By scavenging
1O
2, histidine limited both reoxidation of reduced DCPIP and H
2O
2 generation. Decreased H
2O
2 for histidine-treated samples was confirmed because when HRP was added to those samples after irradiation, the resultant increase in A
605 was always less than that of the untreated samples.
We tested azide as an
1O
2 scavenger in DCPIP photoreduction assays but did not observe the same effect as for histidine. Although azide reacts avidly with
1O
2, additional azide-derived radical intermediates form and O
2 is regenerated [
34,
35]. For these reasons, we did not pursue azide studies further.
Because catalase regenerates O
2 from H
2O
2 according to Equation (2), it favors the formation of more
1O
2 that may subsequently reoxidize reduced DCPIP. However, because only 0.09 mM H
2O
2 was detected after 6 min (
Figure 1B), ~0.20 mM dissolved O
2 remained. Because O
2 was not limited, catalase had no effect on DCPIP photoreduction under the assay conditions employed.
We also compared the time course of DCPIP photoreduction in different experimental formats. MB, EDTA and DCPIP were premixed and then aliquoted into a cuvette (1 mL) or plate wells (100 μL or 200 μL each).
Figure 1D shows that the reaction format affected DCPIP photoreduction, with the fastest rate observed in the cuvette, followed by the 200 μL reactions, and the slowest with only 100 μL. The difference in rates was more pronounced at the longer reaction times when more DCPIP had been photoreduced and it could be reoxidized by
1O
2. The dimensions of the plate well allow more O
2 to enter the solution as it is consumed. In addition to increased
1O
2, newly reduced DCPIP is also exposed to O
2 at the well/air interface and may be directly oxidized independent of light-generated
1O
2. HRP was added to select wells and A
605 values increased, indicative of H
2O
2 formation.
Although the data in
Figure 1C support
1O
2-mediated reoxidation of reduced DCPIP as the source of H
2O
2, an alternative path to generate H
2O
2 exists. The tertiary amines that we employ as electron donors also react with
1O
2, though their rate constants are quite low (~10
5 M
−1 s
−1) [
36,
37]. According to Equation (3),
1O
2 oxidation of a tertiary amine also produces a superoxide anion that becomes H
2O
2.
A solution of 2 μM MB and 4 mM EDTA at pH 7.4 in a cuvette (no DCPIP) was irradiated for up to 6 min. Aliquots of this solution were combined with HRP and tetramethylbenzidine (TMB) as a co-substrate. At 6 min, only 0.04 mM H2O2 was produced from EDTA, which is less than the H2O2 concentration when DCPIP was included (0.09 mM). Greater H2O2 with DCPIP is supportive of redox cycling where photoreduced DCPIP reacts with 1O2. At 2 min, only 0.014 mM H2O2 was detected from EDTA. At this earlier time, prior to more complete DCPIP photoreduction, 1O2-mediated oxidation of EDTA may be the source of H2O2.
The intense color of DCPIP is attributed to the extended conjugation of its phenolate form (reported pK
a = 5.9). Absorbance scans of DCPIP in PB at pH 6.4 and 4.5 show the decrease in absorbance at 605 nm and the shift to a less intense peak at ~514 nm (
Supplemental Figures S4–S8). Because the extended conjugation of the phenolate is likely to impede its reduction, we examined DCPIP photoreduction from pH 6.0 to 8.0. The pK
a values of the EDTA amines are also crucial; a tertiary amine must be deprotonated to act as an electron donor. The pK
a values of the EDTA amines are 6.16 and 10.24. In the pH range from 6.0 to 8.0, the EDTA pK
a of 6.16 is important since its protonation will also vary.
DCPIP (0.10 mM), 2 μM MB and 4 mM EDTA were combined in 10 mM phosphate buffers of pH 6.0, 6,4, 6.9, 7.4 and 8.0 (cuvette).
Figure 2A shows a clear pH dependence, with photoreduction increasing as pH decreased. The increase in DCPIP photoreduction between pH 7.4 and 6.9 was especially striking. Because DCPIP photoreduction rates at pH 6.0, 6.4 and 6.9 were nearly identical in
Figure 2A, lower concentrations of both MB and EDTA were assayed. With 1 μM MB and 2 mM EDTA, little to no photoreduction was observed at pH 8.0 after 7 min of irradiation. DCPIP photoreduction at the other pH values is shown in
Figure 2B. Under these conditions, differences in photoreduction rates are discernible for all pH values.
DCPIP photoreduction was also performed in a 96-well plate using 2 μM MB and 4 mM EDTA at each pH. As in
Figure 2A,B, photoreduction increased as pH decreased (
Supplemental Figure S9). In the 96-well plate, pH 6.9 was noticeably slower than pH 6.0 or 6.4, though all were complete after 3 min. Consistent with
Figure 1D, exposure to O
2 in the plate well slowed DCPIP photoreduction.
Turnover numbers (mol DCPIP reduced/mol MB) and irradiation times for each pH and set of MB/EDTA conditions are summarized in
Table 1 for the cuvette reactions. Data for 1 μM MB and 2 mM EDTA highlight the difference across this pH range, especially the three-fold increase in turnovers at pH 6.9 vs. 7.4.
Further data analysis for DCPIP photoreduction was performed to obtain rate constants and half-lives for the reaction conditions and experimental configurations presented in
Figure 1B–D and
Figure 2A. These values are summarized in
Table 2. Clear differences in photoreduction rate constants are evident at the varying pH values tested, with the largest rate constant and consequently shortest half-life at pH 6.0.
Photoreduction of CoQ
0, a benzoquinone frequently used in our studies, was performed using the same buffers, MB and EDTA. CoQ
0 showed no pH dependence (
Supplemental Figure S10); therefore, we attribute the pH dependence shown in
Figure 2A,B to the properties of DCPIP, not the protonation states of MB or EDTA. Given the EDTA amine pK
a of 6.16, one might have expected a slower rate at lower pH instead of the equal rates for CoQ
0 from pH 6.0 to 8.0.
Attempts to directly photoreduce DCPIP with pheoA as the photosensitizer and TEOA as the electron donor in 20% DMF were unsuccessful. These reaction conditions have been used successfully to photoreduce benzoquinones and naphthoquinones [
9,
10]. However, because the pK
a of TEOA ~7.8, we reported a two-fold increase in quinone photoreduction at pH 8.0 relative to pH 7.4 [
9]. When pheoA was assayed with EDTA at pH 6.4 (also with 20% DMF), no DCPIP photoreduction was detected.
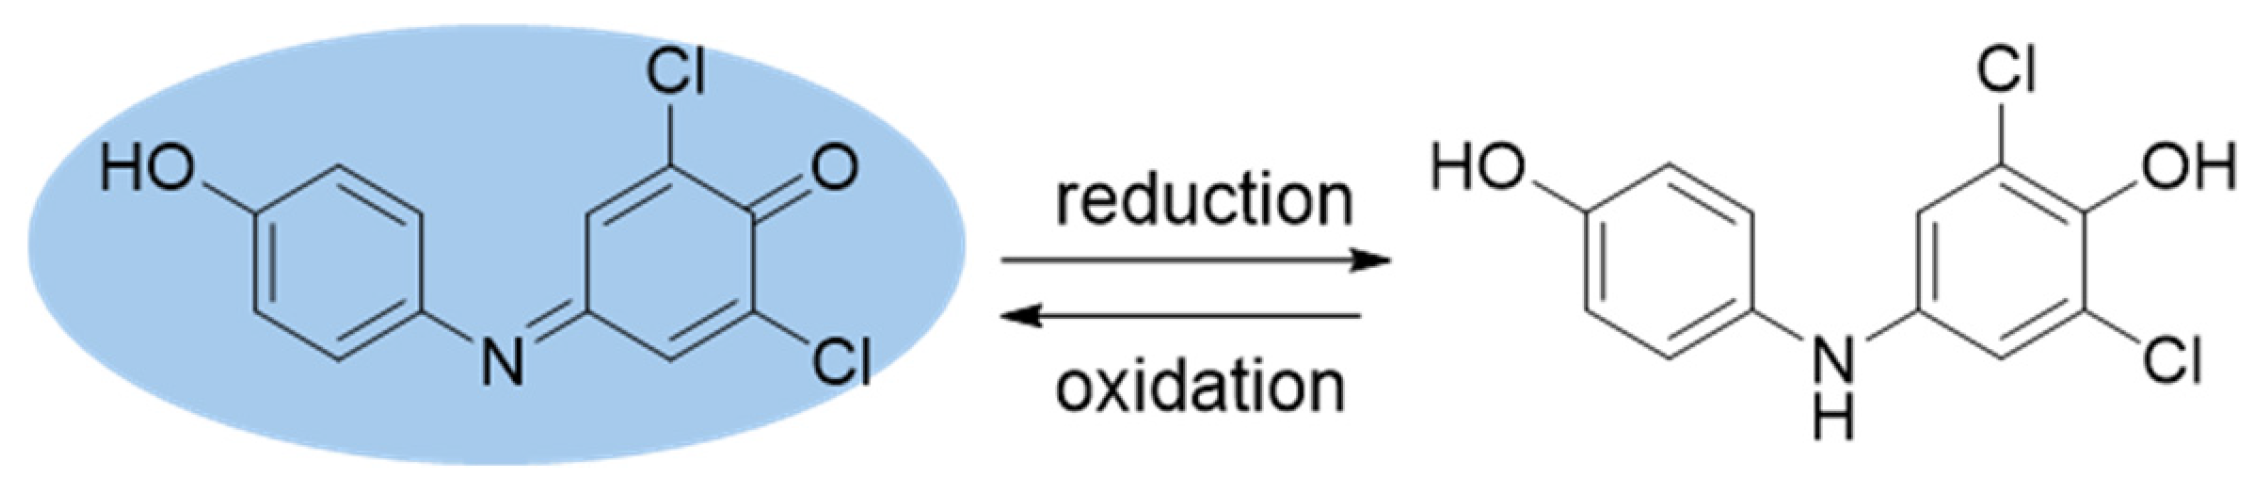
Direct photoreduction of DCPIP was only one goal of this work. We were interested in DCPIP as an electron acceptor from a reduced quinone (
Scheme 5). Although we routinely use absorbance scans prior to and after irradiation to study photoreduction, quantitation is challenging because many quinone substrates only absorb in the UV range. In some cases, even absorbances of their oxidized and reduced forms overlap in the UV [
10]. Further, chlorophyll metabolites like pheoA and chlorin e6 absorb at the same wavelengths as many quinones of interest.
Previously, we used DTNB derivatization after irradiation to detect benzoquinones because this method produced intensely colored adducts at ~550 nm [
9]. However, this method required a 30 min incubation, during which some of the newly photoreduced quinols were likely to air oxidize. In addition, naphthoquinones are generally too large to react completely with excess DTNB in 30 min.
We also reported that the tetrazolium salt MTT reacted with photoreduced benzoquinones and naphthoquinones. The reduced MTT product, a formazan, was quantitated based on its characteristic absorbance ~600 nm [
38,
39]. Two limitations of this method were the time required (up to 15 min) and the limited solubility of the formazan product.
To test DCPIP as an electron acceptor from photoreduced quinols, we chose several benzoquinones and optimized their direct photoreduction in a 1 mL cuvette using both the combination of MB and EDTA as well as pheoA with TEOA as the electron donor. In
Figure 3A, spectra of oxidized (dark) and reduced CoQ
0 (0.40 mM) are shown, as well as that of MB at 665 nm. As irradiation time increased, absorbance at 405 nm decreased. A full spectrum from 250 to 750 nm in
Supplemental Figure S11 shows a peak at 270 nm (4 min), indicative of full reduction. Chemical reduction of CoQ
0 by sodium ascorbate or NaBH
4 yielded identical spectral changes.
Figure 3B illustrates the challenge of studying CoQ
0 photoreduction by pheoA because both absorb ~400 nm. Notably, the control pheoA spectrum in
Figure 3B contained all reaction components except CoQ
0. This is important because 20% DMF, which is necessary for optimal pheoA-mediated photoreduction, affects pheoA absorbance [
9]. A second, smaller pheoA peak at 665 nm was monitored for photobleaching.
Figure 3B shows the decrease in CoQ
0 absorbance as irradiation time increased. At 4 min, all CoQ
0 was photoreduced and a peak at 270 nm formed, also indicative of photoreduction.
Regardless of the photoreduction conditions (
Figure 3A or B), photoreduced CoQ
0 was assayed for electron transfer to DCPIP (
Scheme 5). Control DCPIP (80 μM) and DCPIP combined with CoQ
0 (60 μM) labeled “dark” have identical spectra in the visible range (
Figure 3C). Below 280 nm, the dark sample absorbs more than the DCPIP alone.
Supplemental Figure S12 shows the full spectrum down to 250 nm, where the dark sample is off scale but DCPIP alone is not.
When aliquots of reduced CoQ
0 were combined with a slight excess of DCPIP (1.33:1), absorbance at 605 nm decreased. CoQ
0 that had been irradiated for 2 min yielded less DCPIP reduction than the 4 min sample. The reaction between photoreduced CoQ
0 and DCPIP was rapid and DCPIP absorbance became stable within 1 min of mixing. Because excess DCPIP was present, we did not expect absorbance at 605 nm to decrease to zero. Photoreduced CoQ
0, prepared in a cuvette as shown in
Figure 3A, was also stable. Up to three aliquots of it were mixed with DCPIP sequentially in a separate cuvette to obtain DCPIP absorbance changes. CoQ
0 that had been photoreduced using pheoA/TEOA and 20% DMF reacted with DCPIP in the same manner. A “dark” control was essential because DMF (only 3% final) affected DCPIP absorbance and TEOA affected the final pH.
We also developed a plate reader assay where the same DCPIP and CoQ
0 solutions were combined as for
Figure 3C (200 μL total). DCPIP absorbance changes at 605 nm in both formats were used to calculate the photoreduced CoQ
0 concentration and it was compared to time courses based on direct photoreduction (
Figure 3A). Direct photoreduction is indicated by “abs405” in
Figure 3D and shows nearly complete photoreduction of 0.40 mM CoQ0 at 4 min. From the CoQ
0 concentration during electron transfer (60 μM), we used the dilution factor to estimate photoreduced quinone in the 1 mL samples. The DCPIP electron transfer assay in a cuvette “DCPIP-cuvette” showed full reduction of 0.40 mM CoQ0 at 4 min. This slight difference may be explained by the greater sensitivity of DCPIP absorbance (ε = 19,100 M
−1 cm
−1) vs. that of CoQ
0 (ε = 740 M
−1 cm
−1) at pH 7.4. The 2 min time samples for “abs405” and “DCPIP-cuvette” were identical.
For the plate assay “DCPIP-plate”, less reduced CoQ0 was detected at both 2 and 4 min, even though the CoQ0 photoreduction reactions were identical and CoQ0 and DCPIP were mixed in the same manner. A challenge of this format is that air can both oxidize newly photoreduced quinol and oxidize DCPIP, which served as the electron acceptor. Nonetheless, the rapid reaction between photoreduced CoQ0 and DCPIP (1 min) is noteworthy.
Electron transfer from photoreduced CoQ
0 to DCPIP was also rapid in PB at both pH 6.4 and 4.5. At pH 4.5, the protonated DCPIP peak at 515 nm was monitored (
Supplemental Figures S6–S8). CoQ
0 photoreduction reactions were also performed with catalase to ensure that no H
2O
2 was available to interfere with electron transfer from reduced CoQ
0 to DCPIP. No difference in reactivity was observed.
Direct photoreduction of methoxybenzoquinone (methoxyBQ) by both MB/EDTA (
Figure 4A) and pheoA/TEOA (
Figure 4B) was performed as described above for CoQ
0.
Figure 4A shows distinct oxidized and reduced peaks for methoxyBQ and the characteristic MB peak at 665 nm. The decrease in absorbance for oxidized methoxyBQ at 366 nm coincided with an increase in absorbance at 286 nm for the reduced form. Comparison with CoQ
0 in
Figure 3A,B supports equivalent photoreduction by equal concentrations of MB and EDTA in 4 min.
As for CoQ
0, photoreduction by pheoA with TEOA as the electron donor is complicated by pheoA absorbance, which overlaps with oxidized methoxyBQ (
Figure 4B). Absorbance of pheoA alone also increased the baseline where reduced methoxyBQ absorbs at 286 nm. The peak at 286 nm did not reach the same absorbance (~1.5) as that of the methoxyBQ photoreduced by MB/EDTA in
Figure 4A; therefore, we conclude that methoxyBQ was not fully reduced under the pheoA/TEOA conditions employed.
When photoreduced methoxyBQ (using MB/EDTA) was combined with DCPIP, absorbance at 605 nm decreased rapidly and leveled off within 1 min.
Figure 4C summarizes the electron transfer results. Gratifyingly, absorbance at 366 nm “abs366” shows full reduction of 0.40 mM methoxyBQ at 4 min, as does “DCPIP-cuvette”. Plate values “DCPIP-plate” were ~10% lower at both 2 and 4 min compared to the other assay formats. It is noteworthy that the majority of the methoxyBQ photoreduction occurred in the first 2 min (~80%).
Photoreduction of methyl benzoquinone with MB and EDTA shows a decrease in the broad, weak absorbance ~320 nm and a sharp peak at 286 nm (
Figure 5A). This example, more so than CoQ
0 or methoxyBQ, highlights the challenges of relying on absorbance alone to quantitate photoreduction even by MB/EDTA. The baseline at 286 nm where reduced methylBQ absorbs is not zero due to MB and pheoA absorbance (
Figure 5A,B). Comparison with chemically reduced methylBQ supports full photoreduction of 0.40 mM methylBQ after 6 min with 2 μM MB and 2 mM EDTA.
When photoreduced methylBQ (60 μM) was combined with DCPIP (80 μM), methylBQ reacted more slowly with DCPIP relative to CoQ
0 and methoxyBQ, requiring up to 3 min before DCPIP absorbance remained constant. Further, the extent of electron transfer to DCPIP was not consistent with complete methylBQ reduction, like that for “abs286” (
Figure 5C). For the 1.33:1 ratio of DCPIP to methylBQ, only ~50% of the photoreduced methylBQ was detected (4 min sample) relative to the value for the direct absorbance measurement at 286 nm. Because we suspected that the electron transfer reaction had reached equilibrium, we increased the ratio of DCPIP to methylBQ to 2:1. Because DCPIP absorbs so strongly, we could not increase its concentration but rather decreased that of methylBQ to 40 μM.
Figure 5C shows that more reduced methylBQ was detected at this higher ratio (adjusting for a different dilution factor). Ratios of DCPIP to methylBQ higher than 2:1 were not attempted because we would have had to decrease the methylBQ concentration even more, resulting in increased opportunity for air oxidation.
The slower and incomplete reaction presented in
Figure 5C suggests that reduced methylBQ is more stable than reduced CoQ
0 or methylBQ and less willing to donate electrons to DCPIP. For comparison, we mixed DCPIP with hydroquinone (HQ), the stable and commercially available reduced form of 1,4-benzoquinone. When HQ was mixed with DCPIP under identical conditions, it did not react with DCPIP, as evidenced by little to no decrease in DCPIP absorbance. This was attempted at pH 6.4 and 4.5 as well as with incubation times up to 10 min. At most, DCPIP absorbance decreased by 10%, with any change detected in the first 2–3 min.
The direction of the electron transfer was reversed by combining photoreduced DCPIP, generated as described in
Figure 1 and
Figure 2, with each of the quinols. No increase in DCPIP absorbance occurred, which would have indicated DCPIP oxidation.
Lastly, we mixed photoreduced 1,4-naphthoquinone (1,4-NQ) with DCPIP as described for benzoquinones. In previous work, we had optimized photoreduction conditions for several naphthoquinones including 1,4-NQ. The reaction of DCPIP with reduced 1,4-NQ was immediate, with the lowest DCPIP absorbance reached upon mixing. Because photoreduced 1,4-NQ reoxidizes more readily than benzoquinones, the calculated reduced 1,4-NQ concentration from the change in DCPIP absorbance was less than those obtained from direct absorbance changes.
4. Discussion
Our results confirm that DCPIP, a quinone imine, is a substrate for direct photoreduction using MB as the photosensitizer and EDTA as the tertiary amine electron donor (
Figure 1A). The reaction conditions are nearly identical to those employed for other quinone substrates that we have studied [
9,
10]. DCPIP photoreduction was very pH-dependent across the range from 6.0 to 8.0, with increased rates as pH decreased (
Figure 2). We attribute this to protonation of the phenol of DCPIP, which has a pK
a of 5.9 (
Scheme 2). In its deprotonated form, the negative charge on the phenolate is delocalized throughout the entire structure; DCPIP reduction disrupts this extended conjugation. The pH dependence is not due to the protonation states of MB or EDTA because no pH dependence was observed when CoQ
0 was photoreduced using the same MB, EDTA and buffer solutions (
Supplemental Figure S10).
DCPIP photoreduction turnover numbers (mol DCPIP reduced per mol MB) are lower than those we reported for other quinones.
Table 1 shows that the highest turnover number for DCPIP approached 100 at pH 6.0. For benzoquinones herein (
Figure 3,
Figure 4 and
Figure 5) and in prior work, turnover numbers were ~200 and the ratio of EDTA electron donor to MB was also lower at 1000:1 vs. 2000:1 for DCPIP.
Clearly, DCPIP is more difficult to photoreduce because attempts to photoreduce it with pheoA, our most extensively studied chlorophyll metabolite, were unsuccessful. Optimized conditions using pheoA and TEOA (ratio of TEOA:pheoA = 2000) as the electron donor in 20% DMF consistently results in ~50 turnovers for multiple benzoquinone and naphthoquinone substrates [
9,
10]. We suspect this is at least partially due to the pH dependence shown in
Figure 2. The higher pH required for TEOA electron donation is at odds with the greatly enhanced DCPIP photoreduction at lower pH values [
9]. EDTA does not serve as an electron donor with pheoA due to charge repulsion and/or differences in polarity [
8].
Azobenzenes are the only other class of molecules besides quinones reported to be photoreduced by chlorophyll metabolites. Using tin-substituted pyropheophorbide A, electron donors and red light, Dutta et al. reported azobenzene photoreduction on a nucleic acid template [
40]. In their work, only five turnovers were detected.
Multiple experiments support a role for
1O
2 in our DCPIP photoreduction studies with MB and EDTA (
Figure 1B). H
2O
2 was detected using HRP, an enzyme that uses H
2O
2 to oxidize a co-substrate. Our results confirm that photoreduced DCPIP (colorless) served as a co-substrate in the HRP reaction (
Figure 1B) and that blue DCPIP (
Scheme 2) was further oxidized by HRP when H
2O
2 exceeded the concentration of photoreduced DCPIP. Because HRP oxidizes a broad range of organic molecules, including phenol, this result was not unexpected. It was confirmed in an independent control experiment where stable, blue DCPIP was mixed with HRP and known amounts of H
2O
2 (
Supplemental Figure S3).
While this second DCPIP oxidation by HRP complicated H
2O
2 quantitation in
Figure 1B, it identified DCPIP as a potentially useful HRP co-substrate. With its molar absorptivity of 19,100 M
−1 cm
−1 at 605 nm and pH 7.4 (
Supplemental Figures S1 and S2), DCPIP is nearly as sensitive as TMB, a commonly used HRP co-substrate that absorbs strongly at 652 nm or at 450 nm under acidic conditions [
41].
Consistent with prior work using quinones, histidine increased DCPIP photoreduction and decreased H
2O
2 formation by scavenging
1O
2 (
Figure 1C). Histidine competes with photoreduced DCPIP for
1O
2; this limits reoxidation of DCPIP and, consequently, the photochemical redox cycling that is depicted in
Scheme 3 and
Scheme 4. Further, histidine oxidation to oxo-histidine by
1O
2 removes O
2 from the solution so that it is not available to react further. This differs from
1O
2 scavenging by azide, where O
2 is regenerated [
34,
35].
Published rate constants for the reaction of quinols with
1O
2 are ~10
9 M
−1 s
−1, which are several orders of magnitude greater than for the reaction of
1O
2 with tertiary amines (~10
5 M
−1 s
−1) [
37,
42]. Once reduced DCPIP or a quinol are available, they are the primary targets for
1O
2 and the likely source of H
2O
2. When photoreduction is first initiated and quinols are absent, any
1O
2 generated would react with tertiary amine electron donors, according to Equation (3).
Inspired by the Hill reaction, where DCPIP acts as an artificial electron donor in studies of intact chloroplasts, we explored electron transfer from photoreduced quinones to DCPIP. This proved to be a rapid and sensitive method to detect quinols. The DCPIP absorbance change at 605 nm is far removed from those of quinone substrates and chlorophyll metabolites at 300–400 nm.
Figure 3B,
Figure 4B and
Figure 5B highlight the challenges of using pheoA for photoreduction of quinones because their absorbances overlap. Chlorin e6, another chlorophyll metabolite of interest, has an even more intense absorbance at ~400 nm than pheoA [
43]. Tertiary amines are not physiologically relevant electron donors; if NADH or a nicotinamide derivative were a physiological electron donor, it would be difficult to detect photoreduction because they absorb at similar wavelengths [
44].
Electron transfer between photoreduced CoQ
0 or methoxyBQ and DCPIP was successful and resulted in detection of 95–100% of the photoreduced quinones (
Figure 3D and
Figure 4C). The cuvette format for mixing DCPIP and quinol was more accurate than the 96-well plate, even though the same solutions were mixed. Both photoreduced quinol and reduced DCPIP are susceptible to air oxidation, a process that is more likely in a plate well. Further, the reaction of DCPIP and quinol worked well regardless of the photosensitizer and electron donor combination employed for reduction. This is important because this assay is needed for photoreduction processes mediated by chlorophyll metabolites, not MB.
Incomplete electron transfer from methylBQ to DCPIP (
Figure 5C) was initially confusing; however, a review of reduction potentials for substituted benzoquinones provided some clarity. Unsubstituted 1,4-benzoquinone is most easily reduced based on its reduction potential of 0.10 V at pH 7 [
26]. MethylBQ has a reduction potential of 0.023 V but those of ubiquinone and more substituted benzoquinones are negative [
26]. Reduction potentials of naphthoquinones are generally more negative than benzoquinones [
45]. Based on these values, the more difficult it is to reduce a quinone (more negative E°
red), the more readily it reacts with DCPIP.
Because methylBQ, with its slightly positive reduction potential, is easier to reduce relative to CoQ
0 and methoxyBQ, once reduced, it is less likely to react with DCPIP (
Figure 5C). By increasing the ratio of DCPIP to reduced methylBQ, more electron transfer occurred but it was still incomplete (
Figure 5C). Additionally, this explains why HQ did not react with DCPIP regardless of pH and after incubation for up to 10 min. Conversely, while the DCPIP reactions of reduced CoQ
0 and methoxyBQ were complete within 1 min, that of reduced 1,4-naphthoquinone occurred within the mixing time (5−10 s). Thus, the rate and extent of electron transfer to DCPIP provides a method to rank quinone reduction potentials in addition to its goal of reduced quinone quantitation [
45].
The results herein expand our understanding of the photoreduction capabilities of MB and pheoA and the tertiary amine electron donors that are required. DCPIP is the first substrate we have identified that can be photoreduced by MB, but not by pheoA. Successful photoreduction by MB and EDTA confirms a common mechanism of concurrent photoreduction and photo-oxidation of newly reduced quinol by 1O2 that generates H2O2.
Electron transfer from photoreduced quinols to DCPIP is a rapid and sensitive method to investigate quinone photoreduction by chlorophyll metabolites. In particular, this will be effective as we seek to identify a physiologically relevant electron donor and to test substrates other than quinones. In vivo, we do not expect photocatalytic turnovers in the 50–200 range as we have reported for pheoA and MB. Rather, even one or two cycles of photoreduction mediated by dietary chlorophyll metabolites may affect health outcomes by recycling catechol- or quinone-based antioxidants.


