Article

Observation of Blue Particles Formed by Photosensitizing Reaction on Paper Fibres of Cyanotypes

Conservation Science Laboratory of the Graduate School of Conservation, Tokyo University of the Arts, 12-8 Ueno Park, Taito City 110-8714, Tokyo, Japan
*
Authors to whom correspondence should be addressed.
Photochem 2025, 5(3), 18; https://doi.org/10.3390/photochem5030018
Submission received: 12 June 2025 / Revised: 20 July 2025 / Accepted: 21 July 2025 / Published: 23 July 2025

Abstract

Cyanotypes, known as photographs and architectural plans made by photo-reproduction from the 19th and 20th centuries, are subjects for conservation. Wet cleaning for conservation treatment has been reported to be unsuitable for cyanotypes because Prussian blue on cyanotypes is thought to move physically with the application of water. The manner in which Prussian blue is fixed onto the paper substrate is important for determining the treatment method. This study is the first step toward clarifying this mechanism. The presence of Prussian blue in cyanotypes was first confirmed using X-ray diffraction analysis (XRD). Then, the location of Prussian blue in the fibre was confirmed using optical microscopy and micro-Raman spectroscopy analysis, by observing the blue colour and by detecting its cyanide bond. With field-emission scanning electron microscopy (FE-SEM), particles approximately 20–100 nm in size were observed on the surface of cyanotype paper fibres, and particles approximately 20–50 nm in size were observed from the cross-section of the paper fibres. The location where the particles were observed agreed with the location where the blue colour was observed and cyanide bond was detected. The fact that the sensitiser solution soaked into the paper fibres and formed Prussian blue within the paper fibres when exposed to light is thought to be important for the blue fixation of cyanotypes.

1. Introduction

Cyanotypes are prints made by photo-reproduction. This process was invented in 1842 and has often been seen in forms of photographs and architectural plans from the 19th and 20th centuries. They are prepared by applying a sensitiser solution to a substrate, most often paper, and exposing it to light. The most traditional photo-sensitiser solutions are ammonium ferric citrate and potassium ferricyanide, which create Prussian blue on a substrate through photo-reduction: it is explained that FeIII salt is reduced to FeII and reacts with potassium ferricyanide (K3[FeIII(CN)6]) to form Prussian blue (AaFeIIIb[FeII(CN)6]c•xH2O) [1] (p. 6). The blue formed in the above process was scientifically confirmed to be Prussian blue in a previous study [2].
The method is able to photo-reproduce very small details of the architectural plans and print fine gradations of blue seen in photographs and artworks utilising the cyanotype methods. For printing to be possible, Prussian blue should remain in the same location on the substrate as where it was formed. Over the years, commercial papers such as Willock’s formulae are known to include gum arabic [3] (p. 61); however, discussing the traditional cyanotype recipe [3] (p. 104), no binders are used to bind the Prussian blue on paper. Despite the absence of binders, Prussian blue does not come off easily: simply, our hands do not get blue when we touch the cyanotype, and not all the Prussian blue is washed away in the washing process during the cyanotype procedure. In the cyanotype process, the addition of surfactants to reduce the surface tension of the sensitiser solution and increase its absorption by paper fibres has been suggested [3] (p. 104), and the absorption of the sensitiser solution by paper fibres is thought to be important. How does the Prussian blue exist on the paper substrates?
Additionally, cyanotypes are subjects for conservation, and it is important for the Prussian blue to not be removed by conservation treatments as the blue colour forms the images on cyanotypes. Several conservation strategies for architectural cyanotypes have been reported in Japan. Architectural cyanotypes, which are used in architectural plans in the field of construction, are often found with machine oil stains, physical deterioration such as folds and tears, and unfavourable treatments from the past using staples and adhesive tapes. Conservation treatments have been reported for the cleaning of the stains [4], removing of the tapes and staples [5,6], dry cleaning, and lining of the physically damaged areas [5]. However, in terms of conservation treatments, the application of water to cyanotypes has been reported to cause risks of image loss [7,8]. Therefore, wet cleaning is often not desirable for the conservation of cyanotypes, limiting the treatment methods. The manner in which Prussian blue is fixed onto the paper substrate is important for determining the conservation treatment method. This study is the first step in clarifying the fixation of Prussian blue on the paper substrates by observing how the Prussian blue exists on paper fibres. First, the presence of Prussian blue in cyanotypes was confirmed using X-ray diffraction analysis (XRD). Then, the location of Prussian blue in the fibre was confirmed using optical microscopy and micro-Raman spectroscopy analysis, by observing the blue colour and by detecting its cyanide bond. Finally, field-emission scanning electron microscopy (FE-SEM) was used for observing Prussian blue existing on the paper fibres of cyanotypes.

2. Materials and Methods

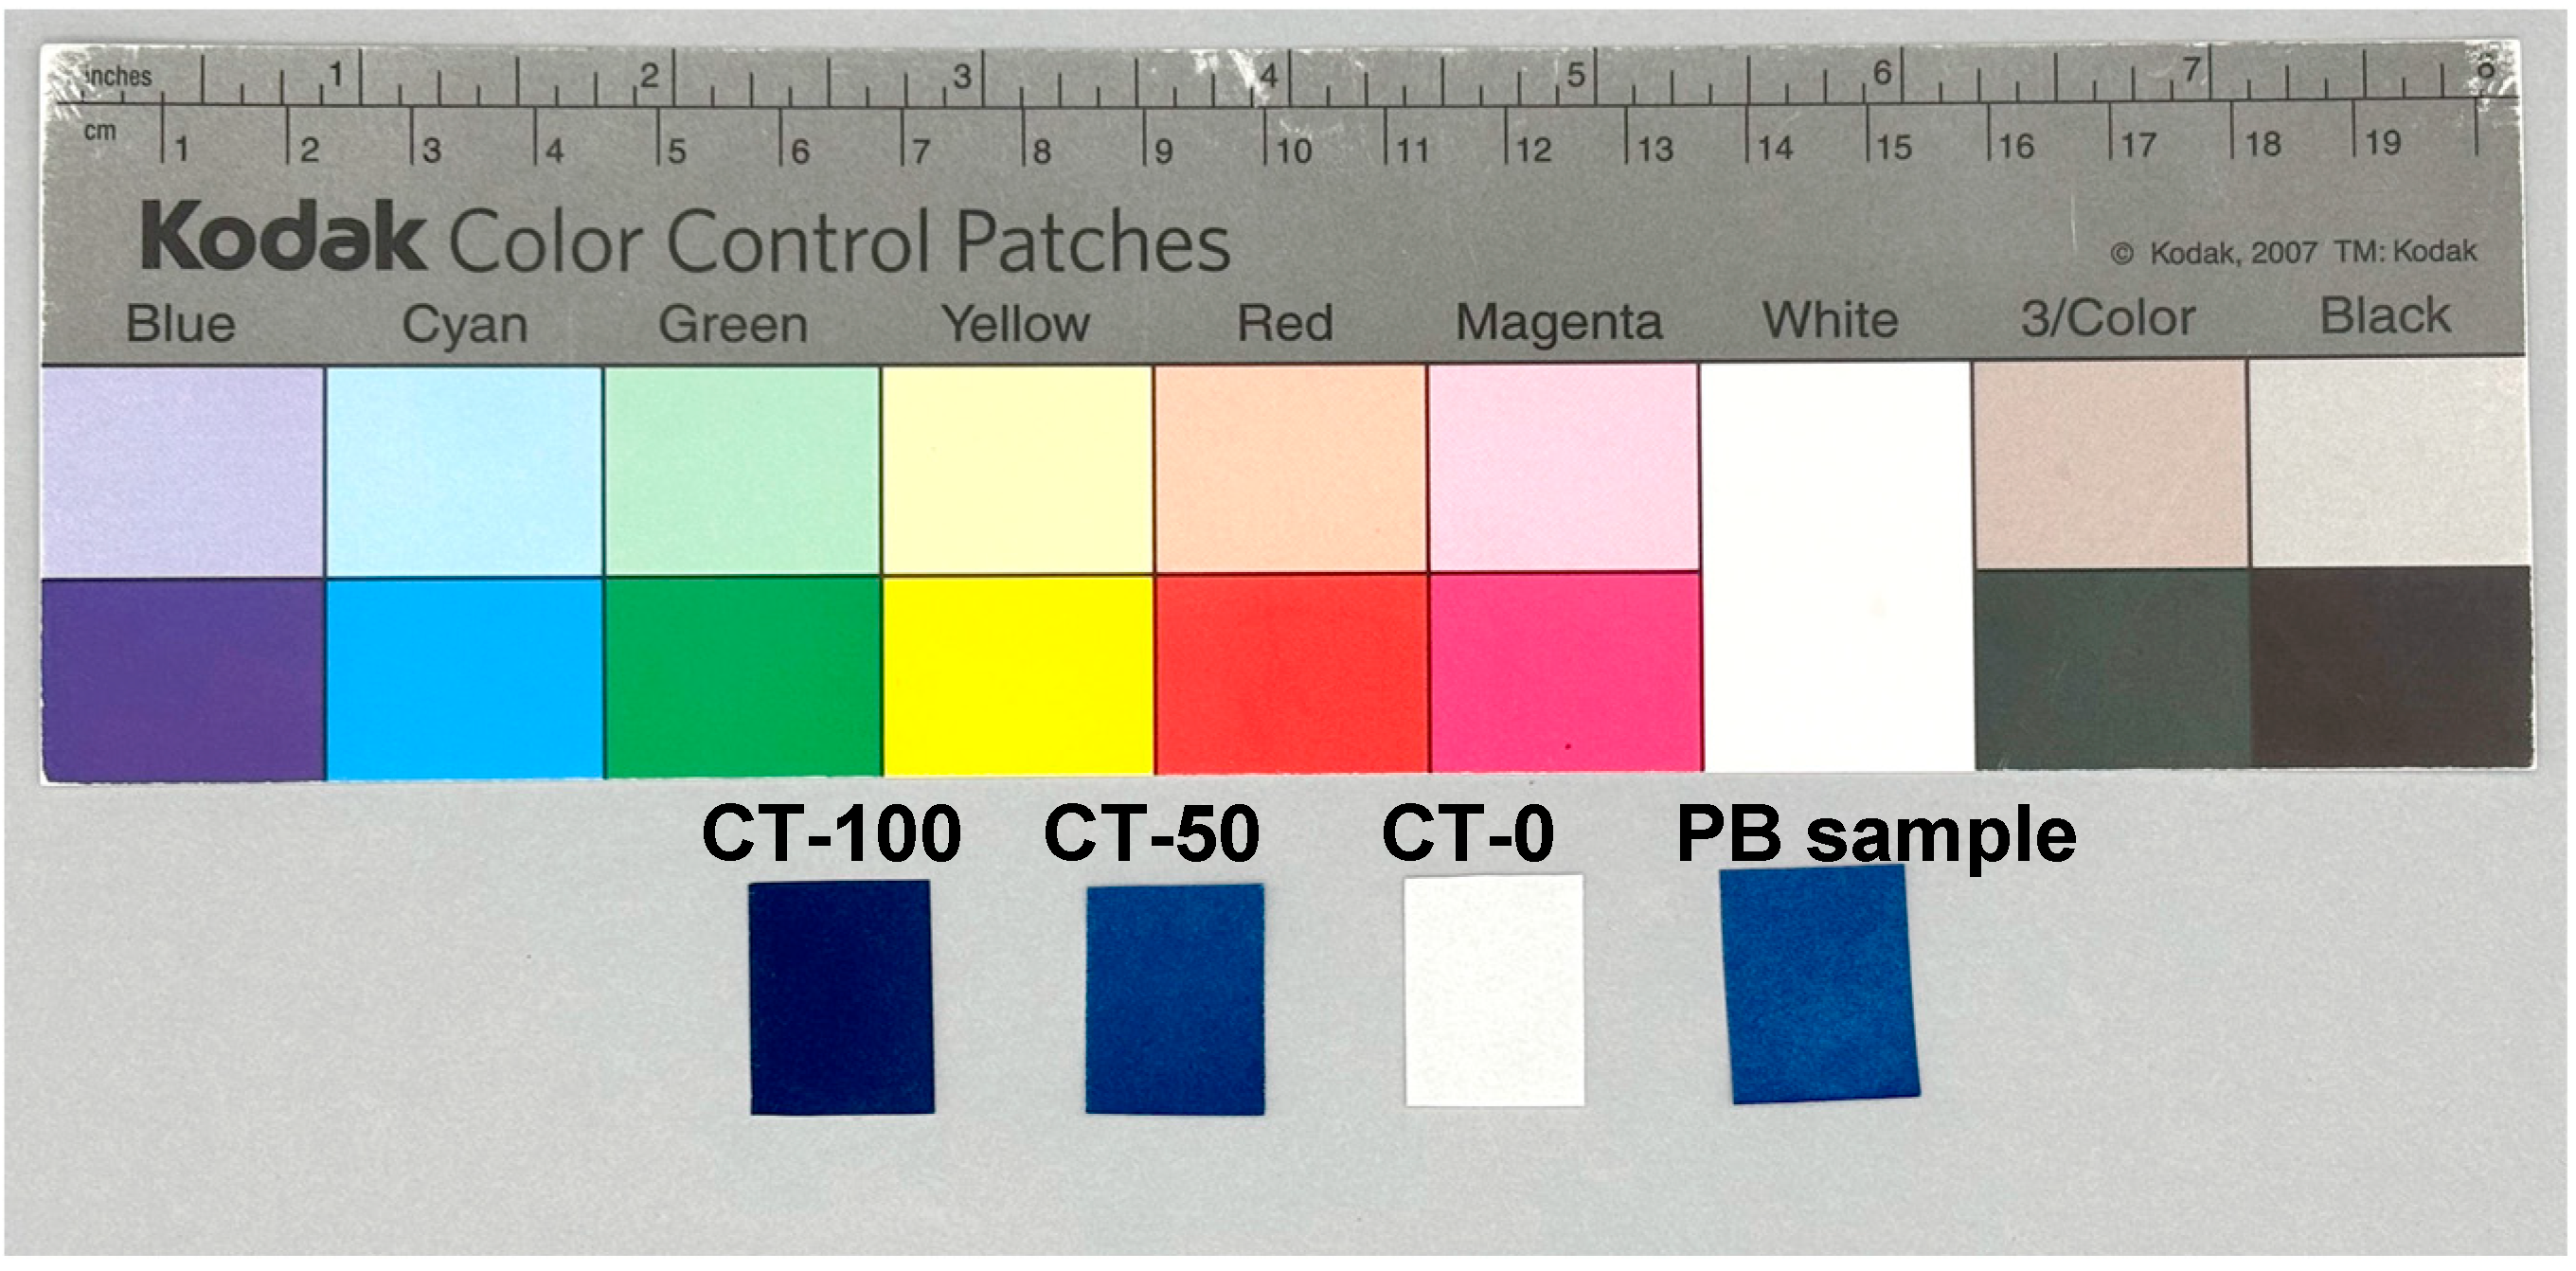
2.1. Sample Preparation

Cyanotype samples were made following the recipe of the “traditional cyanotype process” [3] (p. 104). The sensitizer solution was made by preparing ammonium ferric citrate solution (0.6–0.7 mol/dm3 FeIII) and 0.3 mol/dm3 potassium ferricyanide solution and mixing them in a 1:1 volume ratio. Each solution was prepared using chemicals of Wako 1st grade: ammonium iron (III) citrate, green and potassium ferricyanide (K3[FeIII(CN)6]). The samples were prepared using cotton filter paper (Whatman No. 1, Cytiva Danaher Corporation, Washington, DC, USA) as the substrate, and by applying the sensitiser solution with a brush. The samples were then dried and were exposed to a blacklight-blue lamp (FPL27BLB, Sankyo Denki Co., Ltd, Minato city, Tokyo, Japan).; UV wavelength range 315–400 nm with peak at 368 nm; effective radiant power of about 20,000 μW/cm2 expected to be reaching sample) for 20 min. A blacklight-blue lamp was used as the light source because cyanotypes are best sensitised by UVA lamps [9] (p. 136). During exposure, the amount of light exposed was controlled using an ND filter (ND-0.3, FUJIFILM Corporation, Minato city, Tokyo, Japan) and the samples were labelled as following: “CT-100” for samples not using filters, “CT-50” for samples using a filter cutting 50% of the light, and “CT-0” as samples applied with sensitiser solution but washed without exposure to light. After exposure, the samples were washed in distilled water for 20 min to remove remnants of the unexposed sensitiser solution.
Samples immersed in Prussian blue pigment (“PB sample”) were also prepared. The Prussian blue pigment (PG 084, Holbein Art Materials Inc., Ōsaka city, Ōsaka, Japan) was ground into a powder using a mortar and pestle. The pigment was then suspended in distilled water and was applied to a Whatman No. 1 filter paper using the hikizome technique (a traditional technique used in Japanese works to dye paper or fabric with a hake brush).
CT-100 is the main subject of observation in this research, but CT-50, CT-0, and PB samples were prepared for comparison. Images of the prepared samples are shown in Figure 1.

2.2. Observation by Microscopes
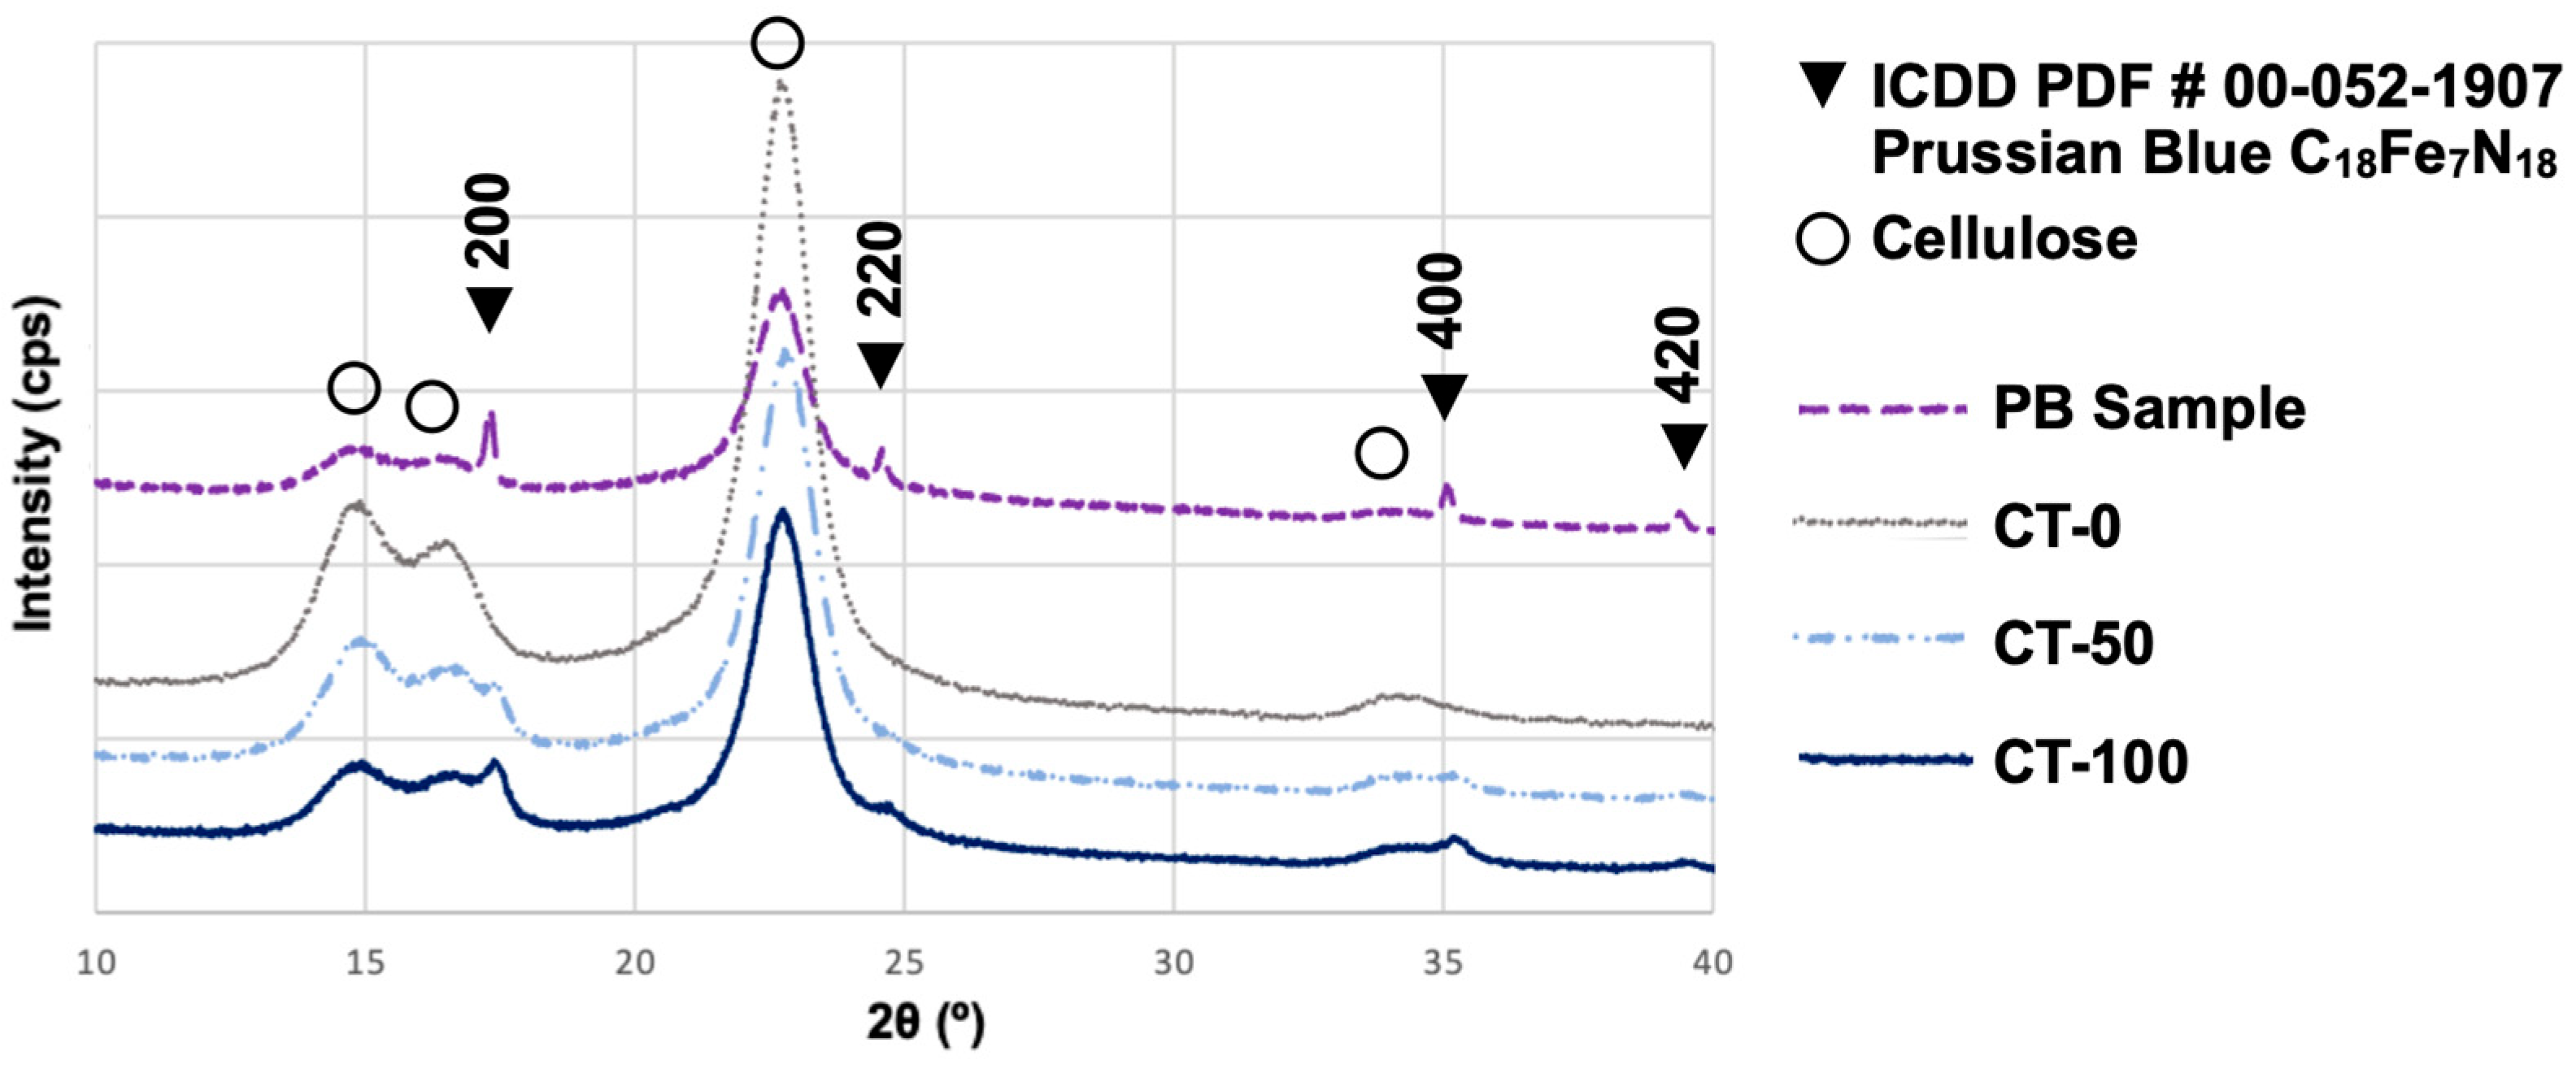
The samples were observed using two microscopes: optical microscopy (Eclipse LV100 POL, Nikon Corporation, Shinagawa city, Tokyo, Japan) and FE-SEM (SU 8000, Hitachi Ltd., Chiyoda city, Tokyo, Japan).
The cross-sections of the samples (Section 3.1) and their fibres were observed (Section 3.2) using an optical microscope. The fibres of the samples were picked out for clearer observation. The cross-sections of the samples and fibres were prepared using a knife.
For the FE-SEM observations, the samples were coated with osmium (HPC-1SW osmium coater, Vacuum Device Inc., Mito city, Ibaraki, Japan) for 10 s. To observe the cross-sections, samples were preliminarily cut using a slicer (HW-1 Multi-angle Slicer, JASCO Engineering Co., Ltd., Hachiōji city, Tokyo, Japan) and prepared using a cooling cross-section polisher (IB-19520CCP, Japan Electron Optics Laboratory Co., Ltd., Akishima city, Tokyo, Japan); under conditions of 4.0 kV, 10 s ion beam on/off interval, and cooling of −20 °C). With the cross-section polisher, automatic swinging of ±30° was utilised. The cross-sections were also coated with osmium for observation. The samples were observed using FE-SEM under conditions of 1.0–2.0 kV, 7–10 μA, using an SE(UL) detector.

2.3. XRD Analysis

XRD analysis (Ultima III, Rigaku Corporation, Akishima city, Tokyo, Japan) was used to confirm the presence of Prussian blue on the cyanotype samples. The analysis was held under conditions of 40 kV, 50 mA, Cu Kα X-ray source, sampled every 0.01°, and scanning speed of 5.0°/min.

2.4. Micro-Raman Spectroscopy Analysis

Micro-Raman spectroscopy analysis (Thermo Scientific DXR3 Raman Microscope, Thermo Fisher Scientific Inc., Waltham, MA, USA) was used to confirm the presence of cyanide bonds characteristic of Prussian blue in the cross-section of the paper fibres of the cyanotype samples. The analysis was held at 2 locations per each area of CT-100 and PB samples: areas surrounding the cross-section of a paper fibre (numbering s-1 and s-2) and areas within the cross-section of a paper fibre (i-1 and i-2). The analysis was made using the 532 nm laser, under conditions of laser power of 2.5 mW, analysis duration of 5.0 s, averaging of 2 analyses per spot, and setting 25 μm pinhole as the slit. The instrument has a 540 nm resolution on ideal samples with 1.7 μm in terms of depth [10]. The results presented were processed by automatic baseline correction and normalisation in the range of 50 to 3500 cm−1 using the OMNIC software (OMNIC for Dispersive Raman 9.16.159).

3. Results and Discussion

3.1. Mechanism of the Cyanotype Method

The cross-sections of cyanotype samples obtained by optical microscopy are shown in Figure 2. As shown in Figure 2a, the sensitiser solution was observed to be applied entirely to the observed cross-section. When comparing the cyanotype samples, the more the exposure to light, the bluer fibres were formed in the inner part of the cross-section, deeper from the surface exposed to light (Figure 2b,c). No blue colour was observed for CT-0 (Figure 2d). This indicates that even when the sensitiser solution is applied, only the areas exposed to sufficient light develop a blue colour due to Prussian blue formation.
XRD was performed to confirm that the blue substance formed on the cyanotype samples was Prussian blue. The results of this analysis are shown in Figure 3. Peaks corresponding to cellulose and Prussian blue were observed using the PB sample. Peaks were observed at the same locations for CT-100 and CT-50, indicating the presence of Prussian blue peaks in the cyanotype samples. For the cyanotype samples, Prussian blue peaks were observed at higher intensities for CT-100 than for CT-50. However, for CT-0, only cellulose peaks were observed, and Prussian blue peaks were not observed. Comparing the results with those in Figure 2, Prussian blue peaks were observed in the blue samples. Previous research [2] has confirmed that the blue precipitate formed using the cyanotype method in solution form is Prussian blue. The fact that Prussian blue peaks were detected in the blue cyanotype samples agrees with previous research and supports the previously explained mechanism [1] (p. 6) of the cyanotype process.

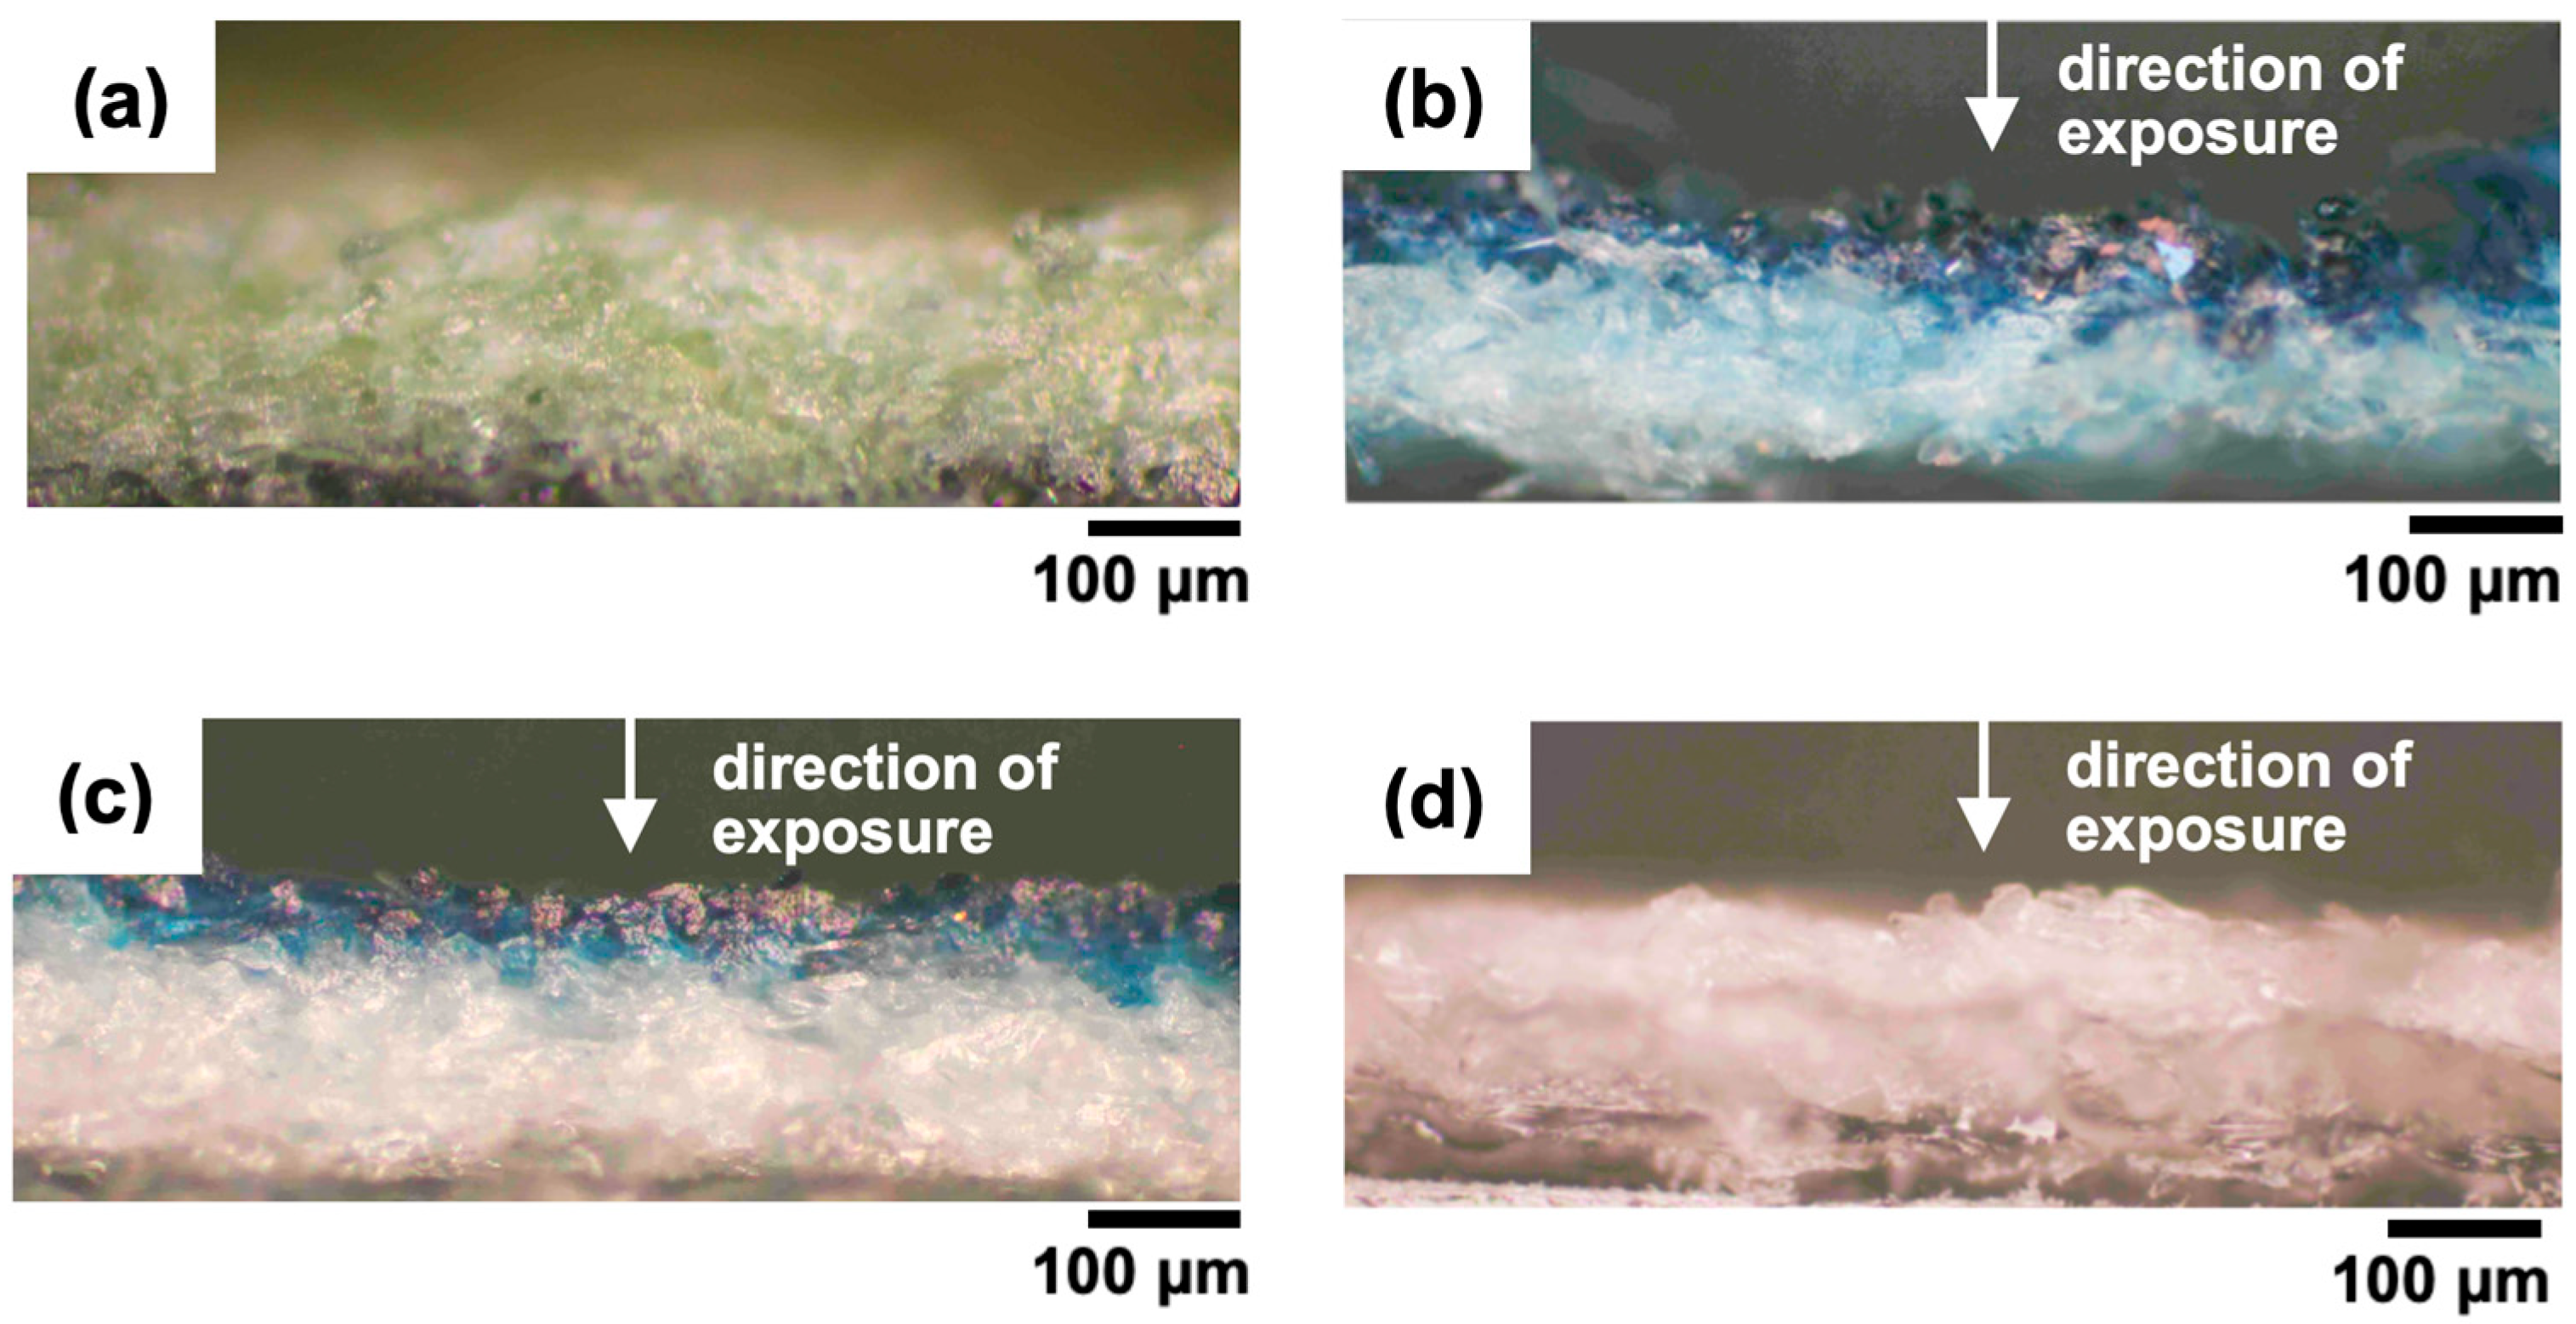
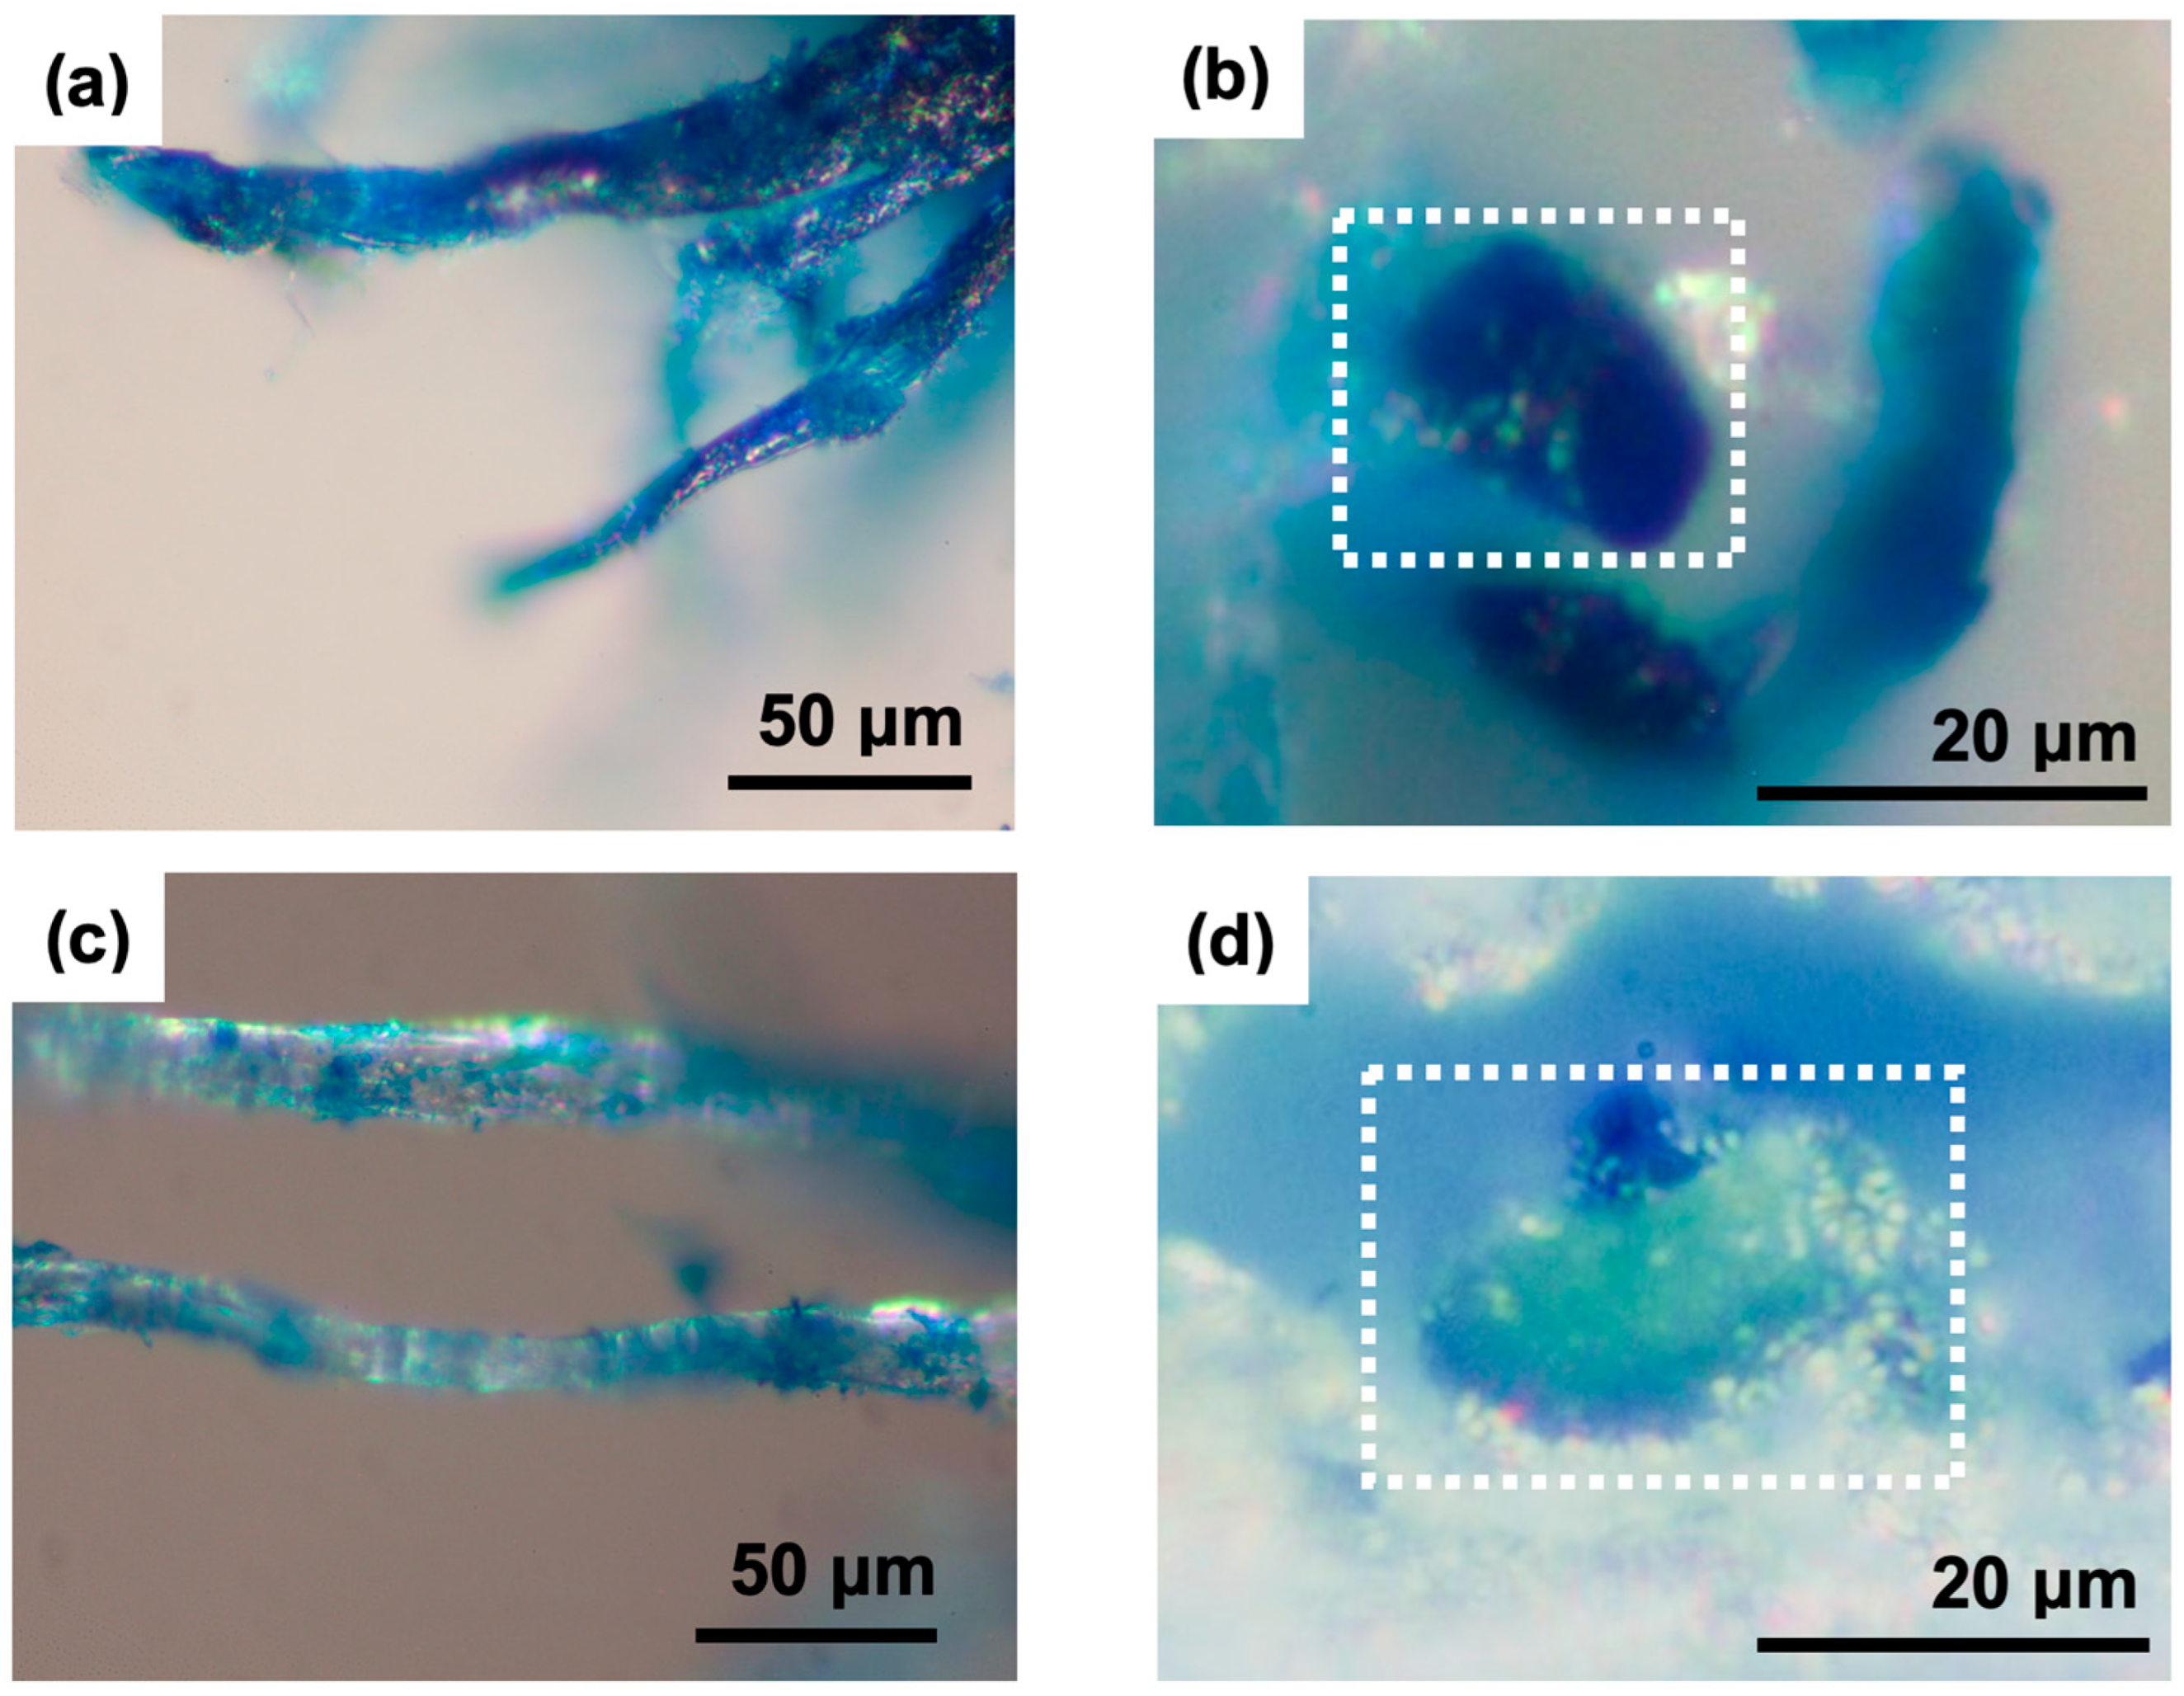
3.2. Comparison of Cyanotype Sample and PB Sample Using Optical Microscope

The blue fibres found in the cross-sections of the cyanotype samples (Figure 2) were focused for observation. Figure 4 shows a comparison in observation between the blue fibres of the CT-100 and PB samples. For the PB sample, the pigment particles were distinguishable from the paper fibres, and blue particles were observed on the surfaces of the paper fibres (Figure 4c). The surfaces of the fibres were not evenly covered with blue pigments; the blue pigments occasionally existed in clusters, partly showing fibres not dyed blue. However, for CT-100, the Prussian blue particles were hardly distinguishable, and the paper fibres were observed as blue fibres (Figure 4a).
With the observation of the cross-sections, the squared areas were focused. The cross-section of the blue fibre of CT-100 was found to be entirely blue in colour (Figure 4b), in contrast to the cross-section of the PB sample fibre, which was found not to be blue (Figure 4d).

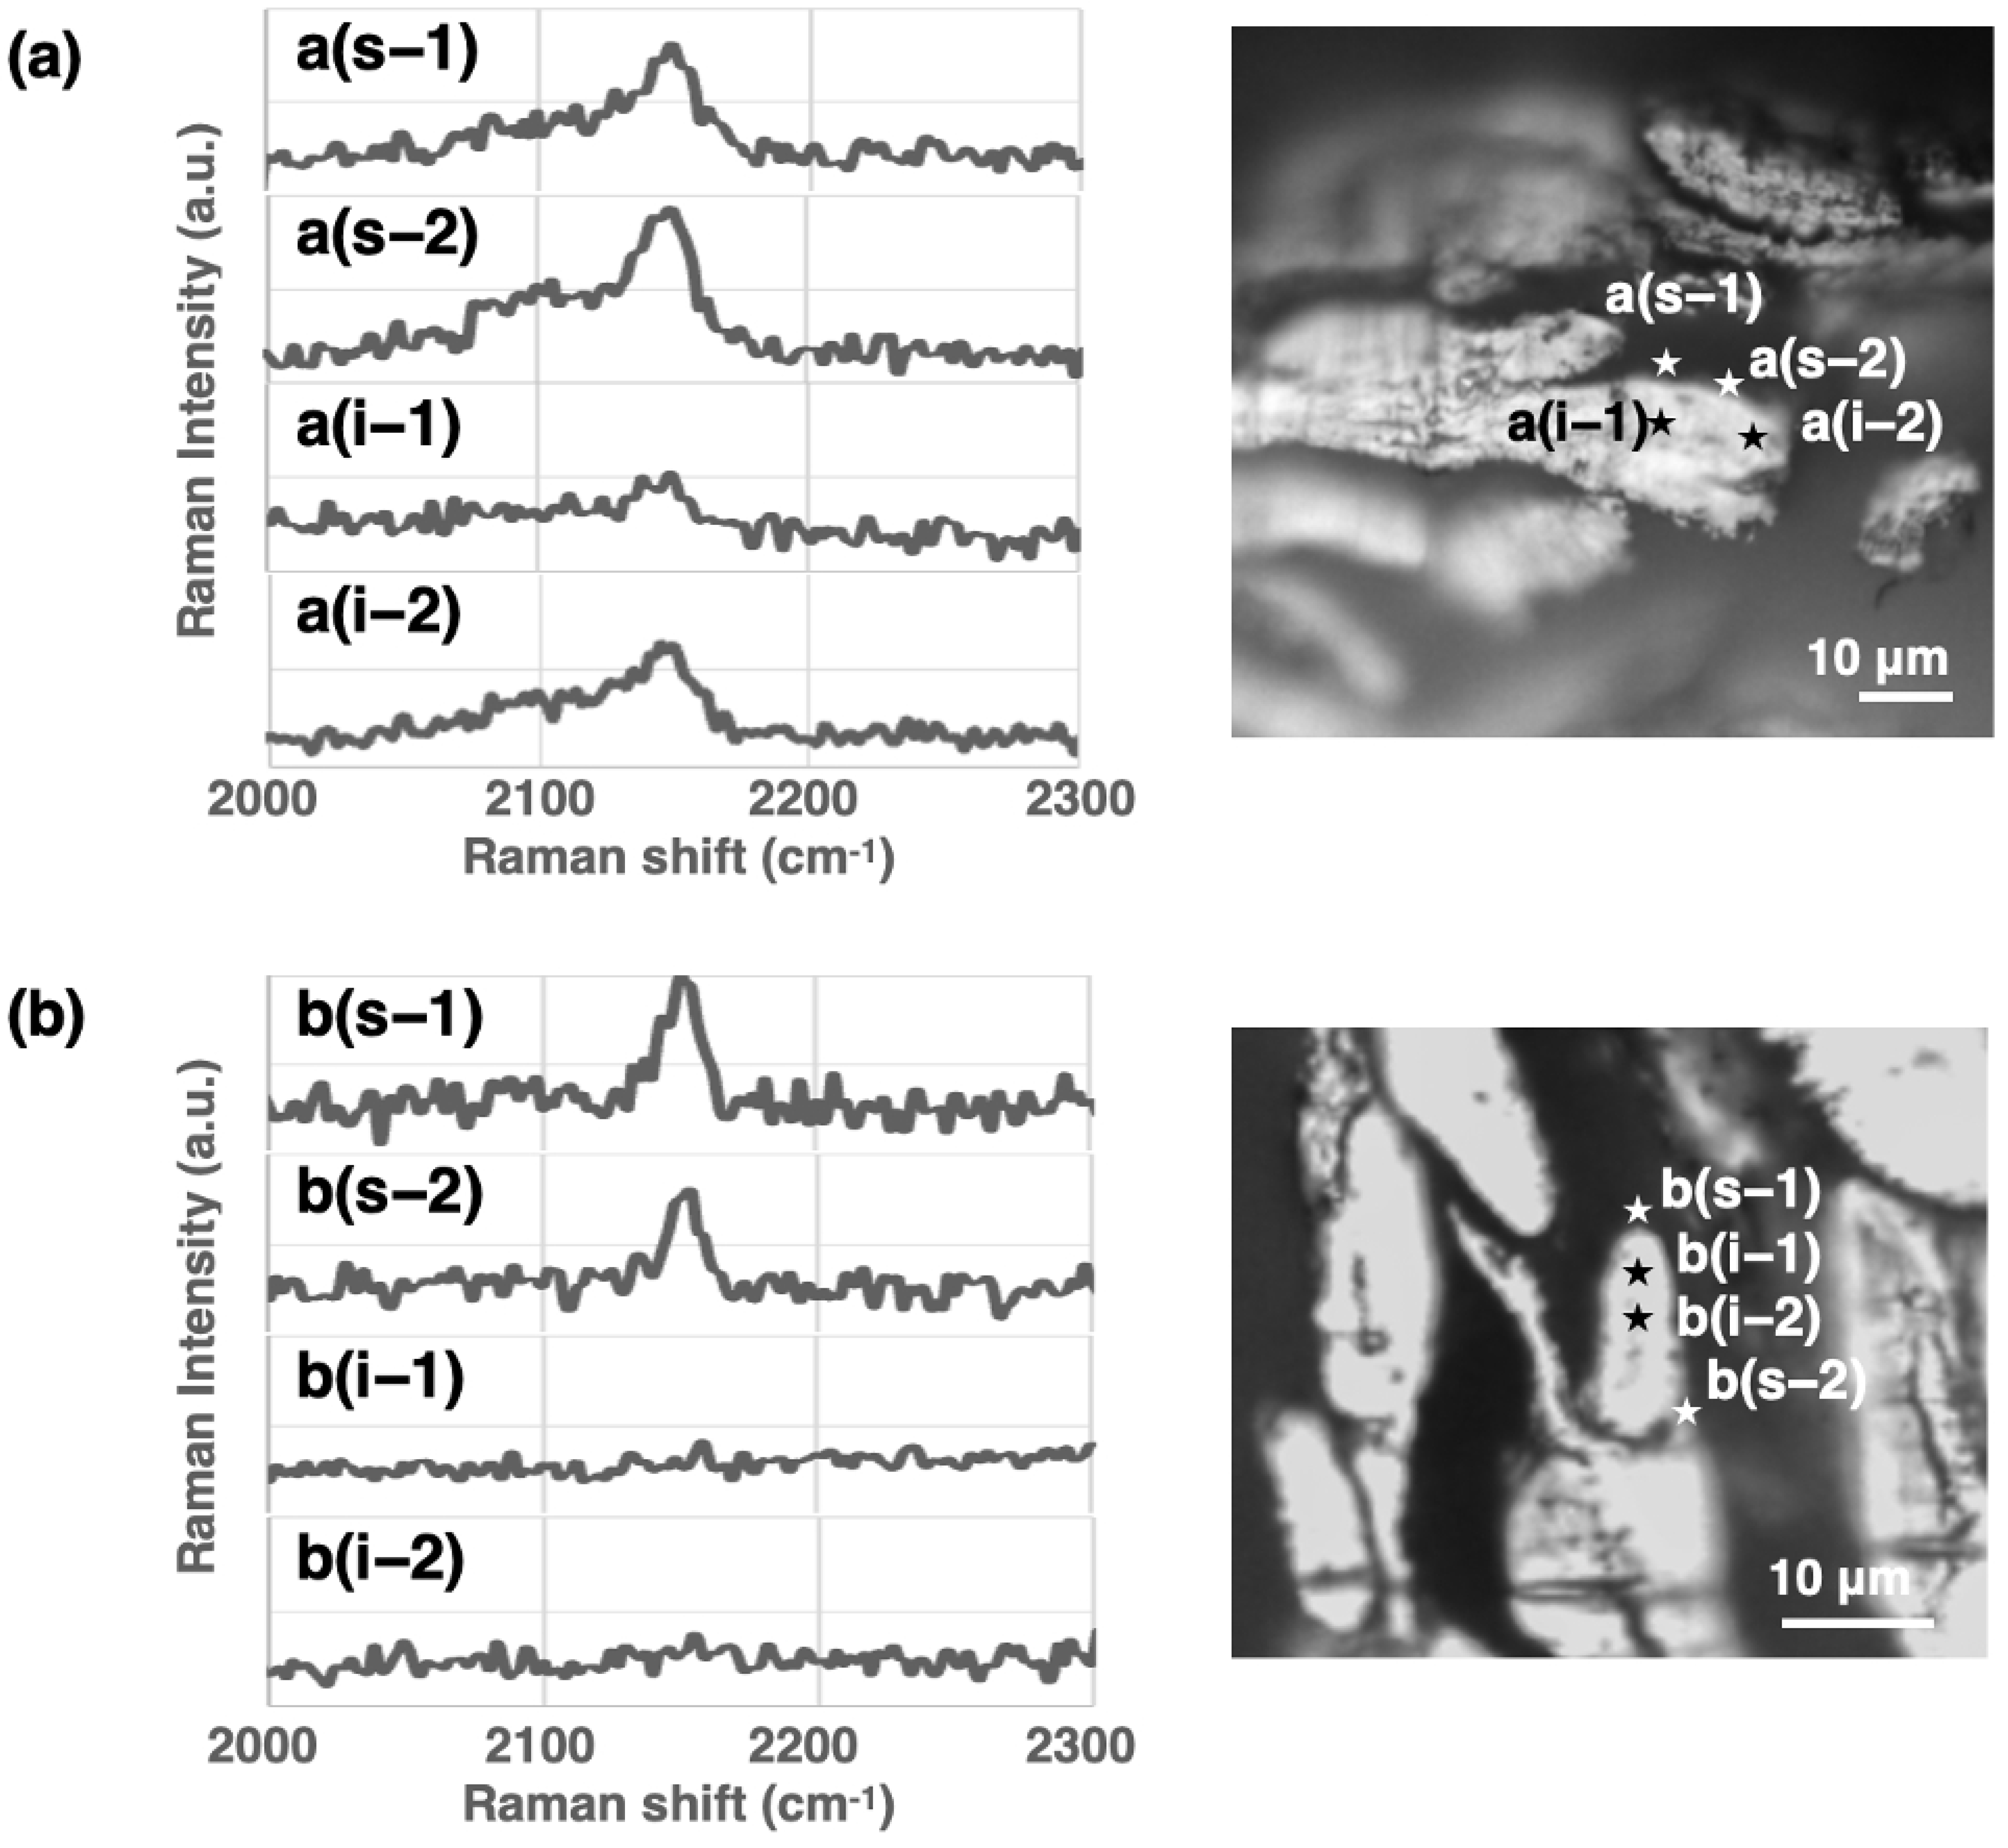
3.3. Micro-Raman Spectroscopy Analysis of the Cross-Section of the Paper Fibres of Cyanotype Sample and PB Sample

Micro-Raman spectroscopy analysis was performed to confirm that the blue colour observed in the cross-section of the paper fibres of the cyanotype samples was Prussian blue. The peak of cyanide was known to be observed in between 2000 cm−1 and 2200 cm−1 using Raman spectroscopy [11] (pp. 9709–9710). The results of the micro-Raman spectroscopic analysis on the CT-100 and PB samples are shown in Figure 5. The peak was observed around 2150 cm−1 with both the CT-100 and PB samples, indicating the presence of cyanide, most likely to be from Prussian blue. On the other hand, the location in the cross-section where the cyanide peak was observed differed for the CT-100 and PB samples. For CT-100, a peak at approximately 2150 cm−1 was observed both on the surface of the fibre (Figure 5a(s-1),a(s-2)) and within the cross-section of the blue fibre (Figure 5a(i-1),a(i-2)). However, for the PB sample, the peak around 2150 cm−1 was observed surrounding the fibre (Figure 5b(s-1),b(s-2)), but not clearly inside the cross-section of the fibre (Figure 5b(i-1),b(i-2)).
The shape of the peak of cyanide around 2150 cm−1 was observed to be different for the CT-100 and PB samples. The broadness of the cyanide peak is known to vary with the state of Prussian blue [11] (pp. 9709–9710), and further research is required to study its state in cyanotypes. Despite these considerations, a clear difference was observed between the cyanotype sample and PB sample. Together with the observations by optical microscopy in Figure 4, Prussian blue is thought to be found inside the fibres of the cyanotypes.

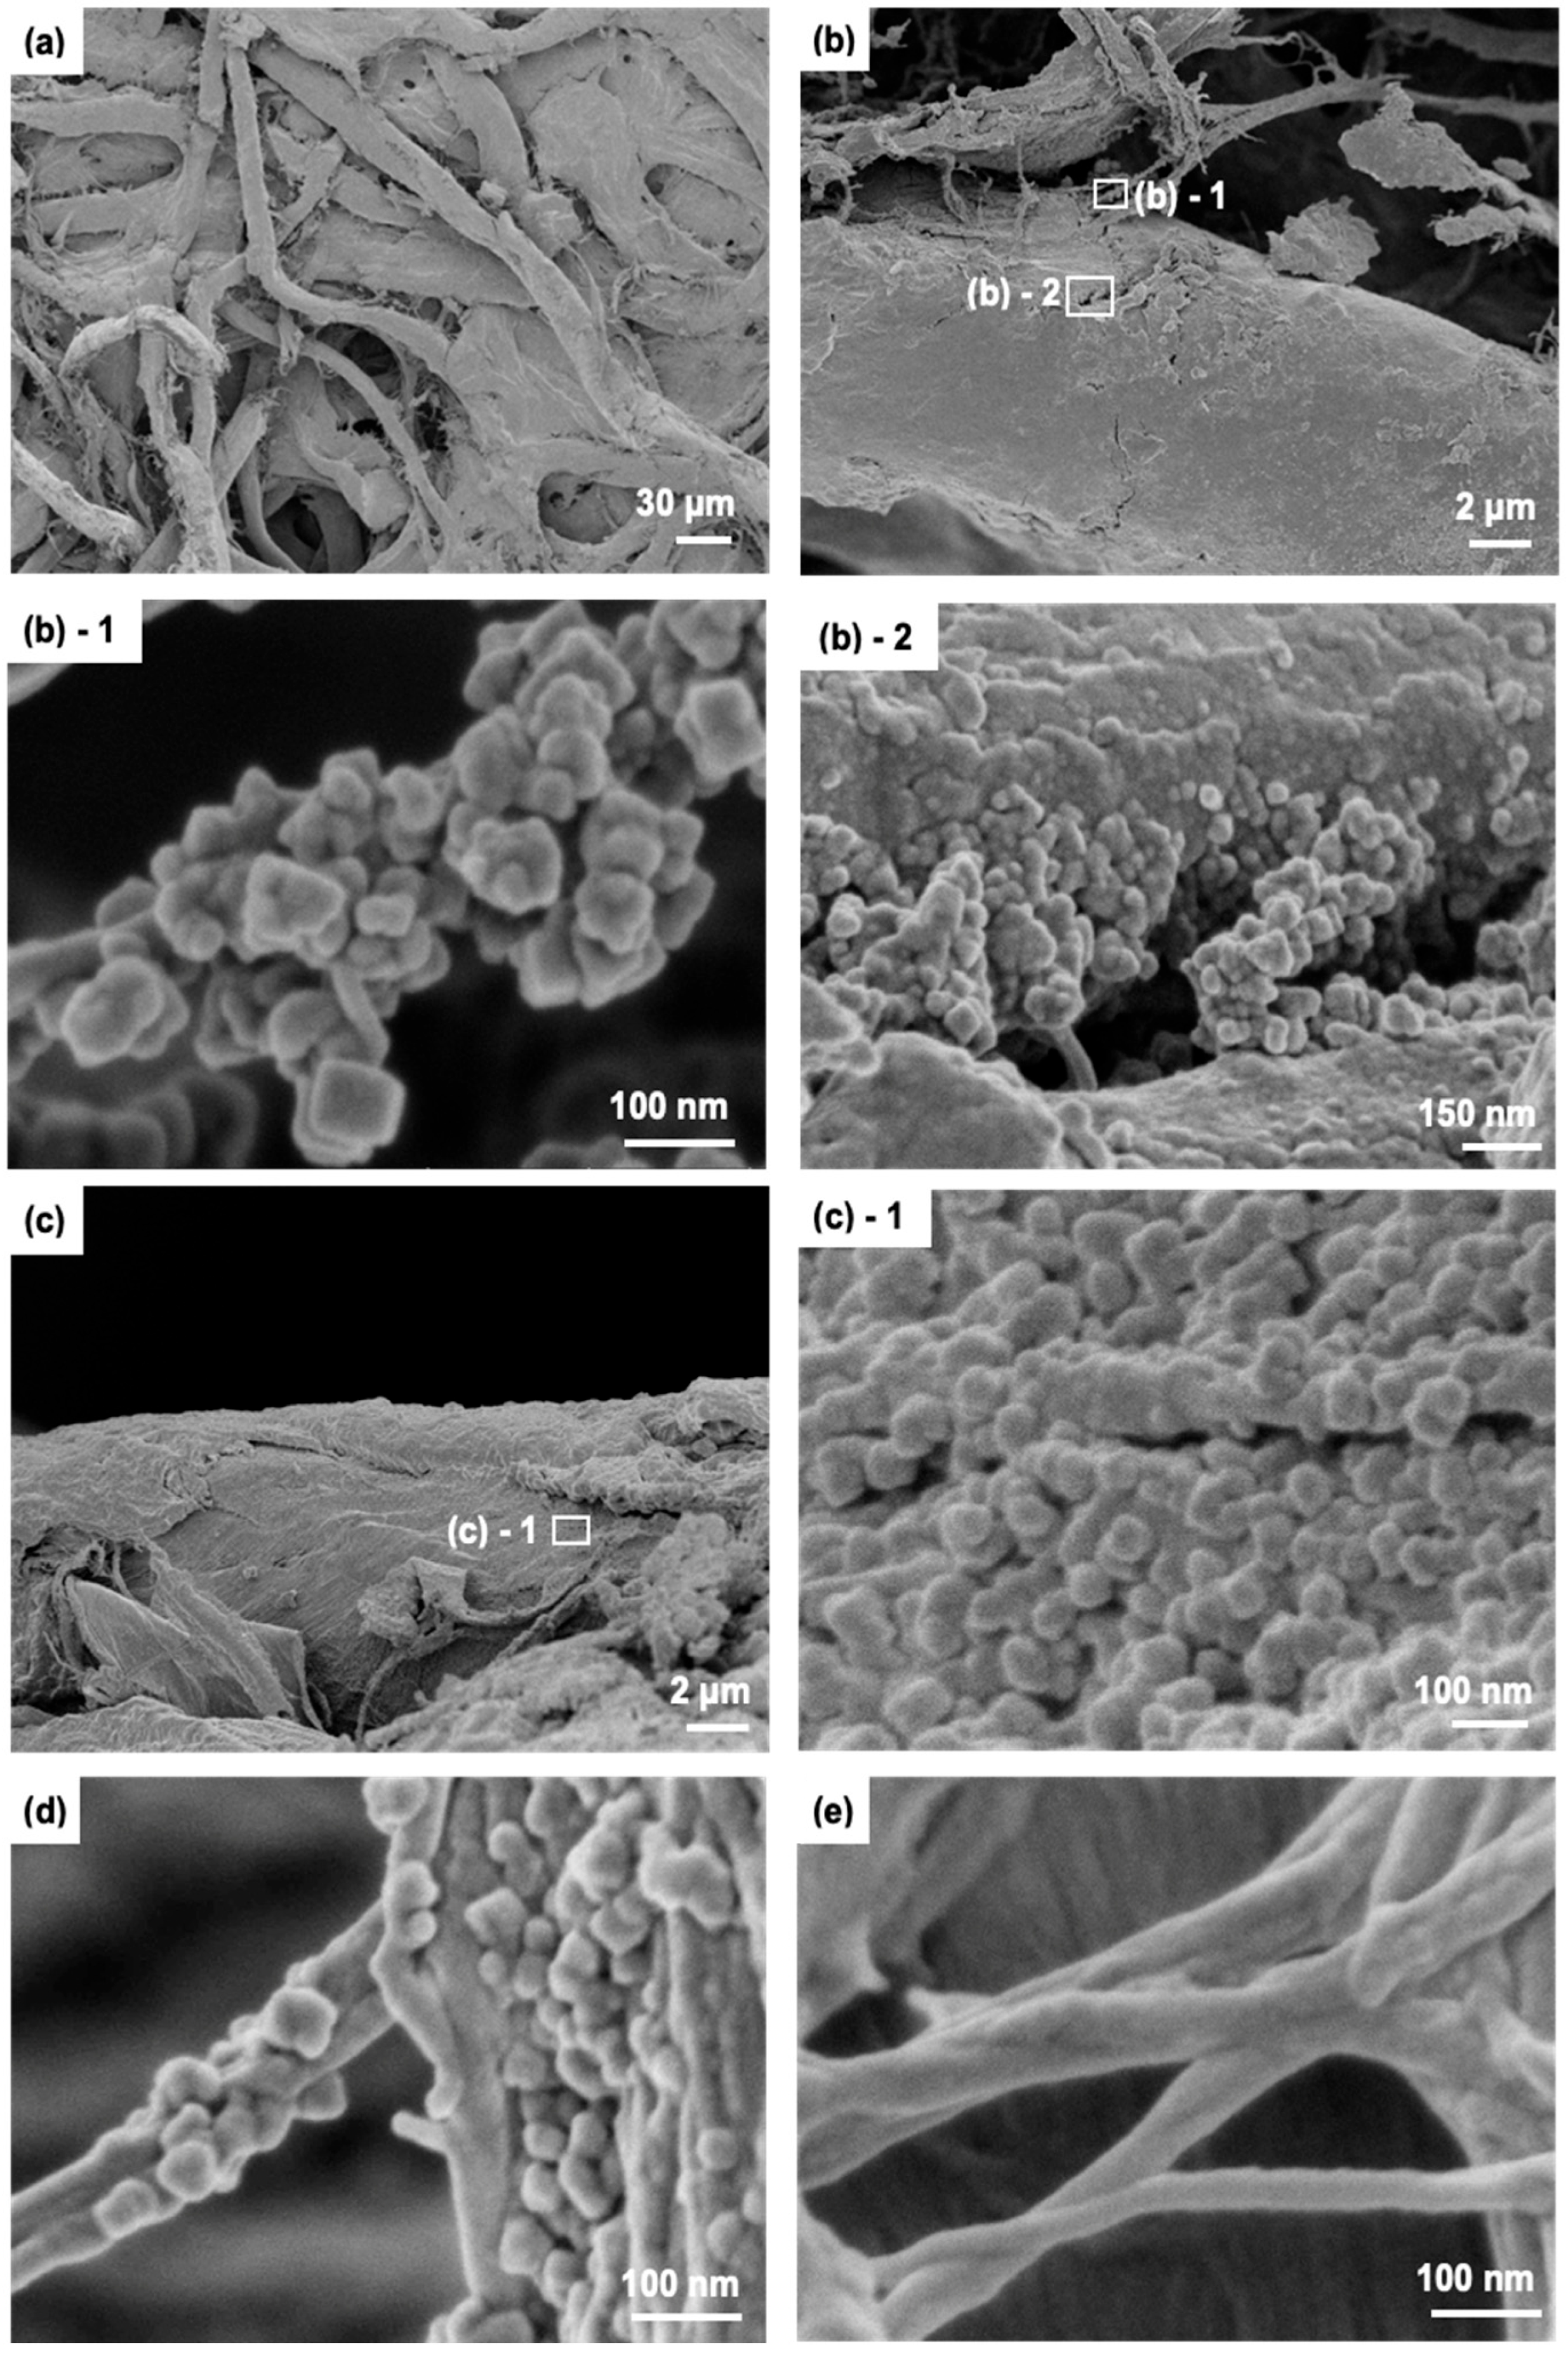
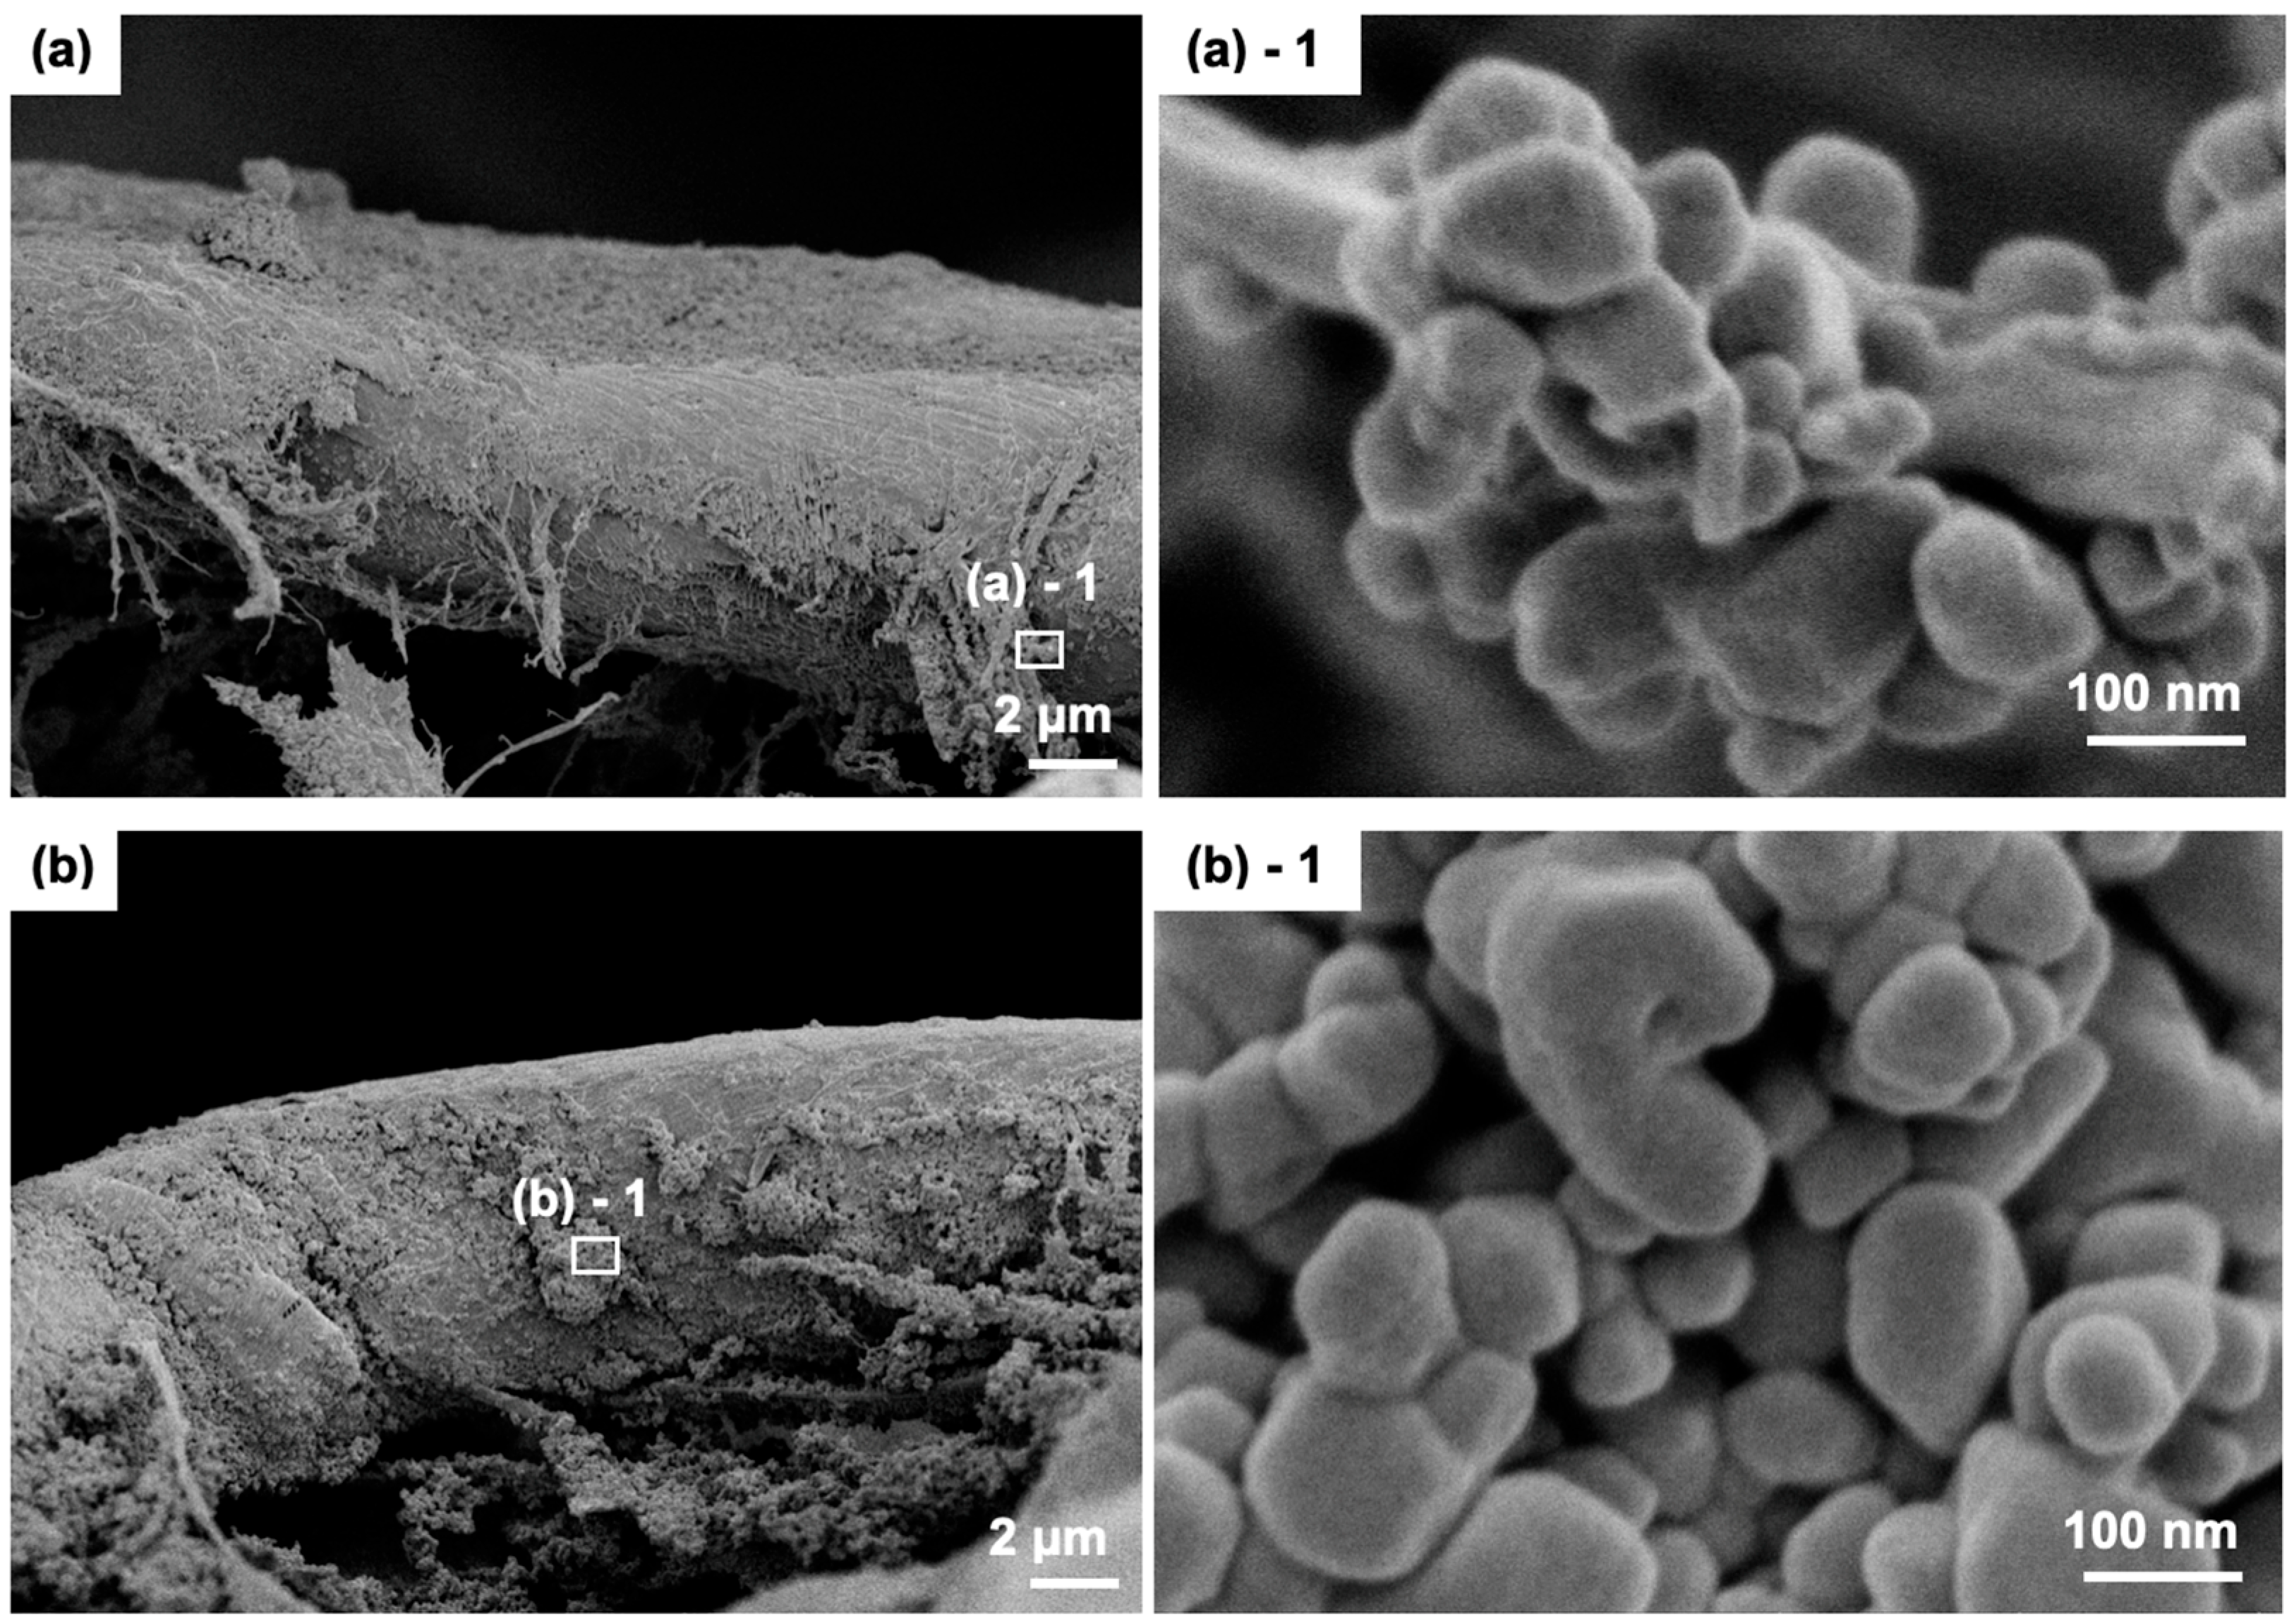
3.4. Comparison of the Surface of Fibres of Cyanotype Sample and PB Sample Using FE-SEM

The surfaces of the blue fibres of the cyanotype samples were observed under higher magnification using FE-SEM. The results of the observation of cyanotype samples are shown in Figure 6. The Whatman No.1 filter paper, used as the substrate, is known to be prepared using cotton fibre as the major raw material [12] (p. 749). Cotton fibres are reported to be around 12 to 20 μm in width [13] (p. 3). The fibres of the CT-100 were observed in Figure 6a. Figure 6b,c show the edges of two different cotton fibres of CT-100: fibre 1 showing the crack of the fibre, and fibre 2 showing the surface of the fibre. The shape and size of the particles were observed most clearly from those fixed to fibrillated fibres (Figure 6(b)-1). Particles with sizes of approximately 20–100 nm were observed. The round particles were typically observed, and cubic particles were occasionally observed. Similar particles were observed on the cracks (Figure 6(b)-2) and the surface (Figure 6(c)-1) of the cotton fibres. Figure 6d,e show the observations of CT-50 and CT-0 at the same magnification as CT-100 in Figure 6(b)-1. Particles were also observed for CT-50, but not for CT-0. The particles observed for CT-50 were similar in size to those observed for CT-100.
In comparison with Figure 2, the particles were only found in the blue samples. From previous research [2], the crystallite size of Prussian blue formed using the cyanotype method was found to be 20 nm, based on the evaluation of XRD patterns using the Williamson–Hall plot. Some of the observed particles were thought to be close to the crystallite size of the Prussian blue. Additionally, squared particles were mostly seen in CT-100, but not so much in CT-50. Similar square particles were observed from Prussian blue precipitated from the cyanotype process in previous research [2] and are possibly thought to be the result of the growth of crystallinity due to greater exposure to light. Further research is needed to determine the steps and mechanisms of the Prussian blue particle growth during the cyanotype process.
The surfaces of the cotton fibres of the PB sample were observed for comparison (Figure 7). Figure 7(a)-1,(b)-1 show the observation results of the particles on the cotton fibres under the same magnification as CT-100 in Figure 6(b)-1. In comparison with Figure 6(b)-1, the fibrillated fibres were as well focused for PB sample, and particles with sizes of up to approximately 200 nm were observed (Figure 7(a)-1). he particles appeared larger than those found on the cyanotype samples. The observed particle size agrees with that of the Prussian blue pigment studied in previous research [2]. Observations of many fibres in the PB sample showed that there were some areas where particles were attached around the fibrillated fibres (Figure 7a,(a)-1), and the surface grain of the cotton fibres were not covered entirely even, but the particles existed frequently in clusters (Figure 7b,(b)-1). The observation agrees with the clusters of Prussian blue pigment observed under an optical microscope, as shown in Figure 4c.

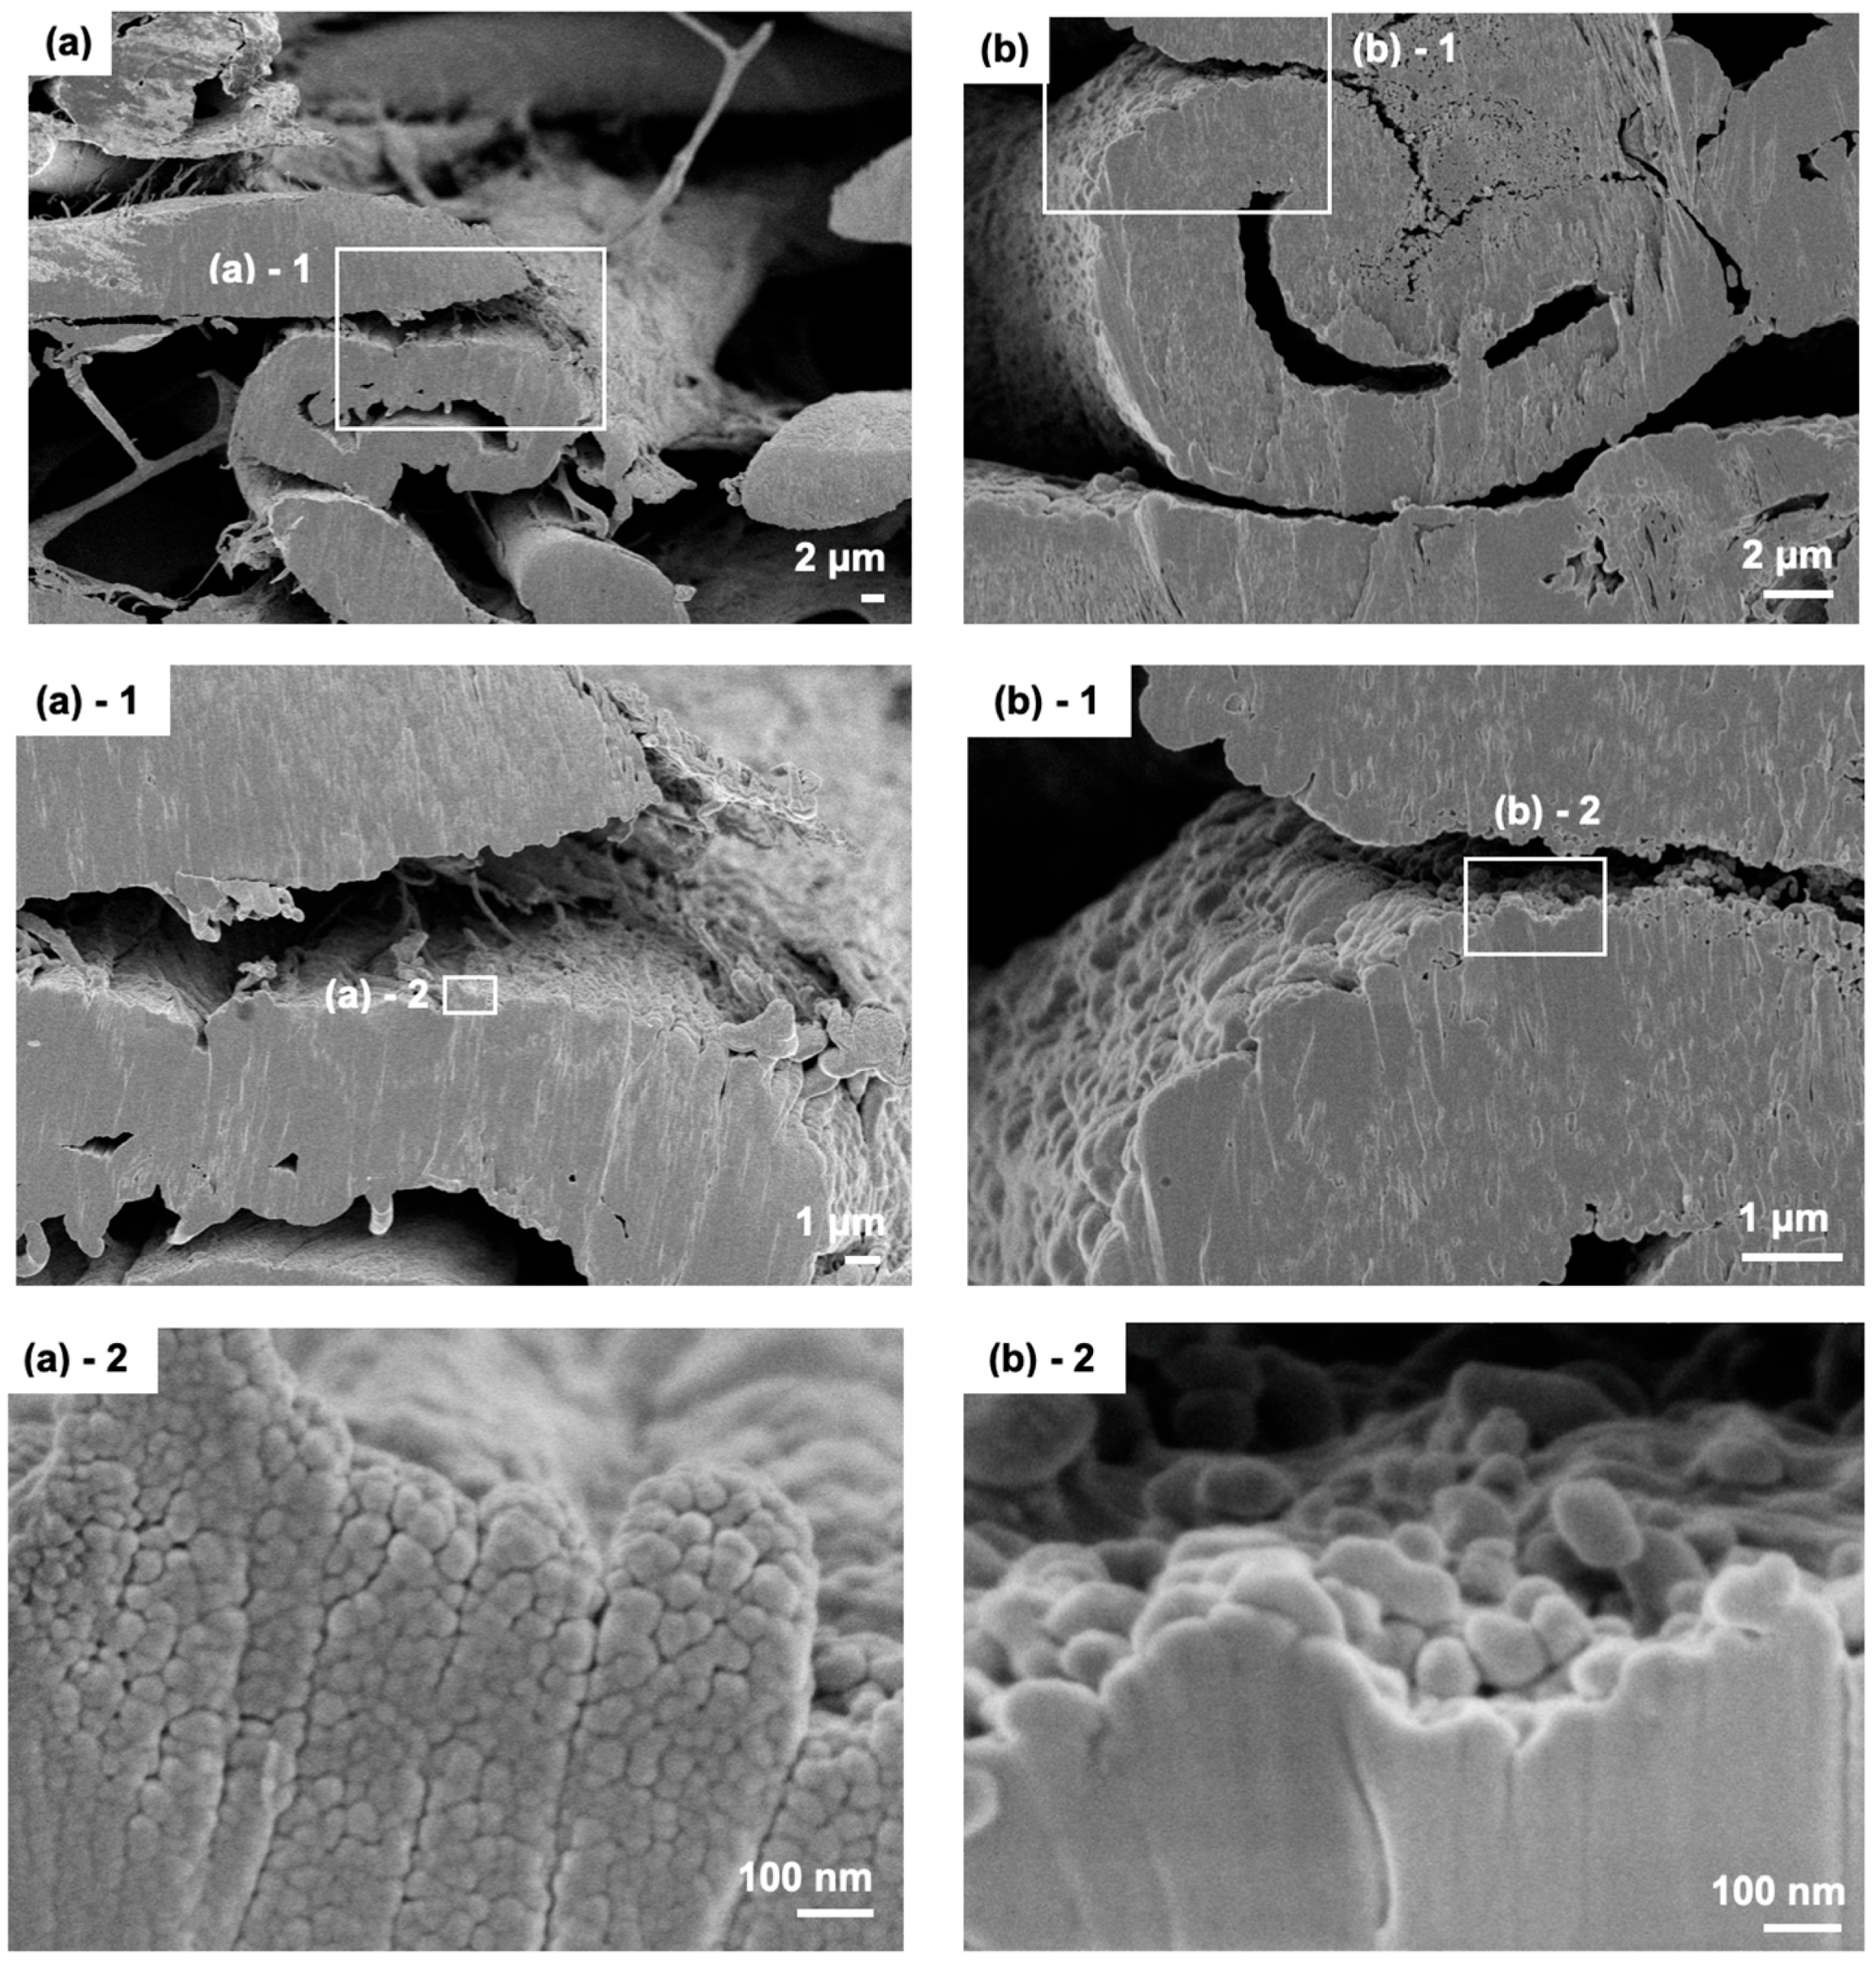
3.5. Comparison of the Cross-Section of Cotton Fibres of Cyanotype Sample and PB Sampleby FE-SEM

Particles were found to exist on the surface of the cotton fibres in both the cyanotype sample and PB sample as shown in Section 3.4. On the other hand, the cross-section of the paper fibre of CT-100 was found to be blue in Section 3.2, and cyanide bonds were detected in the cross-section of fibres by Raman spectroscopy analysis in Section 3.3. If the particles are Prussian blue, do they also exist inside the cotton fibres of the cyanotype samples? The cross-section of the blue fibres of CT-100 was also observed using FE-SEM.
Cotton fibres are composed by three layered cell walls with the lumen in the centre: from the inside, secondary wall, primary wall, and cuticle, with the primary and the secondary walls being composed of bundles of microfibrils [14] (p. 5). When observing the cross-section of CT-100, characteristics of cotton fibres were observed: the empty hole in the middle of the fibre shown in Figure 8a is thought to be a lumen [13] (p. 3). When closely observing the cross-section of the fibre near the surface of exposure, particles in sizes of approximately 20–50 nm were observed (Figure 8(a)-2). The particles observed in the cross-section were smaller to those observed on the surface of the cotton fibres in Figure 6.
In comparison, a cross-section of the fibre of the PB sample was observed. Similar to CT-100, the fibres showed characteristics of cotton fibres (Figure 8b). The particles were observed only on the surface of the cotton fibres (Figure 8(b)-2) and not inside the lumen nor in the cross-section of the fibres.
This difference indicates that the particles found in the cross-section of CT-100 were unique to the cyanotype samples. The particles were observed in the cross-section of the fibres of the CT-100 samples appearing blue (Figure 4b) with clear detection of cyanide bonds (Figure 5a). The particles were not observed in the cross-section of the PB fibres, which appeared to not be blue (Figure 4d) with cyanide bonds hardly detected (Figure 5b). This leaves the possibility that the particles are Prussian blue. This could indicate that the sensitiser solution soaked into the cotton fibres, and when exposed to sufficient light, the particles formed inside the cotton fibres.

4. Possibilities of Further Studies

The particles observed in the cross-section of the cotton fibres were observed most clearly near the edge of the fibres. Further research is needed to understand the mechanism by which Prussian blue is formed from the sensitiser solution, to study the relationship between the formation of particles and the structure of cotton fibres, and to clarify how the particles remain fixed.
If the soaking of the solution in the fibre is important for its fixation, the tendency of the treatment to cause image loss must be different for cyanotypes created on different substrates. Cyanotypes are printed on a variety of substrates such as textiles and glass. Cotton, silk, and wool are commercially available printed substrates. The cyanotype process was considered suitable because the prints could be made without the addition of binders, which are known to disturb the texture of textiles [3] (p. 65). Regarding glass, the image is fixed with a gelatin layer using a mechanism different from that found in this study [9] (p. 79). Each of the different substrates is thought to have a different tendency for image loss, and further studies are needed to clarify the types of cyanotypes which especially have high risks. Further investigation is needed to clarify the degree to which the treatments can be applied to cyanotypes.

5. Conclusions

This research focused on observing how Prussian blue is formed on the paper fibres of cyanotypes by taking samples made on Whatman No.1 filter papers as examples. The presence of Prussian blue on the cyanotype samples was confirmed by the peaks of Prussian blue observed on CT-100 and CT-50 using XRD, and the existence of cyanide bonds in the cross-sections of the paper fibres of the cyanotype samples using micro-Raman spectroscopy analysis. When observing CT-100 using an optical microscope, distinguishing the particles was difficult on the paper fibres. The cross-section of the paper fibres appeared blue, as if the paper fibres were dyed in blue. Observations under higher magnification were required to observe Prussian blue on the paper substrate. When further studied with FE-SEM, particles approximately 20–100 nm in size were found to form on the surface of the cyanotype cotton fibres. Particles were also found in the cross-section of the cotton fibre, except for those with smaller sizes of approximately 20–50 nm. The difference in the size of particles between the surface and cross-section was left unanswered, and further research is needed to study the formation of particles. Particles in the cross-section of cotton fibres were only observed in the cyanotype samples and not in the PB sample, indicating that the particles observed in the cross-section of the cotton fibres are unique to cyanotypes. Together with the fact that the cross-sections of the fibres of the cyanotype samples appeared blue and that the cyanide bond was confirmed in the cross-section of the fibres, a possibility that the particles are Prussian blue exists.

Author Contributions

S.S. prepared CT samples, acquired data using FE-SEM, optical microscopy, XRD, and Raman spectroscopy analysis, prepared all figures, and wrote the manuscript. M.K. provided advice on the observations by optical microscopy and acquired data by FE-SEM. K.K. prepared the PB sample and provided advice throughout the research: on sample preparation, data acquisition, data interpretation, and writing the manuscript. All authors have read and agreed to the published version of the manuscript.

Funding

This work was funded by Grant-in-Aid for JSPS Fellows (grant number 24KJ1034).

Data Availability Statement

The data that support the findings of this study are available from the corresponding author, S.S., upon reasonable request.

Acknowledgments

We would like to acknowledge Ehime Institute of Industrial Technology Paper Technology Center for allowing us to use the cross-section polisher. We especially thank Manato Fujimoto for all the arrangement and support upon using the cross-section polisher. Additionally, we would like to acknowledge Shunya Asami, blueprint artist and photographer, for his insights regarding the fixation of blue on cyanotypes upon proceeding with the research. We appreciate Noriko Hayakawa, Tokyo University of the Arts, and Noriyoshi Nishida of Tokyo National Research Institute for Cultural Properties, for all the arrangements, insights, and support in using micro-Raman spectroscopy analysis upon proceeding with the research. We thank Masamitsu Inaba, Tokyo University of the Arts, for all advice we received in completing the research. We are thankful for Grant-in-Aid for JSPS Fellows (grant number 24KJ1034) for the funding.

Conflicts of Interest

The authors declare no conflicts of interest.

References

  1. Stulik, D.C.; Kaplan, A. Cyanotype. The Atlas of Analytical Signatures of Photographic Processes; Getty Conservation Institute: Angeles, Pampanga, 2013; Volume 6. [Google Scholar]
  2. Sentoku, S.; Kida, K. Comparison of the Decolorization of the Particles Formed by the Photosensitizing Reaction of Cyanotypes with Prussian Blue Pigment. In Proceedings of the 35th Conference of the Materials Life Society, Tokyo, Japan, 4–5 July 2024. [Google Scholar]
  3. Ware, M. Cyanotype: The History, Science and Art of Photographic Printing in Prussian Blue; National Museum of Science & I: London, UK, 1999; pp. 61, 65, 101, 104. [Google Scholar]
  4. How to Preserve Architectural Documents. Available online: http://www.trcc.jp/1st_archives_006.html (accessed on 20 December 2024).
  5. Conservation Treatments Done on the Architectural Plan of the Land of Katsu from the Collection of Kaishu Katsu Museum. Available online: https://www.hozon.co.jp/koubou/post_17227 (accessed on 20 December 2024).
  6. Jinushi, T. Recent Achievements and Challenges in Conservation of Historical Documents. In Proceedings of the Seminar on the Current Status of Restoration of Cultural Properties and Its Issues, Tokyo, Japan, 22 November 2018. [Google Scholar]
  7. Ware, M.A. Blueprint for Conserving Cyanotypes. Top. Photogr. Preserv. 2003, 10, 2–18. [Google Scholar]
  8. Barandiaran, M. Evaluation of Conservation Treatments Applied to Salted Paper Prints, Cyanotypes and Platinotypes. Stud. Conserv. 2000, 45, 162–168. [Google Scholar] [CrossRef]
  9. Ware, M. Cyanomicon: History, Science and Art of Cyanotype: Photographic Printing in Prussian Blue; National Museum of Science & I: London, UK, 2017; pp. 79, 136. [Google Scholar]
  10. DXR3 Raman Microscope. Available online: https://www.thermofisher.com/order/catalog/product/jp/en/IQLAADGABFFAHCMAPB (accessed on 27 December 2024).
  11. Samain, L.; Grandjean, F.; Long, G.; Martinetto, P.; Bordet, P.; Strivay, D. Relationship Between the Synthesis of Prussian Blue Pigments, Their Color, Physical Properties, and Their Behavior in Paint Layers. J. Phys. Chem. C 2013, 117, 9693–9712. [Google Scholar] [CrossRef]
  12. JIS P3801; Filter Paper (for Chemical Analysis). Japanese Industrial Standard: Tokyo, Japan, 2021.
  13. Vera, R.; Zambrano, F.; Suarez, A.; Pifano, A.; Marquez, R.; Farrell, M.; Ankeny, M.; Jameel, H.; Gonzalez, R. Transforming Textile Wastes into Biobased Building Blocks via Enzymatic Hydrolysis: A Review of Key Challenges and Opportunities. Clean. Circ. Bioeconomy 2022, 3, 100026. [Google Scholar] [CrossRef]
  14. Shuvo, I. Fibre Attributes and Mapping the Cultivar Influence of Different Industrial Cellulosic Crops (Cotton, Hemp, Flax, and Canola) on Textile Properties. Bioresour. Bioprocess. 2020, 7, 51. [Google Scholar] [CrossRef]
Figure 1. Visual image of samples: cyanotype samples of different exposures to light (CT-100, CT-50, CT-0) and PB sample.
Photochem 05 00018 g001
Figure 2. Observation of cross-section of cyanotype samples by optical microscopy. (a) Before exposing to light, (b) CT-100, (c) CT-50, (d) CT-0.
Photochem 05 00018 g002
Figure 3. XRD patterns of cyanotype samples in comparison with PB sample.
Photochem 05 00018 g003
Figure 4. Observations using optical microscope of (a) surface of the blue fibre of CT-100, (b) cross-section of the blue fibre of CT-100, (c) surface of the fibre of PB sample, and (d) cross-section of the fibre of PB sample. Areas squared with white dotted lines indicate the fibres of focus.
Photochem 05 00018 g004
Figure 5. Results of micro-Raman spectroscopy analysis on the cross-section of the paper fibres of (a) CT-100 and (b) PB samples. The image on the right shows the points of analysis of the cross-sections of the fibres.
Photochem 05 00018 g005
Figure 6. FE-SEM observation of the surface of cyanotype samples (1.0 kV, 7–10 μA). (a) Fibres of CT-100, (b) fibre 1 of CT-100 ((b)-1 particles on fibrillated fibre, (b)-2 particles found in cracks of fibre), (c) fibre 2 of CT-100 ((c)-1 particles on surface of fibre), (d) CT-50, and (e) CT-0.
Photochem 05 00018 g006
Figure 7. FE-SEM observation of the surface of PB sample (1.0 kV, 10 μA). (a) Fibre 1 ((a)-1 particles on fibrillated fibre) and (b) fibre 2 ((b)-1 particles on surface of fibre).
Photochem 05 00018 g007
Figure 8. FE-SEM observation of the cross-section of (a) CT-100 ((a)-1, (a)-2 area of focus) and (b) PB sample ((b)-1, (b)-2 area of focus) (1.0 kV, 10 μA).
Photochem 05 00018 g008
Disclaimer/Publisher’s Note: The statements, opinions and data contained in all publications are solely those of the individual author(s) and contributor(s) and not of MDPI and/or the editor(s). MDPI and/or the editor(s) disclaim responsibility for any injury to people or property resulting from any ideas, methods, instructions or products referred to in the content.

