Article

A Comprehensive Evaluation of a Chalcone Derivative: Structural, Spectroscopic, Computational, Electrochemical, and Pharmacological Perspectives

by
Rekha K. Hebasur
1,2,†,
Varsha V. Koppal
1,
Deepak A. Yaraguppi
3,*,
Neelamma B. Gummagol
1,†,
Raviraj Kusanur
4 and
Ninganagouda R. Patil
1,*
1
Department of Physics, KLE Technological University, Hubballi 580031, India
2
Department of Physics, Rural Engineering College, Hulkoti 582205, India
3
Department of Biotechnology, KLE Technological University, Hubballi 580031, India
4
Department of Chemistry, R.V. College of Engineering, Bengaluru 560059, India
*
Authors to whom correspondence should be addressed.
These authors contributed equally to this work.
Photochem 2025, 5(3), 20; https://doi.org/10.3390/photochem5030020
Submission received: 18 June 2025 / Revised: 25 July 2025 / Accepted: 28 July 2025 / Published: 30 July 2025

Abstract

This study details how 3-(naphthalen-2-yl)-1-phenylprop-2-en-1-one (3NPEO) behaves in terms of photophysics when exposed to different solvents. The solvatochromic effect study reveals significant polarity shifts in the excited states of the 3NPEO compound, likely due to an intramolecular proton transfer mechanism. Measurements of dipole moments provide insight into their resonance structures in both ground and excited states. Electrochemical analysis revealed a reversible redox process, indicating a favorable charge transport potential. HOMO and LUMO energies of the compound were computed via oxidation and reduction potential standards. 3NPEO exhibits optimal one-photon and two-photon absorption characteristics, validating its suitability for visible wavelength laser applications in photonic devices. Furthermore, molecular docking and dynamics simulations demonstrated strong interactions between 3NPEO and the progesterone receptor enzyme, supported by structure–activity relationship (SAR) analyses. In vitro cytotoxicity assays on the MDAMB-231 breast cancer cell line showed moderate tumor cell inhibitory activity. Apoptosis studies confirmed the induction of both early and late apoptosis. These findings suggest that 3NPEO holds promise as a potential anticancer agent targeting the progesterone receptor in breast cancer cells. Overall, the findings highlight the substantial influence of solvent polarity on the photophysical properties and the design of more effective and stable therapeutic agents.

1. Introduction

Chalcone derivatives, a prominent subclass of open-chain flavonoids, have gained considerable devotion owing to their versatile applications across various scientific domains. These compounds, biosynthesized by plants and synthetically accessible via robust methods [1], are illustrated by two aromatic rings connected through a ketoethylenic α,β-unsaturated carbonyl system. Their structural features, including extensive π-electron delocalization, facilitate the synthesis of novel derivatives and enhance their functional versatility [2,3,4].
V. S. More et al. [5] synthesized a series of naphthalene-chalcone derivatives and evaluated their efficacy in treating MCF-7 cell line-derived breast cancer. Molecular docking analyses demonstrated that these compounds show affinity for proteins. M. S. Lee et al. [6] showed that synthetic chalcones exhibit the best antimetastatic activity.
Now, chalcone derivatives serve as critical tools for studying photo-induced electron transfer processes [7,8,9,10,11]. Their chromophoric properties and diverse biological activities position them as valuable resources in chemistry, optics, and biology [12,13,14,15,16,17,18]. Applications extend to optoelectronics, nonlinear optical materials, dye-sensitized solar cells, and bioimaging. Their D–π–A framework and photophysical attributes, such as UV–vis absorption (redshift), Stokes shifts, intramolecular charge transfer, fluorescence quantum yield [19], and light stability, make them ideal for high-efficiency electron transport, photoluminescence [20], material science, and optics [21] and biological imaging [22]. In addition to it, chalcones have revealed attention-grabbing biomedical applications, namely, antimicrobial [23], antifungal [24], antiviral [25], antimalarial [26], antituberculosis [27], antioxidant [28], and anticancer [29].
Chalcones also exhibit significant nonlinear optical (NLO) capabilities, sensitive to electric fields, which have been utilized in photonic devices [30,31], optical switching [12], data processing, and waveguide modulators [31,32,33]. Furthermore, the electrochemical behavior of chalcone derivatives, governed by their conjugated α,β-unsaturated carbonyl structure and substituent effects, provides insights into their redox properties and stability. This renders them promising candidates for applications in catalysis, photophysics, and biomedical fields, including anticancer therapies [34,35].
A thorough review of existing research fulfils the notable gap on structural, spectroscopic, computational, electrochemical, and anticancer activities of 3-(naphthalen-2-yl)-1-phenylprop-2-en-1-one (3NPEO). However, there are no reports available in literature on structural, computational, solvatochromic effect, and docking study on the 3NPEO compound. The elaborated photophysical and photochemical features are integral characteristics of chalcone derivatives, which have yet to undergo systematic investigation for potential biological applications, empowering chalcones to reveal a broad spectrum of biological activities [36]. In view of this, we have emphasized the approaches to develop the target compound as a probable candidate as an anticancer agent.

2. Materials and Methods

2.1. Materials

The required analytical grade chemicals were purchased from Sigma Aldrich. All the solvents used are of HPLC grade, procured from Sigma Aldrich (Bangalore, India), utilized without additional refinement, and the corresponding solvent polarity parameters are given in Supplementary Document Table S1. The concentration of solutions was maintained low (i.e., 1 × 10⁻⁵ M) to evade self-absorption and aggregation. The title compound 3-(naphthalen-2-yl)-1-phenylprop-2-en-1-one (3NPEO) is synthesized by the Claisen–Schmidt condensation protocol [37,38,39,40,41]. The progress of the reaction was tracked by thin-layer chromatography (TLC), employing a mobile phase of 10% ethyl acetate in hexane. High-performance liquid chromatography (HPLC) analysis confirmed the compound’s purity to be 98%. The corresponding HPLC chromatogram is presented in the Supplementary Document as Figure S1. The molecular structure is displayed in Figure 1.

2.2. Methods

2.2.1. Experimental Methods

The FT-IR spectrum was acquired using a Perkin Elmer Spectrophotometer (CMS, KLE Tech. University, Hubballi, India) in the scan region 4000–450 cm−1 with a resolution of 2 cm−1 and 100 scans using a KBr pellet. The typical absorption and emission spectra of 3NPEO are recorded in various solvents by employing a two-fold beam UV–VIS Spectrophotometer (Analytic Jena Specord 210 plus) in a wavelength range from 200 to 800 nm and a fluorescence spectrophotometer (Hitachi F-7000) at room temperature. The nonlinear optical properties of 3NPEO were studied using a Z-scan procedure at 532 nm. Open aperture Z-scans measured nonlinear absorption, while closed aperture Z-scans measured nonlinear refraction. Optical limiting properties were assessed using open aperture scans with a focused laser beam (532 nm, 200 mW) on a 0.01 M solution of 3NPEO in DMF. The transmission was quantified as a function of sample position, revealing intensity-dependent transmission and nonlinear coefficients [42,43]. The experimental setup is depicted in the Supplementary Document, Figure S2. Electrochemical characterization of 3NPEO was analyzed via cyclic voltammetry (CV) using a three-electrode system in acetonitrile with 0.1 M tetrabutylammonium hexafluorophosphate (nBu4NPF6). A glassy carbon working electrode, Pt counter electrode, and Ag/AgCl reference electrode were used (100 mVs−1, −1.2 to 0.8 V). The working electrode was polished between scans.

2.2.2. Computational Studies

Theoretical Study
Theoretically, the dipole moments, molecular geometry, chemical reactivity, and kinetic stability of the 3NPEO molecule are explored through DFT, TD-DFT, and CAM with the (B3LYP/6-311G(d,p) basis set from the Gaussian 16 software [44]. The Gauss view 6.0 [45] is employed for the electronic, spectroscopic parameters, HOMO/LUMO energies, Global Chemical Reactivity Descriptors (GCRDs), and molecular electrostatic potential (MEP).
Structure Preprocessing, Validation, and Molecular Docking
The progesterone receptor structure (PDB ID: 4OAR) was prepared for docking by removing water molecules and heteroatoms [46]. Missing residues were modeled using MODELLER 10.2 [47], and the resulting model was validated using ERRAT and PROCHECK programs hosted on the UCLA-DOE Lab-SAVES v6.0 (https://saves.mbi.ucla.edu/ accessed on 5 April 2024). Molecular docking was performed with AutoDock4, adding polar hydrogens and charges to the protein structure, and converting the ligand to pdbqt format using AutoDockTools [48]. Reference-based active site docking was performed considering the grid box coordinates around the co-crystallized ligand in 4OAR with X, Y, Z grid center 14.5 × 24.8 × 14.8 and a grid size of 20.6 × 20.9 × 18.3. A total of 9 docking runs were performed, and the best pose was selected for further analysis.
Molecular Dynamic (MD) Simulation and Trajectory Analysis
MD simulations of the native protein (4OAR-APO) and protein–ligand complex (4OAR-CMP6) were performed using the GROMOS 54A7 force field in GROMACS-2020.6. The ligand topology was generated using the Automated Topology Builder [49]. The pdb2gmx module added hydrogens, and the H++ server defined amino acid protonation states [50]. The system underwent initial energy minimization using 1500 steps of the steepest descent algorithm, followed by solvation in a cubic box with TIP3P water extending 10 Å beyond the protein [51]. The system was neutralized, and an ionic strength of 0.15 M was maintained with Na+ and Cl ions. Energy depletion was performed using 2500 steps of the steepest descent algorithm. Solvent density was adjusted to 1 bar and 310 K using the Parrinello–Rahman barostat. Equilibration was conducted in the NPT ensemble for 10 ns with a 2 fs interval [52]. Electrostatic interactions were handled using the particle-mesh Ewald sum with a 1.0 nm cutoff. Van der Waals interactions were calculated within 1.0 nm [53]. The LINCS algorithm constrained bonds with hydrogen atoms. Following NPT equilibration, a 500 ns production run was performed in the NPT ensemble [54]. Trajectory analysis was conducted using GROMACS utilities to calculate RMSD (backbone), RMSF (C-α), radius of gyration (Rg), and solvent accessible surface area (SASA).
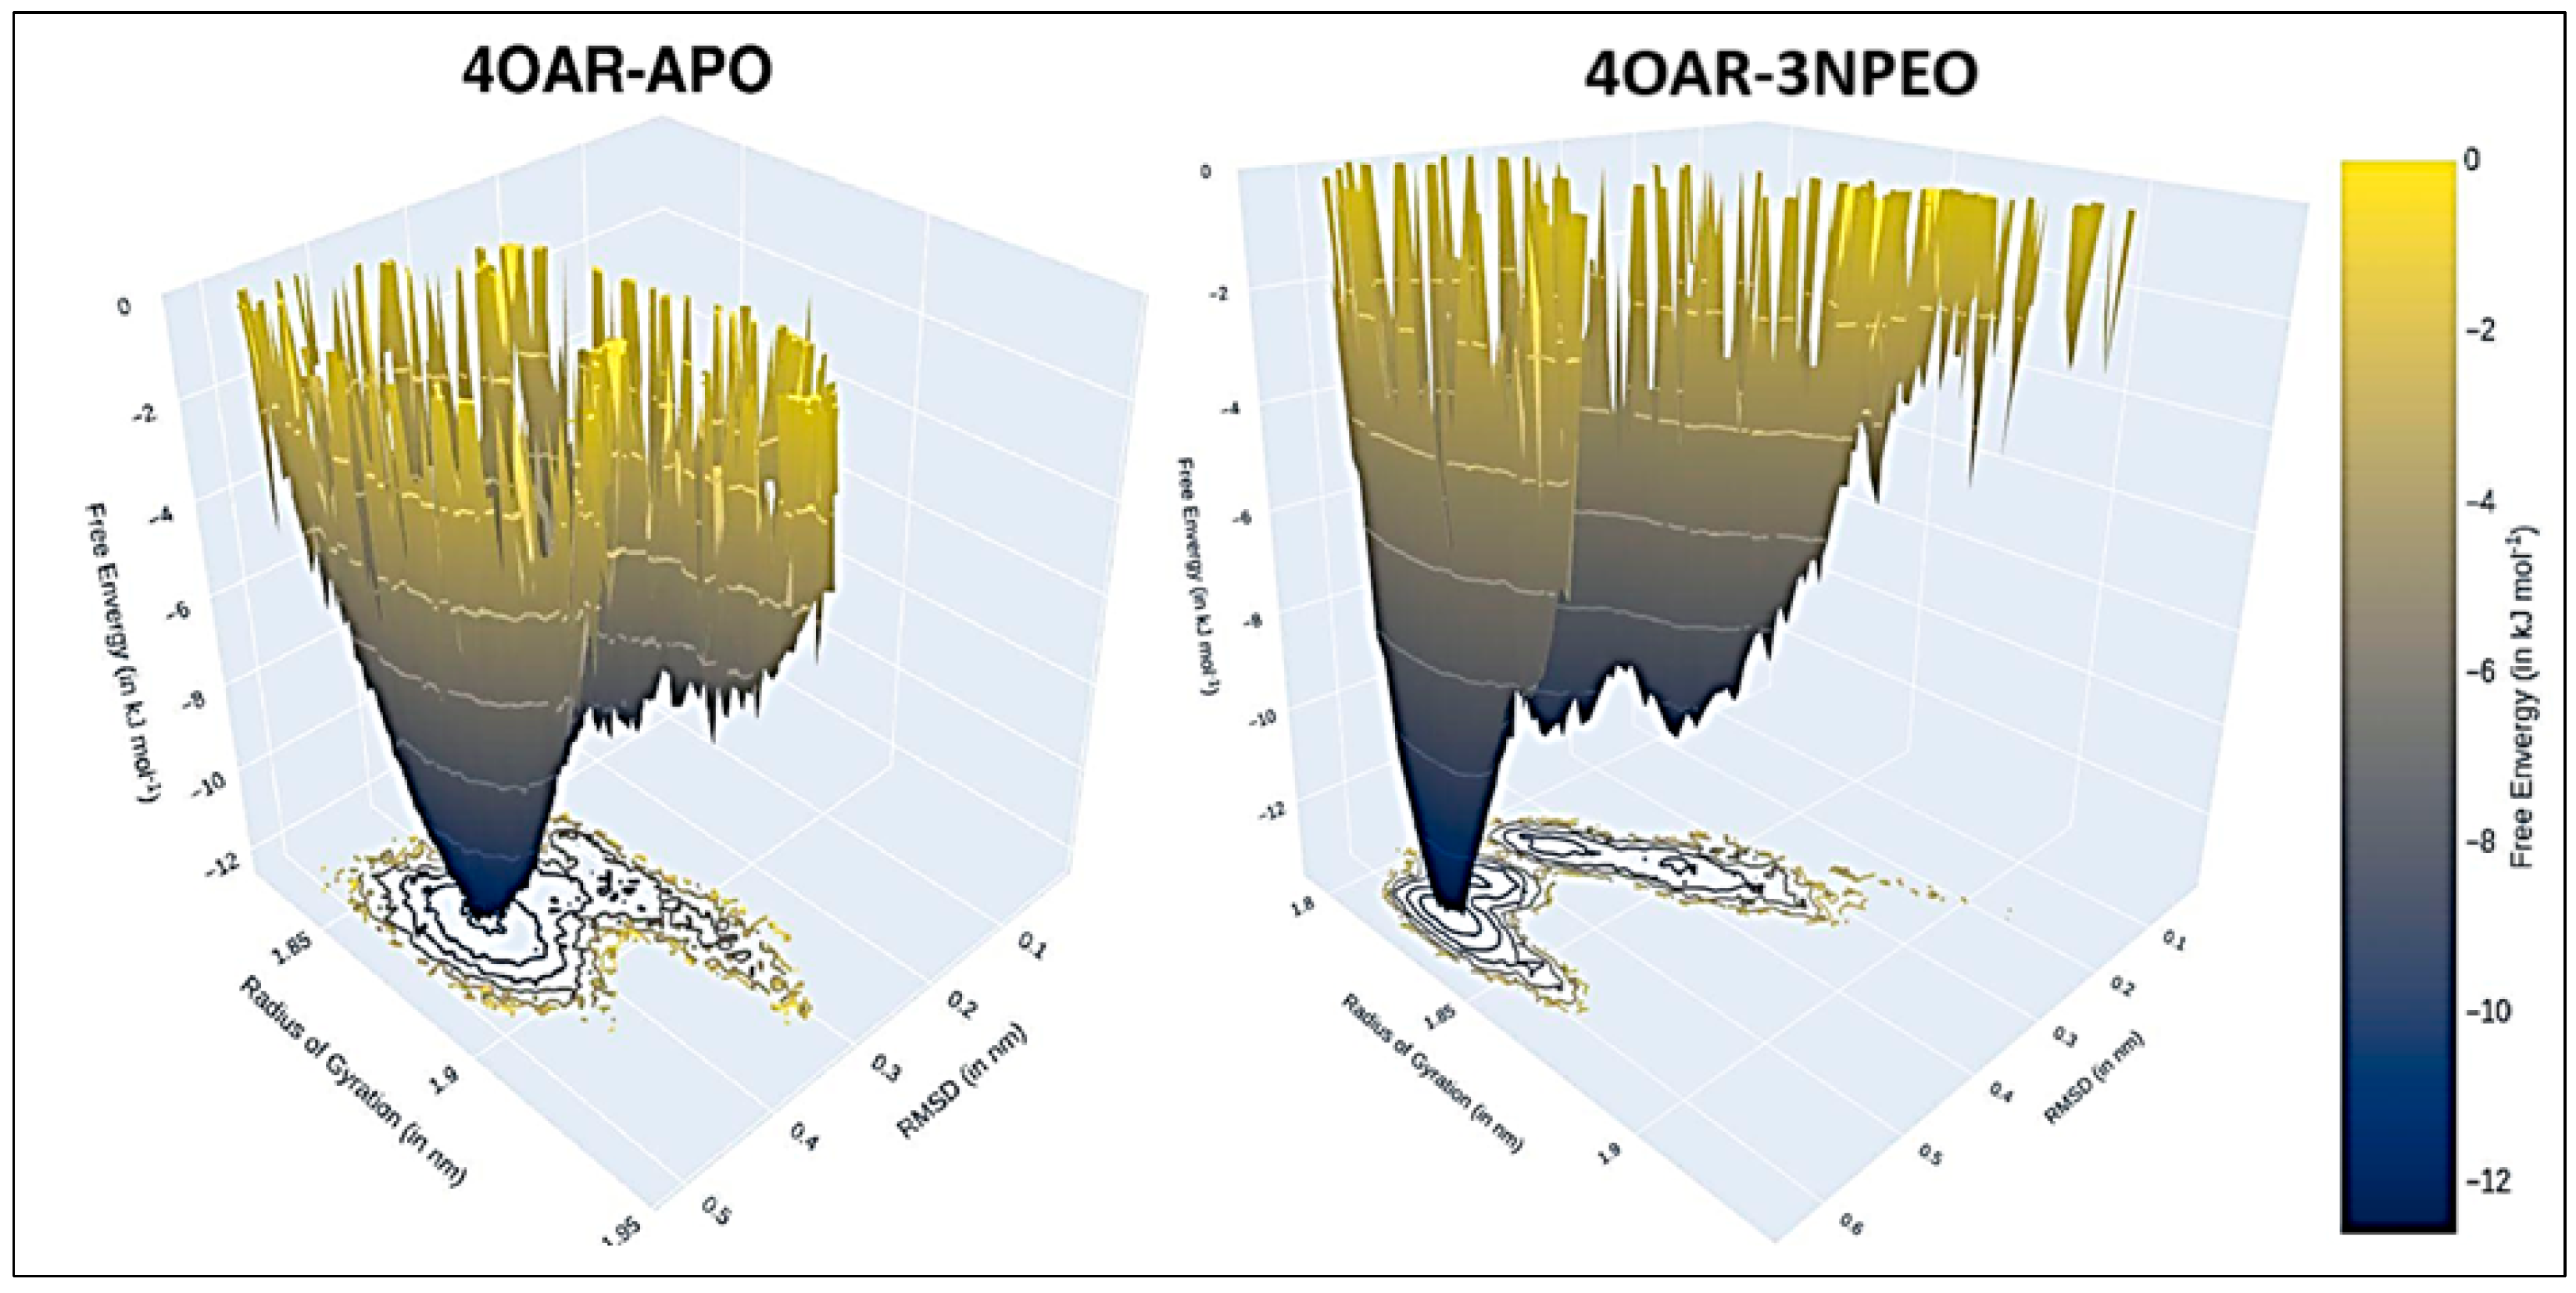
Free Energy and Decomposition
To comprehend the binding free energy (ΔG binding) of the substrate or inhibitor with the protein over the course of the simulation, we implemented the Molecular Mechanics Poisson–Boltzmann Surface Area (MM-PBSA) approach [55]. This allowed us to gain insights into the energetic contributions of the binding process. The binding free energy estimation was performed using the g_mmpbsa software [56], ensuring a precise determination of the energetic landscape. The ΔG was computed over the last 300 ns to accurately determine the binding free energy, with a window size of 200 ns. We derived the free energy of binding by computing the difference between the bound and unbound states. This approach provided a comprehensive understanding of the thermodynamics underlying the molecular interactions within the system, aiding in the elucidation of crucial aspects of the binding mechanism. Further, the residue contribution towards the binding was also calculated through decomposition.

2.3. Cytotoxicity Studies and Apoptosis Using Flow Cytometer

Cell lines were procured from the NCCS (National Centre for Cell Sciences), Pune, Maharashtra, India. The MTT (3-(4,5-dimethylthiazol-2-yl)-2,5-diphenyltetrazolium bromide assay is used extensively in breast cancer research to assess cell viability and proliferation. This colorimetric assay is instrumental in investigating the effect of various treatments, compounds, or experimental conditions on breast cancer cell lines. By measuring the metabolic activity of cells, the MTT assay provides valuable insights into the efficacy of potential therapeutic interventions. This study employed the MTT assay to evaluate the cytotoxic effects of 3NPEO on the MDAMB-231 cell line. Our methodology involved treating MDAMB-231 and normal MTT L929 cells with 3NPEO, followed by the addition of the MTT reagents, which are subsequently reduced by metabolically active cells to form formazan crystals. The optical density, measured at 570 nm, serves as an indicator of cell viability. This method allows for a quantitative assessment of cell health and is a pivotal component of our research, shedding light on the potential effectiveness of novel strategies in managing breast cancer [57].
The cells were seeded in a 6-well, flat-bottom microplate containing coverslips and maintained overnight at 37 °C in a CO2 incubator. The GI50 concentrations of each sample were determined at 24 h. After incubation, cells were washed with PBS twice. Centrifuge for 5 min at 500× g at 4 °C. Discard the supernatant, and resuspend the cell pellets in ice-cold 1X Binding Buffer to 1 × 10⁶ per mL. Keep tubes on ice. Then, add 5 µL of AbFlour 488 Annexin V and 2 µL PI and mix gently. Keep tubes on ice and incubate for 15 min in the dark. Add 400 µL of ice-cold 1X binding buffer and mix gently. Analyze cell preparations within 30 min using flow cytometry. The analysis was performed using FlowJoX 10.0.7 software [57].

3. Results and Discussions

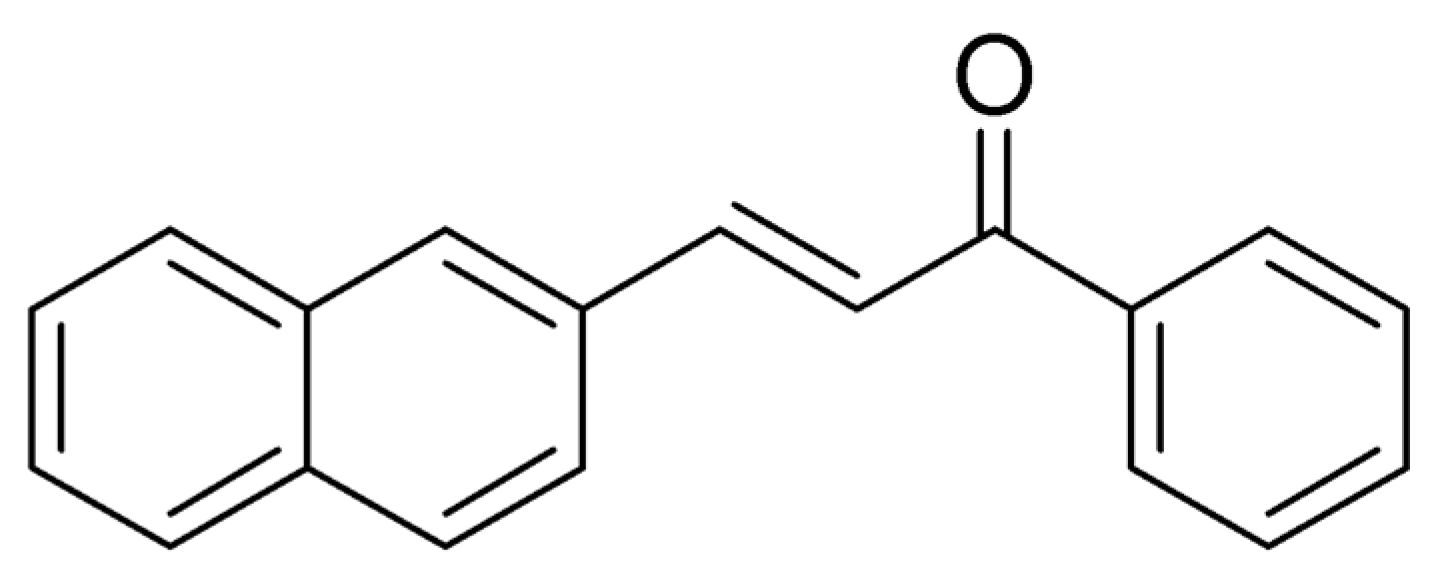
3.1. Structural Analysis

FT-IR spectroscopy techniques have been extensively used in organic chemistry for the identification of functional groups, bonding in different molecular conformations, and reaction mechanisms by tentatively assigning their observed fundamental modes [20,21,22,23,24,25,26]. The DFT vibrational wavenumbers were calculated using Gaussian, along with the same basis set, and compared with the IR (experimental) data. The IR spectra of 3NPEO obtained using experimental and DFT methods are given in Figure 2a and Figure 2b, respectively. The correlation between the C-C stretching and C=C in-plane bending vibrations is presented in Table 1 for the 3NPEO compound. In substituted benzene rings, the spectral region between 1100 and 1350 cm−1 typically encompasses the vibrational modes associated with in-plane bending of carbon-carbon-hydrogen (C–C-H) bonds. The experimental and theoretical observations reveal medium bands corresponding to carbon-carbon-hydrogen (C–C-H) in-plane bending vibrations at specific wavenumbers: 1218 cm−1 and 1220 cm−1. The multiple bands in the compound are obtained and shown in Table 1 [58,59].
The identification of the inductive, conjugative, and steric effects, as well as the influence of lone pair electrons on oxygen, in the presence of carbonyl groups, primarily depends on bond strength. The expected C = O stretching vibration is to occur in the region 1740–1640 cm−1. In the present case, a very strong experimental band is observed at 1655 cm−1 and 1676 cm−1 due to the α,β-unsaturated carbonyl group [60].

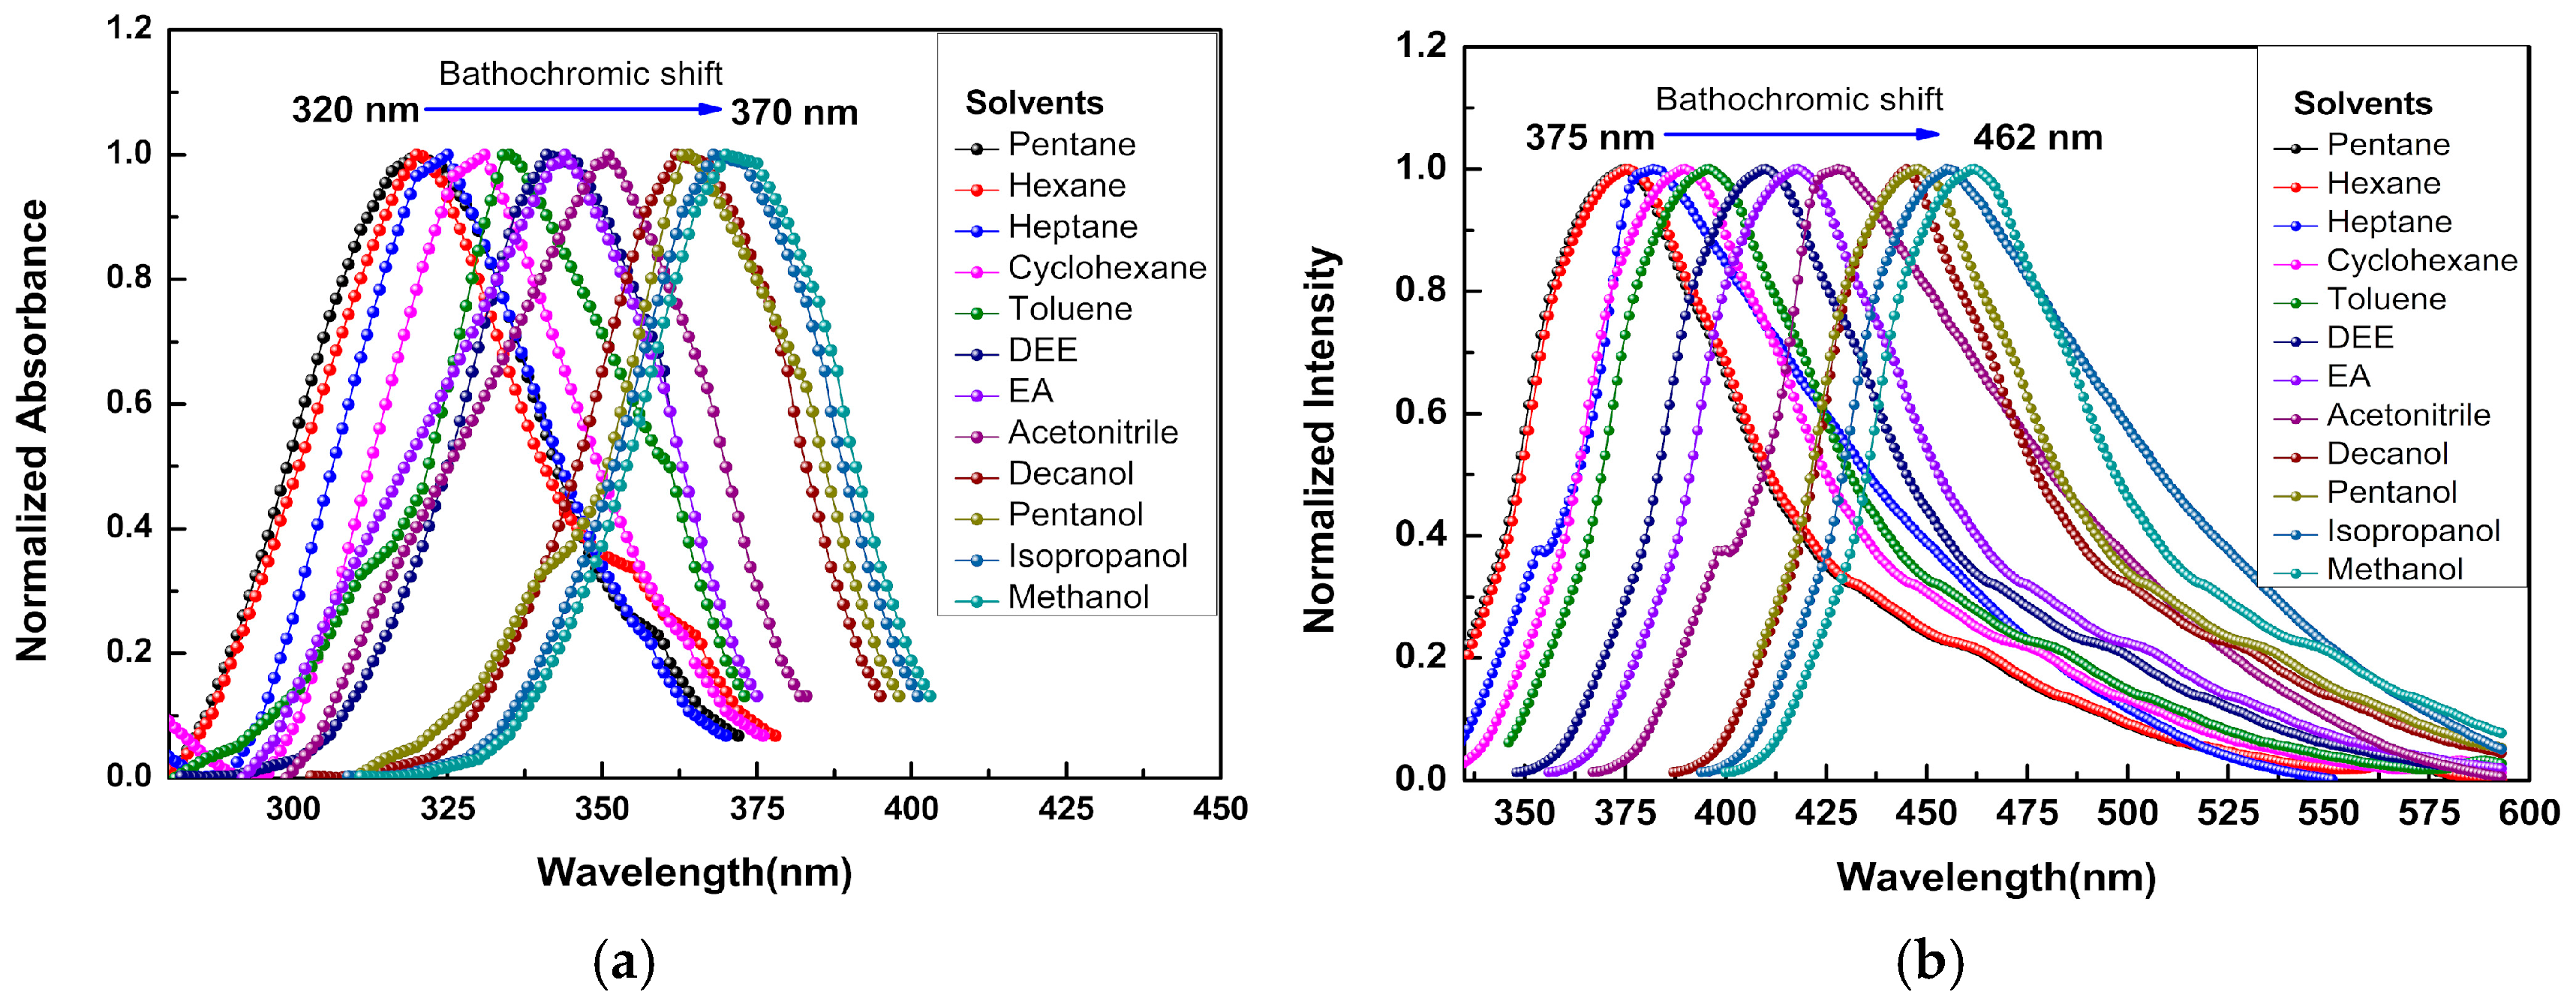
3.2. Solvent Effect on Photophysical Properties of 3NPEO

The typical electronic absorption and fluorescence spectra of 3NPEO were studied in twenty-two solvents of different polarities and presented in Figure 3a and Figure 3b, respectively. Concentration of the solute is maintained low, i.e., 10−5 M to avoid reabsorption and aggregation. From Figure 3a,b, it is observed that, as the polarity of the solvent is increased, the Lmax of both the absorption and emission spectra shows a bathochromic shift. This shift is due to the solute–solvent interaction. It signifies the π→π* transaction involved [61,62,63,64,65]. Table 2 details spectral properties across solvents, revealing interactions and photophysical behavior.
Bathochromic shifts suggest strong interactions between excited 3NPEO and polar solvents, stabilizing it and impacting electronic properties. We aim to develop chalcones with large Stokes shifts [34,66,67,68,69] for bioimaging (cellular/microorganism targeting). Large Stokes shifts reduce self-quenching by minimizing spectral overlap, improving bioimaging precision and fluorescence [69].
Solvatochromism of 3NPEO molecule was analyzed using linear correlations from Bilot–Kawski [70], Lippert–Mataga [71], Bakhshiev [72], Kawski–Chamma–Viallet [73], and Reichardt [74], correlating spectroscopic properties with solvent polarity. The relevant theory is discussed in Supplementary Document S1, entitled Determination of Dipole Moments by Experimental Method. The solvent polarity functions F1, F2, F3, f(ε, n), and φ(ε, n) of different solvents are listed in the Supplementary Document, Table S1. Moreover, the Bilot–Kawski graphs of ( ν ¯ a ν ¯ f ) vs. f(ε, n), Lippert–Mataga (i.e., ( ν ¯ a ν ¯ f ) vs. F1(Σ, n)), Bakhshiev (i.e., ( ν ¯ a ν ¯ f ) vs. F2(Σ, n)), and Kawski–Chamma–Viallet (i.e., ν ¯ a +   ν ¯ f 2 vs. F3(Σ, n)) are shown in Supplementary Document, Figures S3, S4a and S5b respectively. The relevant slopes obtained from these plots are given in Table S2 of the Supplementary Document.
The computation of dipole moments in the ground and excited states for the 3NPEO molecule is listed in Table 3. The non-uniformity of excited state dipole moment values across different solvatochromic effect methods stems from various factors, including the limitations of the methods themselves, the complex nature of solute–solvent interactions, and the influence of environmental effects on the excited state. Solvatochromic methods rely on measuring spectral shifts upon changes in solvent polarity, and the calculated dipole moments are sensitive to the specific assumptions and simplifications used in each method [61,62,63,64,65,75,76]. The angle between ground and excited state is found to be 0o, confirming their parallel orientation [61,62,63,64,65]. This alignment underscores the dependence of dipole moment direction on the distribution of positive and negative charges within the molecule. The evaluated collinearity suggests increased charge mobility throughout the molecule in the excited state, in contrast to the ground state, providing empirical support for the augmentation of molecular charge dynamics upon excitation.
The linear plot of ν ¯ a ν ¯ f v/s ( E T N ) in different solvents for 3NPEO as seen in Supplementary Figure S4. The wide range of solute–solvent interaction seen in the graph results in Stokes shift being dependent on the solvents’ polarity. Equation (S21), from Supplementary Document S1, is used to calculate μeg, which is then provided in Table 3.

3.3. Fluorescence Quantum Yield (Photonic Efficiency)

Fluorescence quantum yield (Φ) represents the efficiency of fluorescence, indicating the probability of an excited state deactivating through fluorescence rather than non-radiative pathways. It can be expressed as the ratio of radiative (kr) to non-radiative (knr) decay rates. A quantum yield approaching unity suggests that radiative decay is much faster than non-radiative decay. Quantum yield provides insights into excited electronic states, radiationless transitions, and electronic-vibronic state coupling [77,78]. It is valuable in determining chemical structure, sample purity, and the suitability of laser media. While absolute quantum yield measurements require specialized equipment, relative quantum yields are more easily estimated by comparison to a standard with a known fluorescence quantum yield [79,80,81].
In this study, the relative quantum yield of 3NPEO in various solvents (polar, non-polar, alcohols, and non-alcohols) was measured using tryptophan (standard reference) in double-distilled water at 20 °C as a standard (excitation maxima at 280 nm, fluorescence quantum yield of 0.13). The relative quantum yield was determined using the following Equation (1) [79]:
Φ = Φ s   F u   O D S   n u 2 F s   O D u   n s 2
where represents quantum yield, F represents the integrated area under the corrected emission spectrum, OD represents absorbance at the excitation wavelength, n represents the refractive index of the solvent, and the subscripts u and s refer to the unknown and standard, respectively.
The radiative (kr) and non-radiative (knr) decay constants of 3NPEO reveal the pathways of energy dissipation. Quantum yield can also be defined using average lifetime (l0) and radiative decay rate constant (kr).
k r = Φ τ o
The non-radiative decay rate constant is given as follows:
k n r = 1 τ o k r
All solutions, including the reference, were excited at 280 nm. The optical density of the solutions varied from 0.118 in cyclohexane to 0.558 in DMSO, showcasing a range of responses to different solvents. This variation highlights the impact of solvation on the photonic properties of 3NPEO. By studying these optical signatures, we determined the relative photonic efficiency of 3NPEO in various solvents.
Figure 4a illustrates the characteristic absorption profile of tryptophan, while Figure 4b,c depicts the emission spectra and fluorescence lifetime (τ0) of the 3NPEO compound in isopropanol, respectively. A comprehensive analysis of fluorescence integrated intensity (Fint) across various solvents highlights a significant enhancement in isopropanol. Quantitative data in Table 4 outline the relative quantum yield (Φ) of 3NPEO in different media. Notably, despite expectations based on optical density, 3NPEO demonstrates superior photon efficiency in cyclohexane compared to solvents like butanol, ethanol, and DMSO.
From Table 4, it is observed that, in most of the solvents, the radiative decay constant (kr) is less than the non-radiative decay constant, which indicates that non-radiative processes like internal conversion or intersystem crossing, energy dissipation, etc., dominate over radiative processes such as fluorescence or emission. The molecule is more likely to lose energy through non-radiative pathways, rather than emitting light.

3.4. Nonlinear Optical Studies

3.4.1. Third Order Nonlinear Optical Properties

The test molecule is liquified in DMF solvent (0.01 M) was elucidated coupled with the Z-axis. The imparted laser beam was acquired using a photodetector with an aperture (closed aperture) and without an aperture (open aperture) to quantify the nonlinear refraction (NLR) and nonlinear absorption (NLA) of the material, respectively [79,80,81,82]. Figure 5a,b exhibit the normalized curves of 3NPEO for closed and open apertures. The transmissions are symmetric with respect to the focus (Z = 0). Nonlinear absorption coefficient can be estimated from the open aperture Z-scan data by fitting the curves using the following rule,
T z = 1 β I 0 L e f f 2 2 1 + Z 2 Z o 2
where T(z) is the normalized transmittance, I0 is the intensity at the focus, Leff is the effective length of the sample, which is given by Equation (5).
Leff = (1 − exp−αL)/α
Here ‘α’ is the linear absorption coefficient and L is the sample thickness. The Figure 5b shows the normalized transmittance for closed aperture. The valley -peak configuration indicate a positive nonlinear refractive index n2 (self-focusing effect), i.e., a decrease in the transmitted intensity due to refraction as the sample approaches the focal point (Z = 0) followed by an increase in intensity as it moves away from the focal point and towards the detector. The magnitude of nonlinear phase transition is computed by tailoring the closed aperture probed curve through theoretically adapted equation,
T Z = 1 4 X 0 X 2 + 1 X 2 + 9
where X = Z/Z0, Z and Z0 are the magnitudes of the analyte from the focus and Rayleigh length, respectively. The nonlinear refractive index [81] can be quantified by exchanging this procured value of 0 in the equation, n 2 = 0 k I 0 L e f f , where k = 2π/λ is the wave vector, I0 is the beam intensity at focus, and Leff = [1 − exp(−αL)]/α is the effective thickness, with α being the linear absorption coefficient and L is the sample thickness. By tailoring the experimental open aperture curve, the nonlinear absorption coefficient β is enumerated by employing the formula β = ( 2 2 T I 0 L e f f ), where T is peak value of open aperture. The estimated measures of β and n2 are tabulated in Table 5.
The computed magnitudes of n2 and β are replaced in the correlated equations to elucidate the explicit, quixotic and ultimate magnitudes of the third-order nonlinear optical susceptibility (χ3) and additionally the second order hyperpolarizability (γh) [83] from the subsequent relationships,
χ R 3 e s u = c n o 2 120 π 2 n 2
χ I 3 e s u = c 2 n o 2 240 π 2 ω β          
χ 3 = χ R 3 2 + χ I 3 2
γ h = χ 3 1 3 n o 2 + 2 4 N
N represents the density of molecules in cm−3. Two-photon absorption cross section, σ 2 P A = h v β N C × 10 3 (cm4 s photon−1 molecule−1), describe the efficiency of a particular molecule in the ground state to reach the excited state via a two-photon absorption process. It can be expressed in the SI unit (GM) and defined as 1GM = 10−50 cm4 s photon−1 molecule−1. The calculated nonlinear susceptibility, hyperpolarizability and two photon absorptions are present in the Table 5.

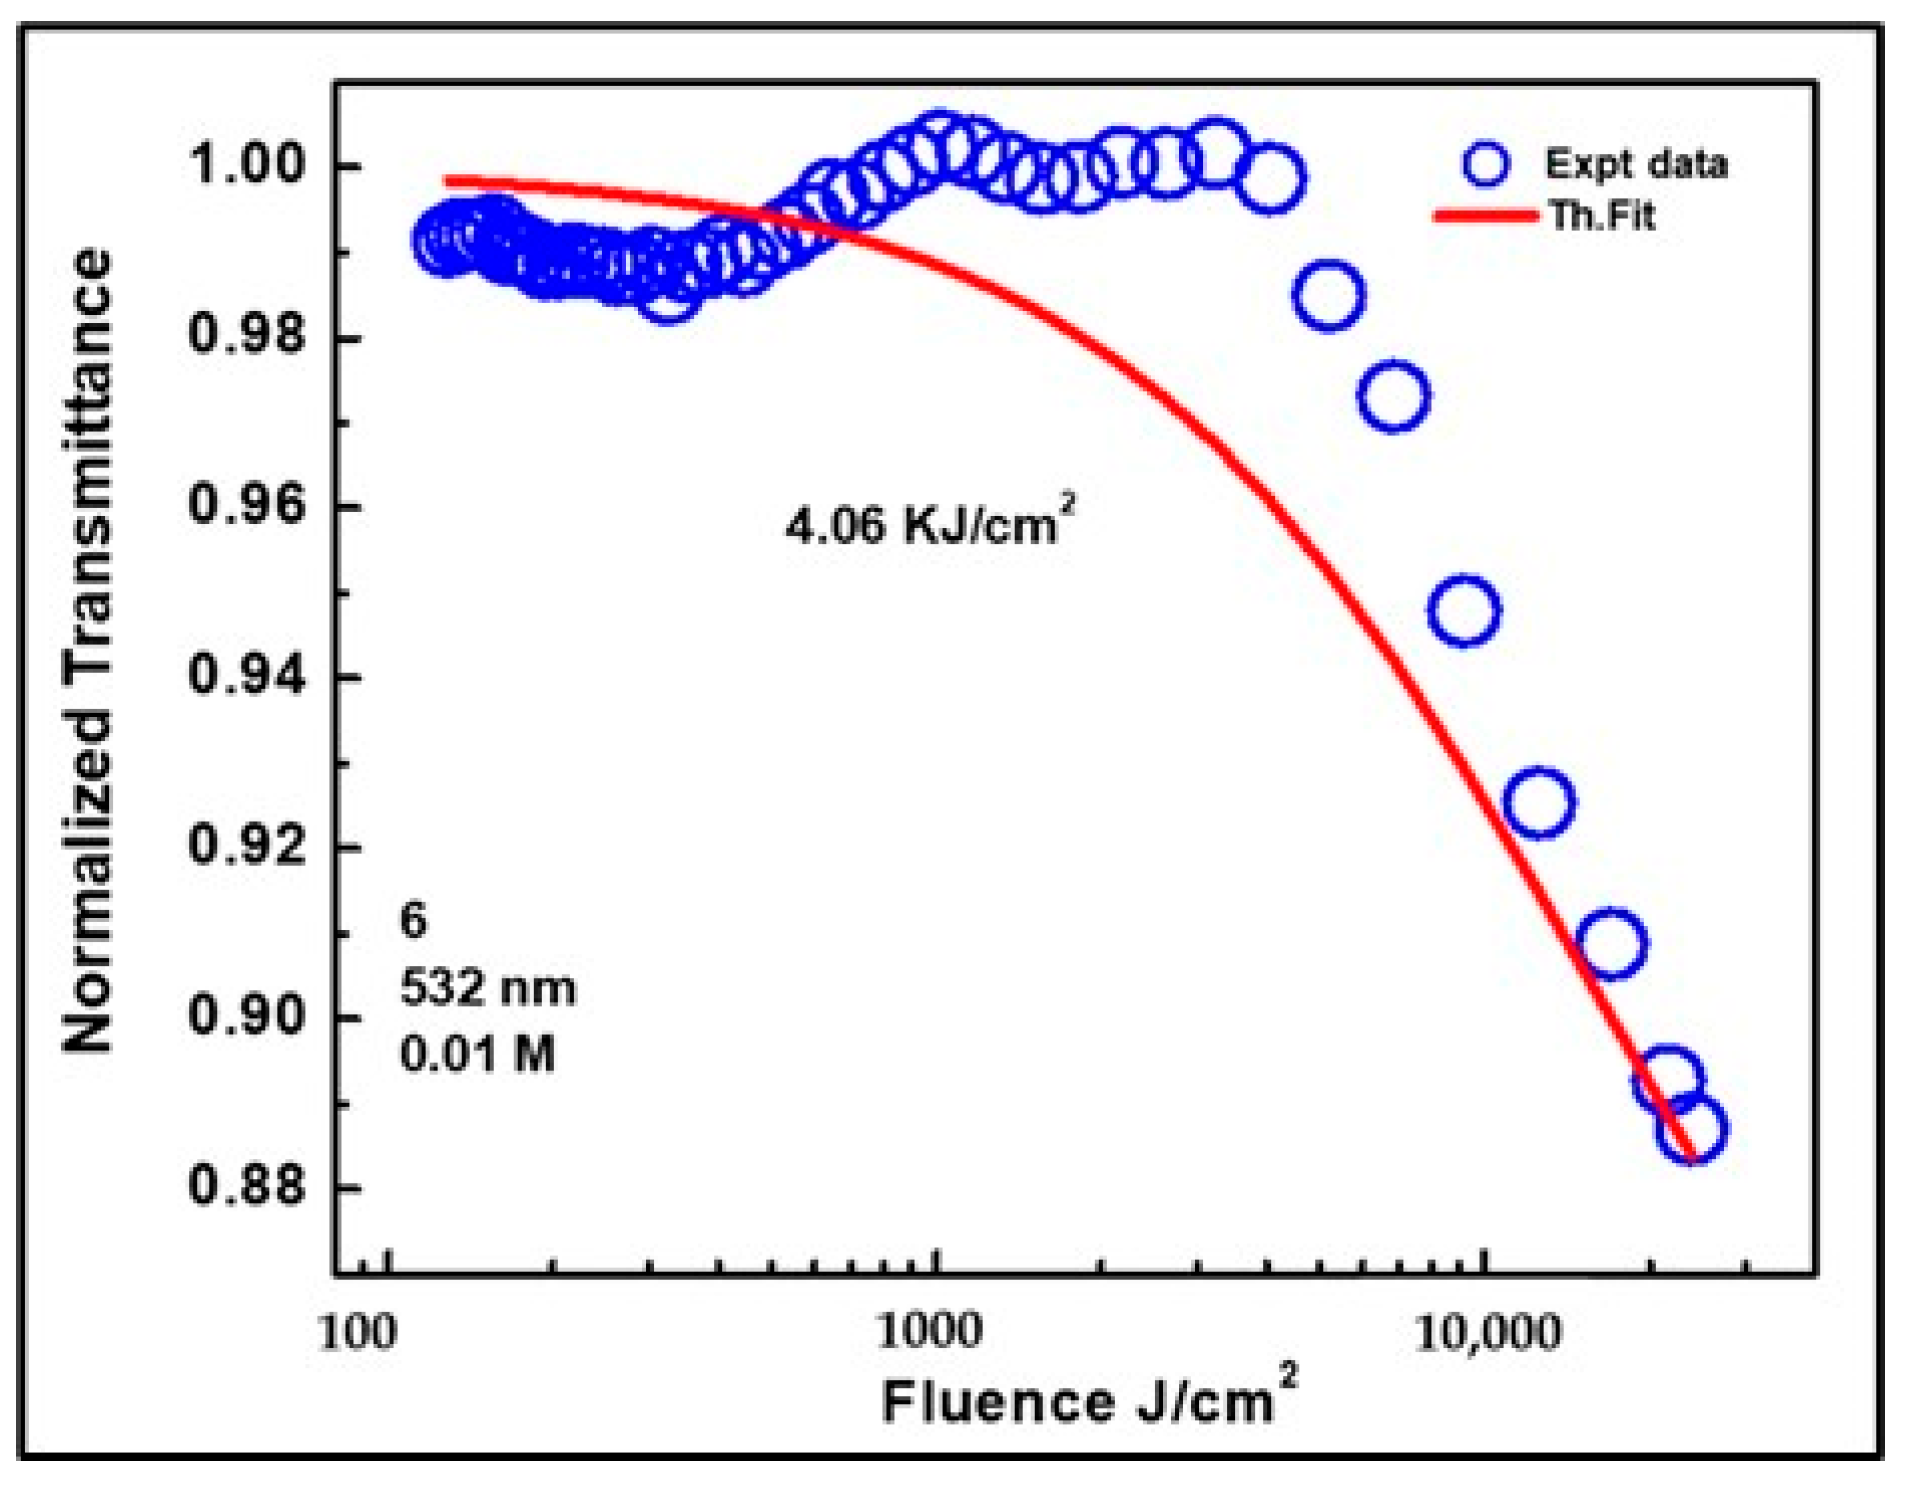
3.4.2. Optical Limiting

The input fluence at which transmittance diminishes to half of the linear transmittance designates the boundary value for optical limiting which follows lower limiting threshold value analogous to better optical limiting performance [84]. Employing Gaussian beam from open aperture Z-scan data, input fluence at each z-positions is specified by,
F z = 4 l n 2 E i n n 3 2 ω z 2
where Ein is input laser pulse energy and ω(z) is the beam radius, which is expressed as w z = ω o 1 + z z o 2 1 2 , where ω(ο) is the beam radius at the focus and z o = π ω 0 2 λ is the Rayleigh range. The optical liming response of the title chalcone is due the decreasing transmittance with increasing input fluence. The limiting threshold was observed at 4.06 kJ/cm2 which is shown in Table 5. The molecule demonstrated optimal NLO coefficient, reduced optical limiting (OL) critical value is illustrated in Figure 6 and an optimal photon (W) and two photon (T) benchmarks the convinced condition for optical switching exploitations as shown in Table 5 (W > 1 and T < 1), consequently validating their appliance in visible wavelength of the laser in photonic device applications.

3.5. Electrochemical Property

Cyclic voltammograms in acetonitrile, as illustrated in Figure 7a, revealed a reversible redox process, indicating a favorable hole/electron transport potential. HOMO and LUMO energies of the compound 3NPEO was computed via oxidation and reduction potential standards [65,66]. HOMO was calculated by the relation given below
HOMO = −{[Eox − E1/2 ferrocene] + 4.8} eV
where Eox represents the onset of the corresponding oxidation potential peak, and E1/2 (ferrocene) denotes the onset of the oxidation potential peak of the ferrocene redox couple used as a reference. The energy of lowest unoccupied molecular orbital was estimated by employing the following relation.
LUMO = −[HOMO + Egopt] eV
where Egopt is the optical band gap evaluated by applying the formula 1240/λonset, where λonset is the long edge of absorption spectra. The determined HOMO and LUMO energy levels were found to be −4.849 eV and −1.498 eV respectively.
Figure 7b utilized Density Functional Theory (DFT) to portray the Highest Occupied Molecular Orbital (HOMO) −6.225 eV to Lowest Unoccupied Molecular Orbital (LUMO) −2.488 eV leading an energy gap 3.737 eV of the 3NPEO compound. This information offers crucial insights into the electronic structure of the compound, emphasizing its prospective applications in electronic and optoelectronic domains. The existence of 3NPEO, acting as an electron-donating fraction, influenced the HOMO and LUMO energy levels. A succinct summary of the pertinent electrochemical statistics is presented in Table 6.

3.6. Computational Analysis

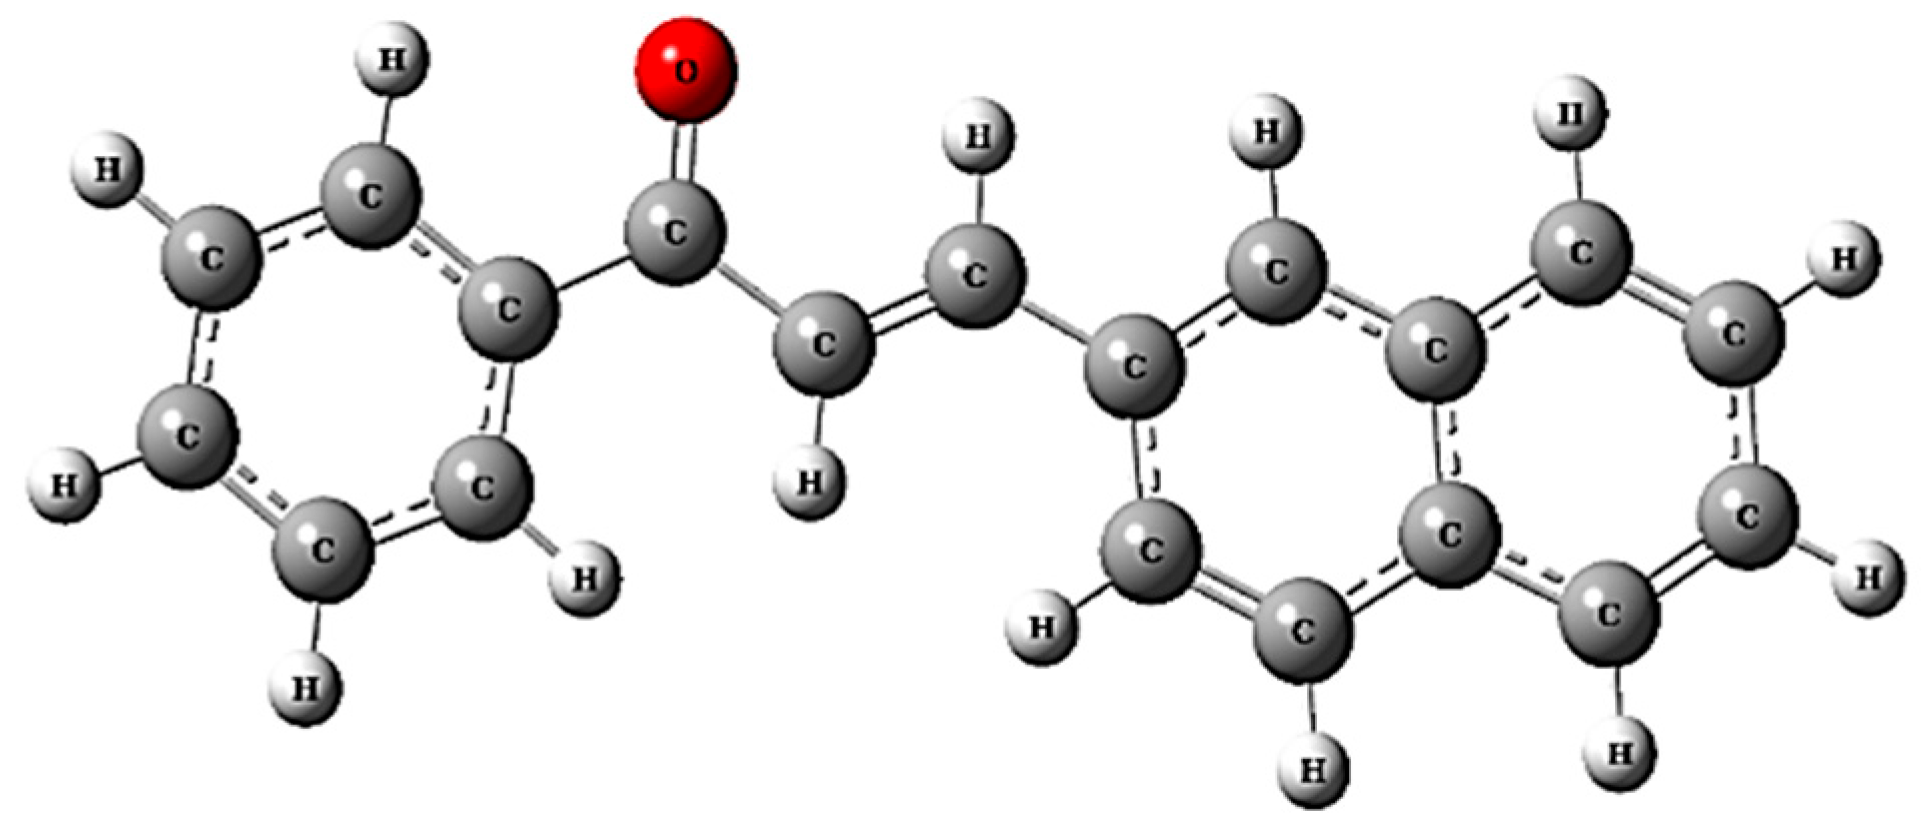
3.6.1. Theoretical Study

The optimized molecular structure of 3NPEO is shown in Figure 8. The ground state dipole moment (μg) is 3.51 Debye indicative of inherent polarity. The excited state dipole moment (μe) is calculated to be 5.72 Debye.
Figure 9a,b illustrate the dipole moment directions of 3NPEO compound, in the ground and excited states, providing insights into the molecular structure. The arrows in the figures show the dipole moments’ orientation, like compass needles pointing towards molecular polarity. Intriguingly, the dipole moments in both states are perfectly parallel, with a zero-degree angle between them. This alignment highlights a unique molecular symmetry, where the electrostatic characteristics remain constant even when the molecule is excited.
Theoretically calculated dipole moments act as computational markers, aiding in the evaluation of the singlet state. When theoretical predictions align with experimental observations, it boosts our confidence in deciphering the molecular intricacies of 3NPEO, creating a more detailed depiction of its electrostatic characteristics. These calculated values were compared with experimentally obtained dipole moments, which were derived using solvatochromic shift methods. This combination of theory and experimental analysis confirms that; our calculations are accurate and helps us to understand more about the moleculer behavior and properties [53,63].

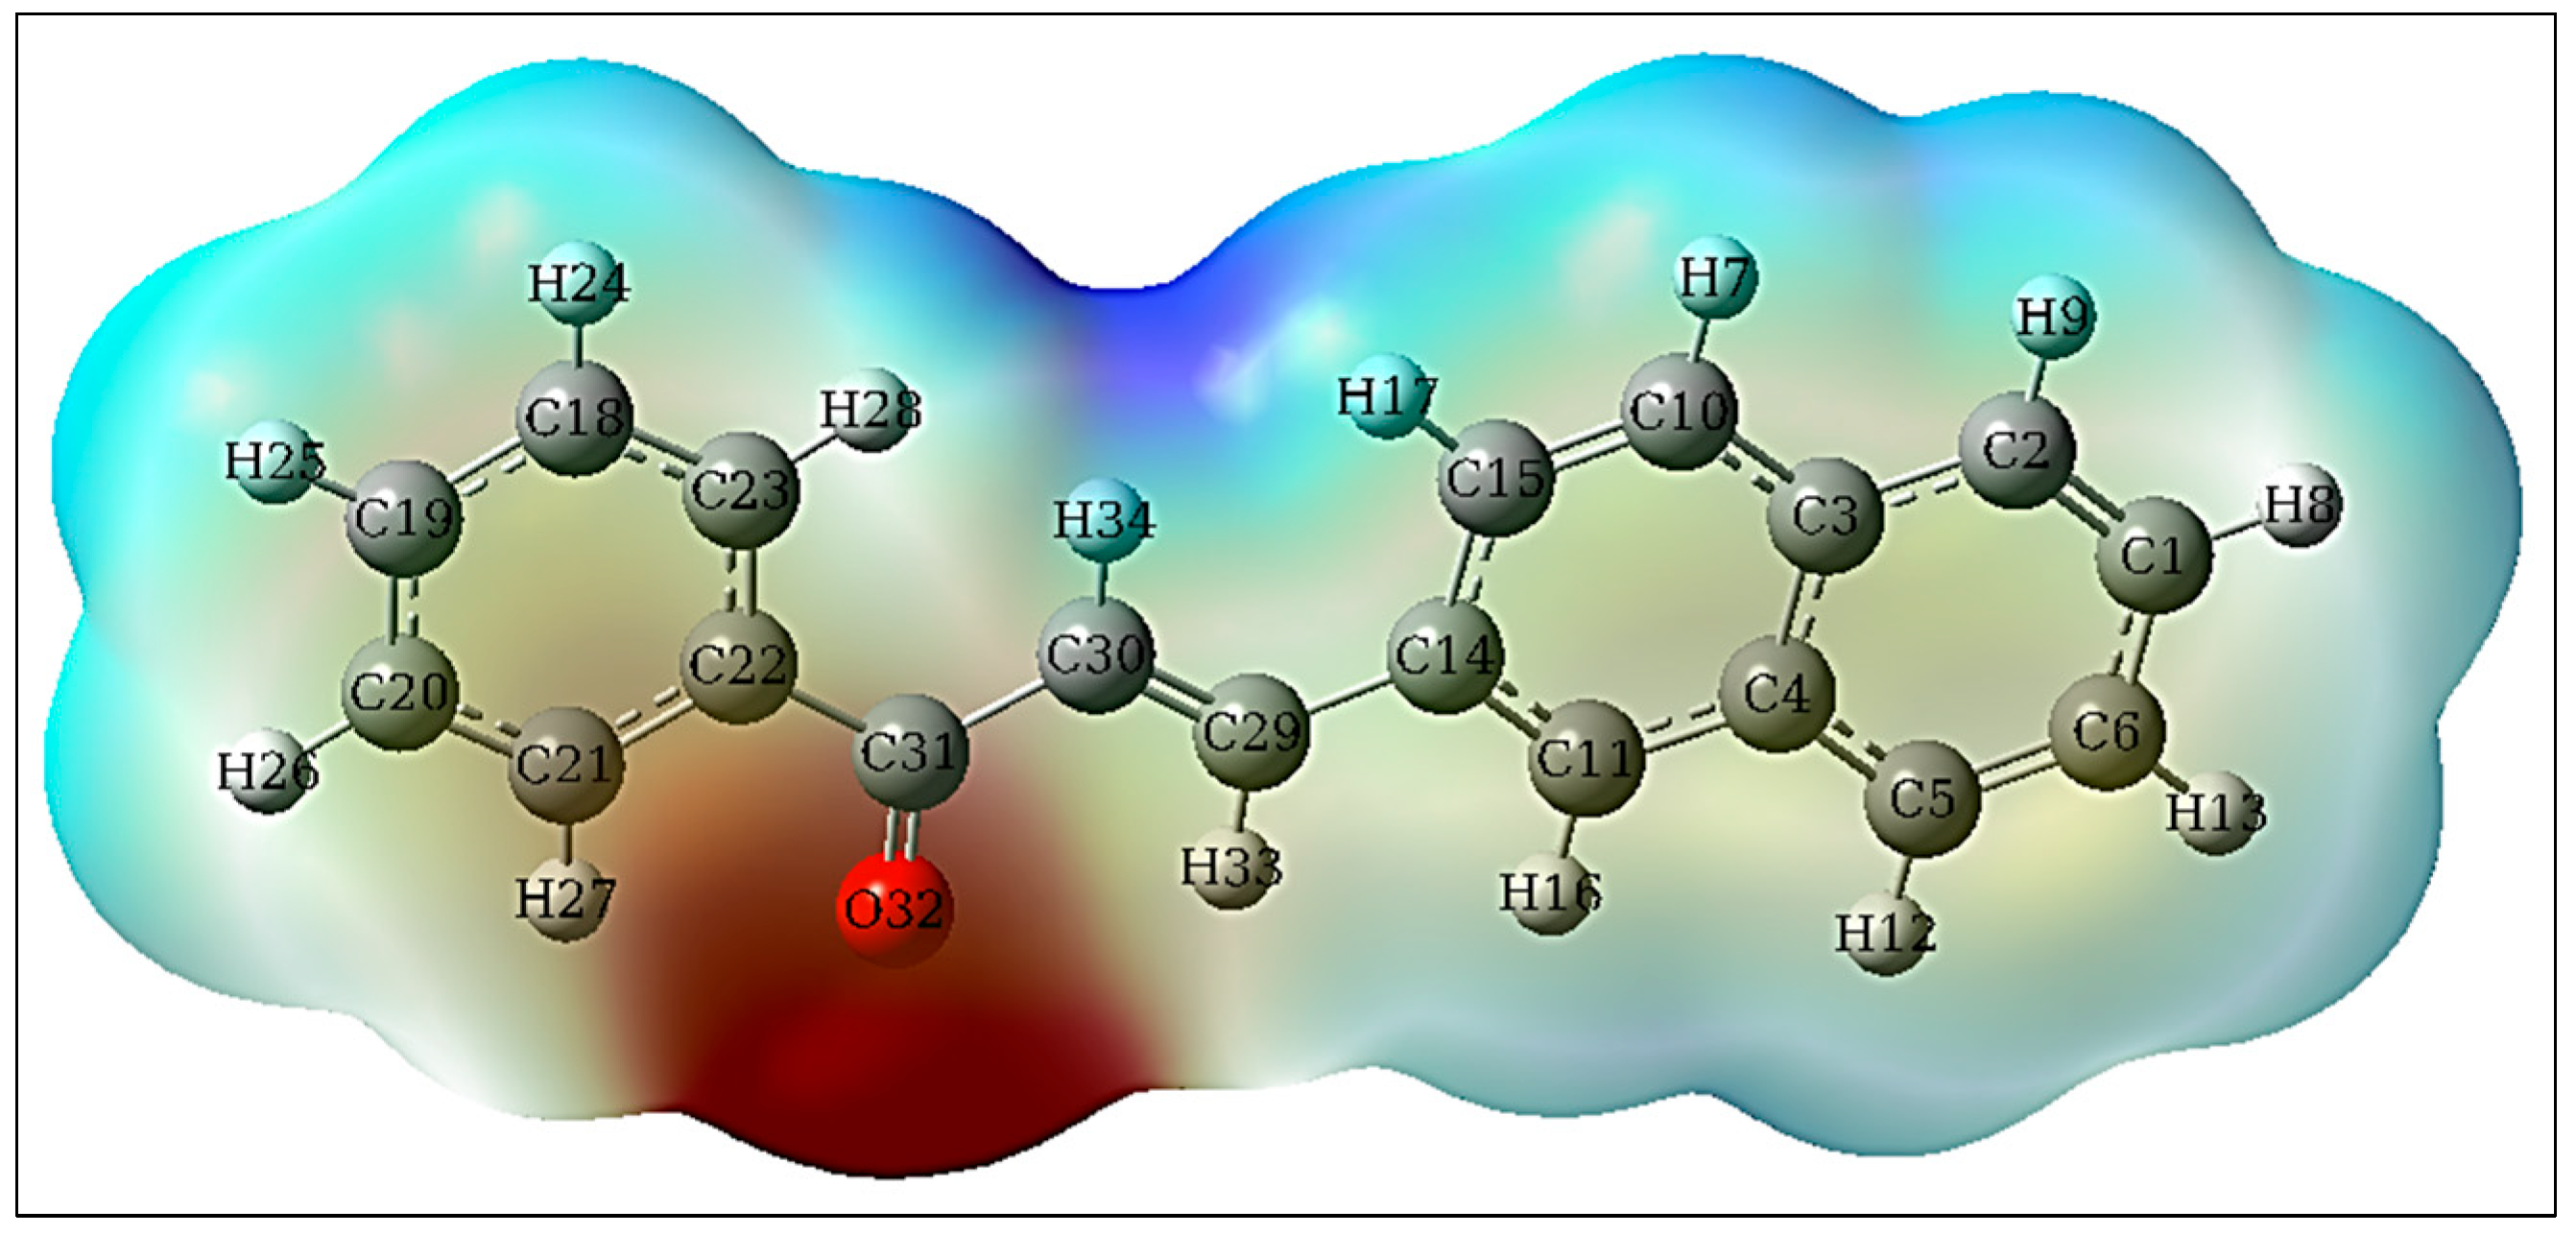
3.6.2. HOMO-LUMO, GCRD and MEP

The 3D plots of HOMO-LUMO and the energy gap of 3NPEO are shown in the Figure 10. The corresponding energy details are shown in the Supplementary Document, Table S3. Since, π-electrons are being straightforwardly polarized, π-electron orbitals and the frontier molecular orbitals are predominantly accountable for the nonlinear optical characters of the probed compound. The first-order hyperpolarizability and FMOs can be found by analyzing their surfaces and their interdependence linkage. The HOMO-LUMO plots showed charge density distribution, with LUMO and LUMO+1 spread over the entire molecule and HOMO and HOMO-1 localized on the aromatic π-conjugated bridge. The small HOMO-LUMO energy gap (3.737 eV) indicates significant intra-molecular charge transfer, resulting in a high second hyperpolarizability value (1.23 × 10⁻²⁶ e.s.u). This suggests the molecule’s potential for nonlinear optical properties [85].
Global Chemical Reactivity Descriptors (GCRDs) provide insights into a molecule’s stability and reactivity. Employing Koopman’s theorem [85] for confined shell molecules, electronegativity, chemical potential, and global hardness can be computed as η =   E L U M O E H O M O 2 , μ =   E H O M O + E L U M O 2 , S =   1 2 η , χ = I + A 2 , and ω = µ 2 2 η by taking −EHOMO as ionization energy (I) and −ELUMO as electron affinity (A). The calculated GCRD parameters are given in Supplementary Data Table S4. The molecule’s small HOMO-LUMO energy gap indicates high chemical reactivity and weak kinetic stability, while a high ionization potential (IP) of 6.225 eV suggests strong reactivity. An electronegativity of 4.83 eV reveals the tendency of electron cloud interaction, and a negative chemical potential indicates stability. The electrophilicity index of 5.794 eV suggests good electrophilicity, associated with higher chemical potential and lower chemical hardness. Global hardness and softness values categorize the molecule as relatively soft, and the electrophilicity index quantifies the stabilization energy upon saturation by electrons, providing insights into structural, reactivity, and selectivity patterns.
The molecular electrostatic potential (MEP) surface reveals potential sites for electrophilic and nucleophilic interactions [86,87]. Notably, oxygen atoms exhibit negative potential regions, while hydrogen atoms display positive potential regions, indicating areas susceptible to non-covalent interactions. The molecular electrostatic potential surface of the molecule generated by their optimized geometries is shown in Figure 11. The red indicates electrophilic attack sites and blue indicates nucleophilic attack sites, with values of −0.0354 a.u. and 0.0224 a.u., respectively, indicating potential sites for non-covalent interactions.

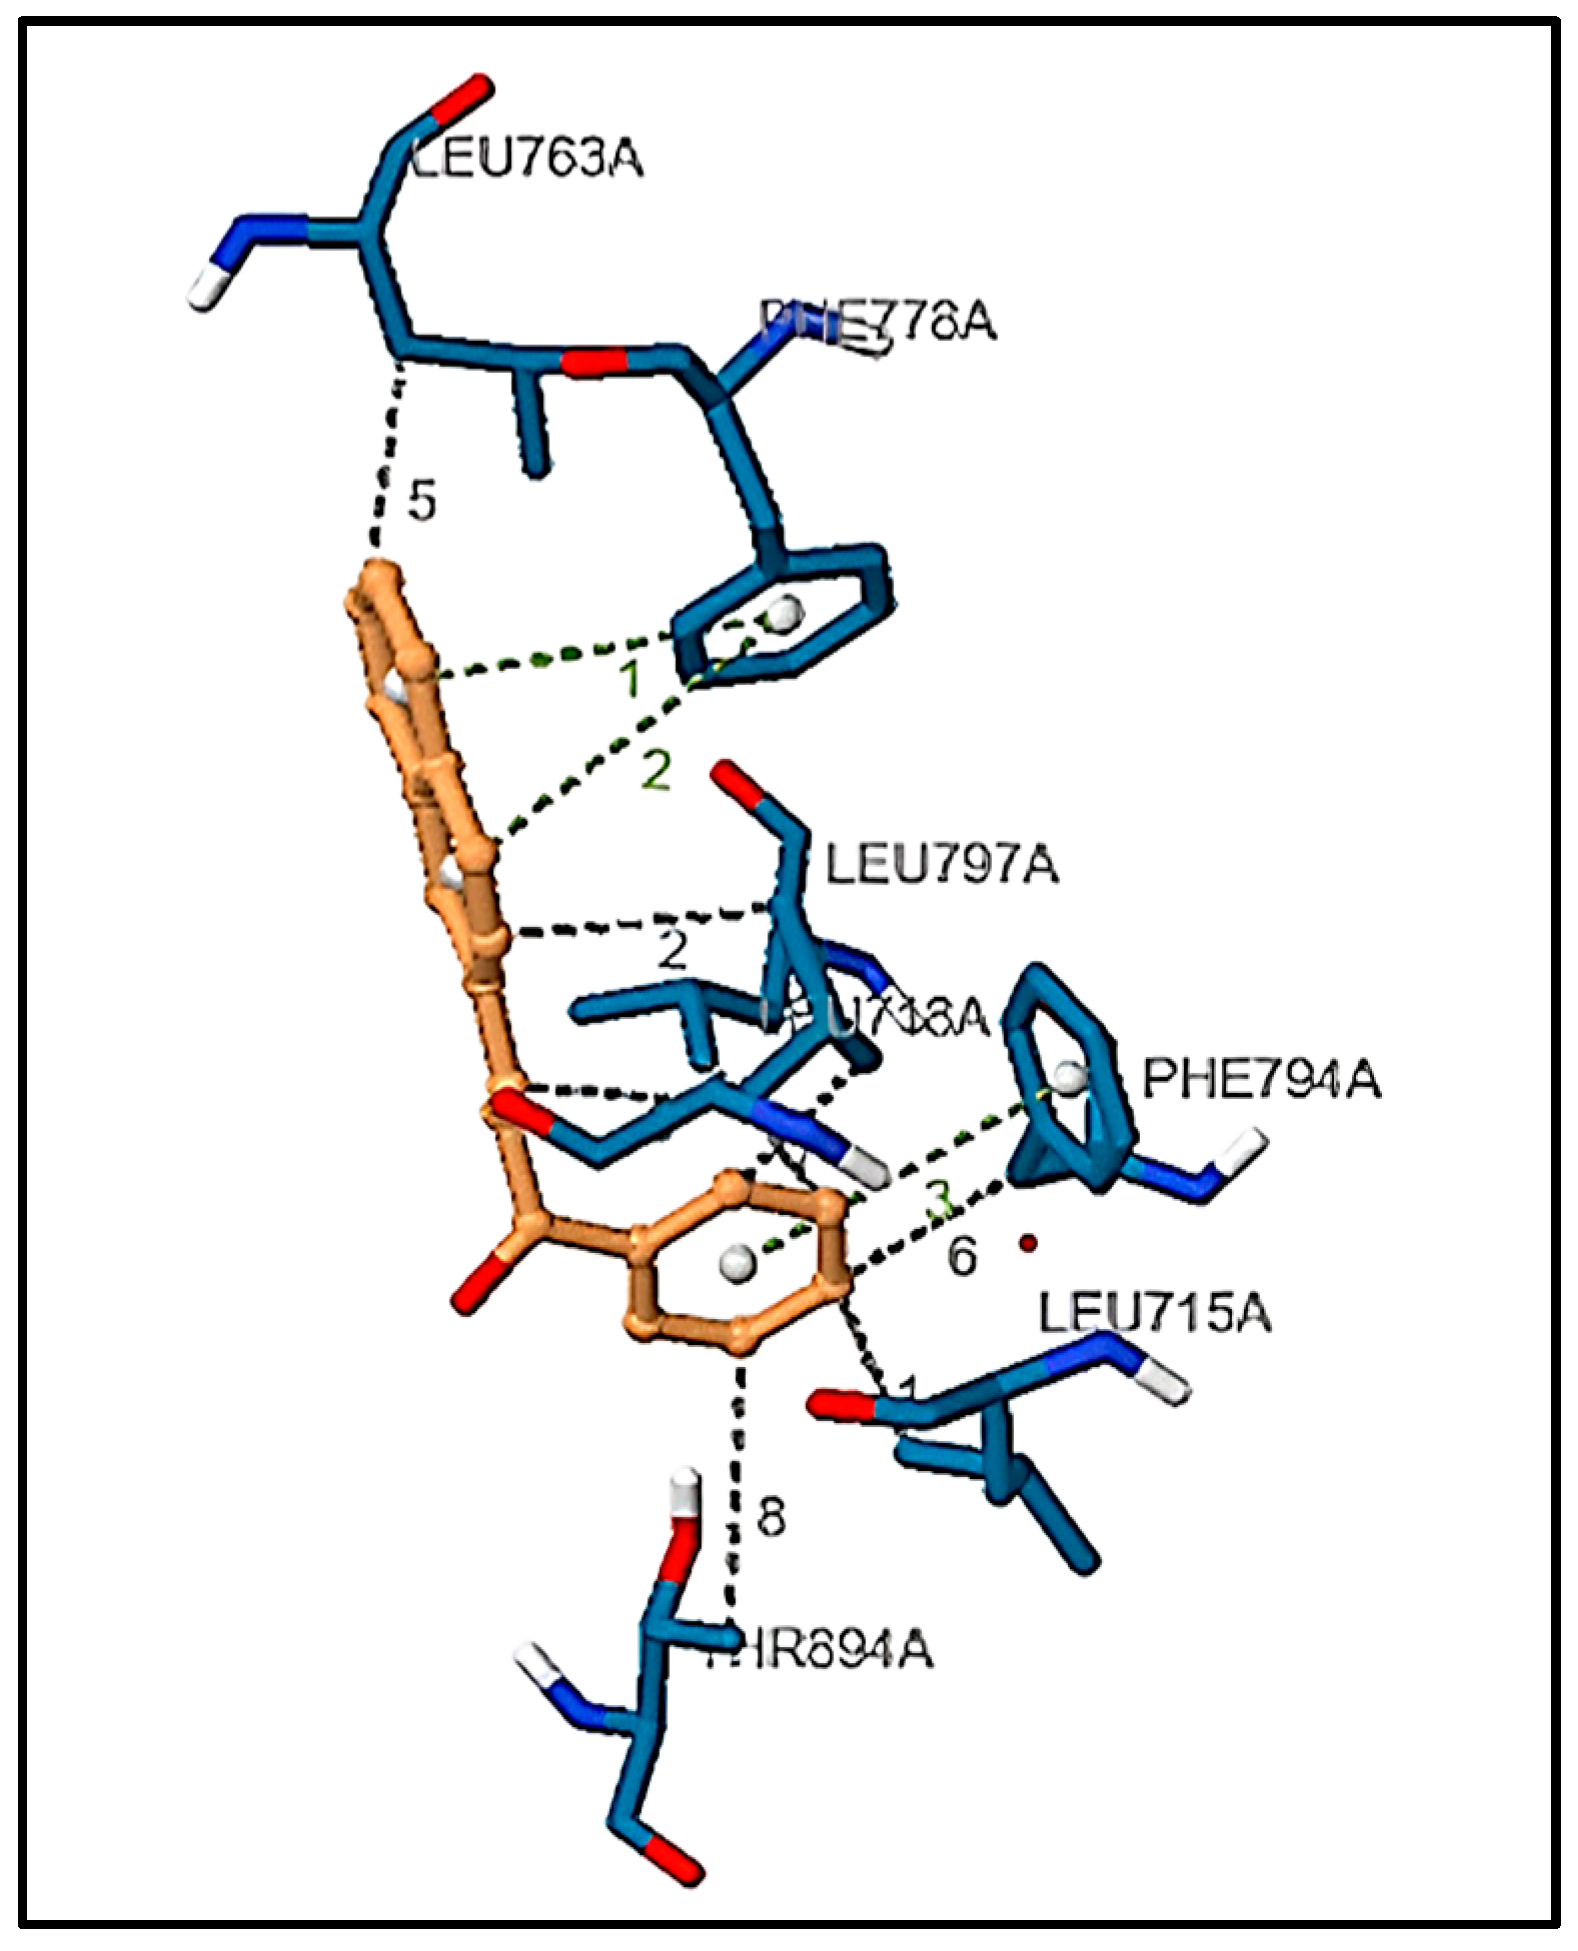
3.6.3. Structure Preprocessing, Validation, and Molecular Docking

The test molecule 3NPEO has docked and is represented in Figure 12. The PDB structure of 4OAR was downloaded, pre-processed, and validated. The missing residues, ALA-900, LEU-901, SER-902, VAL-903, GLU-904, PHE-905, PRO-906, GLU-907, MET-908, LYS-932, and LYS-933 were homology modelled back to generate complete protein model. The generated model had an ERRAT Overall Quality Factor of 95.7447. Ramachandran plot statistics indicate 90.7% residues in the most favored region, 8.8% in the additionally allowed region, 0.4% in the generously allowed region, and none in the disallowed region. DSSP analysis indicates that the model has 61.6% α-helices, 3.6% 3-helices (310 helix), 4.4% extended strand residues that participate in β ladder, 10.8% hydrogen bonded turns, 6.4% bends, and 13.2% coils. This comprehensive analysis showcases the protein model’s diverse structural components and overall stability and integrity. The validated model was further set as the receptor for molecular docking with the optimized ligand using Vina [88].
Upon generating the docking poses, we filtered the poses based on the affinity values. The best-generated docking pose had a binding affinity of −35.564 kJ/mol. The molecular docking scrutiny of the protein (PDB ID: 4OAR) provides significant insights into probable communications with the synthesized compound. The docking score was 35.564 kJ/mol, representing considerable binding affinities between the protein and the synthesized compound. The interacting protein sites were also found to be different and included LEU 763, PHE 778, LEU 718, PHE 794, and LEU 715. Nanjundaswamy et al. (2022) reported two thiophene-based chalcone derivatives for their activity against bacteria with docking scores of −25.104 kJ/mol and −29.706 kJ/mol [89]. Thillainayagam et al. (2017) reported that the docking of different chalcone derivatives was also performed for antimalarial activity; the docking scores ranged from −54.182 to −5.564 kJ/mol [90]. Our study has a binding score of −35.56 kJ/mol, indicating strong affinity binding according to the docking scores.

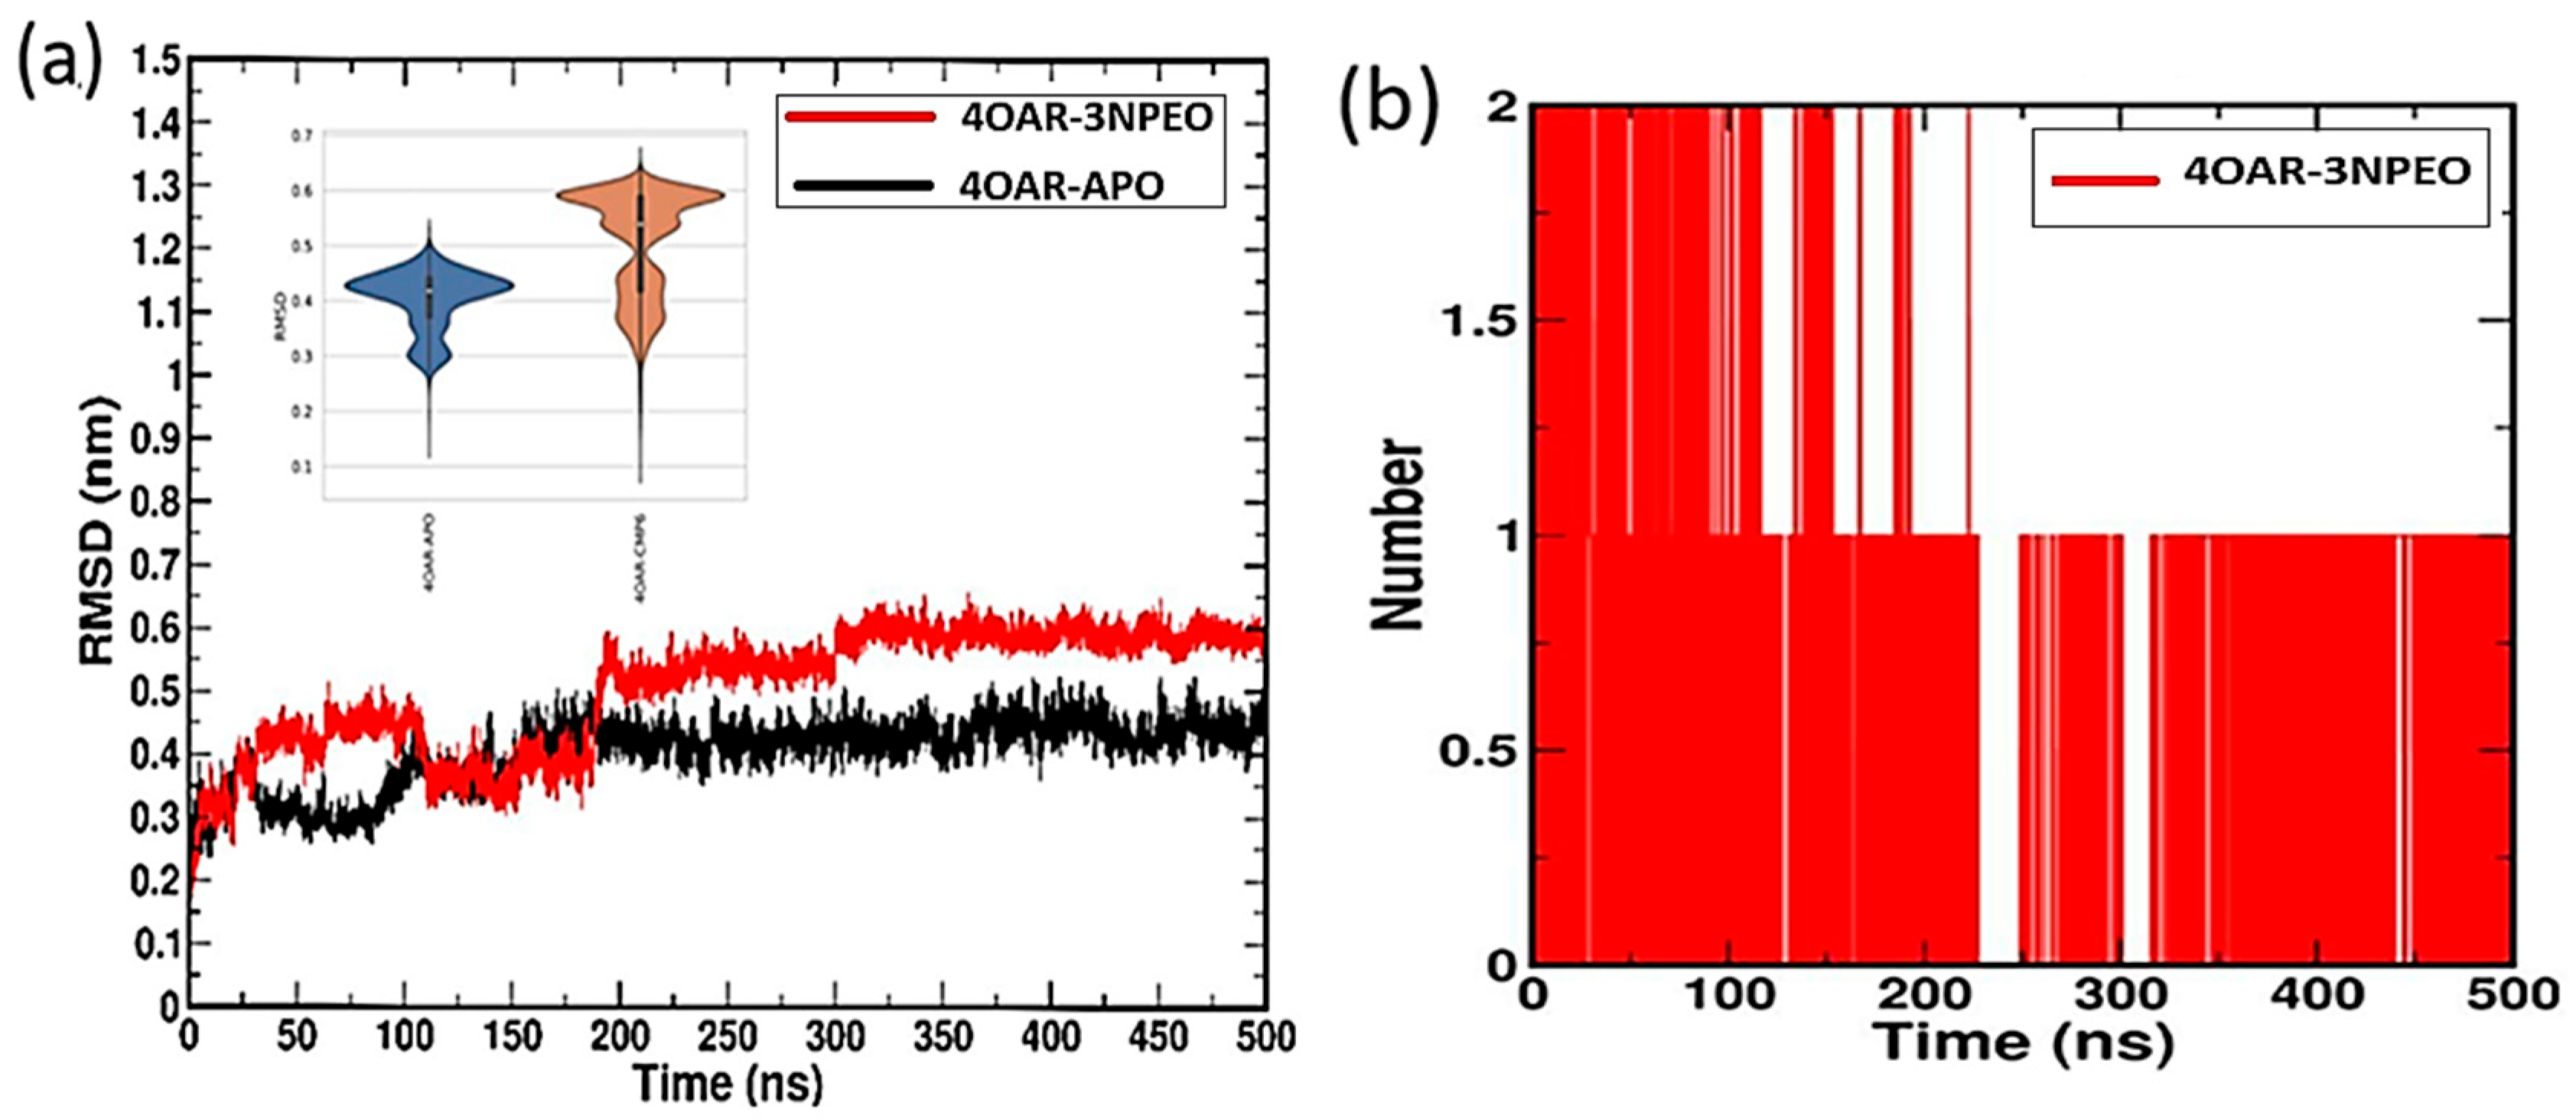
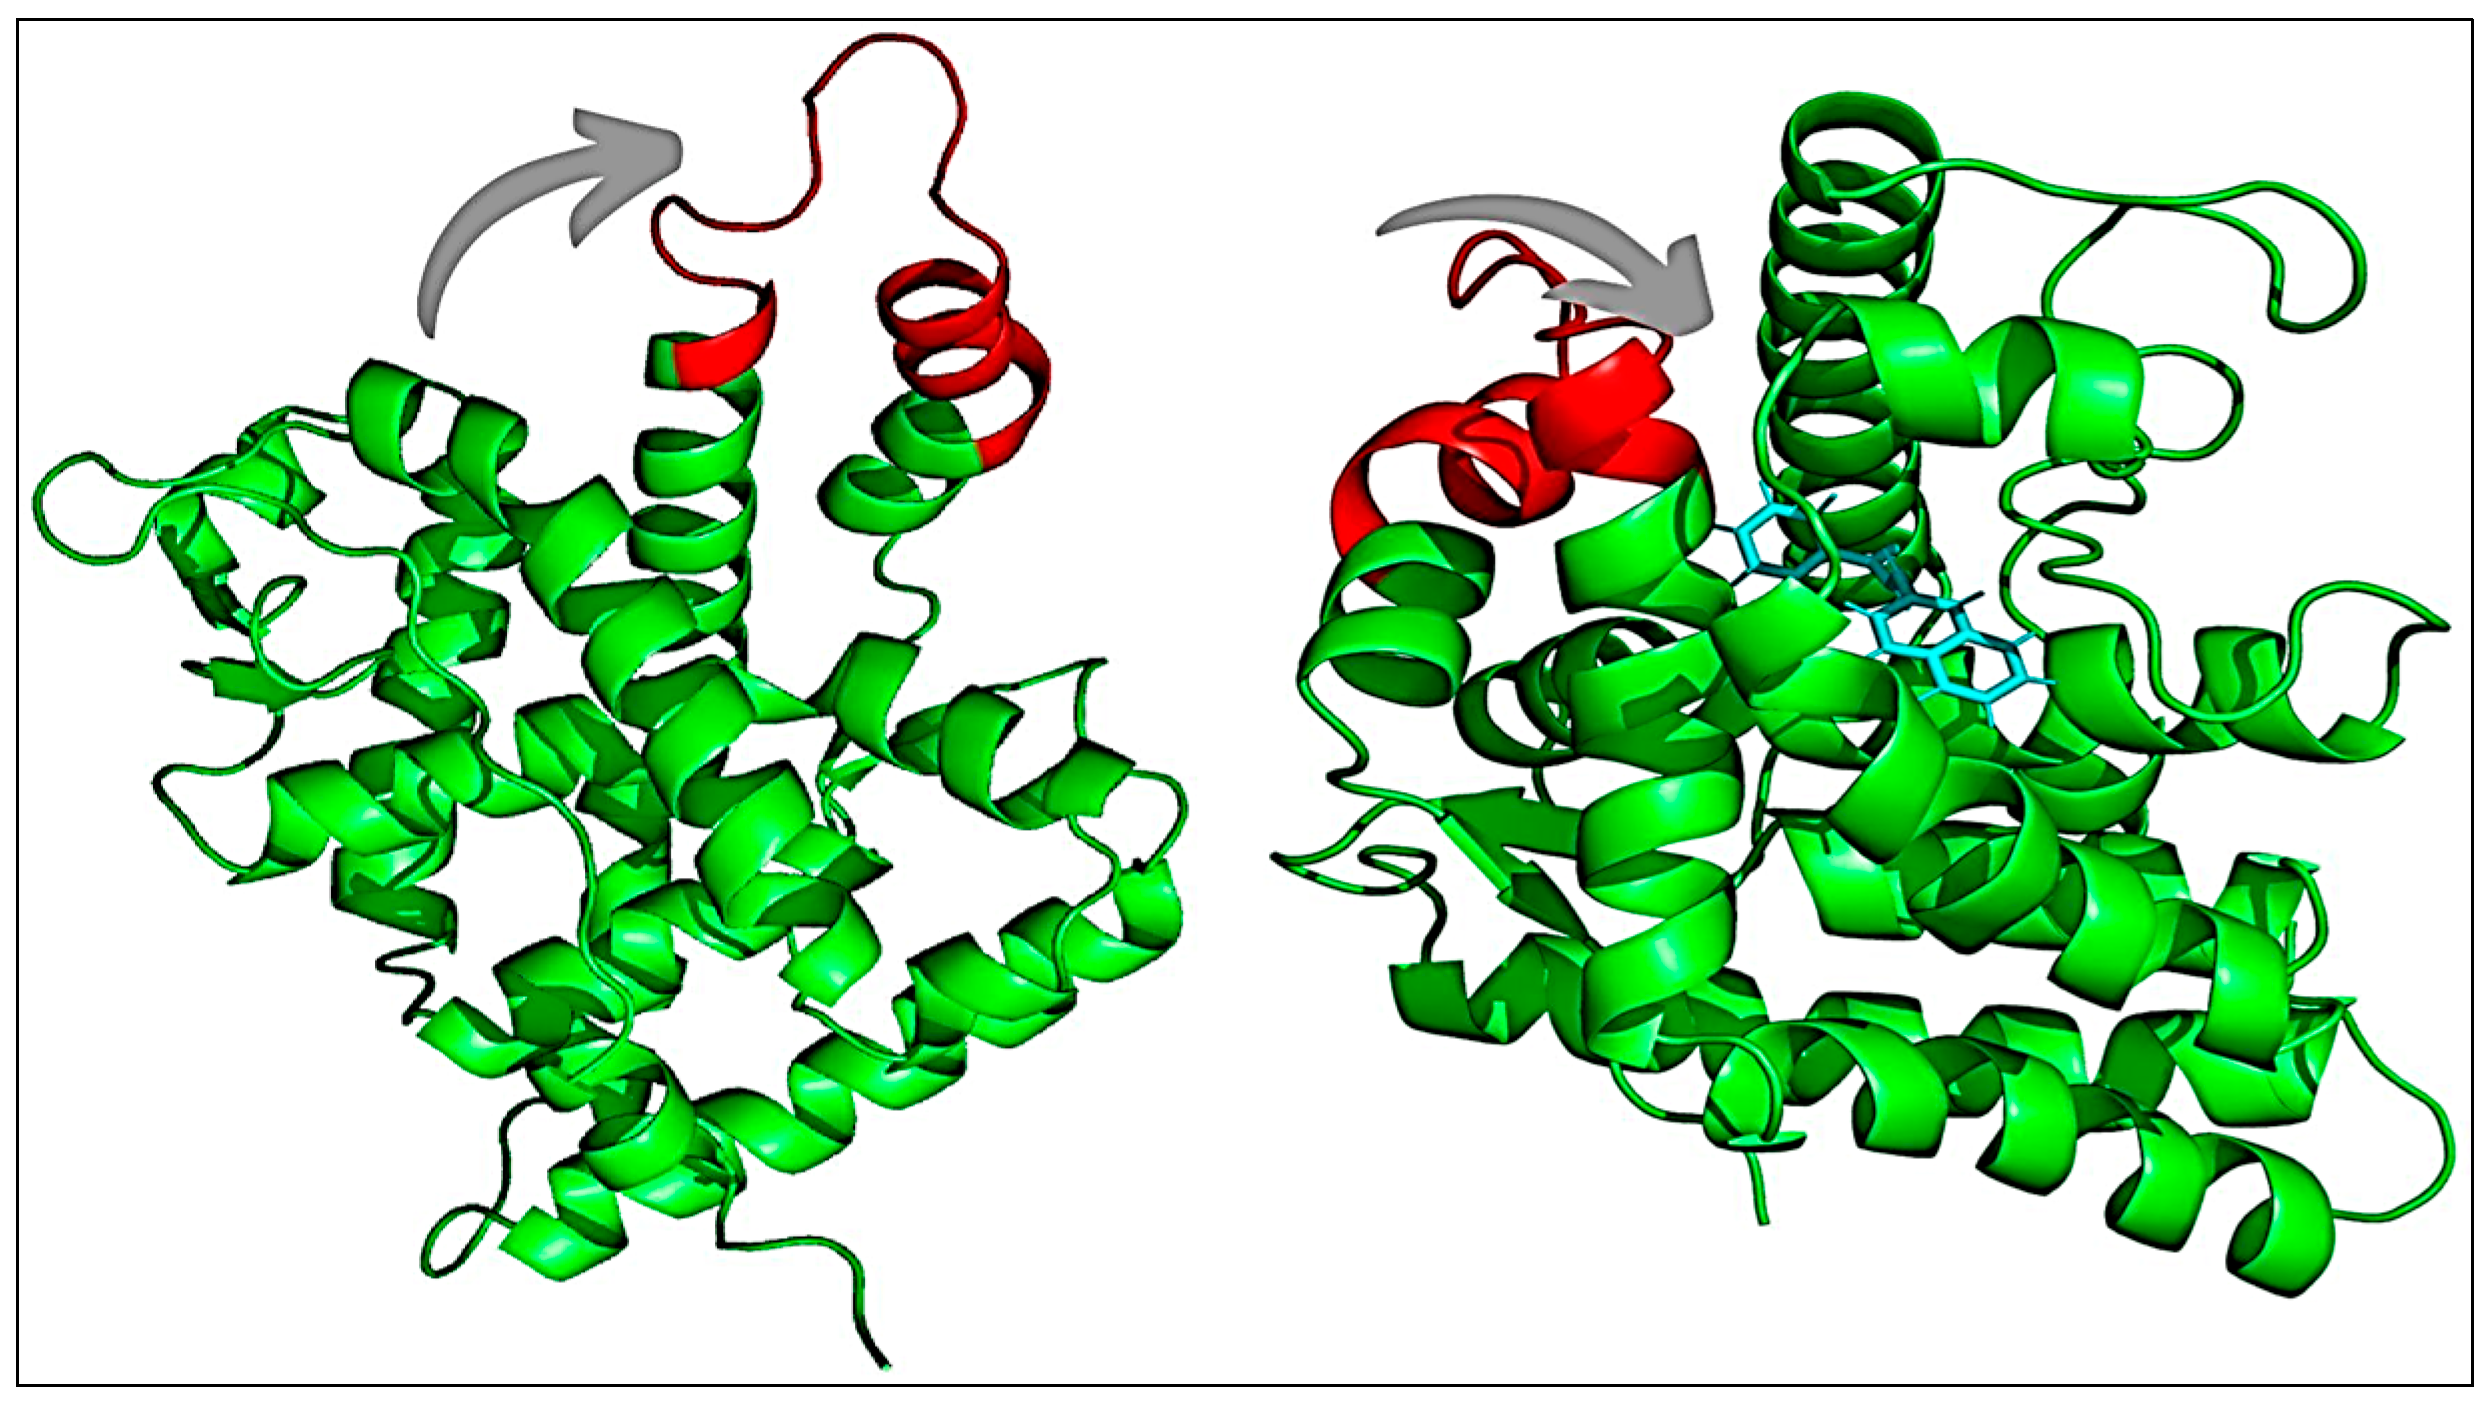
3.6.4. Simulation Trajectory Analysis

This study used molecular dynamics simulations for 4OAR-APO and 4OAR-3NPEO to demystify the ligand’s efficiency. The simulation was carried out for 500ns with the generated model and the docked complex as input. Figure 13 implies the trajectory for calculating the backbone atom Root Mean Square Deviation (RMSD) to monitor structural stability during simulation yielded an average value of 0.4021 nm for 4OAR-APO and 0.5030 nm for 4OAR-3NPEO. However, as evident from the RMSD graph in Figure 13a, a stable trend in the RMSD values is observed for both systems beyond the 300ns mark. This hints at convergence and the suitability of this stable trajectory window for further analyses. The hydrogen bonds between 4OAR and the ligand were calculated as depicted in Figure 13b. Evidently, up to two hydrogen bonds exist in 4OAR-3NPEO. We then calculated the Root Mean Square Fluctuation (RMSF) of the protein residues to observe the deviation in fluctuations around the averaged position of the amino acids. As seen in Figure S6, significantly high fluctuations can be observed for 4OAR-APO relative to 4OAR-3NPEO. The fluctuations in the regions marked as A, B, and D can be accounted for by the loops that exist in the region, as evident in the Secondary Structure Evolution plot in Figure S6. Fluctuations in the region marked as E peaks at 0.6149 nm for 4OAR-APO. In comparison, it is 0.1573 nm for 4OAR-3NPEO. This significant difference in fluctuation is due to the ligand’s interaction with the helix–loop–helix region that denies its outward movement, as observed in 4OAR-APO of Figure 14. Therefore, this hints that the ligand has significant stabilizing effects on the protein’s fluctuations.
It can be widely recognized that the flexibility and density of a protein are closely entangled, and the compactness of the protein significantly impacts its solvent accessible surface area. To investigate the impact of inhibitors on protein compactness, we determined the radius of gyration (Rg) of the protein. Additionally, to examine the effect of inhibitors on the accessible surface area of the protein for the solvent, we calculated the solvent accessible surface area (SASA). The kernel density estimation (KDE) plots of SASA and Rg for all systems are illustrated in Figure 15. This analysis clearly points out the effects of inhibitors on the conformational states of 4OAR, as seen from the KDE plot in Figure 15. 4OAR-3NPEO has a much more compact and less bulky conformation with average SASA and Rg values of 129.5627 nm and 1.8307 nm, respectively. Conversely, average SASA and Rg values for 4OAR-APO were 136.0825 nm and 1.8765 nm, respectively. This might be due to the capability of the ligand to induce conformational changes within the protein that subsequently changed the compactness and the surface area.

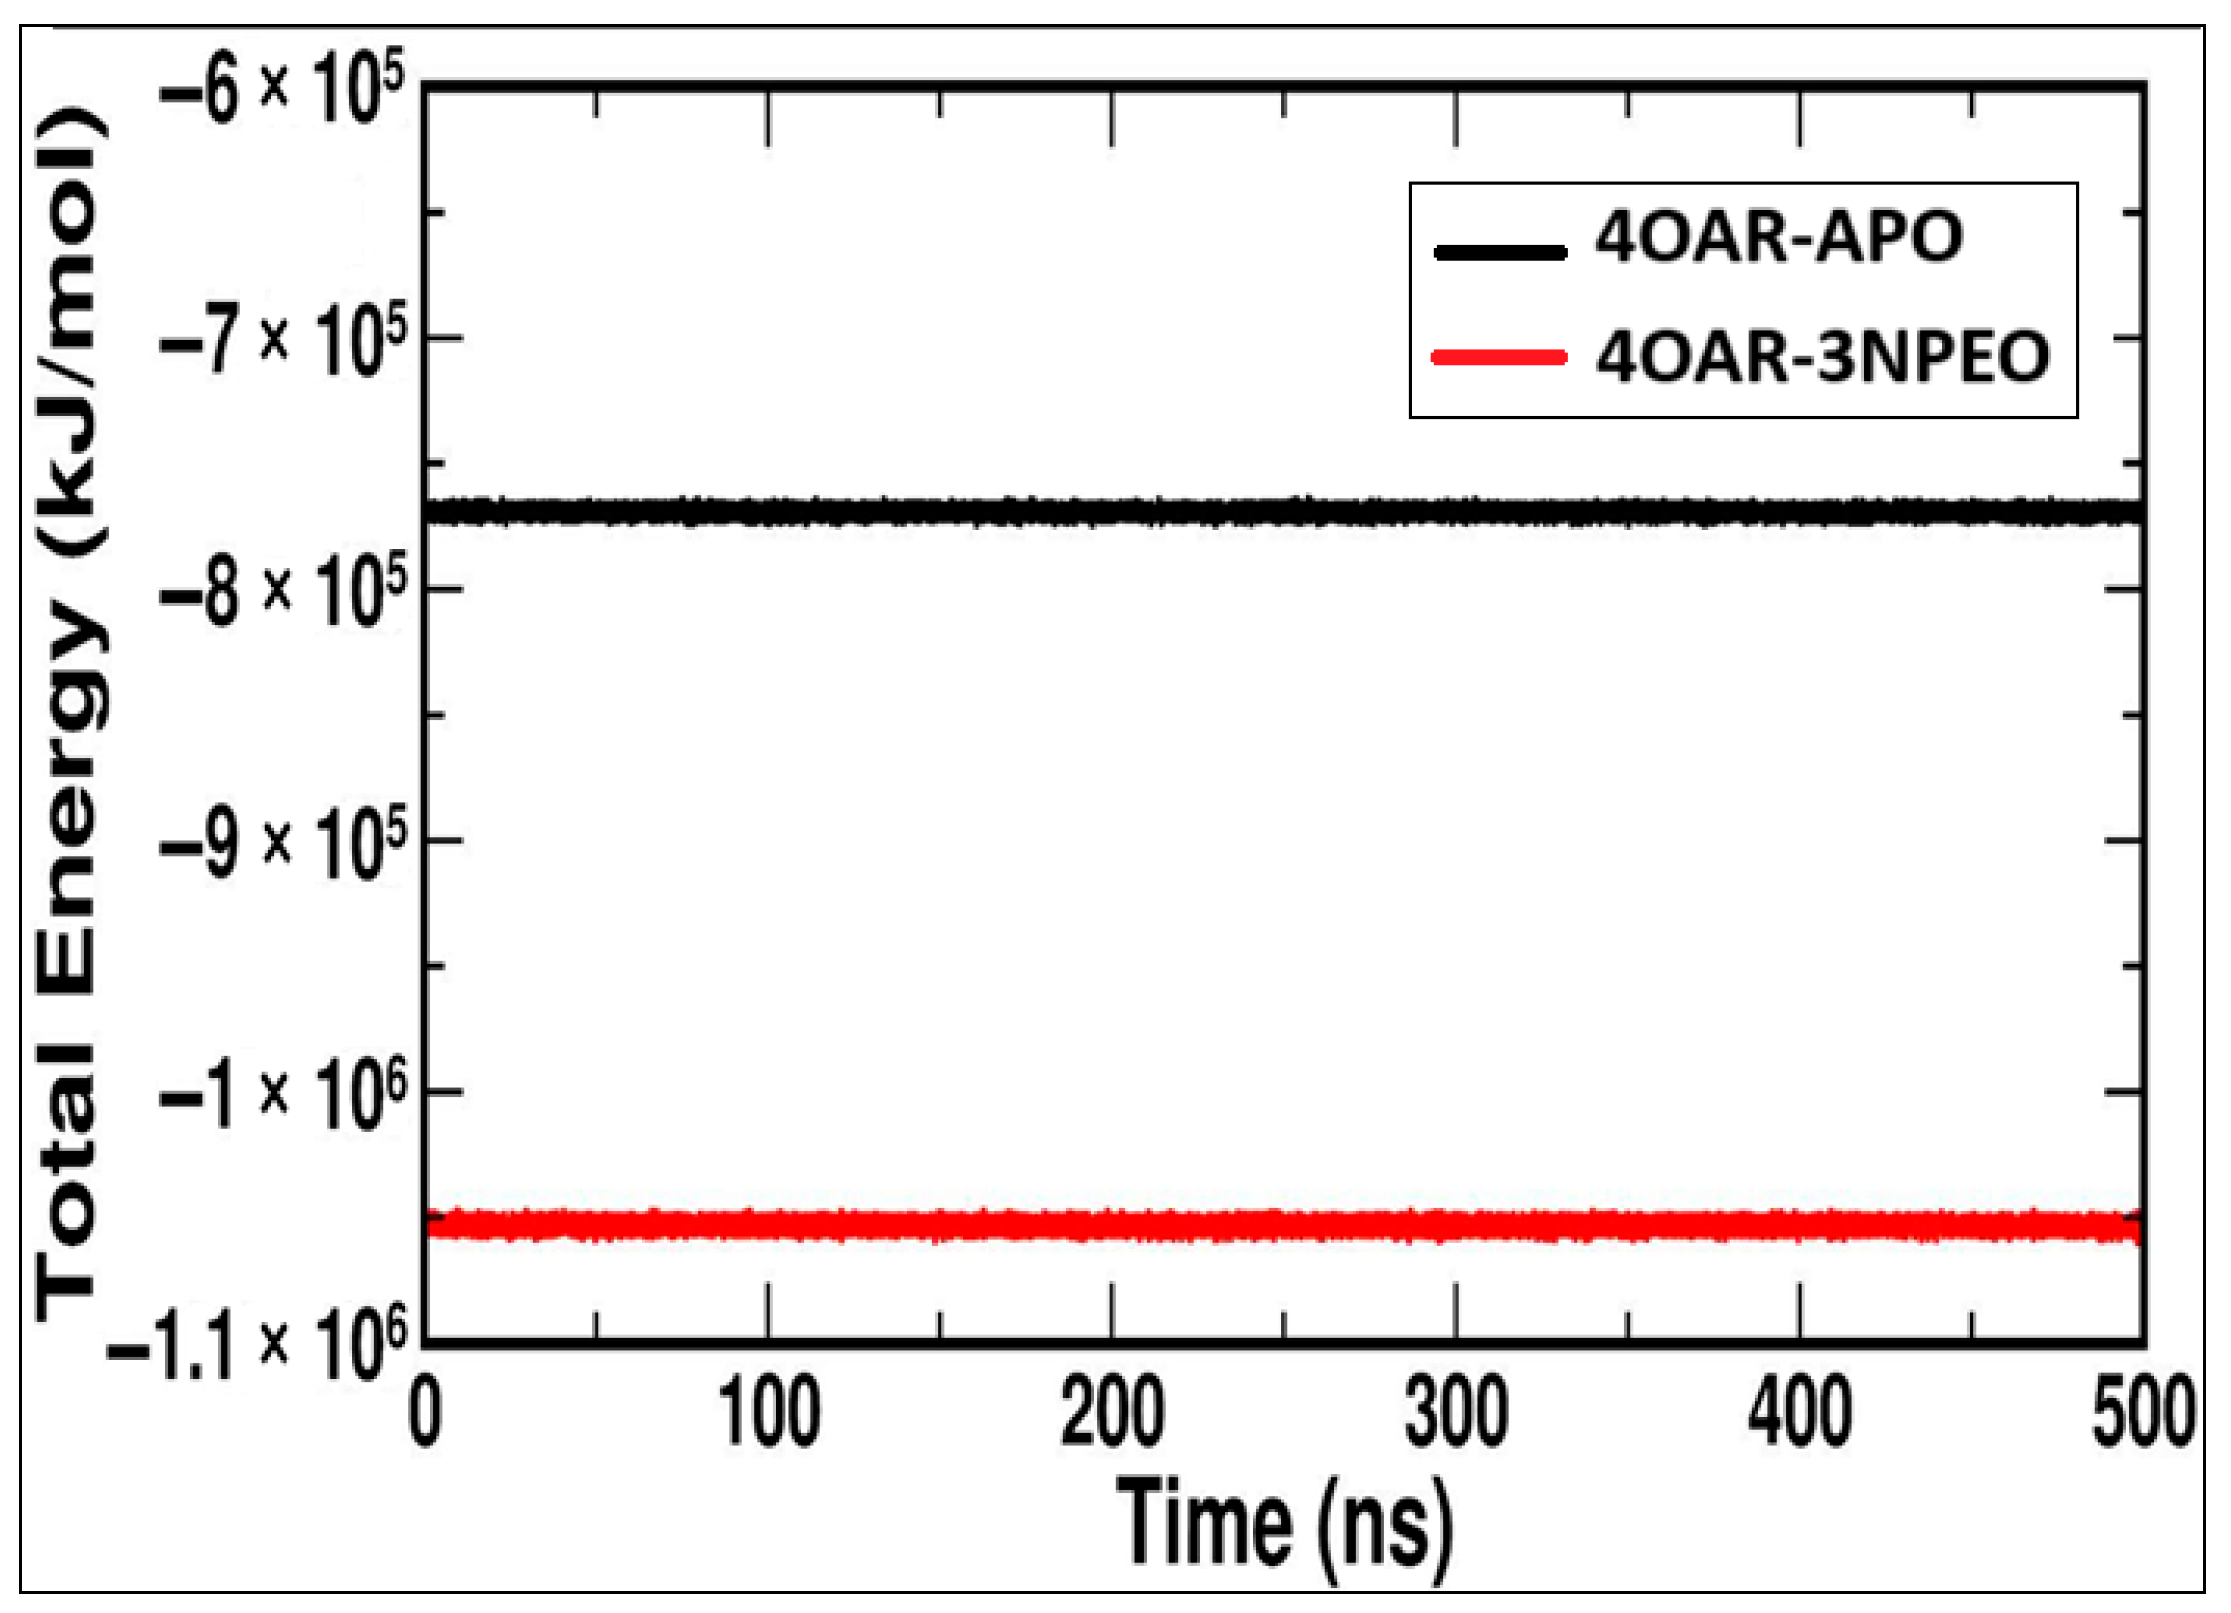
3.6.5. Conformational Minima, Binding Energy, and Total System Energy

We explored the interaction between two key metrics: the radius of gyration (Rg) and the Root Mean Square Deviation (RMSD). These metrics provide valuable insights into the structural dynamics and stability of our systems. Rg measures the compactness of a structure, indicating how mass is distributed around its center of mass, effectively characterizing molecular size. Although a scalar quantity, Rg can be thought of as one axis in the multidimensional free-energy landscape (FEL). In contrast, RMSD measures the difference between two structures, accounting for every individual atom in a molecule. This offers a high-dimensional axis in the FEL, capturing the back-and-forth motions of flexible molecules. By analyzing the relationship between Rg and RMSD within the FEL, we gain critical insights into the conformational space accessible to the molecule and the energy barriers associated with transitions between structural states.
Our observations revealed conformational minima for 4OAR-3NPEO (−13.384 kJ/mol Free Energy, 0.5762 nm RMSD, and 1.825 nm Rg) and 4OAR-APO (−12.612 kJ/mol Free Energy, 0.416 nm RMSD, and 1.872 nm Rg). The energy dynamics for 4OAR-3NPEO, as observed in Figure 16. The 4OAR-3NPEO system exhibited higher RM7SD values and achieved a lower minimum with compact conformations, undergoing energy barrier jumps with two metastable states.
The overall energy of the systems was calculated using GROMACS energy, which sums all energy components, including potential, kinetic, bond, angle, dihedral, non-bonded, and distance restraint energies. As seen in Figure 17, the overall energy of −7.69280 × 10⁻⁵ kJ/mol for 4OAR-APO and a lower energy value of −10.53075 × 10⁻⁵ kJ/mol for 4OAR-3NPEO. This suggests that the ligand plays a significant role in stabilizing the protein’s dynamics and energetics. Table 7 summarizes the energy terms and their individual contribution to the total binding energy between 4OAR and the ligand. A binding energy of −125.888 +/− 11.935 is estimated to exist for the 4OAR-3NPEO protein–ligand system. The high binding energy between the protein and the ligand suggests the efficiency of the ligand in binding to 4OAR and its potential to act as an effective inhibitor. The simulation aims to elucidate the complex’s dynamic behavior, stability, and structural dynamics, providing an in-depth elucidation of the structural dynamics and stability of protein complexes are critical factors in determining their functional properties and stability of protein complexes 4OAR-APO and 4OAR-3NPEO, accompanying their functional inferences in biological frameworks. The work explicates the response of these complexes during a 500 ns simulation spanned by numerous studies, as well as RMSD, RMSF, Rg, SASA, MM-PBSA, and FELs. Negligible variations in RMSD signify elevated stability during the simulation, with minor increases noted for 4OAR-3NPEO while still within permissible thresholds [89,90].

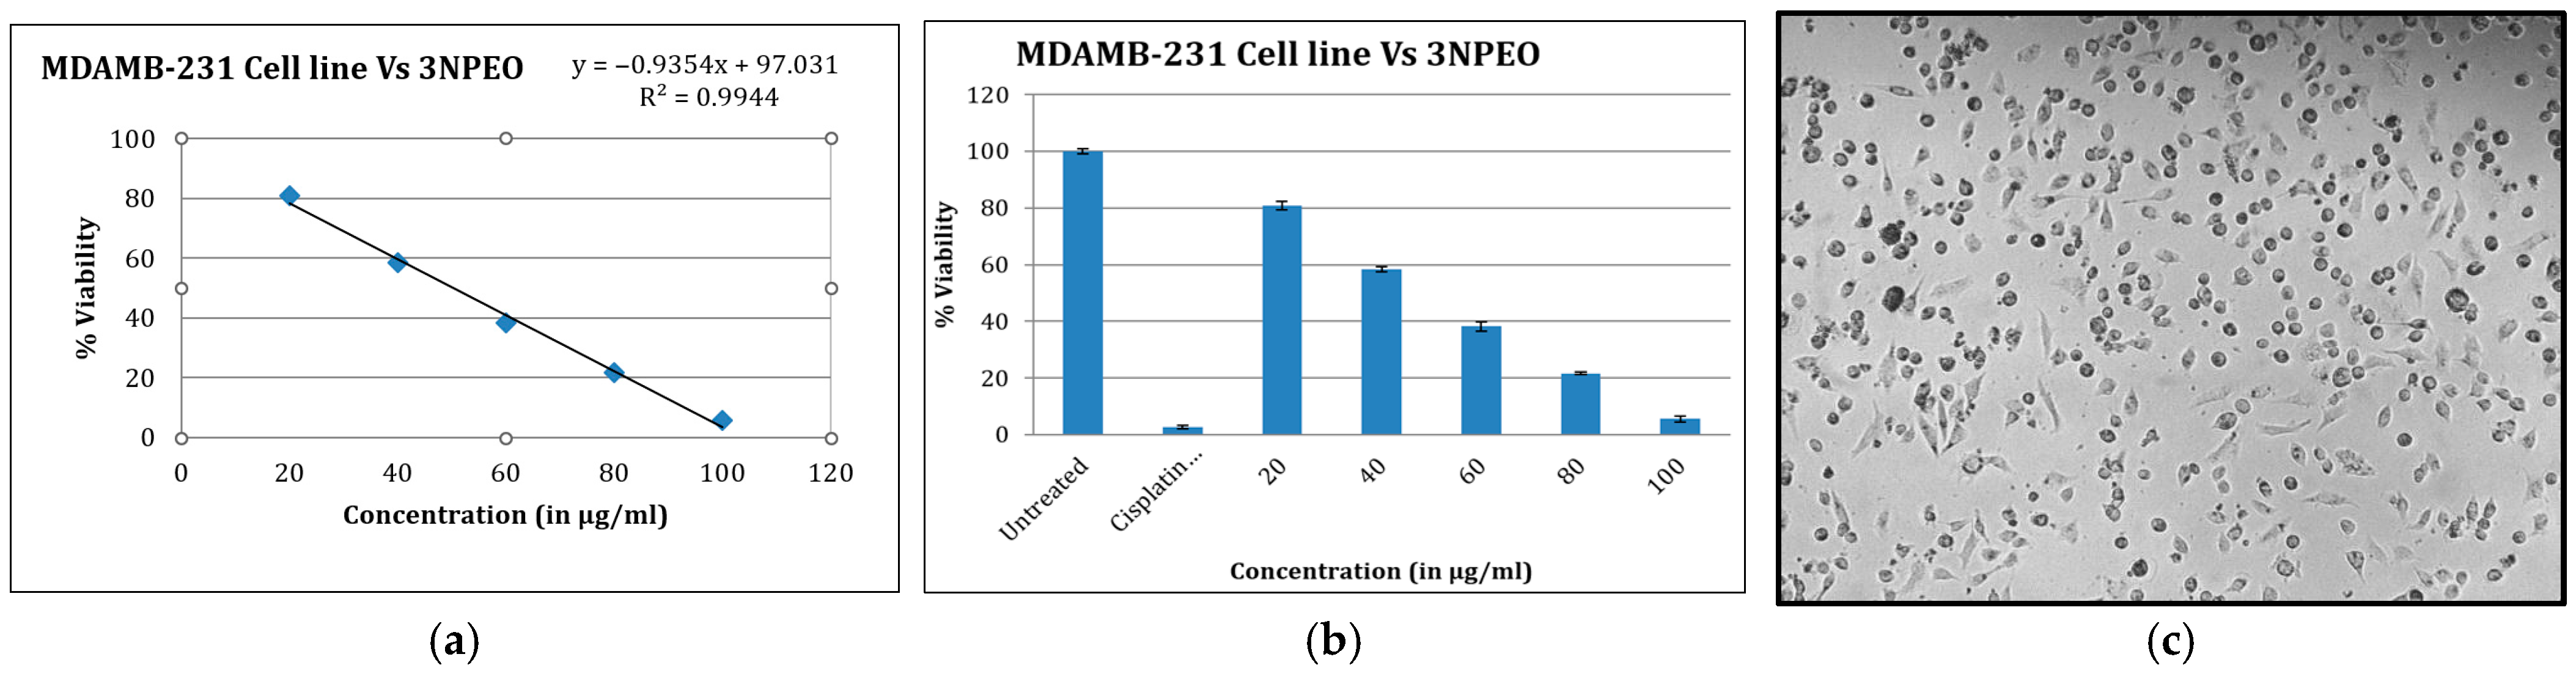
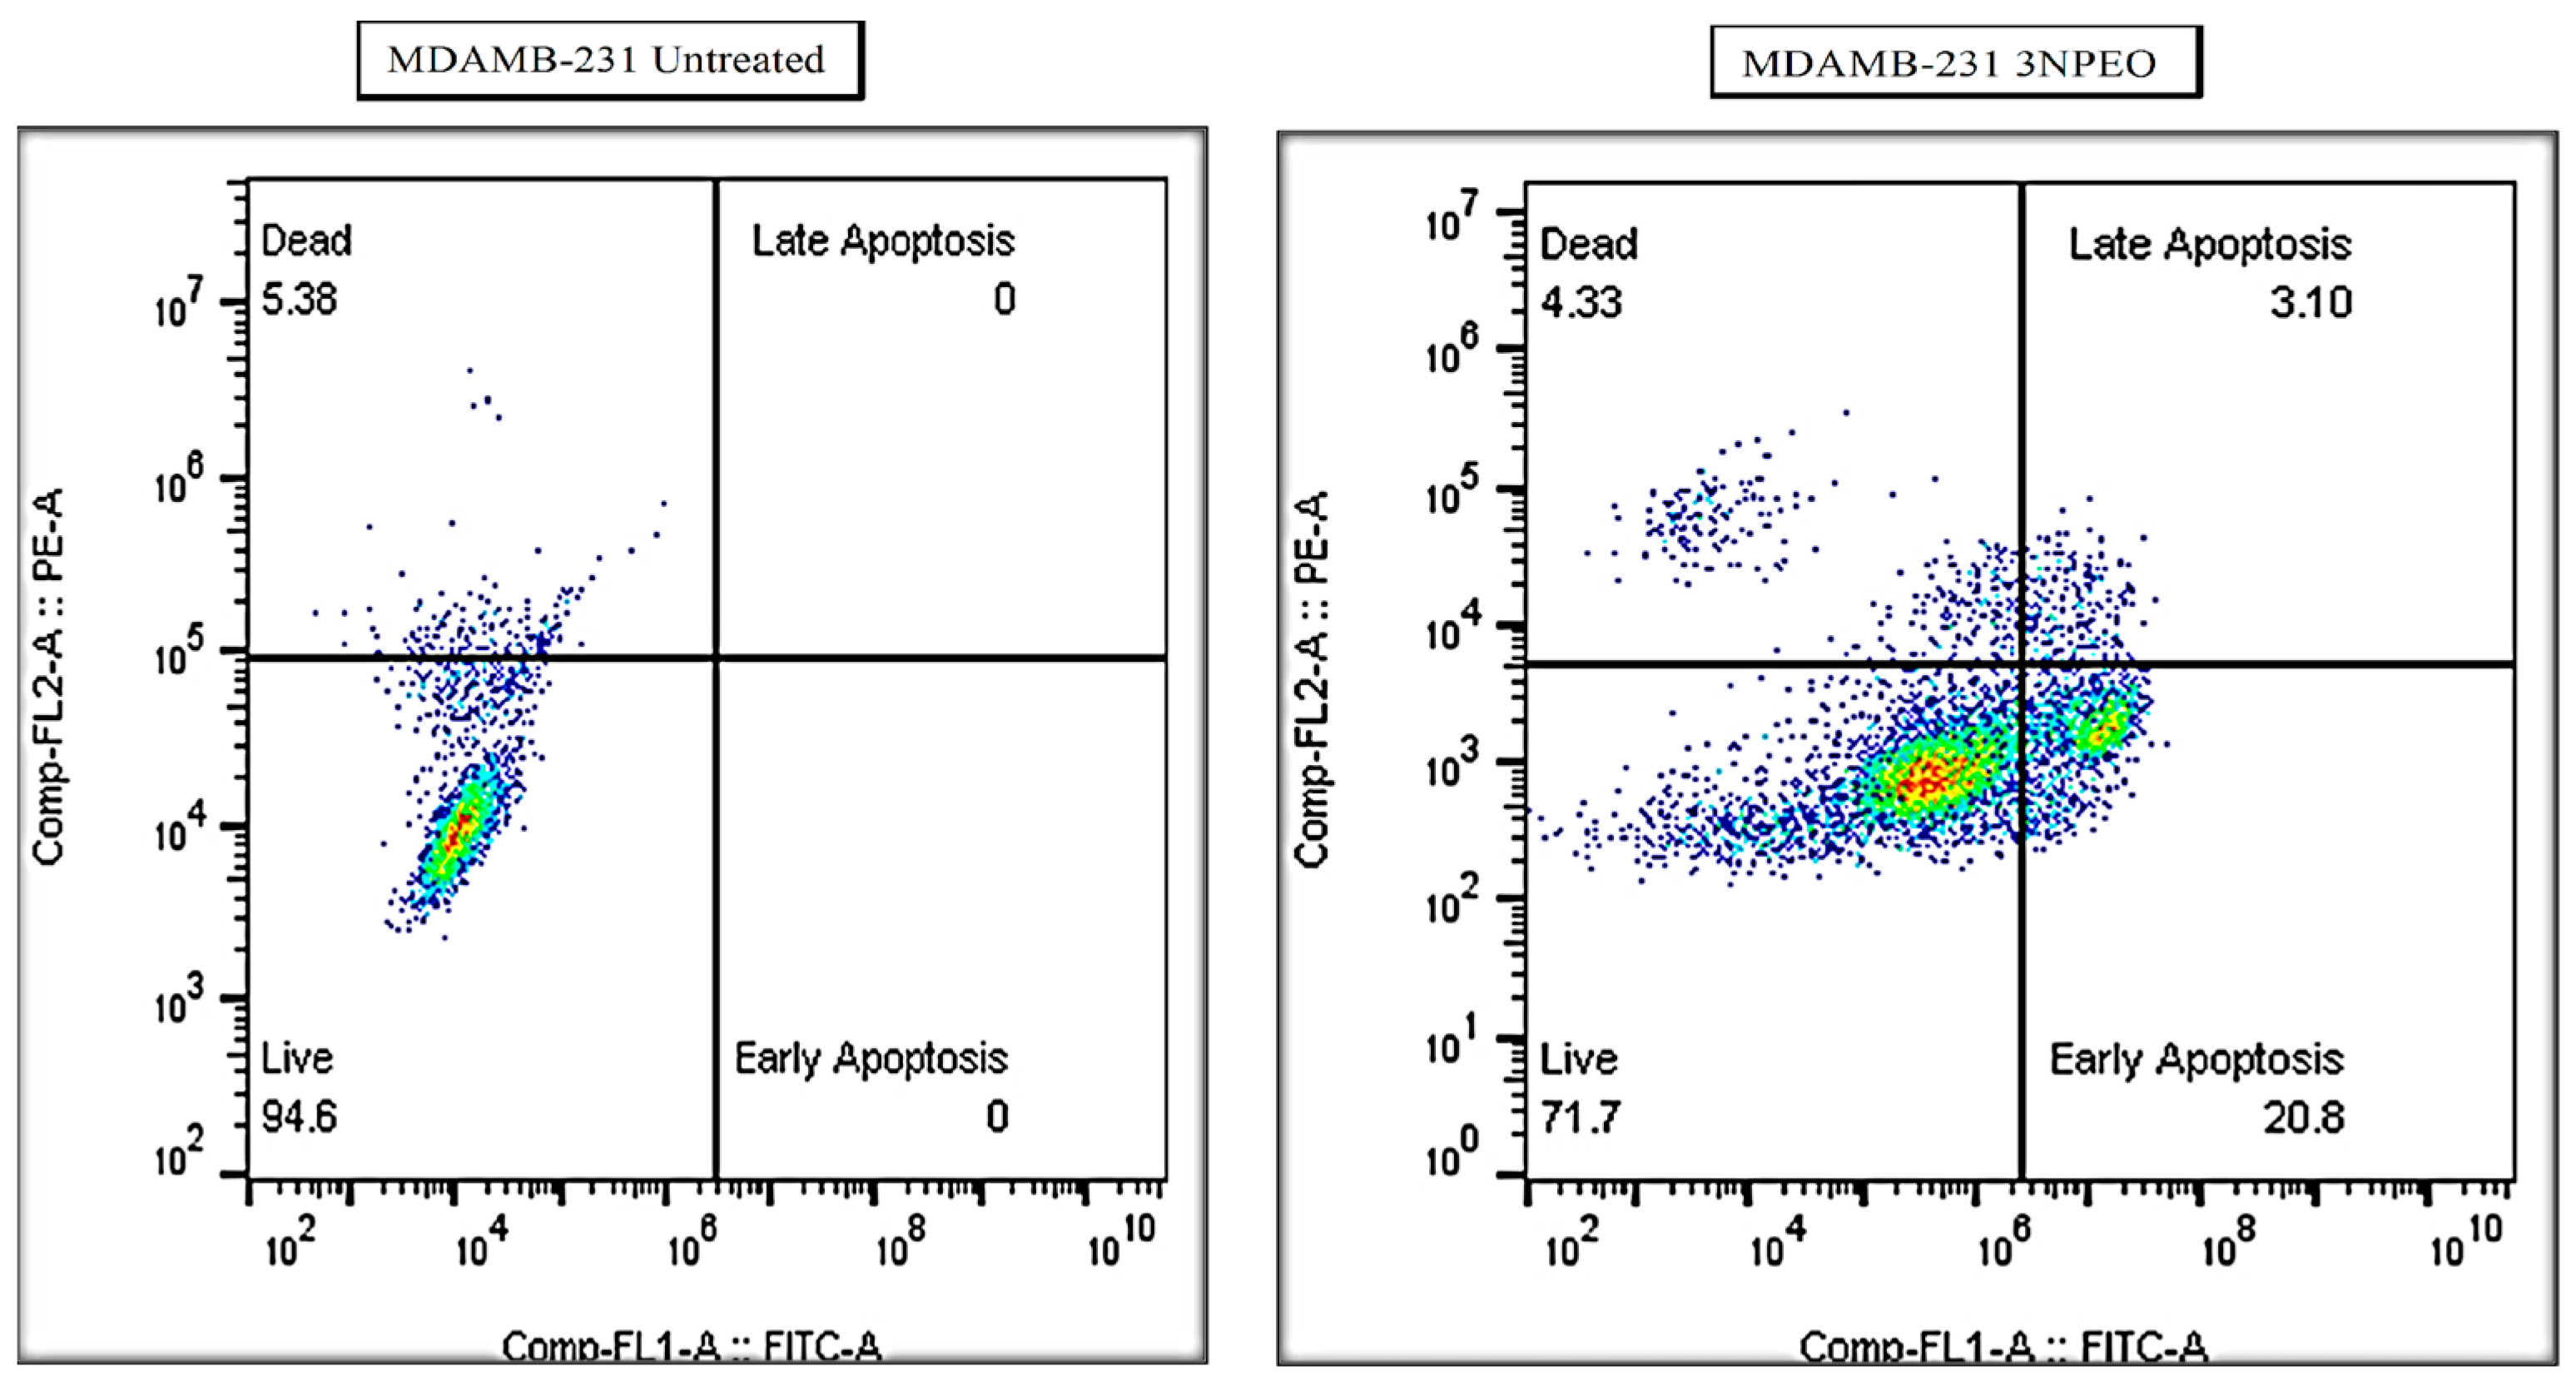
3.7. Cytotoxicity Studies and Detection of Early and Late Apoptosis

In our in vitro study, we assessed the effect of the 3NPEO compound on the viability and proliferation of breast cancer cell lines. The MDAMB-231 cell line was treated with varying concentrations of the compound for 48 h. Cell viability was subsequently measured using the MTT assay, with results depicted in Figure 18a–c.
Our research demonstrates the anticancer potential of 3NPEO against the MDMAB-231 triple-negative breast cancer cell line, as assessed using the MTT assay. Untreated cells and those treated with cisplatin served as control groups. Cisplatin, a platinum-based chemotherapeutic agent, is commonly used in the treatment of various aggressive cancers [91]. The results showed a dose-dependent effect, with higher concentrations of 3NPEO leading to a significant decrease in cell viability. Cell viability decreased with increasing compound concentration, inhibiting cell proliferation. Specifically, the IC50 value for the MDAMB-231 cell line was determined to be 50.27 µg/mol [92], with an investigation of an MTT assay of 3NPEO on the TNBC cell line determining the IC50 to be 44.07 µg/mol [83].
The results reveal that there was no sign of apoptosis in the case of untreated cells, whereas, in the case of the synthesized compound treated with MDAMB-231 cells, it showed positive results for early and late apoptosis around 20.80% and 3.10% of cells, respectively, and is represented in Figure 19. The study in breast cancer MDAMB-231 cells revealed that the synthesized compound induced apoptosis, as represented in Table 8.
Apoptosis, a vital process for the removal of malfunctioning cells, presents potential as a curative goal in cancer therapy [92,93]. Thoughtful apoptotic tracks may assist in the creation of innovative representatives. Moreover, regulating cell sequence evolution is essential for suppressing lump development, as indicated by the occurrence of mutations in cell cycle supervisors across numerous malignancies [91,94]. Flow cytometry-based cell cycle analyses clarified the machinery of accomplishment of 3NPEO, representing cell cycle apprehension at several segments in healed MDAMB-231 cells. The chalcone molecule confirmed promising anticancer efficacy contrary to the breast cancer cell line.

4. Conclusions

A combination of experimental and theoretical methods revealed a conical intersection between the S1 and S0 potential energy surfaces in a chalcone derivative. DFT theory helps us to predict and correlate the charge transfer character of the 3NPEO compound. Understanding factors like intersystem crossing and internal conversion is key for optimizing applications in probes, sensors, and electron transfer reactions. The third-order nonlinear refractive index (n2), nonlinear susceptibility (χ3), and nonlinear absorption coefficient (β) are of the order 10−9 cm2/W, 10−6 esu, and 10−5 cm/W, respectively, for 3NPEO chalcone. The chalcone revealed upright optical limiting threshold rates of about 4.0 kJ/cm2.
Furthermore, a comprehensive investigation of the synthesized chalcone’s anticancer properties was conducted using docking studies, molecular dynamics simulations, and various assays, including MTT and apoptosis analysis. The docking study against PDB ID 4OAR yielded a favorable binding score of −8.5 kcal/mol. Molecular dynamics simulations over 200 ns confirmed the stability of the complex. The consistently positive results from all experiments support the potential anticancer efficacy of the 3NPEO molecule.
In addition, a comprehensive investigation of synthesized chalcone’s anticancer properties employing various methodologies, such as docking studies, molecular dynamics simulations, and investigational assays, including the MTT assay and apoptosis analysis, has yielded significant new insights. We have performed the docking investigations against PDB id 4OAR, which yielded a favorable score of −8.5 kcal/mol. Molecular dynamics and simulations were conducted for the complex under study over a duration of 200 ns, during which the complex exhibited stability throughout the investigation. All experiments demonstrated favorable outcomes, and the results align with the anticancer efficacy of the synthesized molecule.

Supplementary Materials

The following supporting information can be downloaded at: https://www.mdpi.com/article/10.3390/photochem5030020/s1, Figure S1. The chromatogram data of 3NPEO. Figure S2. Z-Scan experimental setup to measure the NLO parameters. Figure S3. (a) Bilot– Kawski graphs of ( v - a v - f ) vs. f(ε, n), (b) ( v - a + v - f ) vs φ(ε, n) of 3NPEO. Figure S4. Graphs of (a) Lippert–Mataga ( ν - a ν - f ) vs. F1(ε, n), (b) Bakhshiev ( ν - a ν - f ) vs. F2(ε, n) and (c) Kawski–Chamma–Viallet ν - a +   ν - f 2 vs. F3(ε, n) of 3NPEO. Figure S5. Reichardt’s graph ( ν - a   ν - f ) vs E T N of 3NPEO. Figure S6: Root Mean Square Fluctuation and the Secondary Structure Evolution (SSE) plot for 4OAR-APO and 4OAR-CMP6. The fluctuating regions and their corresponding position in the SSE plot are marked as A, B, C D and E in red. Table S1 The values of ε, n, E T N polarity parameters F1, F2, F3, f(ε, n) and φ(ε, n)of different solvents. Table S2. Statistical Analysis of 3NPP Molecule Correlations, Slopes (m), Intercepts, Correlation Factors (r), and Number of Solvents (n). Table S3. The excitation wavelength (λexc), energy (E), oscillator strengths (fo), major contributions of HOMO-LUMO orbitals of 3NPEO molecule. Table S4: The frontier molecular orbital energies and chemical reactivity descriptors such as a chemical hardness (η), chemical potential (µ), softness (S), electronegativity (χ), and electrophilic index (ω) in eV and A. U.

Author Contributions

R.K.H.—Conducting experiment, investigation, writing—original draft; V.V.K.—Visualization, validation, writing—review and editing; D.A.Y.—Software, resources, validation and editing; N.B.G.—NLO characterization and validation, R.K.—Synthesis, validation; N.R.P.—Conceptualization, supervision, review, and editing. All authors have read and agreed to the published version of the manuscript.

Funding

This research received no external funding.

Institutional Review Board Statement

Not available.

Informed Consent Statement

Not available.

Data Availability Statement

The original contributions presented in this study are included in the article/Supplementary Materials. Further inquiries can be directed to the corresponding authors.

Conflicts of Interest

The authors declare no competing financial interests and have no potential conflicts of interest.

References

  1. Dhar, D.N. The Chemistry of Chalcones and Related Compounds; John Wiley & Sons: Hoboken, NJ, USA, 1981. [Google Scholar]
  2. da Costa, R.G.M.; de Queiroz Garcia, R.; Fiuza, R.M.D.R.; Maqueira, L.; Pazini, A.; De Boni, L.; Limberger, J. Synthesis, photophysical properties and aggregation-induced enhanced emission of bischalcone-benzothiadiazole and chalcone-benzothiadiazole hybrids. J. Lumin. 2021, 239, 118367. [Google Scholar] [CrossRef]
  3. Irfan, R.; Mousavi, S.; Alazmi, M.; Saleem, R.S.Z. A comprehensive review of amino chalcones. Molecules 2020, 25, 5381. [Google Scholar] [CrossRef]
  4. Zhuang, C.; Zhang, W.; Sheng, C.; Zhang, W.; Xing, C.; Miao, Z. Chalcone: A privileged structure in medicinal chemistry. Chem. Rev. 2017, 117, 7762–7810. [Google Scholar] [CrossRef]
  5. More, V.S.; Panchgalle, S.P.; Gayake, R.A.; Jagrut, V.B.; Kodape, M.M.; Birhade, D.R.; Lokhande, M.N.N. Synthesis, Molecular Docking, and Biological Evaluation of Some New Naphthalene-Chalcone Derivatives as Potential Anticancer Agent on MCF-7 Cell Line by MTT Assay. Asian J. Green Chem. 2024, 8, 234–246. [Google Scholar]
  6. Lee, M.S.; Koh, D.; Kim, G.S.; Lee, S.E.; Noh, H.J.; Kim, S.Y.; Lee, Y.H.; Lim, Y.; Shin, S.Y. 2-Hydroxy-3,4-naphthochalcone (2H-NC) inhibits TNFα-induced tumor invasion through the downregulation of NF-κB-mediated MMP-9 gene expression. Bioorg. Med. Chem. Lett. 2015, 25, 128–132. [Google Scholar] [CrossRef]
  7. Ali, M.K.M.; Elzupir, A.O.; Ibrahem, M.A.; Suliman, I.I.; Modwi, A.; Idriss, H.; Ibnaouf, K.H. Characterization of optical and morphological properties of chalcone thin films for optoelectronics applications. Optik 2017, 145, 529–533. [Google Scholar] [CrossRef]
  8. Sharma, V.S.; Sharma, A.S.; Agarwal, N.K.; Shah, P.A.; Shrivastav, P.S. Self-assembled blue-light emitting materials for their liquid crystalline and OLED applications: From a simple molecular design to supramolecular materials. Mol. Syst. Des. Eng. 2020, 5, 1691–1705. [Google Scholar] [CrossRef]
  9. Fayed, T.A. A novel chalcone-analogue as an optical sensor based on ground and excited states intramolecular charge transfer: A combined experimental and theoretical study. Chem. Phys. 2006, 324, 631–638. [Google Scholar] [CrossRef]
  10. Custodio, J.M.F.; Gotardo, F.; Vaz, W.F.; D’Oliveira, G.D.C.; de Almeida, L.R.; Fonseca, R.D.; Cocca, L.H.Z.; Perez, C.N.; Oliver, A.G.; de Boni, L.; et al. Benzenesulfonyl incorporated chalcones: Synthesis, structural and optical properties. J. Mol. Struct. 2020, 1208, 127845. [Google Scholar] [CrossRef]
  11. Anandkumar, D.; Ganesan, S.; Rajakumar, P.; Maruthamuthu, P. Synthesis, photophysical and electrochemical properties and DSSC applications of triphenylamine chalcone dendrimers via click chemistry. New J. Chem. 2017, 41, 11238–11249. [Google Scholar] [CrossRef]
  12. Constantinescu, T.; Mihis, A.G. Two Important Anticancer Mechanisms of Natural and Synthetic Chalcones. Int. J. Mol. Sci. 2022, 23, 11595. [Google Scholar] [CrossRef]
  13. Garg, S.; Raghav, N. Spectrophotometric Analysis of Bovine Serum Albumin in Presence of Some 1-(Naphthalen-3-Yl)- 3-Phenylprop-2-En-1-Ones. Int. J. Chem. Sci. 2013, 11, 1137–1145. [Google Scholar]
  14. Shamsunder Misra, Chalcones XIX: Potenial Germicides Derived from 2-Acetonaphthones. J. Indian Chem. Soc. 1975, 52, 1095–1096. [CrossRef]
  15. Deshpande, A.M.; Argade, N.P.; Natu, A.A.; Eckman, J. Synthesis and screening of a combinatorial library of naphthalene substituted chalcones: Inhibitors of leukotriene B41. Bioorganic Med. Chem. 1999, 7, 61237–61240. [Google Scholar] [CrossRef]
  16. Robinson, T.P.; Hubbard, R.B., 4th; Ehlers , T.J.; Arbiser , J.L.; Goldsmith , D.J.; Bowen , J.P. Synthesis and biological evaluation of aromatic enones related to curcumin. Bioorganic Med. Chem. 2005, 13, 4007–4013. [Google Scholar] [CrossRef]
  17. Lee, J.M.; Lee, M.S.; Koh, D.; Lee, Y.H.; Lim, Y.; Shin, S.Y. A new synthetic 2′-hydroxy-2,4,6-trimethoxy-5′,6′ naphthochalcone induces G2/M cell cycle arrest and apoptosis by disrupting the microtubular network of human colon cancer cells. Cancer Lett. 2014, 354, 348–354. [Google Scholar] [CrossRef]
  18. Schmitt, F.; Draut, H.; Biersack, B.; Schobert, R. Halogenated naphthochalcones and structurally related naphthopyrazolines with antitumor activity. Bioorganic Med. Chem. Lett. 2016, 26, 5168–5171. [Google Scholar] [CrossRef]
  19. Anizaim, A.H.; Zainuri, D.A.; Zaini, M.F.; Razak, I.A.; Bakhtiar, H.; Arshad, S. Comparative Analyses of New Donor-π-Acceptor Ferrocenyl-Chalcones Containing Fluoro and Methoxy-Fluoro Acceptor Units as Synthesized Dyes for Organic Solar Cell Material. PLoS ONE 2020, 15, e0241113. [Google Scholar] [CrossRef]
  20. Lan, H.; Guo, T.; Dan, F.; Li, Y.; Tang, Q. Ratiometric Fluorescence Chemodosimeter for Hydrazine in Aqueous Solution and Gas Phase Based on Quinoline-Malononitrile. Spectrochim. Acta Part A Mol. Biomol. Spectrosc. 2022, 271, 120892. [Google Scholar] [CrossRef]
  21. Kagatikar, S.; Sunil, D.; Kekuda, D.; Satyanarayana, M.N.; Kulkarni, S.D.; Sudhakar, Y.N.; Vatti, A.K.; Sadhanala, A. Pyrene-Based Chalcones as Functional Materials for Organic Electronics Application. Mater. Chem. Phys. 2023, 293, 126839. [Google Scholar] [CrossRef]
  22. Maltais, R.; Roy, J.; Poirier, D. Turning a Quinoline-Based Steroidal Anticancer Agent into Fluorescent Dye for Its Tracking by Cell Imaging. ACS. Med. Chem. Lett. 2021, 12, 822–826. [Google Scholar] [CrossRef]
  23. Praveen Kumar, C.H.; Katagi, M.S.; Nandeshwarappa, B.P. Novel Synthesis of Quinoline Chalcone Derivatives—Design, Synthesis, Characterization and Antimicrobial Activity. Chem. Data Collect. 2022, 42, 100955. [Google Scholar] [CrossRef]
  24. Sharma, S.; Singh, S. Synthetic Routes to Quinoline-Based Derivatives Having Potential Anti-Bacterial AndAnti-Fungal Properties. Curr. Org. Chem. 2022, 26, 1453–1469. [Google Scholar] [CrossRef]
  25. Kaddah, M.M.; Morsy, A.R.I.; Fahmi, A.A.; Kamel, M.M.; Elsafty, M.M.; Rizk, S.A.; Ramadan, S.K. Synthesis and Biological Activity on IBD Virus of Diverse Heterocyclic Systems Derived from 2-Cyano-N-((2-Oxo-1,2-Dihydroquinolin-3-Yl)Methylene)-Acetohydrazide. Synth. Commun. 2021, 51, 3366–3378. [Google Scholar] [CrossRef]
  26. Radini, I.A.M.; Elsheikh3, T.M.Y.; El-Telbani, E.M.; Khidre, R.E. New Potential Antimalarial Agents: Design, Synthesis and Biological Evaluation of Some Novel Quinoline Derivatives as Antimalarial Agents. Molecules 2016, 21, 909. [Google Scholar] [CrossRef]
  27. Valencia, J.; Rubio, V.; Puerto, G.; Vasquez, L.; Bernal, A.; Mora, J.R.; Cuesta, S.A.; Paz, J.L.; Insuasty, B.; Abonia, R.; et al. QSAR Studies, Molecular Docking, Molecular Dynamics, Synthesis, and Biological Evaluation of Novel Quinolinone-Based Thiosemicarbazones against Mycobacterium Tuberculosis. Antibiotics 2023, 12, 61. [Google Scholar] [CrossRef]
  28. Bacci, A.; Corsi, F.; Runfola, M.; Sestito, S.; Piano, I.; Manera, C.; Saccomanni, G.; Gargini, C.; Rapposelli, S. Design, Synthesis, and In Vitro Evaluation of Novel 8-Amino-Quinoline Combined with Natural Antioxidant Acids. Pharmaceuticals 2022, 15, 688. [Google Scholar] [CrossRef] [PubMed]
  29. Mohamed, M.F.A.; Abuo-Rahma, G.E.A. Molecular Targets and Anticancer Activity of Quinoline–Chalcone Hybrids: Literature Review. RSC Adv. 2020, 10, 31139–31155. [Google Scholar] [CrossRef]
  30. Kivshar, Y.S. Nonlinear optics: The next decade. Opt. Exp. 2008, 16, 22126. [Google Scholar] [CrossRef] [PubMed]
  31. Custodio, J.M.F.; D’Oliveira, G.D.C.; Gotardo, F.; Cocca, L.H.Z.; Boni, L.D.; Perez, C.N.; Maia, L.J.Q.; Valverde, C.; Osório, F.A.P.; Napolitano, H.B. Chalcone as Potential Nonlinear Optical Material: A Combined Theoretical, Structural, and Spectroscopic Study. J. Phys. Chem. C 2019, 123, 5931–5941. [Google Scholar] [CrossRef]
  32. Prasad, P.N.; Williams, D.J. Introduction to Nonlinear Optical Effects in Organic Molecules and Polymers; Wiley: New York, NY, USA, 1991. [Google Scholar]
  33. Sutherland, R.L. Hand book of Nonlinear Optics, 2nd ed.; Marcel Dekker Inc.: New York, NY, USA, 2003. [Google Scholar]
  34. Baig, H.; Iqbal, A.; Rasool, A.; Hussain, S.Z.; Iqbal, J.; Alazmi, M.; Alshammari, N.; Alazmi, A.; AlGhadhban, A.; Abdel Sulieman, M.E.; et al. Synthesis and Photophysical, Electrochemical, and DFT Studies of Piperidyl and Pyrrolidinyl Chalcones. ACS Omega 2023, 8, 28499–28510. [Google Scholar] [CrossRef]
  35. Insuasty, D.; Mutis, M.; Trilleras, J.; Illicachi, L.A.; Rodríguez, J.D.; Ramos-Hernández, A.; San-Juan-Vergara, H.G.; Cadena-Cruz, C.; Mora, J.R.; Paz, J.L.; et al. Synthesis, Photophysical Properties, Theoretical Studies, and Living Cancer Cell Imaging Applications of New 7-(Diethylamino)quinolone Chalcones. ACS Omega 2024, 9, 18786–18800. [Google Scholar] [CrossRef]
  36. Gomes, M.N.; Muratov, E.N.; Pereira, M.; Peixoto, J.C.; Rosseto, L.P.; Cravo, P.V.L.; Andrade, B.J. Neves, Chalcone Derivatives: Promising Starting Points for Drug Design. Molecules 2017, 22, 1210. [Google Scholar] [CrossRef] [PubMed]
  37. Chiaradia, L.D.; Mascarello, A.; Purificação, M.; Vernal, J.; Sechini Cordeiro, M.N.; Zenteno, M.E.; Villarino, A.; Nunes, R.J.; Yunes, R.A.; Terenzi, H. Synthetic chalcones as efficient inhibitors of Mycobacterium tuberculosis protein tyrosine phosphatase PtpA. Bioorganic Med. Chem. Lett. 2008, 23, 6227–6230. [Google Scholar] [CrossRef]
  38. Damazio, R.G.; Zanatta, A.P.; Cazarolli, L.H.; Chiaradia, L.D.; Mascarello, A.; Nunes, R.J.; Yunes, R.A.; Barreto Silva, F.R.M. Antihyperglycemic activity of naphthylchalcones. Eur. J. Med. Chem. 2010, 4, 1332–1337. [Google Scholar] [CrossRef]
  39. Kusanur, R.A.; Kulkarni, M.V. A Novel Route for the Synthesis of Recemic 4-(Coumaryl) Alanines and Their Antimicrobial Activity. Asian J. Chem. 2014, 26, 1077. [Google Scholar] [CrossRef]
  40. Kusanur, R.; Ghate, M.; Kulkarni, M. Synthesis and biological activities of some substituted 4-{4-(1, 5-diphenyl-1H-pyrazol-3-yl) phenoxymethyl} coumarins. Indian J. Heterocycl. Chem. 2004, 13, 201–204. [Google Scholar]
  41. Patagar, D.; Uttarkar, A.; Patra, S.M.; Patil, J.H.; Kusanur, R.; Niranjan, V.; Ashok Kumar, H.G. Spiro benzodiazepine substituted fluorocoumarins as potent anti-anxiety agents. Russ. J. Bioorganic Chem. 2021, 47, 390–398. [Google Scholar] [CrossRef]
  42. Sheik-Bahae, M.; Said, A.A.; Wei, T.H.; Hagan, D.J.; Van Stryland, E.W. Sensitive measurement of optical nonlinearities using a single beam. IEEE J. Quantum Electron. 1990, 26, 760–769. [Google Scholar] [CrossRef]
  43. Sheik Bahae, M.; Hutchings, D.C.; Hagan, D.J.; Van Stryland, E.W. Dispersion of bound electronic nonlinear refraction in solids. IEEE J. Quantum Electron. 1991, 27, 1296–1309. [Google Scholar] [CrossRef]
  44. Frisch, M.J.; Trucks, G.W.; Schlegel, H.B.; Scuseria, G.E.; Robb, M.A.; Cheeseman, J.R.; Scalmani, G.; Barone, V.; Petersson, G.A.; Nakatsuji, H.; et al. Gaussian 16, Revision C.01; Gaussian Inc.: Wallingford, CT, USA, 2016.
  45. Dennington, R.; Keith, T.A.; Millam, J.M. GaussView 6.0.16, Semichem Inc.: Shawnee Mission, KS, USA, 2016.
  46. Zarezade, V.; Abolghasemi, M.; Rahim, F.; Veisi, A.; Behbahani, M. In silico assessment of new progesterone receptor inhibitors using molecular dynamics: A new insight into breast cancer treatment. J. Mol. Model. 2018, 24, 337. [Google Scholar] [CrossRef]
  47. Eswar, N.; Webb, B.; Marti-Renom, M.A.; Madhusudhan, M.S.; Eramian, D.; Shen, M.; Pieper, U.; Sali, A. Comparative Protein Structure Modeling Using Modeller. Curr. Protoc. Bioinform. 2006, 54, 5–6. [Google Scholar] [CrossRef]
  48. Ahmad, M.; Bauer, W.; Katz, S. Ulcerative colitis, hyperamylasemia, and asymptomatic pancreatic calcifications: Making the case for pancreatitis as an extra luminal manifestation. Am. J. Gastroenterol. 1997, 92, 2307–2309. [Google Scholar] [PubMed]
  49. Malde, A.K.; Zuo, L.; Breeze, M.; Stroet, M.; Poger, D.; Nair, P.C.; Oostenbrink, C.; Mark, A.E. An Automated Force Field Topology Builder (ATB) and Repository: Version 1.0. J. Chem. Theory Comput. 2011, 7, 4026–4037. [Google Scholar] [CrossRef] [PubMed]
  50. Anandakrishnan, R.; Aguilar, B.; Onufriev, A.V. H++ 3.0: Automating pK prediction and the preparation of biomolecular structures for atomistic molecular modeling and simulations. Nucleic Acids Res. 2012, 40, W537–W541. [Google Scholar] [CrossRef]
  51. Mark, P.; Nilsson, L. Structure and Dynamics of the TIP3P, SPC, and SPC/E Water Models at 298 K. J. Phys. Chem. A 2001, 105, 9954–9960. [Google Scholar] [CrossRef]
  52. Tuble, S.C.; Anwar, J.; Gale, J.D. An Approach to Developing a Force Field for Molecular Simulation of Martensitic Phase Transitions between Phases with Subtle Differences in Energy and Structure. J. Am. Chem. Soc. 2004, 126, 396–405. [Google Scholar] [CrossRef] [PubMed]
  53. Darden, T.; York, D.; Pedersen, L. Particle mesh Ewald: An N log(N) method for Ewald sums in large systems. J. Chem. Phys. 1993, 98, 10089–10092. [Google Scholar] [CrossRef]
  54. Hess, B.; Bekker, H.; Berendsen, H.J.C.; Fraaije, J.G.E.M. LINCS: A linear constraint solver for molecular simulations. J. Comput. Chem. 1997, 18, 1463–1472. [Google Scholar] [CrossRef]
  55. Miller, B.R.; McGee, T.D.; Swails, J.M.; Homeyer, N.; Gohlke, H.; Roitberg, A.E. MMPBSA.py: An Efficient Program for End-State Free Energy Calculations. J. Chem. Theory Comput. 2012, 8, 3314–3321. [Google Scholar] [CrossRef]
  56. Kumari, R.; Kumar, R.; Open Source Drug Discovery Consortium; Lynn, A. g_mmpbsa—A GROMACS Tool for High-Throughput MM-PBSA Calculations. J. Chem. Inf. Model. 2014, 54, 1951–1962. [Google Scholar] [CrossRef]
  57. Gummagol, N.B.; Yaraguppi, D.A.; Patil, S.B.; Patil, P.S.; Patil, N.R.; Ayachit, N.H. Exploring the anticancer potential of novel chalcone derivatives: Synthesis, characterization, computational analysis, and biological evaluation against breast cancer. J. Mol. Struct. 2025, 1320, 139586. [Google Scholar] [CrossRef]
  58. Al-Rubaye, H.I.; Abbas, Z.M.; Jinzeel, N.A.; Askar, F.W. Synthesis and Preliminary Biological study of New Chalcone Derivatives Containing Isoxazoline Moiety. J. Kufa Chem. Sci. 2024, 3, 304–319. [Google Scholar] [CrossRef]
  59. El-Naggar, M.; Rashdan, H.R.M.; Abdelmonsef, A.H. Cyclization of Chalcone Derivatives:Design, Synthesis, InSilico Docking Study, and Biological Evaluation of New Quinazolin-2,4 diones Incorporating Five-,Six-,and Seven-Membered Ring Moieties as Potent Antibacterial Inhibitors. ACS Omega 2023, 8, 27216–27230. [Google Scholar] [CrossRef]
  60. Siddique, I.M. Exploring Functional Groups and Molecular Structures: A Comprehensive Analysis using FTIR Spectroscopy. Chem. Res. J. 2024, 9, 70–76. [Google Scholar] [CrossRef]
  61. Muddapur, G.V.; Patil, N.R.; Patil, S.S.; Melavanki, R.M.; Kusanur, R.A. Estimation of Ground and Excited State Dipole Moments of aryl Boronic acid Derivative by Solvatochromic Shift Method. J. Fluoresc. 2014, 24, 1651–165949. [Google Scholar] [CrossRef]
  62. Patil, S.S.; Muddapur, G.V.; Patil, N.R.; Melavanki, R.M.; Kusanur, R.A. Fluorescence characteristics of aryl boronic acid derivative (PBA). Pectrochimica Acta Part A Mol. Biomol. Spectrosc. 2015, 138, 85–91. [Google Scholar] [CrossRef] [PubMed]
  63. Muddapur, G.V.; Melavanki, R.M.; Patil, P.G.; Nagaraja, D.; Patil, N.R. Photophysical properties of 3MPBA: Evaluation and co-relation between solvatochromism and quantum yield in different solvents. J. Mol. Liq. 2016, 224, 201–210. [Google Scholar] [CrossRef]
  64. Muddapur, G.V.; Melavanki, R.M.; Sharma, K.; Srinivasa, H.T.; Thipperudrappa, J. Fluorescence properties of aromatic asymmetric di-ketone compound in polar and non-polar solvents. J. Phys. Conf. Ser. 2020, 1473, 012044. [Google Scholar] [CrossRef]
  65. Melavanki, R.M.; Muddapur, G.V.; Srinivasa, H.T.; Honnanagoudar, S.S.; Patil, N.R. Solvation, rotational dynamics, photophysical properties study of aromatic asymmetric di-ketones: An experimental and theoretical approach. J. Mol. Liq. 2021, 337, 116456. [Google Scholar] [CrossRef]
  66. Wangngae, S.; Chansaenpak, K.; Nootem, J.; Ngivprom, U.; Aryamueang, S.; Lai, R.; Kamkaew, A. Photophysical Study and Biological Applications of Synthetic Chalcone-Based Fluorescent Dyes. Molecules 2021, 26, 2979. [Google Scholar] [CrossRef]
  67. Baig, H.; Irfan, R.; Rasool, A.; Hussain, S.Z.; Siddique, S.A.; Iqbal, J.; Alazmi, M.; Alshammari, N.; Alazmi, A.; AlGhadhban, A.; et al. Synthesis, photophysical, voltammetric, and DFT studies of 4-aminochalones. J. Photochem. Photobiol. A Chem. 2023, 442, 114790. [Google Scholar] [CrossRef]
  68. Sachdeva, T.; Milton, M.D. AIEE active novel red-emitting D-π-A phenothiazine chalcones displaying large Stokes shift, solvatochromism and “turn-on” reversible mechano fluorochromism. Dye. Pigment. 2020, 181, 108539. [Google Scholar] [CrossRef]
  69. Wang, S.; Li, B.; Zhang, F. Molecular Fluorophores for Deep-Tissue Bioimaging. ACS Cent. Sci. 2020, 6, 1302–1316. [Google Scholar] [CrossRef]
  70. Bilot, L.; Kawski, A. Der Einfluß des Lösungsmittels auf die Elektronenspektren lumineszierender Moleküle. Z. Für Naturforschung A 1963, 18, 10–15. [Google Scholar] [CrossRef]
  71. Lippert, E. Spektroskopische Bestimmung des Dipolmomentes aromatischer Verbindungen im ersten angeregten Singulettzustand. Z. Elektrochem. Berichte Bunsenges. Phys. Chem. 1955, 10, 541. [Google Scholar] [CrossRef]
  72. Bakshiev, N.G. Universal Intermolecular Interactions and Their Effect on the Position of the Electronic Spectra of Molecules in Two-Component Solutions. VII. Theory (General Case of an Isotropic Solution). Opt. Spektrosk. 1964, 16, 821. [Google Scholar]
  73. Chamma, A.; Viallet, P. Determination du moment dipolaire d’une molecule dans un etat excite singulet. CR Acad. Sci. Paris. Ser. C 1970, 270, 1901–1904. [Google Scholar]
  74. Reichardt, C. Solvatochromic dyes as solvent polarity indicators. Chem. Rev. 1994, 94, 2319–2358. [Google Scholar] [CrossRef]
  75. Patil, N.R.; Melavanki, R.M.; Kapatkar, S.B.; Ayachit, N.H.; Saravanan, J. Solvent Effect on Absorption and Fluorescence Spectra of Three Biologically Active Carboxamides (C1, C2 and C3). Estimation of Ground and Excited State Dipole Moment from Solvatochromic Method Using Solvent Polarity Parameters. J. Fluoresce. 2011, 21, 1213–1222. [Google Scholar] [CrossRef]
  76. Melavanki, R.M.; Patil, N.R.; Kapatkar, S.B.; Ayachit, N.H.; Umapathy, S.; Thipperudrappa, J.; Nataraju, A.R. Solvent effect on the spectroscopic properties of 6MAMC and 7MAMC. J. Mol. Liq. 2011, 158, 105–110. [Google Scholar] [CrossRef]
  77. Mallik, T.; Banerjee, D. Solvation and Solvatochromism: An Overview. Indian J. Chem. 2022, 61, 472–481. [Google Scholar] [CrossRef]
  78. Bhavya, P.; Melavanki, R.M.; Manjunatha, M.N.; Koppal, V.V.; Patil, N.R.; Muttannavar, V.T. Solvent Effects on the Photophysical Properties of Coumarin Dye. AIP Conf. Proc. 2018, 1953, 080022. [Google Scholar] [CrossRef]
  79. Gaur, A.; Gaur, P.; Sharma, D.; Sharma, D.K.; Singh, N.; Malik, B.P. Study of transmittance dependence closed-aperture Z-scan curves in the materials with nonlinear refraction and strong absorption. Optik 2012, 123, 1583–1587. [Google Scholar] [CrossRef]
  80. Yan, X.Q.; Liu, Z.B.; Zhang, X.L.; Zhou, W.Y.; Tian, J.G. Polarization dependence of Z-scan measurement: Theory and experiment. Opt Express 2009, 17, 6397–6406. [Google Scholar] [CrossRef]
  81. Amore, F.D.; Osmond, J.; Destri, S.; Pasini, M.; Rossi, V.; Porzio, W. Effects of backbone modification on the linear and third order nonlinear optical properties in fluorene-based copolymers. Synth. Met. 2005, 149, 123–127. [Google Scholar]
  82. Koppal, V.V.; Muddapur, G.V.; Patil, N.R.; Melavanki, R.M. Spectroscopic studies of biologically active coumarin laser dye: Evaluation of dipole moments by solvatochromic shift method. AIP Conf. Proc. 2016, 1728, 020411. [Google Scholar] [CrossRef]
  83. Vasu, K.K.; Ingawale, H.D.; Sagar, S.R.; Sharma, J.A.; Pandya, D.H.; Agarwal, M. 2-((1H-1,2,3-triazol-1-yl) methyl)-3-phenylquinazolin-4(3H)-ones: Design, Synthesis and Evaluation as Anti-cancer Agents. Curr. Bioact. Compd. 2018, 14, 254–263. [Google Scholar] [CrossRef]
  84. Kiran, A.J.; Udayakumar, D.; Chandrashekaran, K.; Adhikari, A.V.; Shashikala, H.D. Z-Scan and degenerate four wave mixing studies on newly synthesized copolymers containing alternating substituted thiophene and 1,3,4-oxadiazole units. J. Phys. B 2006, 39, 3747–3756. [Google Scholar] [CrossRef]
  85. Ekbote, A.; Patil, P.S.; Maidur, S.R.; Chia, T.S.; Quah, C.K. Structural, third-order optical nonlinearities and figures of merit (E)-1-(3-substituted phenyl)-3-(4-fluorophenyl) prop2-en-1-one under CW regime: New Chalcone derivatives for optical limiting applications. Dye. Pigment. 2017, 139, 720–729. [Google Scholar] [CrossRef]
  86. Klus, S.; Nüske, F.; Peitz, S. Koopman analysis of quantum systems. J. Phys. A Math. Theor. 2022, 55, 314002. [Google Scholar] [CrossRef]
  87. Murray, J.S.; Sen, K. Molecular Electrostatic Potentials: Concepts and Applications. In Theoretical and Computational Chemistry; Elsevier Science: Amsterdam, The Netherlands, 1996; Volume 3, pp. 1–665. [Google Scholar]
  88. Scrocco, E.; Tomasi, J. Electronic Molecular structure, Reactivity and Intermolecular Forces: An Heuristic interpretation by means of Electronic Molecular Potentials. In Advances in Quantum Chemistry; Lowdin, P., Ed.; Academic Press: New York, NY, USA, 1978; Volume 2, p. 115. [Google Scholar]
  89. Nanjundaswamy, S.; Hema, M.K.; Karthik, C.S.; Rajabathar, J.R.; Arokiyaraj, S.; Lokanath, N.K.; Mallu, P. Synthesis, crystal structure, in-silico ADMET, molecular docking and dynamics simulation studies of thiophene-chalcone analogues. J. Mol. Struct. 2022, 1247, 131365. [Google Scholar] [CrossRef]
  90. Thillainayagam, M.; Malathi, K.; Ramaiah, S. In-Silico molecular docking and simulation studies on novel chalcone and flavone hybrid derivatives with 1, 2, 3-triazole linkage as vital inhibitors of Plasmodium falciparum dihydroorotate dehydrogenase. J. Biomol. Struct. Dyn. 2018, 36, 3993–4009. [Google Scholar] [CrossRef]
  91. Pistritto, G.; Trisciuoglio, D.; Ceci, C.; Garufi, A.; D’Orazi, G. Apoptosis as anticancer mechanism: Function and dysfunction of its modulators and targeted therapeutic strategies. Aging 2016, 8, 603–619. [Google Scholar] [CrossRef] [PubMed]
  92. Thillainayagam, M.; Malathi, K.; Anbarasu, A.; Singh, H.; Bahadur, R.; Ramaiah, S. Insights on inhibition of Plasmodium falciparum plasmepsin I by novel epoxyazadiradione derivatives—Molecular docking and comparative molecular field analysis. J. Biomol. Struct. Dyn. 2019, 37, 3168–3182. [Google Scholar] [CrossRef]
  93. Abdullahi, S.H.; Uzairu, A.; Shallangwa, G.A.; Uba, S.; Umar, A.B. In-silico activity prediction, structure-based drug design, molecular docking and pharmacokinetic studies of selected quinazoline derivatives for their antiproliferative activity against triple negative breast cancer (MDA-MB231) cell line. Bull. Natl. Res. Cent. 2022, 46, 2. [Google Scholar] [CrossRef]
  94. Darzynkiewicz, Z.; Bedner, E.; Smolewski, P. Flow cytometry in analysis of cell cycle and apoptosis. Semin. Hematol. 2001, 38, 179–193. [Google Scholar] [CrossRef]
Figure 1. The molecular structure of 3NPEO.
Photochem 05 00020 g001
Figure 2. (a) Experimental and (b) simulated FT-IR spectra of 3NPEO.
Photochem 05 00020 g002
Figure 3. (a) Normalized absorption and (b) emission spectra of 3NPEO in different solvents.
Photochem 05 00020 g003
Figure 4. (a) The absorption spectrum of tryptophan in water and (b) emission spectra of 3NPEO in isopropanol (c) decay profile of 3NPEO in isopropanol.
Photochem 05 00020 g004
Figure 5. (a) Open aperture and (b) closed aperture Z-scan curve of 3NPEO.
Photochem 05 00020 g005
Figure 6. Optical limiting curve of 3NPEO.
Photochem 05 00020 g006
Figure 7. (a) Cyclic voltammograms of 3NPEO in acetonitrile (b) HOMO-LUMO Energy gap diagram of 3NPEO.
Photochem 05 00020 g007
Figure 8. Optimized geometrical structure of 3NPEO.
Photochem 05 00020 g008
Figure 9. (a) Optimized geometry in ground state (b) Optimized geometry in excited state of 3NPEO. The arrow mark represents the direction of the dipole moment.
Photochem 05 00020 g009
Figure 10. HOMO-LUMO and the band gap of 3NPEO.
Photochem 05 00020 g010
Figure 11. The molecular electrostatic potential map of 3NPEO.
Photochem 05 00020 g011
Figure 12. The docked pose generated through molecular docking of 3NPEO.
Photochem 05 00020 g012
Figure 13. (a) The Root Mean Square Deviation trend plot for 4OAR-APO and 4OAR-3NPEO is indicated in the main plot of A. The subplot represents the violin plot of the data; (b) indicates the hydrogen bond plot between the protein and the ligand.
Photochem 05 00020 g013
Figure 14. The fluctuation observed in the helix loop helix region, or the region termed E (residues ranging from 895 to 920), for the systems. 4OAR-APO is displayed on the left and 4OAR-3NPEO on the right, while the residue region is highlighted in red. Outward movement of the residue region is observed for 4OAR-APO and inward for 4OAR-3NPEO.
Photochem 05 00020 g014
Figure 15. The KDE plot for the Rg and SASA values of the systems’ dynamics.
Photochem 05 00020 g015
Figure 16. The Free Energy Landscape (FEL) plot for radius of gyration and Root Mean Square Deviation data. The 3D plot is color coded on a yellow to blue color scale, with the lowest energy coded with dark blue, while the highest energy is coded with yellow.
Photochem 05 00020 g016
Figure 17. The total energy calculated for the two systems. A stable trend is observed for both systems, indicating that the systems are stable throughout the trajectory.
Photochem 05 00020 g017
Figure 18. (a) and (b) cytotoxicity activity of 3NPEO-one against breast cancer cell line MDAMB-231. (c) Cell viability percentage and 3NPEO-treated cancerous cells.
Photochem 05 00020 g018
Figure 19. Detection of early and late apoptosis induced by the synthesized compound in MDAMB-231 cell lines.
Photochem 05 00020 g019
Table 1. FT-IR band assignments of the 3NPEO compound.
BandsAssignmentsWavenumber (cm−1)
ExperimentalCalculated
C-Hstretching3045, 33023196
C=Ostretching16551676
C=Cstretching15801572
C-Cstretching15211420
H–C-Hasymmetric bending13441340
H–C-Hsymmetric bending13021252
C–C-Hin-p-bend12181220
C–C-Ho-o-p bend1082, 1028, 1001, 964, 8511052, 892, 820, 724
Table 2. Solvatochromic data of 3NPEO.
Sl. No.Solventsλa
(nm)
λf
(nm)
ν ¯ a
(cm−1)
ν ¯ f
(cm−1)
( ν ¯ a   ν ¯ f )
(cm−1)
( ν ¯ a +   ν ¯ f )  
(cm−1)
ν ¯ a +   ν ¯ f 2
(cm−1)
1Pentane320.00375.0031,250.0026,666.674583.3357,916.6728,958.33
2Hexane320.00376.6031,250.0026,553.374696.6357,803.3728,901.69
3Heptane325.00382.0030,769.2326,178.014591.2256,947.2428,473.62
4Cyclohexane331.90390.0030,129.5625,641.034488.5355,770.5827,885.29
51,4-Dioxane332.00392.0030,120.4825,510.204610.2855,630.6927,815.34
6Toluene335.20396.0029,832.9425,252.534580.4155,085.4627,542.73
7TCE338.00402.0029,585.8024,875.624710.1854,461.4227,230.71
8DEE341.70410.0029,265.4424,390.244875.1953,655.6826,827.84
9DCE343.00415.0029,154.5224,096.395058.1353,250.9026,625.45
10EA344.90418.0028,993.9123,923.445070.4752,917.3626,458.68
11THF348.00423.0028,735.6323,640.665094.9752,376.2926,188.15
12Acetonitrile351.30428.0028,465.7023,364.495101.2151,830.1825,915.09
13DMF352.00430.0028,409.0923,255.815153.2851,664.9025,832.45
14DMSO355.00435.0028,169.0122,988.515180.5151,157.5225,578.76
15Water360.00441.0027,777.7822,675.745102.0450,453.5125,226.76
16Decanol362.00445.0027,624.3122,471.915152.4050,096.2225,048.11
17Octanol363.00446.0027,548.2122,421.525126.6849,969.7324,984.87
18Pentanol364.00448.0027,472.5322,321.435151.1049,793.9624,896.98
19Butanol367.00452.0027,247.9622,123.895124.0649,371.8524,685.93
20Isopropanol368.00455.0027,173.9121,978.025195.8949,151.9424,575.97
21Ethanol369.00458.0027,100.2721,834.065266.2148,934.3324,467.17
22Methanol370.00462.0027,027.0321,645.025382.0148,672.0524,336.02
Table 3. A comparative analysis of ground and excited-state dipole moments of 3NPEO.
Radius
‘r’ (Ao)
μ g a
D
μ e b
D
μ g c
D
μ e d
D
μ g e
D
μ e f
D
μ e g
D
μ e h
D
μ e i
D
μ e j
D
μ   k
D
μ   l
D
μ e d μ e b m ϕ   n
3.893.515.7210.7412.881.192.4714.4112.9118.0713.082.141.291.2000
Debye D = 3.33564 × 10⁻³⁰ cm = 10−18 esu cm; a and b The ground state and excited state dipole moment calculated using Gaussian 16 software. c and d The ground state dipole moment calculated from Bilot-Kawaski Equations (5) and (6), respectively.; e The ground state dipole moment calculated using Equation (S18); f The excited state dipole moment calculated using Equation (S19); g The experimental excited state dipole moment calculated from Lippert’s Equation (S14); h The experimental excited state dipole moment calculated from Bakshiev Equation (S15); i The experimental excited state dipole moments calculated from Kawaski–Chamma–Viallet Equation (S16); j The excited state dipole moments calculated from E T N Equation (S22); k The change in dipole moments for μe and μg; l The change in dipole moment calculated using Equation (S20); m The ratio of change in dipole moment; n The angle between ground state dipole moment and excited state dipole moment. Note: all the equation numbers mentioned here are given in Supplementary Document S1.
Table 4. Physicochemical parameters and photophysical characteristics of 3NPEO in various solvents.
Sl. No.SolventsNODFintΦτ0
(ns)
Kr 109
(S−1)
Knr 109
(S−1)
1Hexane1.3750.240156,847.120.5781.3200.4380.320
2Heptane1.3880.34246,816.2130.1231.6300.0760.538
3Cyclohexane1.4260.118113,862.1150.9171.2840.7140.064
4Pentanol1.4090.12223,826.1050.1811.5750.1150.520
5Butanol1.3990.12249,067.25950.3681.4580.2520.433
6Iso-Propanol1.3780.11984,261.5000.6291.7290.3640.215
7Ethanol1.3610.239109,265.0550.3961.5910.2490.380
8Methanol1.3280.118109,265.0550.7632.0450.3730.116
9Acetonitrile1.3440.14047,916.1380.2891.8400.1570.386
10DMSO1.4790.558304,283.8650.5581.9640.2840.225
Note: (OD)s = 0.160, (Fint)s = 20,435.159.
Table 5. The third order nonlinear optical parameters of 3NPEO.
Moleculeα0
(cm−1)
β
(cm W−1)
× 10−5
n2
(cm2 W−1)
× 10−9
Re χ(3)
(e.s.u)
× 10−6
Im χ(3)
(e.s.u)
× 10−6
χ(3)
(e.s.u)
× 10−6
γh
(e.s.u)
× 10−26
OL
kJ/cm2
W
× 103
T
3NPEO4.521.82−0.620.840.440.940.394.0649.40.15
Table 6. HOMO, LUMO, and Band Gap of 3NPEO estimated Theoretically and CV Investigation.
CompoundHOMO (eV)LUMO (eV)E0−0λonset
Theor.Expl.Theor.Expl.Theor.Expl.Ao
3NPEO−6.225−4.849−2.488−1.4983.7373.351370
Table 7. The summary table for the individual energy term contribution toward the binding energy for 4OAR-3NPEO.
Energy TermEnergy in kJ/mol
van der Waal energy−166.204 +/− 12.377
Electrostatic energy−25.227 +/− 7.903
Polar solvation energy83.791 +/− 5.629
SASA energy−18.248 +/− 0.662
Binding energy−125.888 +/− 11.935
Table 8. Tabulation of early and late apoptosis by the synthesized compound in MDAMB-231 cell lines.
Treatments and Cell LineEarly ApoptosisLate ApoptosisTotal Apoptosis
3NPEO-(MDAMB-231)20.803.1023.90
Disclaimer/Publisher’s Note: The statements, opinions and data contained in all publications are solely those of the individual author(s) and contributor(s) and not of MDPI and/or the editor(s). MDPI and/or the editor(s) disclaim responsibility for any injury to people or property resulting from any ideas, methods, instructions or products referred to in the content.

